3.1. Fundamental Thermal and Spectroscopic Analysis
In order to examine the heating sensitivity of the films more accurately in the following sections, the thermal characteristics of SMA copolymers were first evaluated by DSC measurements. The thermographs for various SMA grades with different amount of MA (
i.e., SMA-1, -4, -5, -6) and different molecular weight (
i.e., SMA-1, -2, -3) are shown in
Figure 1, representing the glass transition interval in the second heating cycle. A summary of the glass transition temperatures
Tg together with onset and end temperatures of the transition interval is given in
Table 2. The temperature
Tg mainly depends on the amount of MA and increases from 147.5 to 175.8 °C with higher amount of MA (22 to 34 mol %) in the order of SMA-4, -1, -5, -6. Otherwise, the temperature
Tg is less dependent on the molecular weight (80,000 to 180,000 g/mol) and remains constant at around 158.34 ± 0.15 °C by comparing SMA-1, -2, -3. In parallel, the SMA-1 that was dissolved in acetone and dried as a free-standing film has a slightly higher
Tg = 159.74 ± 0.20 °C than the bulk SMA-1. Similar trends were observed for other SMA grades, with a maximum
Tg = 178.15 ± 0.25 °C for a SMA-6 cast film. In general, solvents could lead to plasticization or residual amounts retained in the polymer film after casting, both lowering
Tg [
52]. However, the slight augmentation of
Tg after solvent casting rather suggests a constraint mobility of chain segments in the amorphous phase caused by additional interactions [
53]. The differences in
Tg for dried films can be explained on the basis of the thermodynamic polymer chain interactions in solution,
i.e., the physical properties of a solution-cast polymer film may be affected by the conformation of the polymer chain in the solvent. The thermo-analytical data confirm that the SMA molecules likely interact in the solvent and form self-assembled structures that are transferred into the dried film.
Figure 1.
DSC curves for SMA copolymers, indicating the glass transition temperatures Tg, (a) different SMA grades in pulverized pellet form; and (b) SMA-1 grade in pulverized pellet form and as acetone film after air drying.
Figure 1.
DSC curves for SMA copolymers, indicating the glass transition temperatures Tg, (a) different SMA grades in pulverized pellet form; and (b) SMA-1 grade in pulverized pellet form and as acetone film after air drying.
The FT-Raman spectra of SMA copolymers were first measured in an acetone solution as shown in
Figure 2, e.g., for SMA-1 with concentrations of 5 and 10 mg/mL. Compared with the spectra of pure acetone, there is an upwards shift in the peak positions from 786.8 to 788.8 cm
−1 and a downwards shift in the peak positions from 1710.1 to 1706.8 cm
−1 for the SMA/acetone solutions (see insets
Figure 2). The variations in band positions indicate that the interactions between the polymer and the solvent are located near the C–H (788 cm
−1, stretching of acetone) and C=O (1710 cm
−1, stretching mode) functional groups of the SMA [
54] and the acetone [
55]: the molecules of acetone and SMA can aggregate to form dimers with hydrogen bonds around C=O (1710 cm
−1), between the oxygen atom of one molecule and the hydrogen atoms of a CH/CH
3-group of another molecule. The variations in C–H stretching bands of the acetone (788 cm
−1) likely relate to the occurrence of acetone solvating molecules around the SMA.
Table 2.
Summary of data from DSC curves of different SMA grades: characteristic temperatures for the glass transition interval.
Table 2.
Summary of data from DSC curves of different SMA grades: characteristic temperatures for the glass transition interval.
| SMA grade | Tonset
[°C] | Tg
[°C] | Tend
[°C] | ΔT
[°C] |
|---|
| SMA-1 | 153.43 | 158.19 | 159.20 | 5.77 |
| SMA-2 | 155.02 | 158.32 | 160.12 | 5.10 |
| SMA-3 | 154.59 | 158.52 | 159.35 | 4.76 |
| SMA-4 | 144.08 | 147.53 | 148.81 | 4.73 |
| SMA-5 | 156.74 | 160.34 | 161.87 | 5.13 |
| SMA-6 | 172.30 | 175.81 | 178.85 | 6.55 |
Figure 2.
Raman spectra of stock solutions of SMA-1 in acetone solvent used for film casting, (i) pure acetone; (ii) acetone + SMA (5 mg/mL), (iii) acetone + SMA (10 mg/mL); and (iv) SMA pellets.
Figure 2.
Raman spectra of stock solutions of SMA-1 in acetone solvent used for film casting, (i) pure acetone; (ii) acetone + SMA (5 mg/mL), (iii) acetone + SMA (10 mg/mL); and (iv) SMA pellets.
After casting a film from acetone solution and heating for 1 h at 120 °C, the Raman spectra were evaluated again as illustrated in
Figure 3. It can be concluded that the films do not contain residual solvent as the absorption peaks of acetone disappeared from the Raman spectra. After one day air-drying, the spectra of SMA films and pellets are different: the lower intensity of the 1857 cm
−1 band for the acetone film indicates that the anhydride groups in the SMA films have been partly converted by a ring-opening reaction, forming carboxylic groups. These ring-opened groups might induce additional molecular interactions as also expressed by the small intensities of additional Raman bands at 667 and 366 cm
−1. After heating the film, the spectra of the films become similar to the original SMA pellets. The ring-opened anhydride moieties are restored after heating of the acetone-cast films at temperatures above 120 °C. The above analysis was repeated for several SMA grades, and all observations lead to likewise conclusions.
Figure 3.
Raman spectra of SMA-1 films cast from acetone solution, (i) initial SMA pellets; (ii) SMA-1 film cast from acetone after one day air-drying; and (iii) SMA-1 film cast from acetone after heating for 1 h at 120 °C. Arrows refer to variations described in text.
Figure 3.
Raman spectra of SMA-1 films cast from acetone solution, (i) initial SMA pellets; (ii) SMA-1 film cast from acetone after one day air-drying; and (iii) SMA-1 film cast from acetone after heating for 1 h at 120 °C. Arrows refer to variations described in text.
3.2. Characteristics of the Acetone Solutions
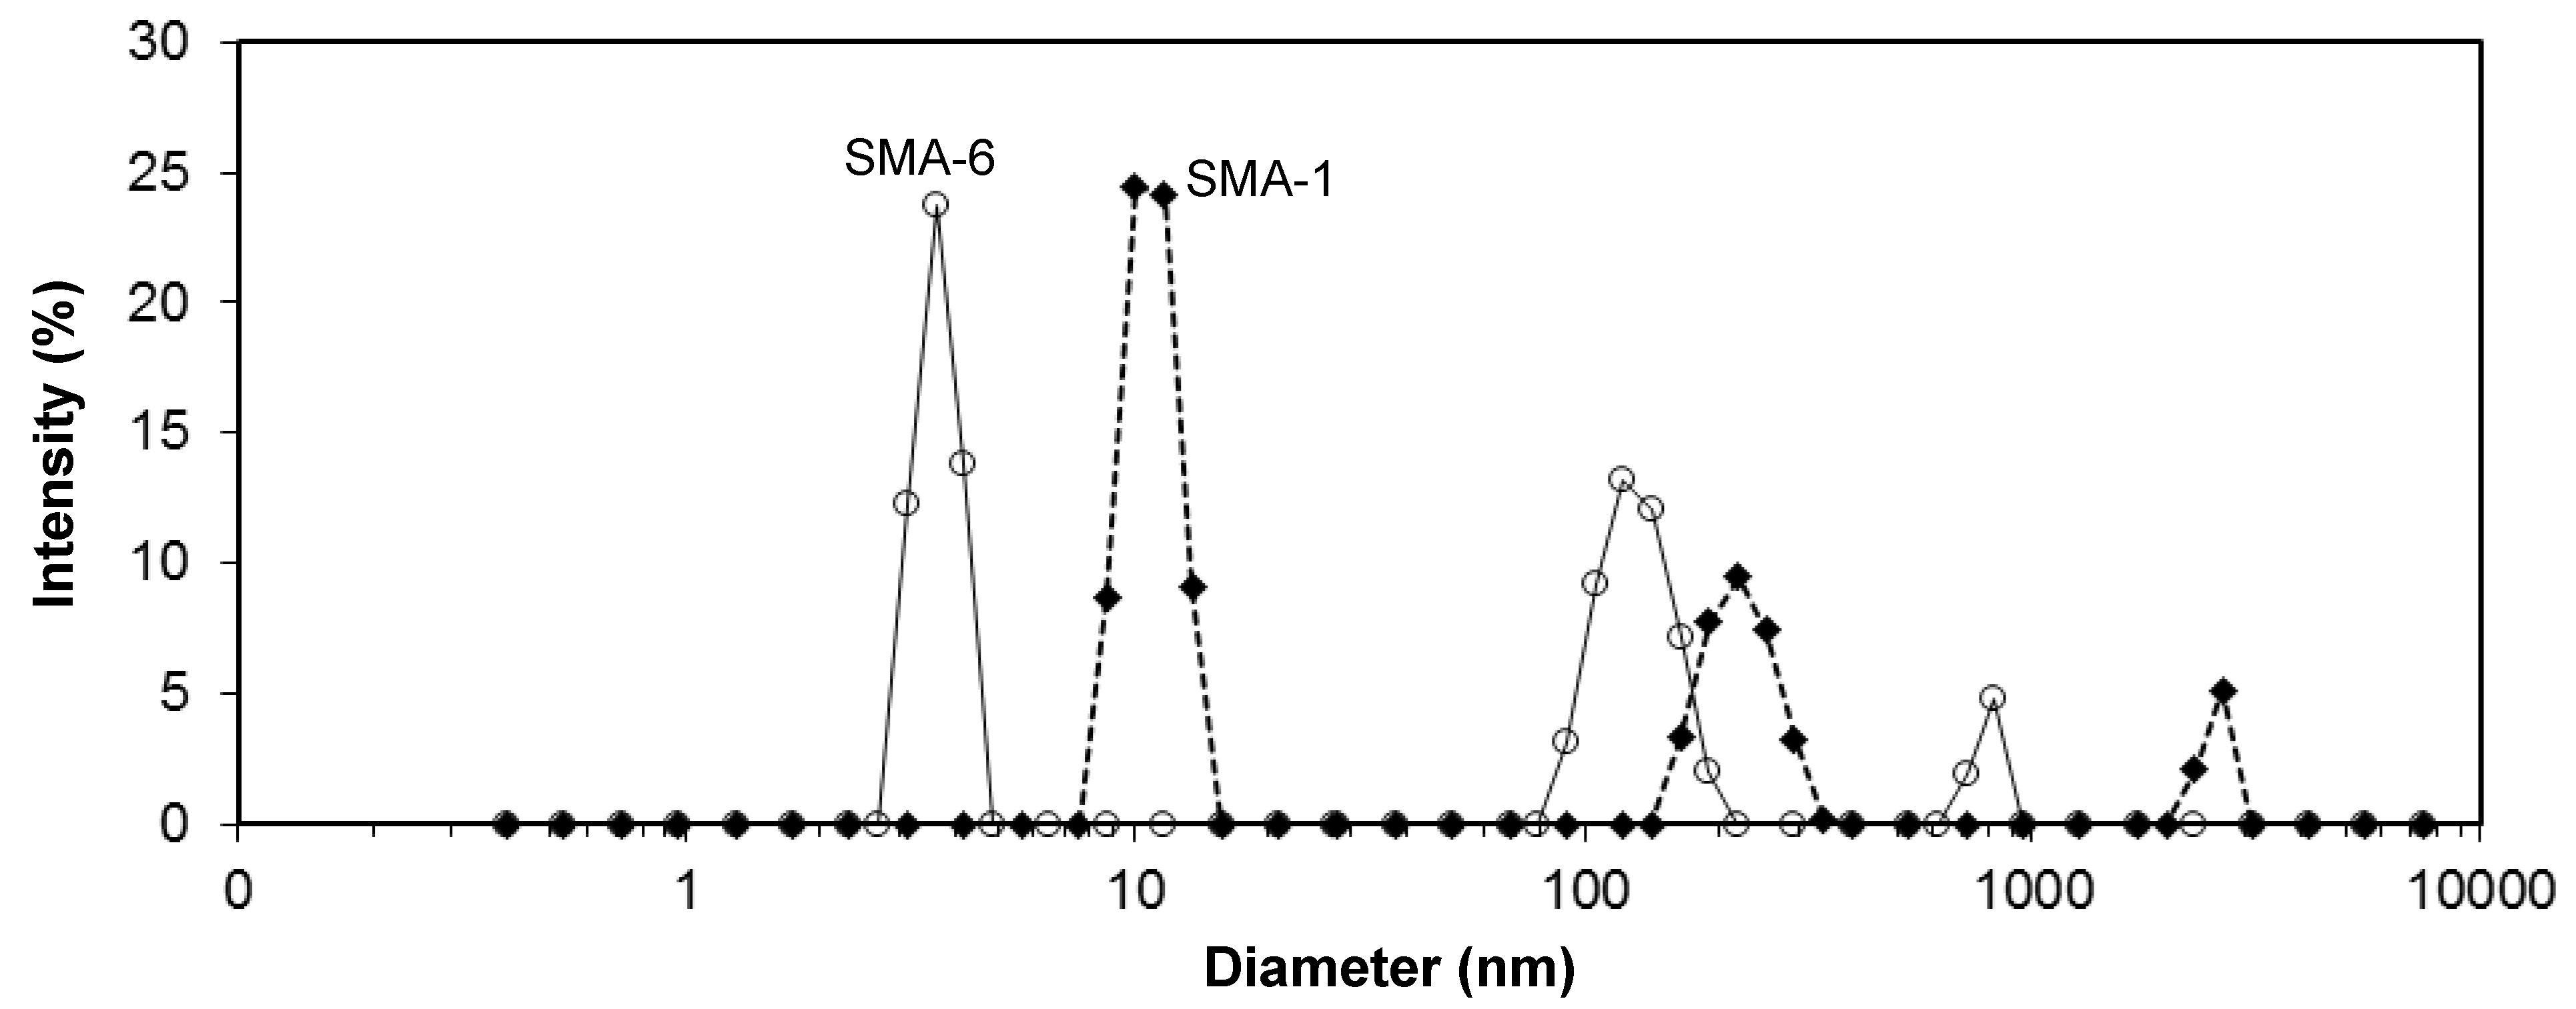
The acetone solutions of SMA copolymer grades turned opaque, as an indication that assembled molecular structures might be formed. Therefore, the acetone solutions were further characterized by size and zetapotential measurements. An example of the intensity size distributions for SMA-1 and SMA-6 solutions is illustrated in
Figure 4, averaged from 400 (100 measurements × 4 runs) scans per sample. The measurements were taken after short-time sonication of the solution and show the presence of micro- and nanoscale structures. These curves only confirm the existence of the aggregates, but no further conclusion on their relative amount can be made. Based on the presence of the peaks, there exists a microscale fraction with diameters of 3.8 µm (SMA-5), 2.6 µm (SMA-1), 1.3 µm (SMA-5) and 0.8 µm (SMA-6). As a general trend, the diameters of the microscale aggregates reduce at higher amount of MA by comparing the SMA-4, -1, -5, -6. Otherwise, the diameter slightly increases at higher molecular weight by comparing the SMA-1, -2, -3. According to the previously detailed heterogeneous molecular structure of SMA [
50], organized molecular structures likely form through self-assembly of the styrene parts (hydrophobic) and maleic anhydride parts (hydrophilic).
Figure 4.
Intensity size distribution of dissolved SMA in acetone, measured with Zetasizer ZS-90, e.g., for SMA-1 (26 mol % MA) and SMA-6 (34 mol % MA) demonstrating broad distribution of sizes with microscale aggregates.
Figure 4.
Intensity size distribution of dissolved SMA in acetone, measured with Zetasizer ZS-90, e.g., for SMA-1 (26 mol % MA) and SMA-6 (34 mol % MA) demonstrating broad distribution of sizes with microscale aggregates.
In parallel, the zetapotential values in
Table 3 (ζ = −50 to −60 mV) are a result of dissociation of the maleic anhydride moieties into carboxylic groups providing negative charges. From viscosity measurements, a slight increase in viscosity with amount of MA and molecular weight of the SMA copolymers is noticed. This provides further evidence for molecular interactions and assembly of the molecules in solution: as the amount of MA increases, electrostatic interactions around the maleic anhydride moieties (or partially converted into carboxylic groups) are expected to increase due to the larger number of dissociated groups; as the molecular weight increases, polymer chains may likely be more entangled (at least at high concentrations c >> c*) and have more interaction sites per molecule. Both phenomena may lead to an increase in viscosity of the solution. The consequent formation of structured films on glass substrates as discussed below, shows that the assembled structures were transferred from solution into a surface-deposited patterned film.
Table 3.
Physical characteristics of acetone solutions for different SMA grades.
Table 3.
Physical characteristics of acetone solutions for different SMA grades.
| SMA grade | Zetapotential [mV] | Viscosity
[cps] |
|---|
| SMA-1 | −57 ± 1 | 58 ± 2 |
| SMA-2 | −56 ± 1 | 98 ± 2 |
| SMA-3 | −58 ± 1 | 103 ± 5 |
| SMA-4 | −50 ± 1 | 50 ± 3 |
| SMA-5 | −60 ± 1 | 68 ± 2 |
| SMA-6 | −62 ± 1 | 72 ± 3 |
3.3. Film Morphology Depending on SMA Grade
Films of SMA copolymer grades were formed by dip-coating glass slides in an acetone solution and evaporation of the solvent during one day under air conditions (23 °C, 50% RH). The deposition resulted in patterned films with different morphologies depending on the SMA grade, as described below.
First, the influence of amounts of MA on the film morphology was investigated by comparing the films of SMA-4, -1, -6 with optical microscopy and AFM height images as shown in
Figure 5. The films cover the glass substrates homogeneously with polymer spheres. The spherical diameters
d are largest for SMA-4 (
Figure 5a, MA = 22 mol %:
d = 4 to 5 µm), and they become systematically smaller for SMA-1 (
Figure 5b, MA = 26 mol %:
d = 1.5 to 2 µm), and SMA-6 (
Figure 5c, MA = 34 mol %:
d = 1 to 1.5 µm). It is concluded that the spherical diameter gradually decreases at higher content of MA. For different SMA grades, the spherical diameters were quantified from five independent microscopic photographs with twenty readings of the diameters. Based on these readings, a histogram of the spherical diameter distribution is presented in
Figure 5d. Although there is an overlap in the size-distributions of the spheres for different SMA grades, the spherical diameter with maximum frequency decreases gradually with amount of MA. There is a trend that the width of the size distribution becomes more narrow (and the spherical diameters more homogeneous) at higher amounts of MA.
Figure 5.
Film morphology of SMA copolymer grades with different percentages of maleic anhydride, by optical microscopy and AFM height images: (a) SMA-4; (b) SMA-1; (c) SMA-6; and (d) histogram of spherical diameters for different SMA copolymer grades.
Figure 5.
Film morphology of SMA copolymer grades with different percentages of maleic anhydride, by optical microscopy and AFM height images: (a) SMA-4; (b) SMA-1; (c) SMA-6; and (d) histogram of spherical diameters for different SMA copolymer grades.
Second, the influence of molecular weight on the film morphology was investigated for the films of SMA-1, -2, -3 as shown in
Figure 6. For SMA copolymers with the same amount of MA (MA = 26 mol %), structured thin films have formed with spherical morphology for SMA-1 (
Mw = 80,000 g/mol,
Figure 6a), a mixed morphology of spheres and fibers for SMA-2 (
Mw = 120,000 g/mol,
Figure 6b) and a fibrous morphology for SMA-3 (
Mw = 180,000 g/mol,
Figure 6c). The spheres have a relatively uniform shape, with heights in the range of 500 nm and diameters in the range of 1 µm. The fibers have a diameter of 1 µm and consist of entangled fibrils with elementary diameters of about 300 nm diameters. From these observations, the fibrous structures are formed above a critical molecular weight at which the assembly into spheres becomes unlikely.
Figure 6.
Film morphology of SMA copolymer grades with different molecular weight, by optical microscopy and AFM height images: (a) SMA-1; (b) SMA-2; and (c) SMA-3.
Figure 6.
Film morphology of SMA copolymer grades with different molecular weight, by optical microscopy and AFM height images: (a) SMA-1; (b) SMA-2; and (c) SMA-3.
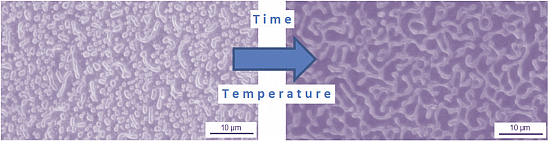
3.4. Film Morphology Depending on Thermal Heating
The thermal stability of the patterned films and morphological transitions were further studied after heating at different temperatures and times in a hot-air oven. The thermal morphology changes can provide fundamental information on the tendency for molecular assembly of SMA copolymers, and have practical implications for using them as thermo-sensitive films with variable wetting properties.
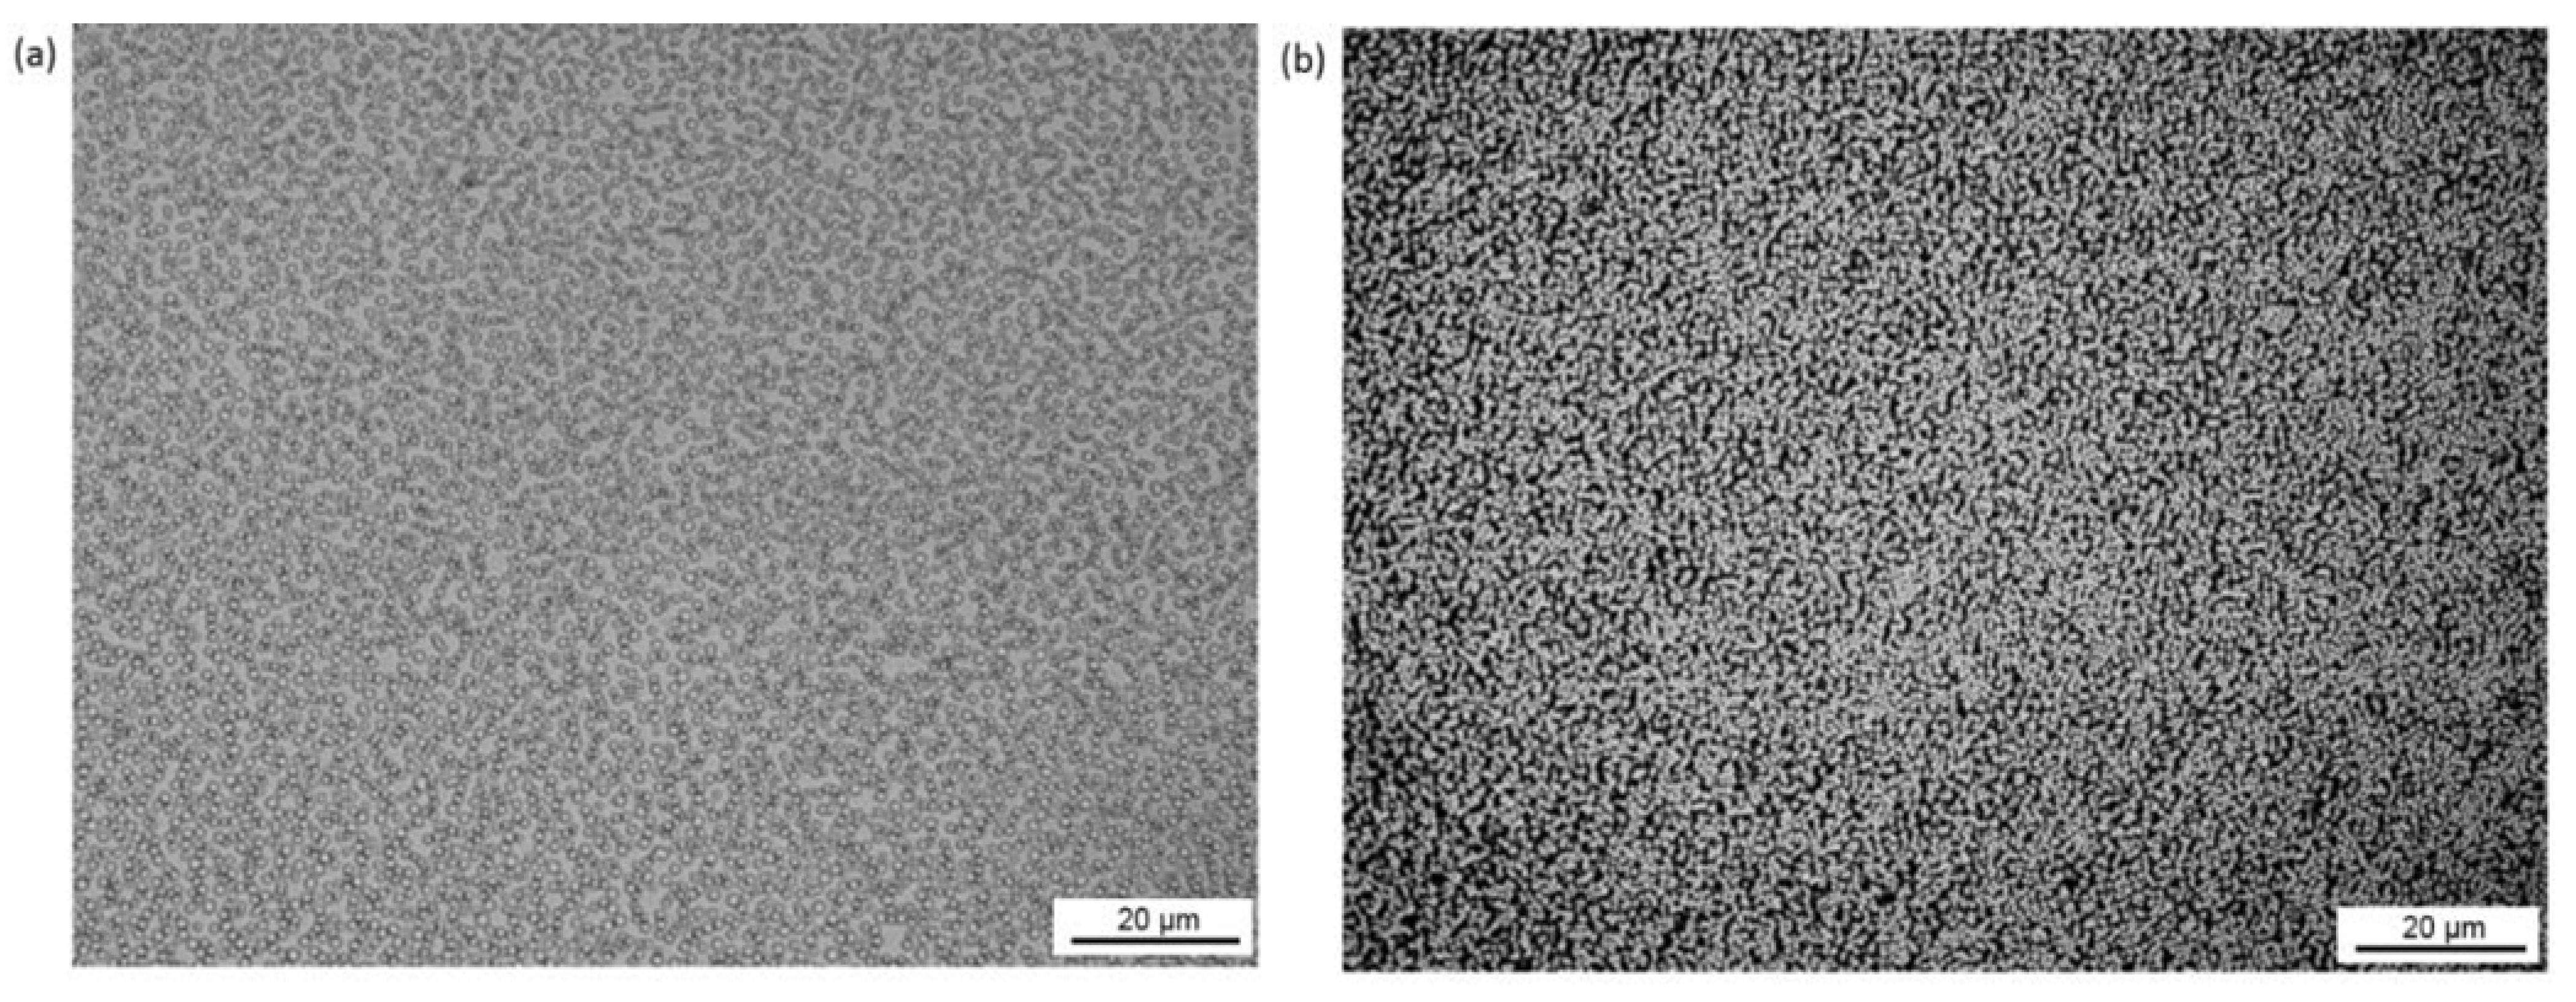
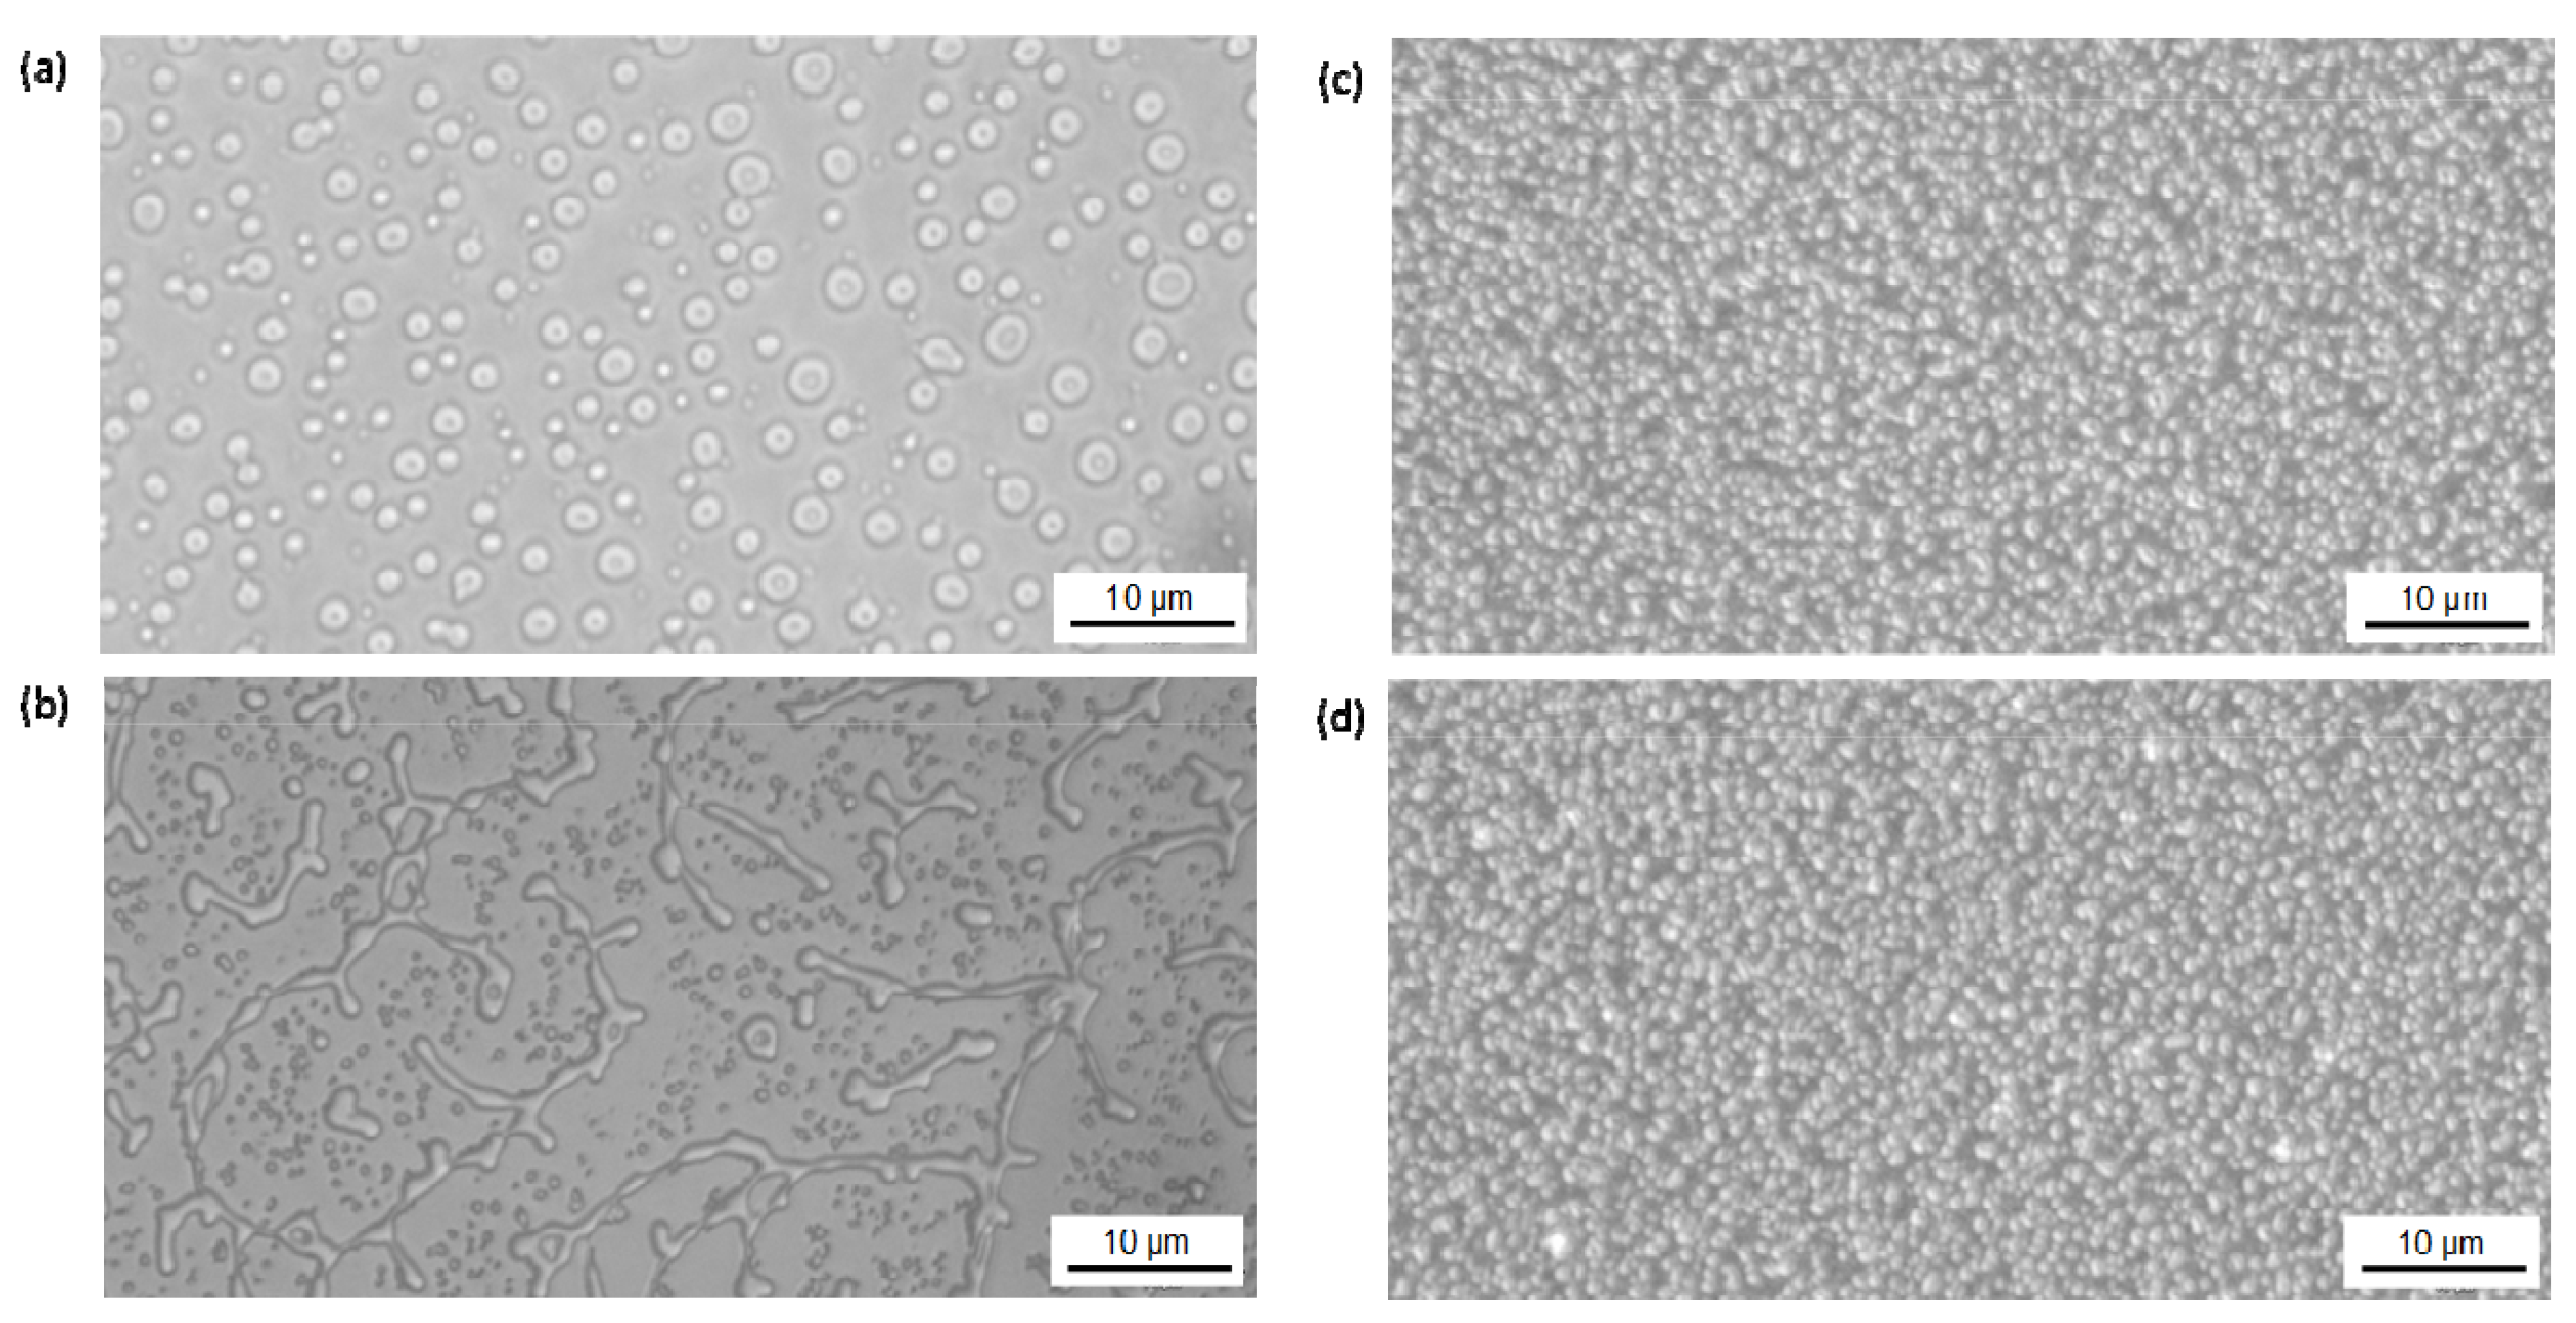
In a first series of tests, the influence of heating temperatures between 100 and 250 °C was investigated for a constant heating time of 5 h. A global overview on the films of SMA-1, after deposition and after heating for 5 h at 250 °C is shown in
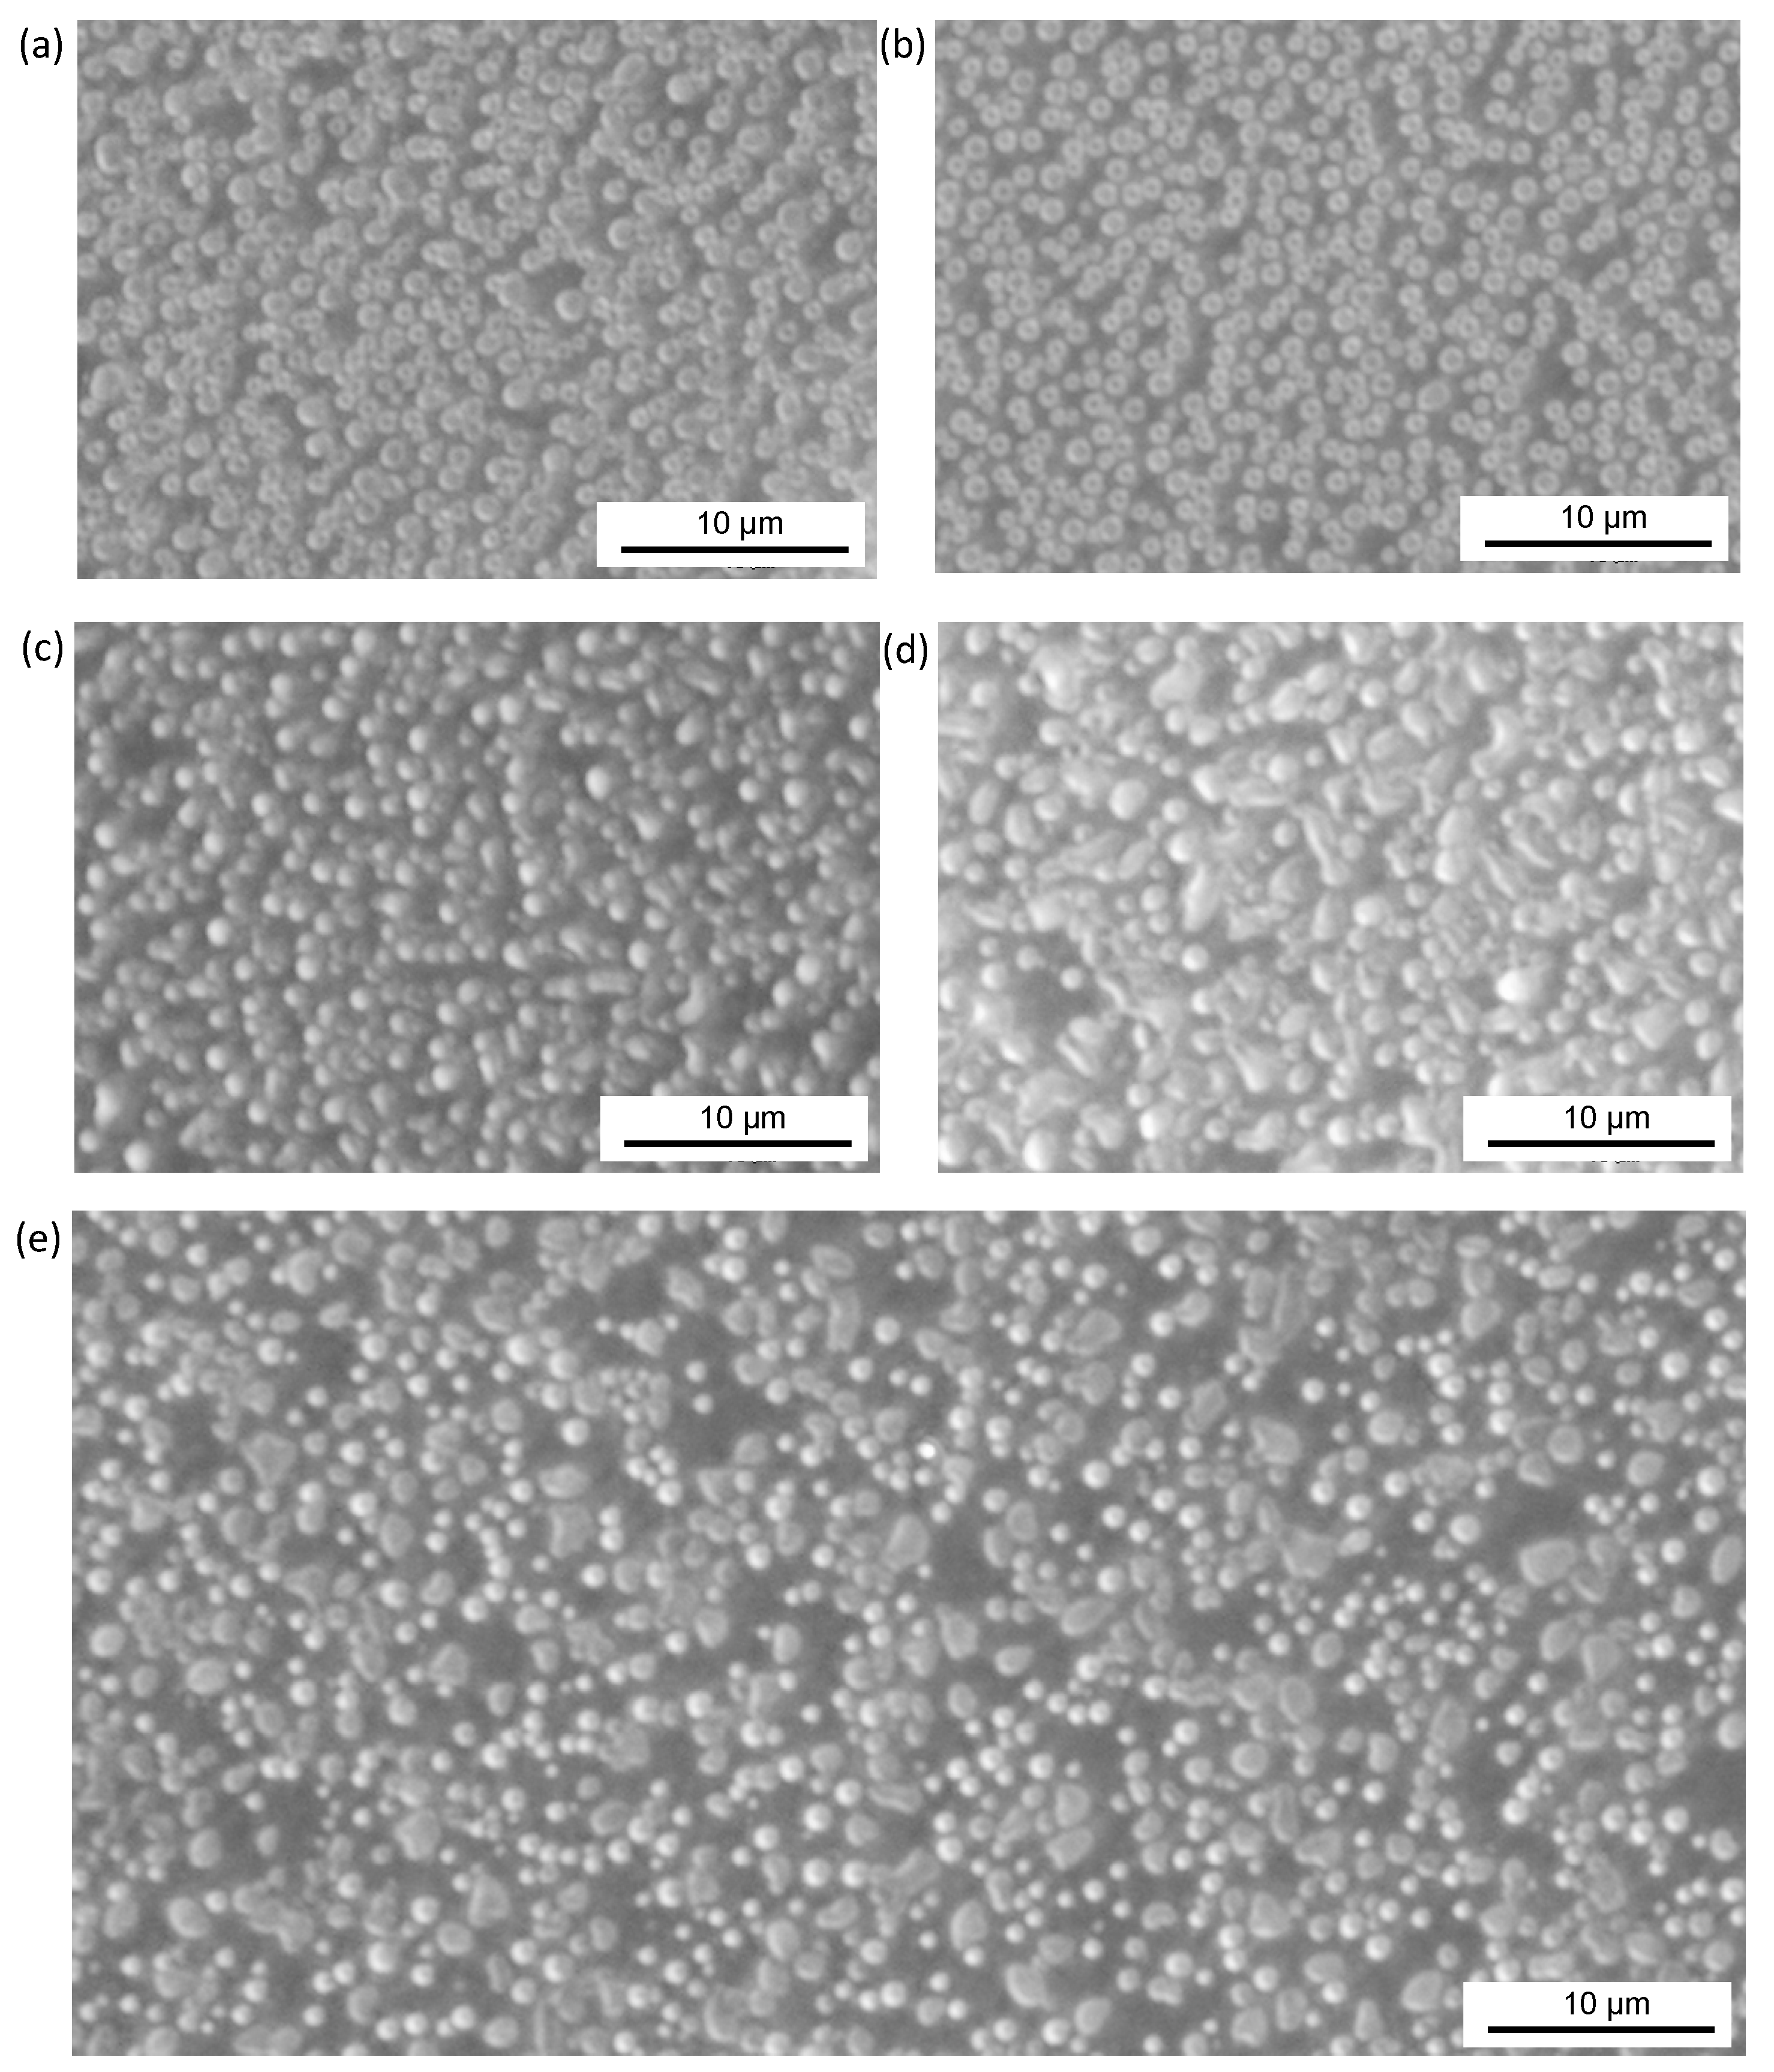
Figure 7, illustrating good macroscopic homogeneity over the entire glass substrate without tendency for macroscopic dewetting. The film morphologies and changes in local morphology of the spherical structures are further detailed in
Figure 8 during stepwise heating at various temperatures, indicating good stability. The polymer spheres retain their shape up to temperatures of 180 °C and partly deform into larger aggregates at 200 and 250 °C. This is expressed by a broadening of the distribution curves for spherical diameters at higher temperatures, as shown in
Figure 9. However, still a significant amount of spheres (about 50%) remains thermally stable in the original form above the temperature
Tg = 158 °C. The latter can be due to either interface effects by chemical attachment of the particles to the surface and/or thermodynamically-driven effects. It is remarkable that the particles do not merge into a continuous film and the effects of the molecular assembly remain existing at higher temperatures. The morphologies for films of SMA-4 and SMA-6 copolymers are detailed in
Figure 10 under the same heating conditions of 5 h at 120, 150 or 250 °C. After heating, the film pattern for SMA-4 (
Tg = 147 °C) is instable above 120 °C, while the film pattern for SMA-6 (
Tg = 176 °C) is completely stable for all heating temperatures. This might be expected from the low
Tg temperature for SMA-4 and the high
Tg temperature for SMA-6, although the applied heating temperature of 120 °C is still far below the temperature
Tg for SMA-4 and 250 °C is far above the temperature
Tg for SMA-6. The higher amount of MA in SMA-6 likely contributes to stronger inter- and intramolecular chain interactions providing thermal stability. The most stable films of SMA-6 had finally to be heated for 5 h up to 280 °C before any variation in the film morphology with a rearrangement of the polymer spheres occurred, as shown in
Figure 11. After heating for 5 h at 320 °C, the film starts to re-assemble with alignment of the spheres that do not merge together.
Figure 7.
Microscopic overview of patterned films for SMA-1 copolymer, (a) after deposition; and (b) after heating for 5 h at 250 °C.
Figure 7.
Microscopic overview of patterned films for SMA-1 copolymer, (a) after deposition; and (b) after heating for 5 h at 250 °C.
Figure 8.
Detailed microscopic evaluation of patterned films for SMA-1 after heating for 5 h at different temperatures, (a) 120 °C; (b) 150 °C; (c) 180 °C; (d) 200 °C; and (e) 250 °C.
Figure 8.
Detailed microscopic evaluation of patterned films for SMA-1 after heating for 5 h at different temperatures, (a) 120 °C; (b) 150 °C; (c) 180 °C; (d) 200 °C; and (e) 250 °C.
Figure 9.
Detailed microscopic evaluation of patterned films for SMA-1 after heating for 5 h at different temperatures, (a) 120 °C; (b) 150 °C; (c) 180 °C; (d) 200 °C; and (e) 250 °C.
Figure 9.
Detailed microscopic evaluation of patterned films for SMA-1 after heating for 5 h at different temperatures, (a) 120 °C; (b) 150 °C; (c) 180 °C; (d) 200 °C; and (e) 250 °C.
Figure 10.
Detailed microscopic evaluation of patterned films for other SMA grades after heating for 5 h at different temperatures, (a) SMA-4 at 120 °C; (b) SMA-4 at 150 °C; (c) SMA-6 at 180 °C; and (d) SMA-6 at 250 °C.
Figure 10.
Detailed microscopic evaluation of patterned films for other SMA grades after heating for 5 h at different temperatures, (a) SMA-4 at 120 °C; (b) SMA-4 at 150 °C; (c) SMA-6 at 180 °C; and (d) SMA-6 at 250 °C.
Figure 11.
Detailed microscopic evaluation of patterned films for SMA-6 after heating for 5 h at different temperatures, (a) 280 °C; (b) 300 °C; and (c) 320 °C.
Figure 11.
Detailed microscopic evaluation of patterned films for SMA-6 after heating for 5 h at different temperatures, (a) 280 °C; (b) 300 °C; and (c) 320 °C.
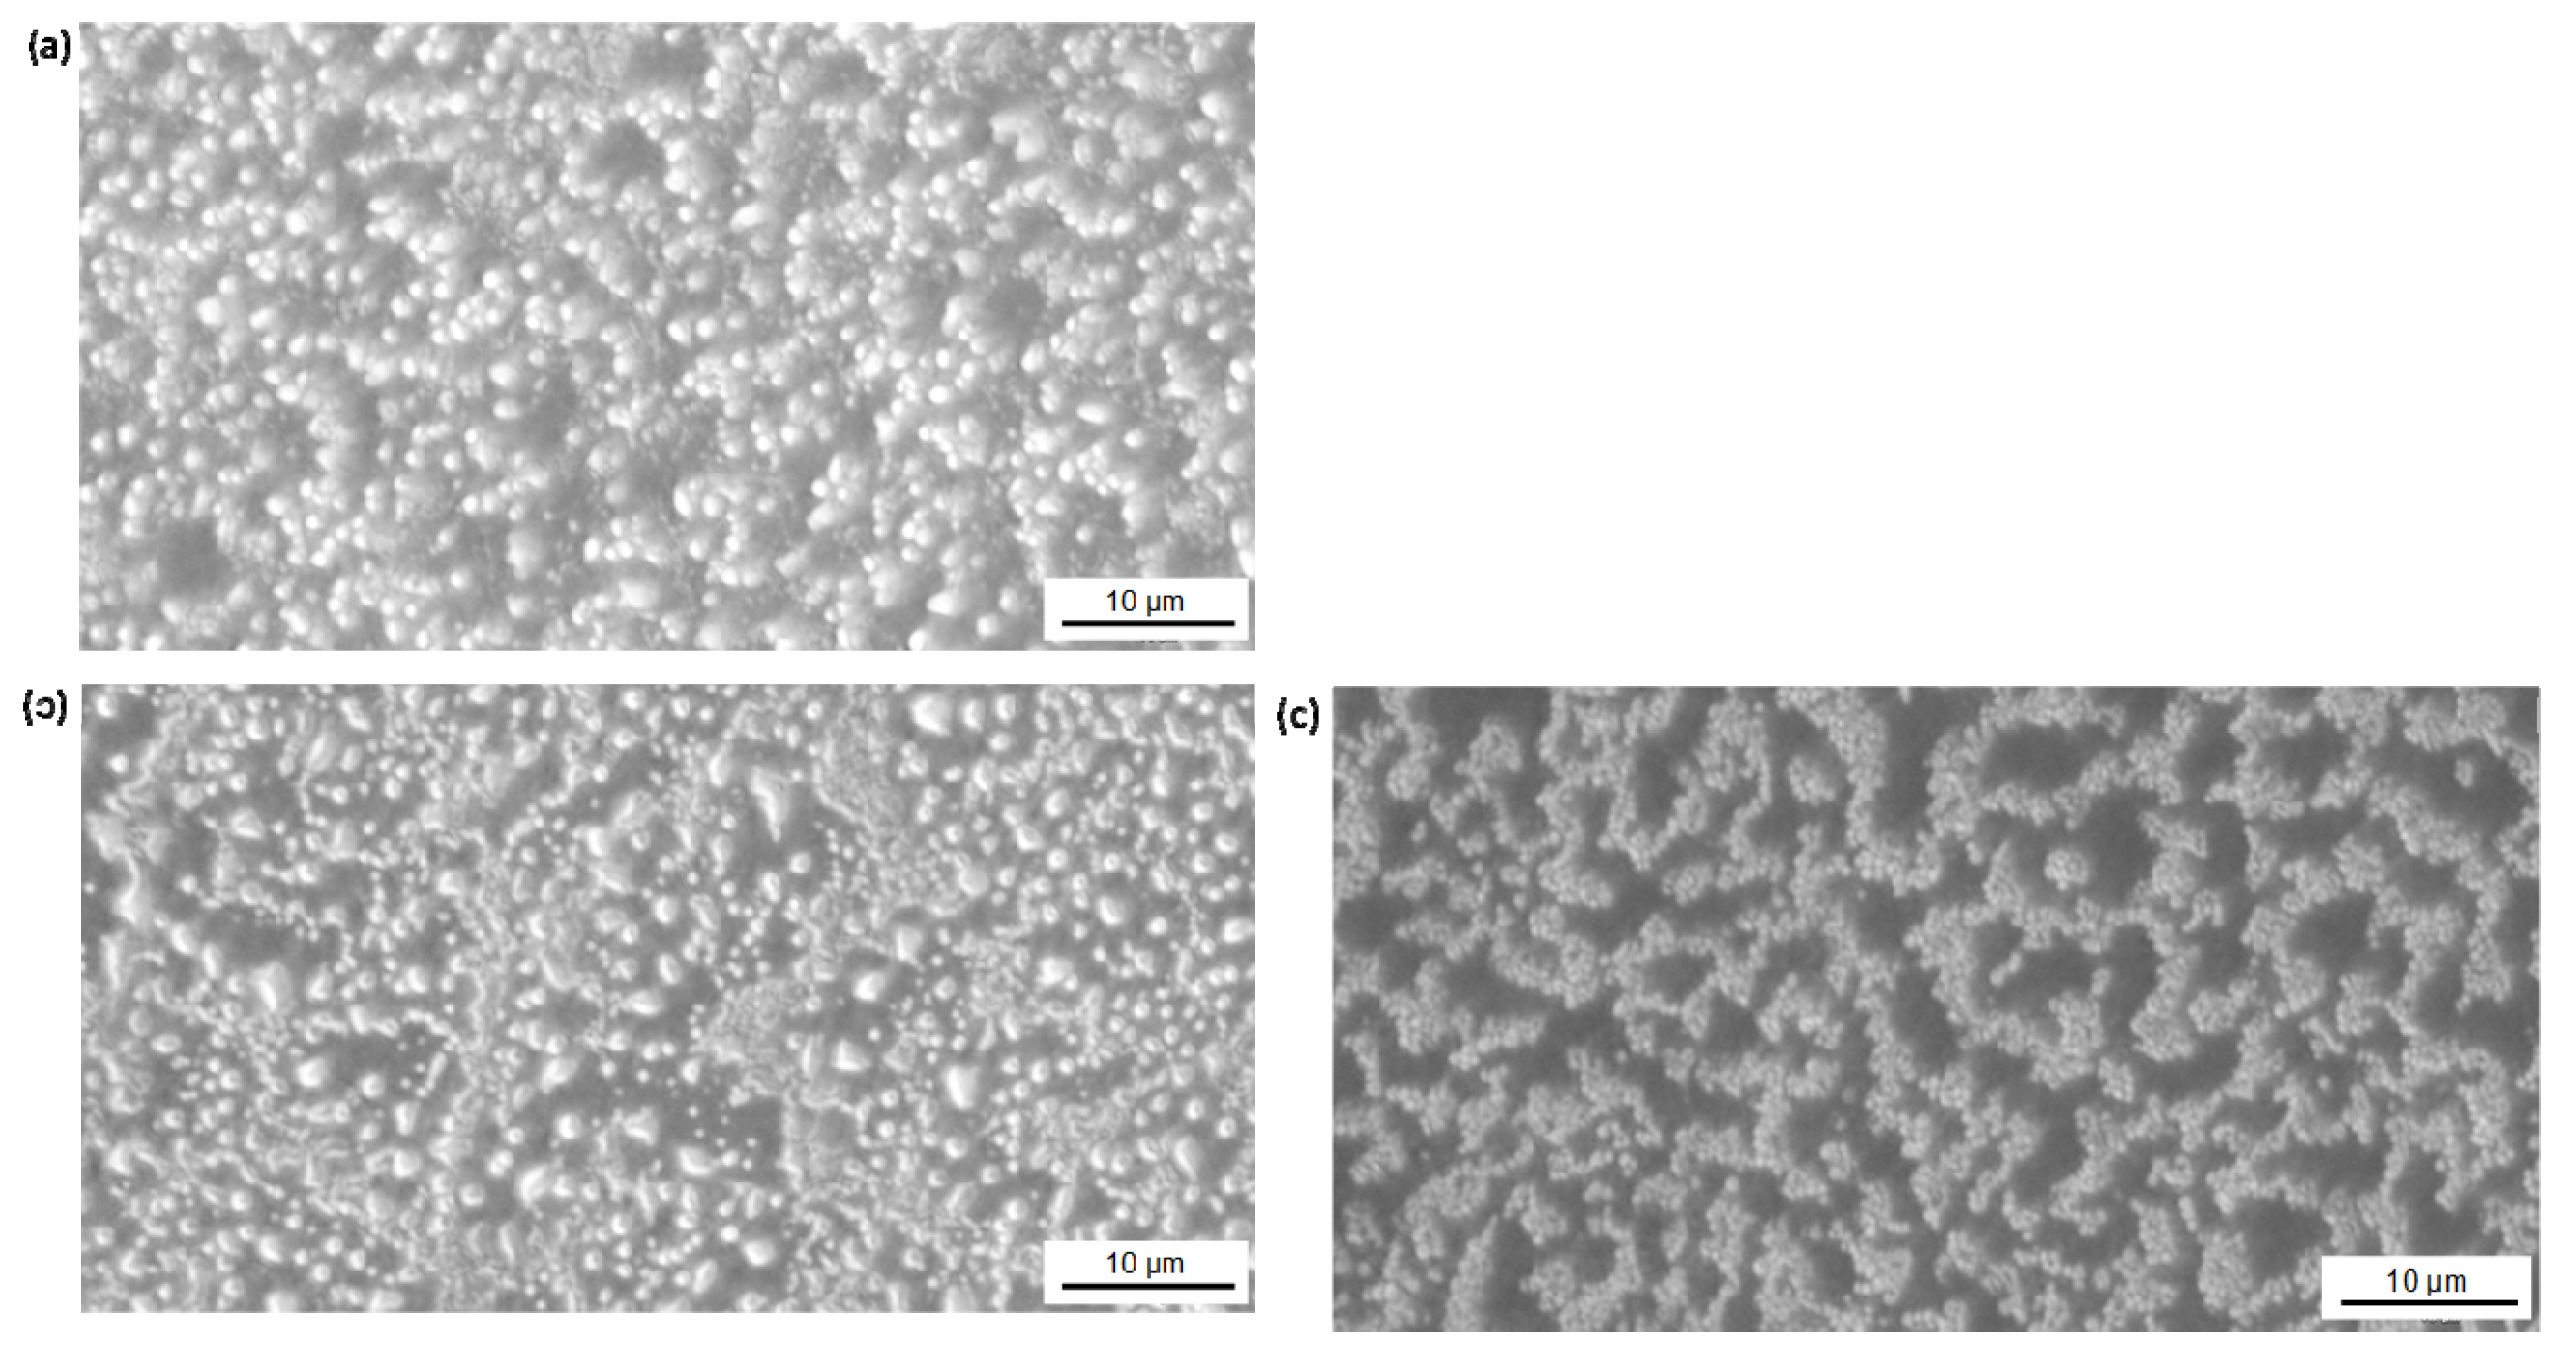
In a second series of tests, the influence of heating time near the glass transition temperature of the SMA copolymer was evaluated. The morphology changes in films of copolymers with lowest glass transition temperature were first investigated (SMA-4:
Tg = 147 °C). After heating for short times of 1 to 3 h at 150 °C, a progressive re-assembly of the polymer spheres over the surface with gradual lining-up over the surface was observed, as shown in
Figure 12. The re-arrangements finally result in a network structure as shown before after 5 h heating (
Figure 10b). The films of copolymers with higher glass transition temperature (SMA-1:
Tg = 158 °C) and good thermal stability after 5 h heating at 150 °C (see before,
Figure 8b) were subsequently heated for 10 h. An interesting variation in film morphology is noticed with a transformation of the spherical structures into a fibrous network over longer time, as shown in
Figure 13. This drastic morphological change indicates that the film is mobile and can move over the surface.
Figure 12.
Detailed microscopic evaluation of patterned films for SMA-H4 after heating at 150 °C for different times, (
a) 1 h; (
b) 2 h; and (
c) 3 h (5 h similar to
Figure 10b).
Figure 12.
Detailed microscopic evaluation of patterned films for SMA-H4 after heating at 150 °C for different times, (
a) 1 h; (
b) 2 h; and (
c) 3 h (5 h similar to
Figure 10b).
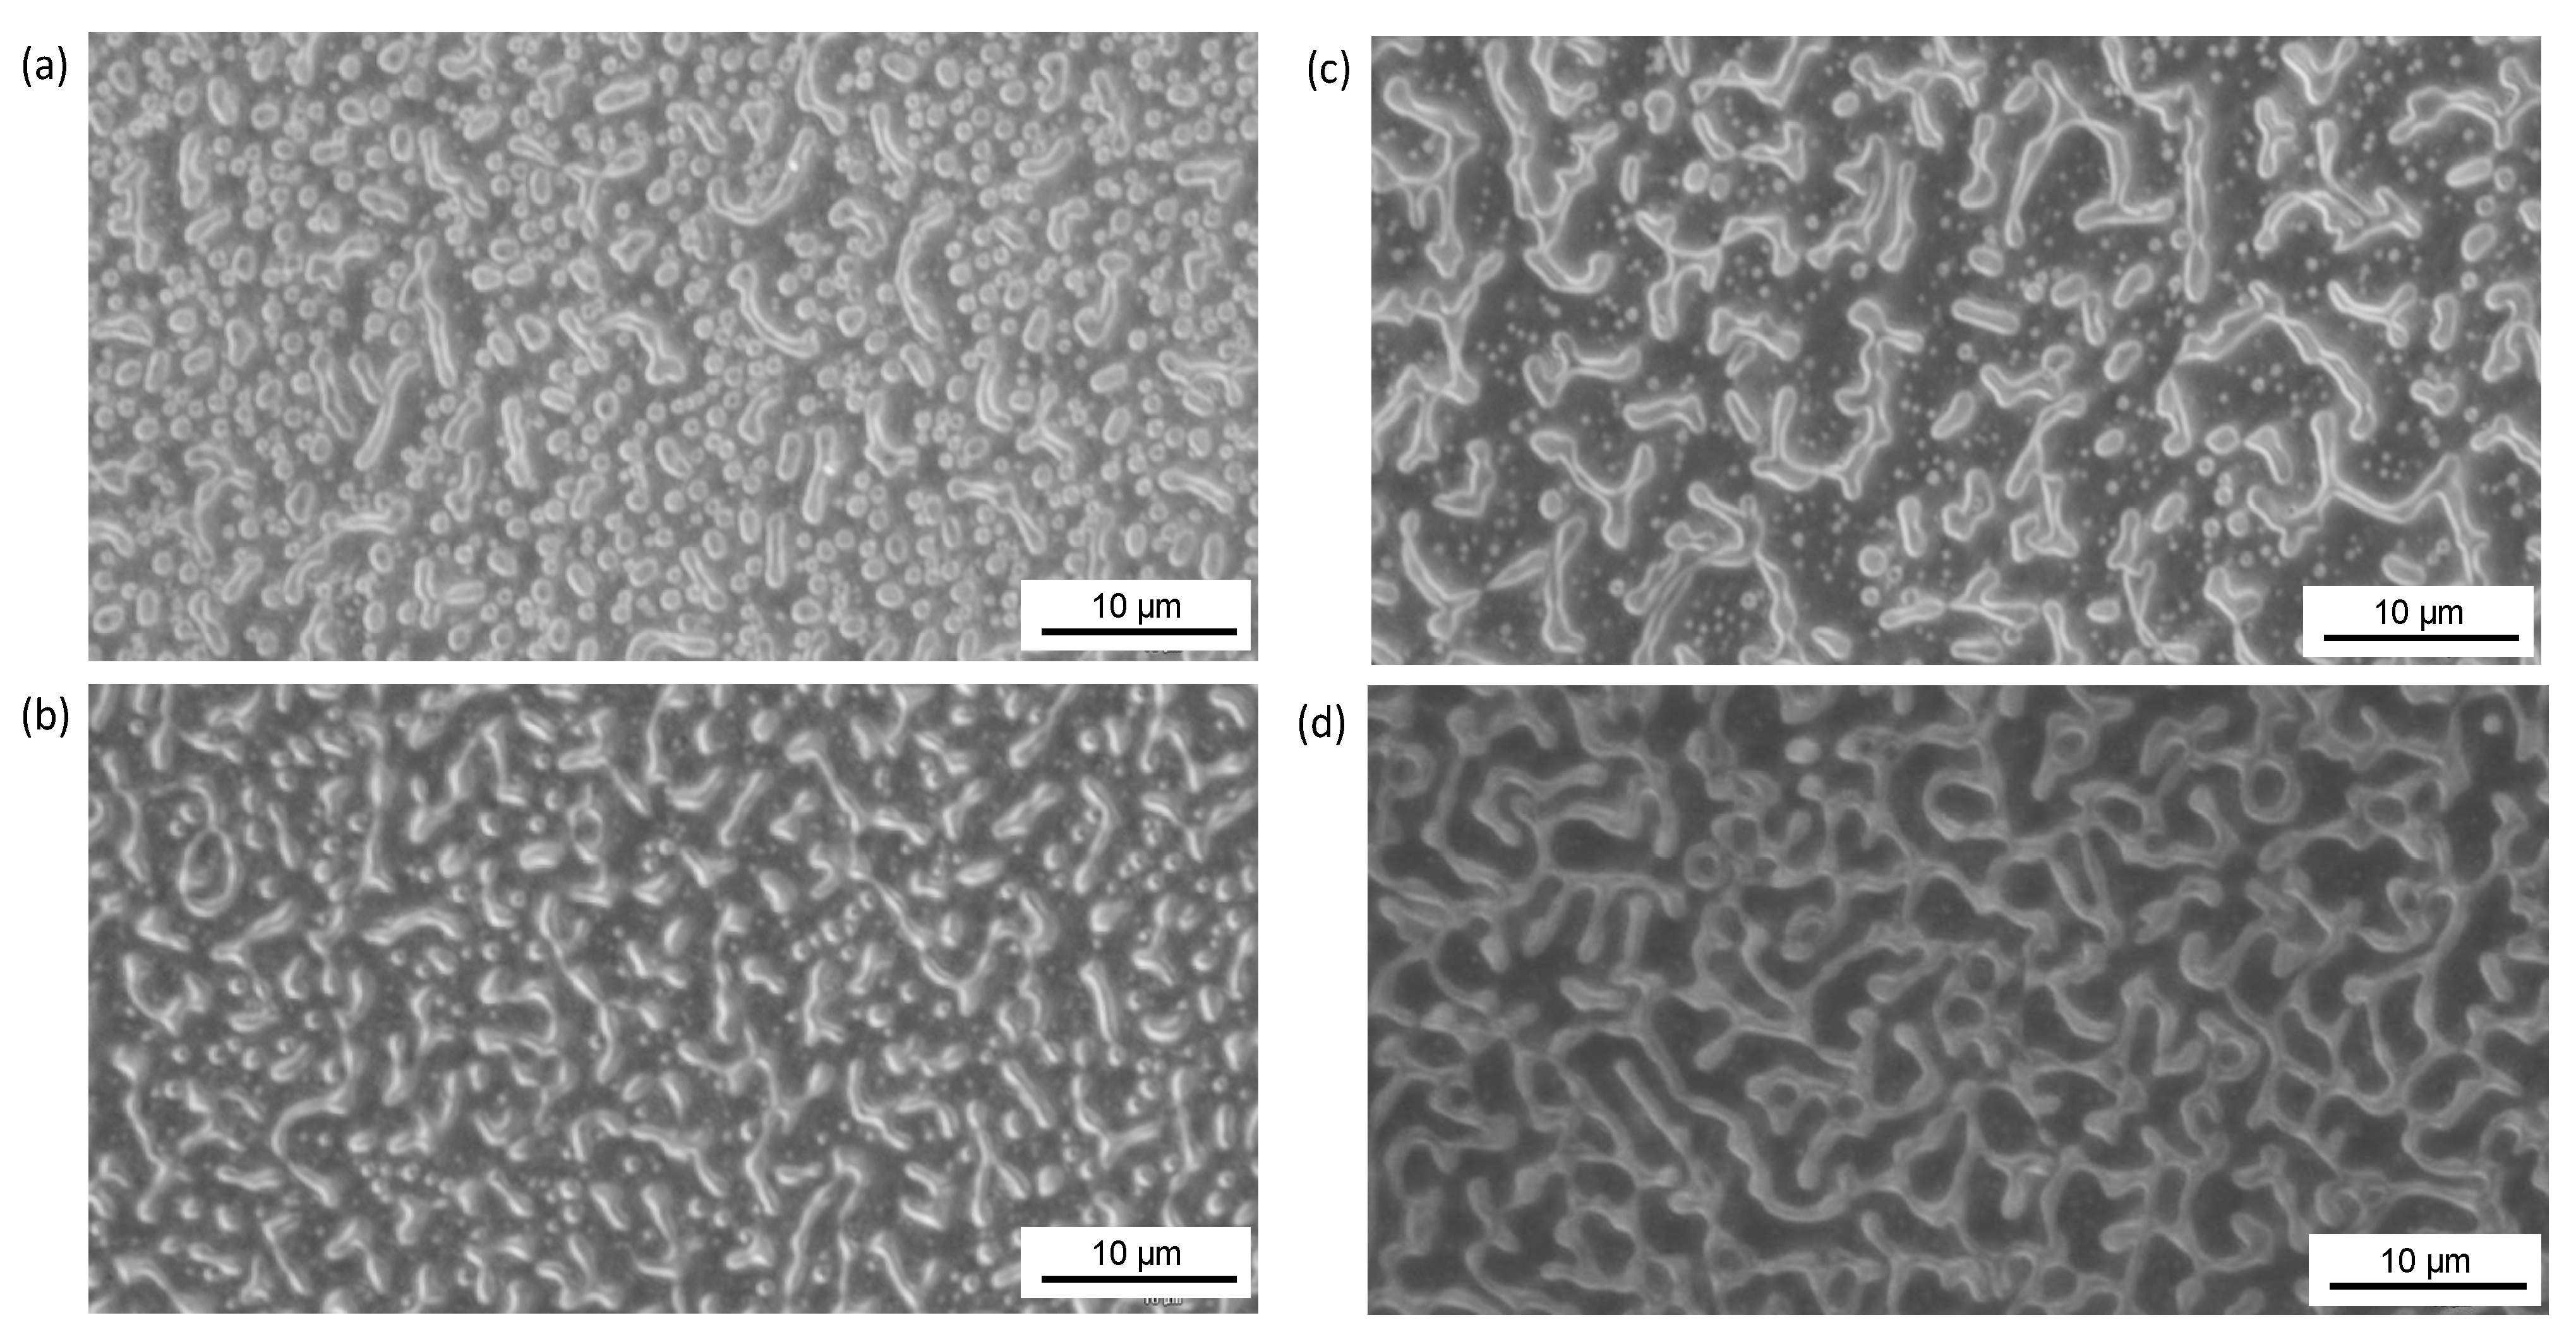
The formation of a thermally stable fibrous network structure was also noticed for films of copolymers with a higher molecular weight,
i.e. SMA-2 (
Mw = 120,000 g/mol) and SMA-3 (
Mw = 180,000 g/mol), immediately after deposition of the film and without heating (
Figure 14). The formation of a fibrous network can likely be related to the high viscosity of the solutions with high molecular weight copolymers (
i.e., compare SMA-1, -2, -3). The fibrous structure remained stable during heating, as an indication that this is a more stable structure over a broad range of molecular weight and temperatures. In comparison with the fibrous structures formed after heating of SMA-1 copolymers (
Mw = 80,000 g/mol), however, the structures of high-molecular weights SMA-2 and SMA-3 are somewhat thicker. From these morphologies, it can be concluded that the assembly into spheres is metastable and develops at intermediate molecular weights (SMA-1, -4, -5, -6:
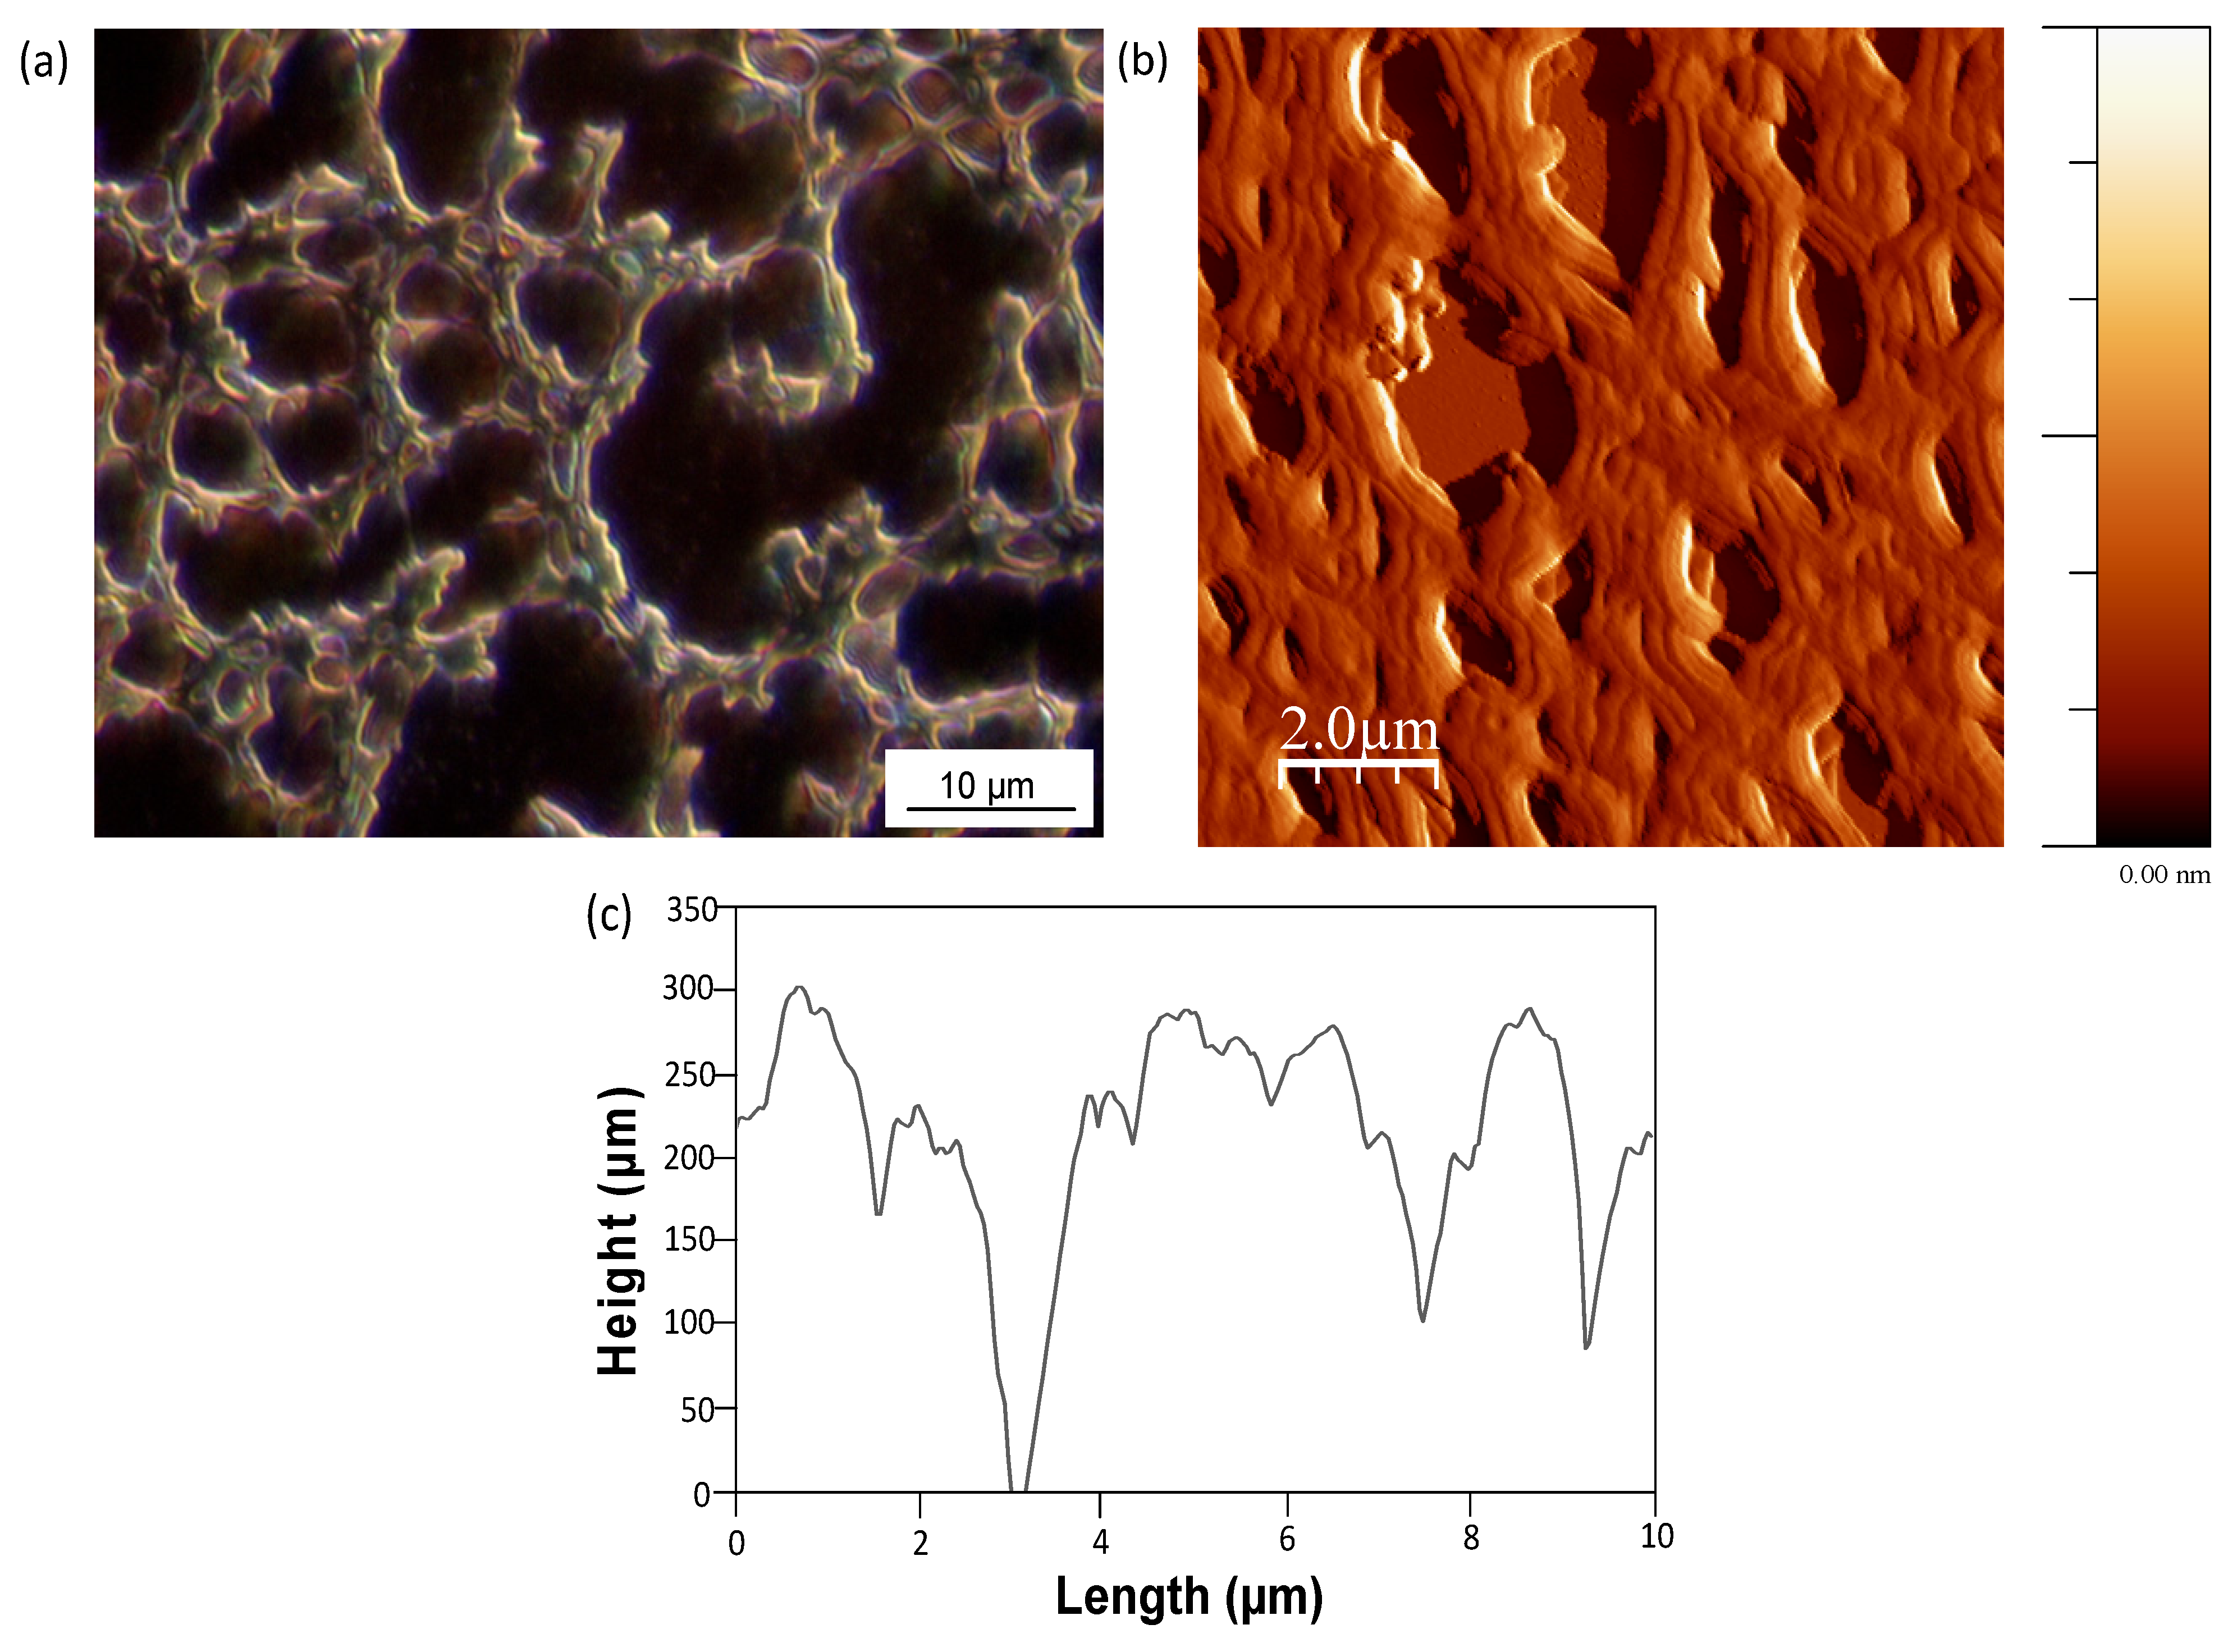
Mw = 80,000 to 110,000 g/mol) and in a certain temperature interval. A detailed picture of the stabilized fibrous films of SMA-1 upon heating for several hours at temperatures below the glass transition temperatures is shown in
Figure 15a (optical microscopy) and in
Figure 15b (AFM). The film thickness is about 200 to 300 nm, according to a 2D profile generated from the AFM images in
Figure 15c. Here, the diameter of the fibers can be estimated, and from similar graphs for other SMA copolymers we observe an increase in diameters for SMA copolymers with different molecular weight as follows: 1.5 to 2 µm for SMA-1, 2 to 2.5 µm for SMA-2, and 3 to 4 µm for SMA-3. Moreover, the fibers are composed by a parallel assembly of single fibrils. The diameter of the single fibrils (about 400–500 nm) remained almost constant for all SMA copolymers, while a larger amount of fibrils was lining-up as the SMA copolymer contains higher amount of MA. Some specific features during thermal heating of the SMA copolymer films are highlighted in
Figure 16, indicating local re-arrangements in the film morphologies (e.g., for SMA-1). Both AFM images at scanning sizes 10 × 10 µm
2 (
Figure 16a,c) illustrate the progressive agglomeration of polymer spheres upon heating for 5 h at 200 and 250 °C, respectively. More interesting features are included in the pictures at scanning sizes of 2 × 2 µm
2 (
Figure 16b,d): here, the formation of smaller spherical capsule sizes over the surface is observed: the latter suggests that the film dewets over the surface and the remaining film in the dewetting areas re-assemble into elementary particle sizes of around 100 nm at the final thermal heating temperature of 250 °C for 5 h.
Figure 13.
Detailed microscopic evaluation of patterned films for SMA-1 after heating at 150°C for different times, (a) 7 h; (b) 8 h; (c) 9 h; and (d) 10 h.
Figure 13.
Detailed microscopic evaluation of patterned films for SMA-1 after heating at 150°C for different times, (a) 7 h; (b) 8 h; (c) 9 h; and (d) 10 h.
Figure 14.
Detailed microscopic evaluation of patterned films for SMA copolymers with different molecular weight, immediately after depositions and no heating: (a) SMA-2 (Mw = 120,000 g/mol); and (b) SMA-3 (Mw = 180,000 g/mol).
Figure 14.
Detailed microscopic evaluation of patterned films for SMA copolymers with different molecular weight, immediately after depositions and no heating: (a) SMA-2 (Mw = 120,000 g/mol); and (b) SMA-3 (Mw = 180,000 g/mol).
Figure 15.
Stabilized fibrous film pattern of SMA-1 after thermal curing for 10 h at 150 °C, (a) detail by optical microscopy; (b) AFM height image; and (c) profile from AFM.
Figure 15.
Stabilized fibrous film pattern of SMA-1 after thermal curing for 10 h at 150 °C, (a) detail by optical microscopy; (b) AFM height image; and (c) profile from AFM.
Figure 16.
AFM images of specific features on films with SMA-1 copolymer after thermal curing, (a,b) SMA-1 (5 h at 200 °C); (c,d) SMA-1 (5 h at 250 °C). Circles in images (a) and (c) indicate the positions where magnifications (c) and (d) were taken. Left legend applies for (a,c) and right legend applies for (b,d).
3.5. Quantitative Morphologies
The gradual transformation from spherical into fibrous structures during heating was further quantified by image processing of the optical micrographs, determining the contributions of various film morphologies.
The images were first transformed into 8-bit images and the edges of the film structures were automatically determined by the image software. An illustration of the original and processed images is shown in Supplementary Information and Figures S1–S6. In order to quantify the amount of each feature, the surface coverage (area) for each image object category was determined, which is related to the number of white pixels in a black-and-white processed image. Therefore, the spheres were determined as structures with a given maximum diameter of 2 µm. The short-fibrous structures were a priori determined as structures with a given threshold value for surface coverage, corresponding to structures with length between 1 and 5 µm. The fibrous network structures were determined as structures with a surface coverage above the threshold value. In order to make a histogram of the surface features, two different filters were used to subsequently remove the specific elements from the image. Standard mathematical procedures for image filtering were used, including a spherical filter element with increasing diameter to filter the spherical shapes and an elliptical filter with increasing size to filter the fibrous structures (an example of filtered images in subsequent steps is shown in Supplementary Information and Figures S1–S6). As such, the all of the image objects are step by step removed from the image.
The percentages of spherical, short-fibrous and continuous fibrous network structures were determined, e.g., for SMA-1 and SMA-6, after heating at different temperatures up to 10 h (
Figure 17). The histograms quantify the progressive transformation of a spherical into fibrous morphology at heating times up to 10 h. It confirms the progressive formation of almost completely long-fibrous structures (up to 90%) for SMA-1 at 150 to 200 °C, and the formation of mainly short-fibrous structures (up to 90%) and a small fraction long-fibrous structures (up to 8%) for SMA-6 at 150 to 200 °C. The shape of the histograms directly reflects the lower thermal stability of film patterns for SMA-1 and high thermal stability of film patterns for SMA-6.
Figure 17.
Quantitative image analysis of film morphologies for SMA-1 and SMA-6 after thermal heating at different temperatures and times, representing spherical (first column), short fibrous (second column) and long fibrous structures (third column) for (a) SMA-1 at 150 °C; (b) SMA-6 at 150 °C; (c) SMA-1 at 200 °C; and (d) SMA-6 at 200 °C.
3.6. Contact Angle Measurements
The water contact angles on SMA copolymer films with various amounts of MA and heating temperatures (5 h) are summarized in
Table 4. The standard deviation on static contact angles θ
stat was about ±2.1°, according to three repetitive measurements per polymer film. A reference value for static water contact angles on uncoated glass substrate is θ
stat = 48° ± 1.1°. The standard deviation in dynamic advancing contact angles θ
a is somewhat larger and about ±3.5°, with a reference value on uncoated glass substrates of θ
a = 52° ± 1.8°.
The contact angles for SMA copolymer films vary with the amount of MA and thermal heating, but are all in the hydrophilic range. For the non-heated films, θstat are between 62° to 50° and decrease in the order SMA-4, -1, -5, -6: it can be concluded that the higher amount of MA implies higher hydrophilicity to the polymer film, as the MA groups are more hydrophilic than the styrene parts. Otherwise, the effect of thermal heating is relatively reproducible for all SMA grades, with a first trend of slight decrease in contact angle at low heating temperatures (100 °C), followed by a second trend in increasing contact angles at higher heating temperatures (120 °C) and finally a stabilization and slight decrease in contact angles at the highest temperatures (150 to 250 °C). According to previous characterization of SMA films with Raman spectroscopy, the variations in contact angles upon heating may reflect the influences of film hydrolysis (open-ring structure of the MA groups) and reformation of the MA (closed-ring structure). The dynamic advancing contact angles θa are very near to the static contact angles in case of SMA-4, while some more significant differences are measured for SMA-6. Mainly, the variations in dynamic contact angles with higher amount of MA are not as clear as the variations in static contact angles, because the dynamic contact angles are more sensitive to the combination of surface chemistry and topography. The receding contact angles θr on the SMA copolymer films are not explicitly mentioned, as these values were almost <20 °C in all cases.
In general, wetting of the polymer films is expected to depend on the chemical composition and surface topography. Therefore, the amount of MA (from Raman measurements,
Figure 3) and average surface roughness
Ra (from AFM measurements,
Figure 5) were determined and are given in
Table 5. The amount of MA was calculated as the intensity ratio of Raman absorption bands related to the anhydride (1857 cm
−1) and the styrene (1601 cm
−1). As such, the maximum percentages of MA to styrene ratio are 28% (SMA-4), 35% (SMA-1), 39% (SMA-5), and 52% (SMA-6), respectively. The maximum amounts of MA can be obtained after heating. These conditions correspond to the higher contact angle values, as the ring-closed MA is less hydrophilic than the ring-opened carboxylic acids.
The high sensitivity of contact angles to amount of MA suggests that the MA moieties are effectively located at the film surface,
i.e., at the outer surface of the spherical or fibrous structure. As such, the features are likely formed by self-organization of the hydrophobic styrene moieties pointing inwards of the spheres or fibers and the MA parts pointing outwards at the surface. The values for average surface roughness
Ra were taken from 2 × 2 µm
2 AFM images. The more homogeneous coverage of spherical structures with smaller diameter (SMA-6) clearly provides the lowest roughness value. Otherwise, the changes in surface morphology upon heating result in some coarse structures with slightly higher roughness. This is most prominent for the films with lowest thermal stability. As a comparison, the average surface roughness of films with fibrous patterns was much higher:
Ra = 86 nm (SMA-2, see AFM image in
Figure 5b with mixed spherical and fibrous structures) and 120 nm (SMA-3, see AFM image in
Figure 6c with fibrous structures). For the present polymer films, the differences in surface roughness do not directly correlate with the contact angle variations while the chemical composition seems to have a more direct influence. For other applications, it was found that the roughness affects the contact angles in a more direct way as estimated by the Wenzel model [
56] for hydrophobic surfaces. In general, the roughness parameter increases the hydrophobicity on hydrophobic surfaces and augments the hydrophilicity on hydrophilic surfaces [
57]. However, these trends could be attributed to the formation of hierarchical micro-to-nanoscale roughness structures that are not present in our case. Another reason could be the high structural variation and lack of regularity in the patterned films. In present situation, the water contact angles are primarily influenced by the chemical composition of the MA groups in the patterned films.
Table 4.
Water contact angles (°) on different SMA copolymer films after deposition and heating at different temperatures (5 h).
Table 4.
Water contact angles (°) on different SMA copolymer films after deposition and heating at different temperatures (5 h).
| SMA film | SMA-4 | SMA-1 | SMA-5 | SMA-6 |
|---|
| θstat | θa | θstat | θa | θstat | θa | θstat | θa |
|---|
| No heating | 62 | 61 | 58 | 62 | 55 | 60 | 50 | 58 |
| 100 °C | 60 | 58 | 50 | 68 | 48 | 64 | 49 | 62 |
| 120 °C | 65 | 57 | 48 | 70 | 58 | 63 | 65 | 72 |
| 150 °C | 55 | 50 | 68 | 75 | 58 | 65 | 55 | 65 |
| 180 °C | 52 | 50 | 78 | 80 | 45 | 59 | 43 | 48 |
| 200 °C | 48 | 49 | 58 | 68 | 40 | 59 | 32 | 46 |
| 220 °C | 46 | 48 | 55 | 58 | 42 | 52 | 30 | 42 |
| 250 °C | 42 | 48 | 38 | 46 | 35 | 43 | 22 | 35 |
Table 5.
Amount of maleic anhydride (% MA) and average surface roughness (Ra) of the patterned films after deposition and heating at different temperatures (5 h).
Table 5.
Amount of maleic anhydride (% MA) and average surface roughness (Ra) of the patterned films after deposition and heating at different temperatures (5 h).
| SMA film | SMA-4 | SMA-1 | SMA-5 | SMA-6 |
|---|
| % MA [%] | Ra [nm] | % MA [%] | Ra [nm] | % MA [%] | Ra [nm] | % MA [%] | Ra [nm] |
|---|
| No heating | 10 | 89 | 17 | 45 | 22 | 46 | 32 | 34 |
| 100 °C | 12 | 105 | 14 | 52 | 20 | 50 | 32 | 33 |
| 120 °C | 25 | 100 | 29 | 50 | 35 | 54 | 48 | 35 |
| 150 °C | 25 | 130 | 34 | 60 | 38 | 62 | 52 | 36 |
| 180 °C | 27 | 140 | 35 | 65 | 38 | 68 | 52 | 35 |
| 200 °C | 28 | 122 | 35 | 76 | 39 | 73 | 52 | 36 |
| 220 °C | 25 | 130 | 34 | 72 | 39 | 68 | 52 | 38 |
| 250 °C | 25 | 126 | 33 | 85 | 37 | 80 | 48 | 37 |


