
Durability of Pultruded GFRP through Ten-Year Outdoor Exposure Test


Abstract
:
1. Introduction
2. Experimental Section
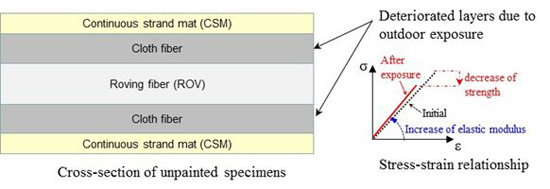
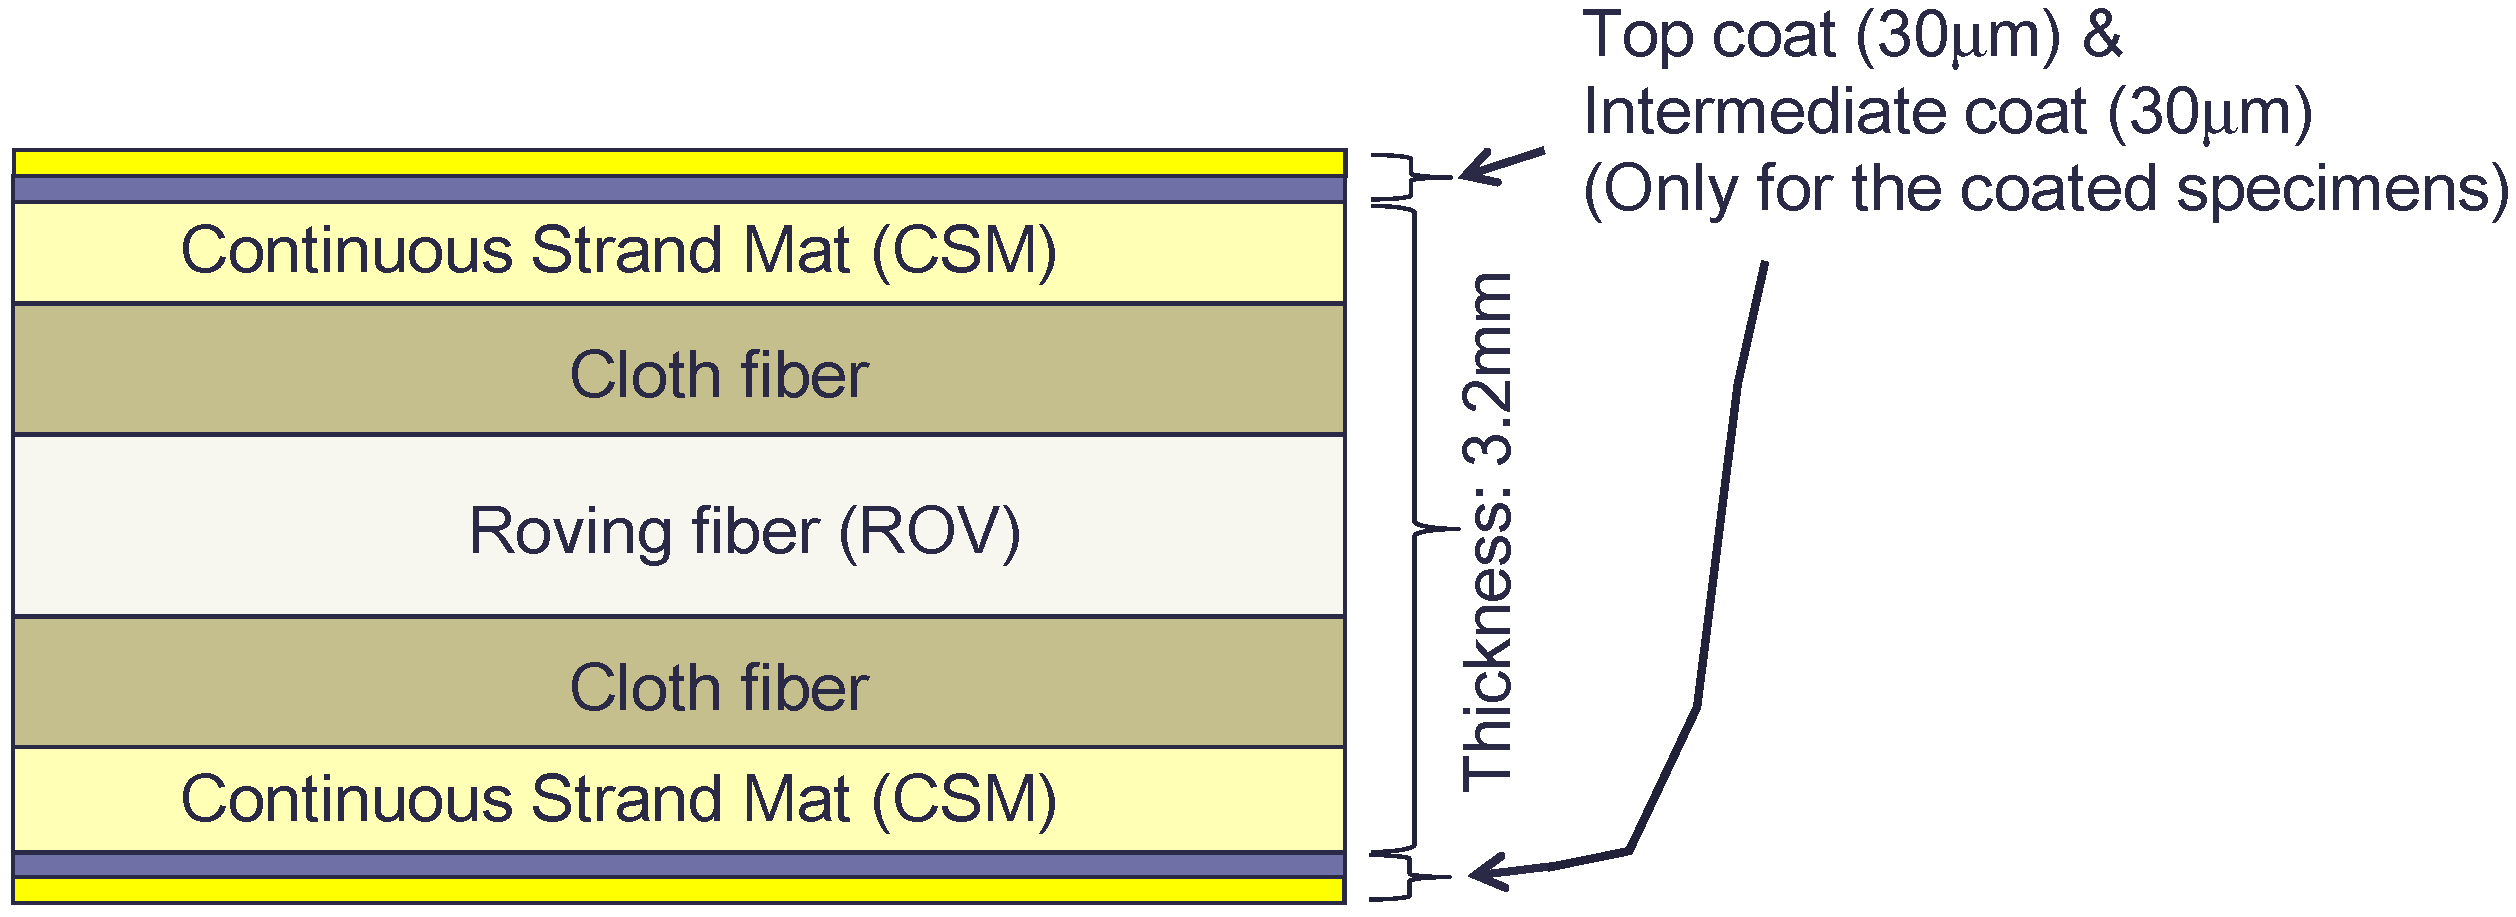
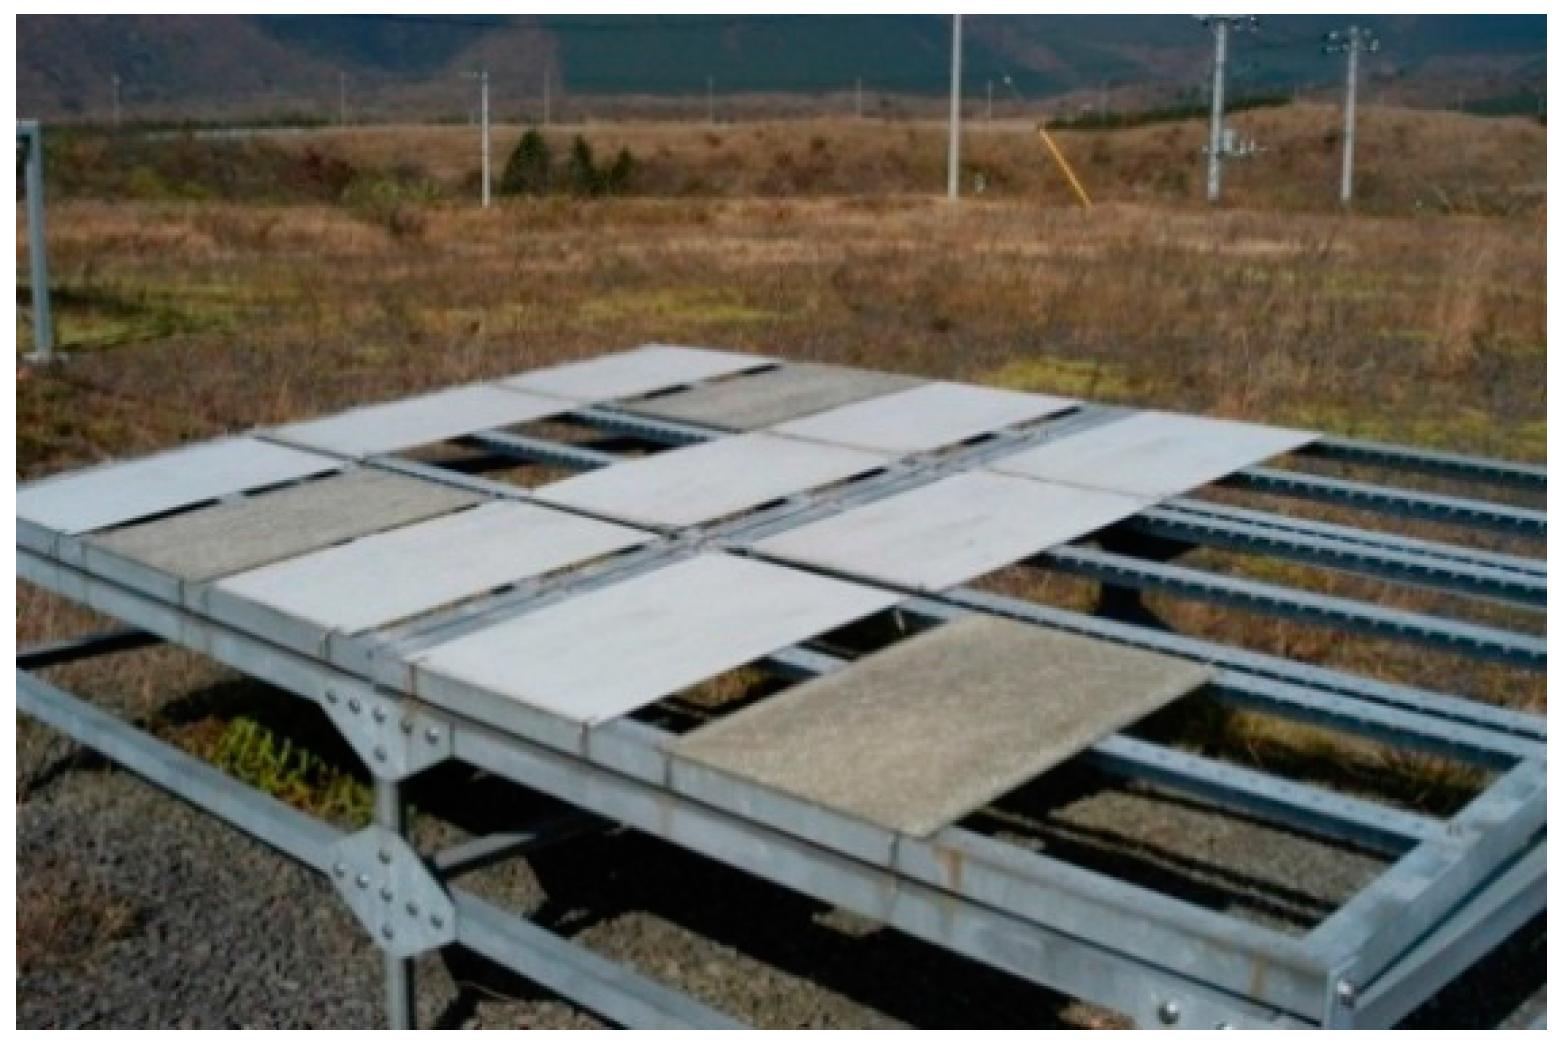
2.1. Specimen


| Code | Vf (%) | Layer System and Fiber Type (the Values Show the Volume Fiber Content Ratio of the Corresponding Layer in Volume Fraction) |
|---|---|---|
| R43 | 43 | CSM 9.5%/Cloth 19%/ROV 43%/Cloth 19%/CSM 9.5% |
| R26 | 39 | CSM 16%/Cloth 21.5%/ROV 26%/Cloth 21.5%/CSM 16% |
| R12 | 36 | CSM 21%/Cloth 23%/ROV 12%/Cloth 23%/CSM 21% |


| Mechanical Properties | Glass Fiber | Continuous Strand Mat (CSM) | Matrix Resin |
|---|---|---|---|
| Tensile modulus (GPa) | 75 | 26.9 | 1.875 |
| Tensile strength (MPa) | 2,500 | 188.5 | 62.5 |
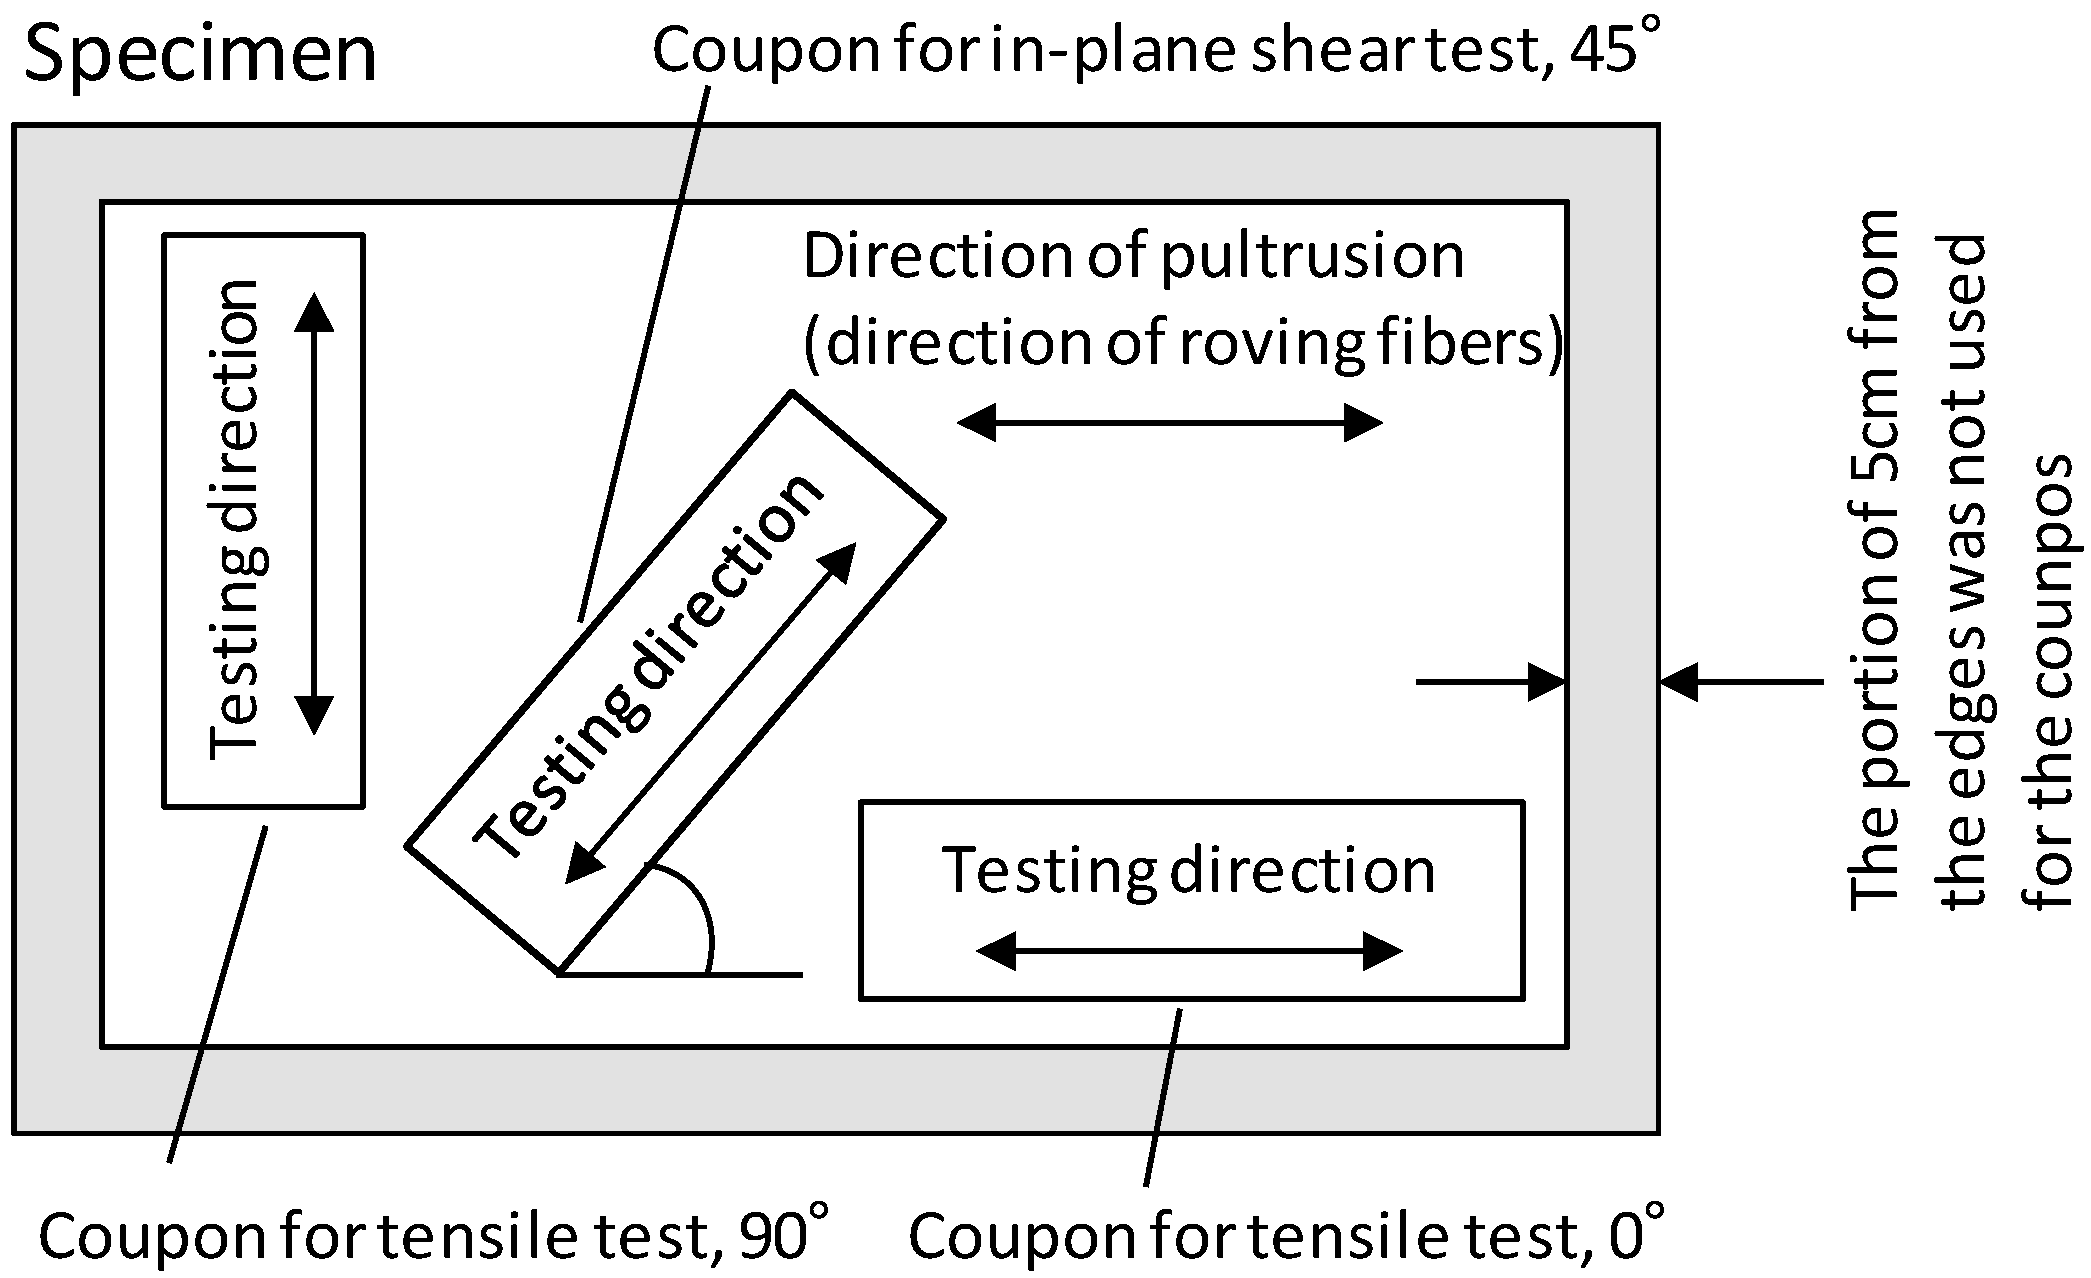
2.2. Testing Method

3. Results and Discussions
3.1. Unpainted Specimens
| Testing Direction | Code | 0 Years (MPa); Coefficient of Variation, CV | Calculated Value (K = 1), (MPa) | Experiment/Calculation |
|---|---|---|---|---|
| 0° | R43 | 409.6; CVts: 21.0% | 717.5 | 0.571 |
| R26 | 369.0; CVts: 3.6% | 524.8 | 0.703 | |
| R12 | 319.2; CVts: 4.6% | 383.5 | 0.832 | |
| 90° | R43 | 135.8; CVts: 2.6% | 255.3 | 0.532 |
| R26 | 165.8; CVts: 4.3% | 271.3 | 0.611 | |
| R12 | 156.2; CVts: 3.4% | 275.5 | 0.567 |
| Testing Direction | Code | Strength (MPa); coefficient of variation, CV | Retention Ratio, Rrs | |||
|---|---|---|---|---|---|---|
| 0 Years | 1 Year | 10 Years | 1 Year | 10 Years | ||
| 0° | R43 | 409.6; CVts: 21.0% | 473.7; CVts: 3.9% | 440.1; CVts: 3.6% | 1.16 | 1.07 |
| R26 | 369.0; CVts: 3.6% | 370.7; CVts: 4.3% | 307.1; CVts: 4.0% | 1.00 | 0.83 | |
| R12 | 319.2; CVts: 4.6% | 309.2; CVts: 6.2% | 266.3; CVts: 7.8% | 0.97 | 0.83 | |
| 90° | R43 | 135.8; CVts: 2.6% | 134.1; CVts: 1.0% | 104.2; CVts: 3.9% | 0.99 | 0.77 |
| R26 | 165.8; CVts: 4.3% | 150.6; CVts: 5.0% | 115.4; CVts: 4.1% | 0.91 | 0.70 | |
| R12 | 156.2; CVts: 3.4% | 152.6; CVts: 2.7% | 119.8; CVts: 2.6% | 0.98 | 0.77 | |
| 45° (In-plane shear) | R43 | 52.6; CVss: 3.4% | 53.1; CVss: 2.4% | 40.4; CVss: 5.0% | 1.01 | 0.77 |
| R26 | 56.9; CVss: 0.8% | 62.1; CVss: 3.1% | 41.7; CVss: 2.3% | 1.09 | 0.73 | |
| R12 | 58.0; CVss: 4.5% | 58.0; CVss: 3.0% | 38.9; CVss: 2.1% | 1.00 | 0.67 | |
| Testing Direction | Code | Contribution Ratio of Each Layer (%) | |||
|---|---|---|---|---|---|
| RCSM, CSM | Rcloth Plain Woven Cloth | Rrov, Roving | Rm, Matrix | ||
| 0° | R43 | 2.1 | 28.5 | 64.4 | 5.0 |
| R26 | 4.5 | 39.9 | 48.3 | 7.3 | |
| R12 | 7.4 | 54.0 | 28.2 | 10.4 | |
| 90° | R43 | 6.0 | 80.0 | 0.0 | 14.0 |
| R26 | 8.7 | 77.3 | 0.0 | 14.1 | |
| R12 | 10.3 | 75.1 | 0.0 | 14.5 | |
| Testing Direction | Code | Elastic Modulus (GPa); Coefficient of Variation, CV | Retention Ratio, Rrm | |||
|---|---|---|---|---|---|---|
| 0 Years | 1 Year | 10 Years | 1 Year | 10 Years | ||
| 0° | R43 | 20.9; CVtm: 12.3% | 25.0; CVtm: 3.2% | 26.9; CVtm: 5.2% | 1.20 | 1.29 |
| R26 | 19.2; CVtm: 4.3% | 20.5; CVtm: 2.0% | 20.2; CVtm: 2.5% | 1.07 | 1.05 | |
| R12 | 17.9; CVtm: 2.5% | 19.0; CVtm: 3.5% | 18.7; CVtm: 5.8% | 1.06 | 1.04 | |
| 90° | R43 | 12.5; CVtm: 2.5% | 13.4; CVtm: 1.4% | 13.4; CVtm: 1.4% | 1.07 | 1.07 |
| R26 | 12.9; CVtm: 4.0% | 13.6; CVtm: 1.1% | 13.9; CVtm: 2.1% | 1.06 | 1.07 | |
| R12 | 12.8; CVtm: 2.3% | 14.3; CVtm: 1.1% | 13.4; CVtm: 2.1% | 1.12 | 1.05 | |
| 45° (In-plane shear modulus) | R43 | 3.40; CVsm: 3.4% | 4.05; CVsm: 2.8% | 4.01; CVsm: 2.9% | 1.19 | 1.18 |
| R26 | 3.76; CVsm: 1.7% | 4.17; CVsm: 1.6% | 3.80; CVsm: 1.4% | 1.11 | 1.01 | |
| R12 | 3.49; CVsm: 2.9% | 4.10; CVsm: 4.6% | 3.80; CVsm: 2.7% | 1.17 | 1.09 | |

3.2. Painted Specimens
| Testing Direction | Code | Tensile Strength (MPa); Coefficient of Variation, CV | Retention Ratio, Rrs | |||
|---|---|---|---|---|---|---|
| 0 Years | 1 Year | 10 Years | 1 Year | 10 Years | ||
| 0° | R43 | 409.6; CVts: 21.0% | 496.7; CVts: 3.3% | 488.0; CVts: 2.6% | 1.21 | 1.19 |
| R26 | 369.0; CVts: 3.6% | 372.4; CVts: 3.1% | 316.4; CVts: 4.9% | 1.01 | 0.86 | |
| R12 | 319.2; CVts: 4.6% | 330.5; CVts: 10.7% | 323.8; CVts: 6.7% | 1.04 | 1.01 | |
| 90° | R43 | 135.8; CVts: 2.6% | 140.9; CVts: 6.3% | 140.9; CVts: 3.3% | 1.04 | 1.04 |
| R26 | 165.8; CVts: 4.3% | 152.1; CVts: 2.9% | 162.1; CVts: 2.1% | 0.92 | 0.98 | |
| R12 | 156.2; CVts: 3.4% | 158.5; CVts: 3.0% | 150.8; CVts: 2.4% | 1.01 | 0.97 | |
| 45° (In-plane shear) | R43 | 52.6; CVss: 3.4% | 50.1; CVss: 2.0% | 49.0; CVss: 0.5% | 0.95 | 0.93 |
| R26 | 56.9; CVss: 0.8% | 64.6; CVss: 3.0% | 70.8; CVss: 2.5% | 1.13 | 1.24 | |
| R12 | 58.0; CVss: 4.5% | 57.6; CVss: 2.6% | 58.9; CVss: 1.2% | 0.99 | 1.02 | |
| Testing Direction | Code | Elastic Modulus (GPa); Coefficient of Variation, CV | Retention Ratio, Rrm | |||
|---|---|---|---|---|---|---|
| 0 Years | 1 Year | 10 Years | 1 Year | 10 Years | ||
| 0° | R43 | 20.9; CVtm: 12.3% | 25.0; CVtm: 3.8% | 25.2; CVtm: 3.4% | 1.20 | 1.21 |
| R26 | 19.2; CVtm: 4.3% | 20.7; CVtm: 2.0% | 18.5; CVtm: 4.3% | 1.08 | 0.96 | |
| R12 | 17.9; CVtm: 2.5% | 19.5; CVtm: 7.9% | 19.0; CVtm: 4.4% | 1.09 | 1.06 | |
| 90° | R43 | 12.5; CVtm: 2.5% | 13.1; CVtm: 2.5% | 13.8; CVtm: 1.8% | 1.05 | 1.10 |
| R26 | 12.9; CVtm: 4.0% | 11.5; CVtm: 4.3% | 14.0; CVtm: 3.1% | 0.89 | 1.08 | |
| R12 | 12.8; CVtm: 2.3% | 13.8; CVtm: 2.6% | 13.7; CVtm: 1.7% | 1.08 | 1.07 | |
| 45° (In-plane shear) | R43 | 3.40; CVsm: 3.4% | 4.03; CVsm: 3.7% | 3.99; CVsm: 2.6% | 1.19 | 1.17 |
| R26 | 3.76; CVsm: 1.7% | 4.49; CVsm: 7.7% | 4.44; CVsm: 5.0% | 1.19 | 1.18 | |
| R12 | 3.49; CVsm: 2.9% | 4.11; CVsm: 1.8% | 4.12; CVsm: 3.3% | 1.18 | 1.18 | |

4. Conclusions
Acknowledgments
Author Contributions
Conflicts of Interest
References
- Bulmanis, V.N.; Urzhumtsev, V.S. Effect of Cold Climate Factors on Strength and Durability of Structural Fiberglass Composites. In ICCM & ECCM: Sixth International Conference on Composite Materials and Second European Conference on Composite Materials; Elsevier Applied Science: London, United Kingdom, 1987; Volume 4, pp. 4.457–4.466. [Google Scholar]
- Chin, J.W.; Nguyen, T.; Aouadi, K. Effects of environmental exposure on fiber-reinforced plastics (FRP) materials used in construction. J. Compos. Technol. Res. 1997, 19, 205–213. [Google Scholar]
- Gentry, T.R.; Bank, L.C.; Barkatt, A.; Prian, L. Accelerated test methods to determine the long-term behavior of composite highway structures subject to environmental loading. J. Compos. Technol. Res. 1998, 20, 38–50. [Google Scholar]
- Sridharan, S.; Zureick, A.-H.; Muzzy, J.D. Effect of hot-wet environments on e-glass/vinylester composites. In Proceedings of the 56th Society of Plastics Engineers, Annual Technical Conference, Atlanta, GA, USA, 26 April–1 May 1998; Volume 56, pp. 2255–2259.
- Verghese, K.N.E.; Hayes, M.D.; Garcia, K.; Carrier, C.; Wood, J.; Riffle, J.R.; Lesko, J.J. Influence of matrix chemistry on the short term hydrothermal aging of vinyl ester matrix and composites under both isothermal and thermal spiking conditions. J. Compos. Mater. 1999, 33, 1918–1938. [Google Scholar] [CrossRef]
- Kim, Y.H.; Trejo, D.; Gardoni, P. Time-variant reliability analysis and flexural design of GFRP-reinforced bridge decks. J. Compos. Constr. 2012, 16, 359–370. [Google Scholar] [CrossRef]
- Gardoni, P.; Trejo, D.; Kim, Y.H. Time-variant strength capacity model for GFRP bars embedded in concrete. ASCE J. Eng. Mech. 2013, 139, 1435–1445. [Google Scholar]
- Eskim, E.A.; Kolesnik, K.I.; Petrov, A.S.; Startsev, O.V.; Meletov, V.P. Некоторые оϲобенноϲти изменения физико-механицеских свойств материала типа ССТФ при старении в усповиях впажных субтропиков. Probl. Prochnosti 1982, 10, 91–96. (In Russian) [Google Scholar]
- Cope, R.; Revirand, G. Short term weathering of polymeric materials. Durab. Build. Mater. 1983, 1, 225–240. [Google Scholar]
- Martin, K.G.; Sasnaitis, I. Assessment of deterioration of translucent plastics building sheets after weathering. Durab. Build. Mater. 1986, 3, 233–253. [Google Scholar]
- Nishizaki, I.; Kishima, T.; Sasaki, I. Deterioration of mechanical properties of pultruded FRP through exposure tests. In Proceedings of the Third International Conference on Durability and Field Applications of Fibre Reinforced Polymer (FRP) Composites for Construction (CDCC2007), Quebec City, Que., Canada, May 23–25 2007; pp. 159–166.
- Uemura, M.; Somiya, S.; Yamatsuta, K.; Noguchi, K.; Onitsuka, T.; Honma, S.; Miyairi, Y.; Tanaka, K.; Kubota, I.; Nishimoto, T.; et al. FRP Structural Design Handbook; The Japan Reinforced Plastics Society: Tokyo, Japan, 1994; p. 31. (In Japanese) [Google Scholar]
- Nishizaki, I.; Meiarashi, S. Long-term deterioration of GFRP in water and moist environment. J. Compos. Constr. 2002, 6, 21–27. [Google Scholar] [CrossRef]
- Jiang, X.; Kolstein, H.; Bijlaard, F.S.K. Moisture diffusion and hygrothermal aging in pultruded fibre reinforced polymer composites of bridge decks. Mater. Des. 2012, 37, 304–312. [Google Scholar] [CrossRef]
© 2015 by the authors; licensee MDPI, Basel, Switzerland. This article is an open access article distributed under the terms and conditions of the Creative Commons by Attribution (CC-BY) license (http://creativecommons.org/licenses/by/4.0/).
Share and Cite
Nishizaki, I.; Sakuraba, H.; Tomiyama, T. Durability of Pultruded GFRP through Ten-Year Outdoor Exposure Test. Polymers 2015, 7, 2494-2503. https://doi.org/10.3390/polym7121525
Nishizaki I, Sakuraba H, Tomiyama T. Durability of Pultruded GFRP through Ten-Year Outdoor Exposure Test. Polymers. 2015; 7(12):2494-2503. https://doi.org/10.3390/polym7121525
Chicago/Turabian StyleNishizaki, Itaru, Hiroki Sakuraba, and Tomonori Tomiyama. 2015. "Durability of Pultruded GFRP through Ten-Year Outdoor Exposure Test" Polymers 7, no. 12: 2494-2503. https://doi.org/10.3390/polym7121525