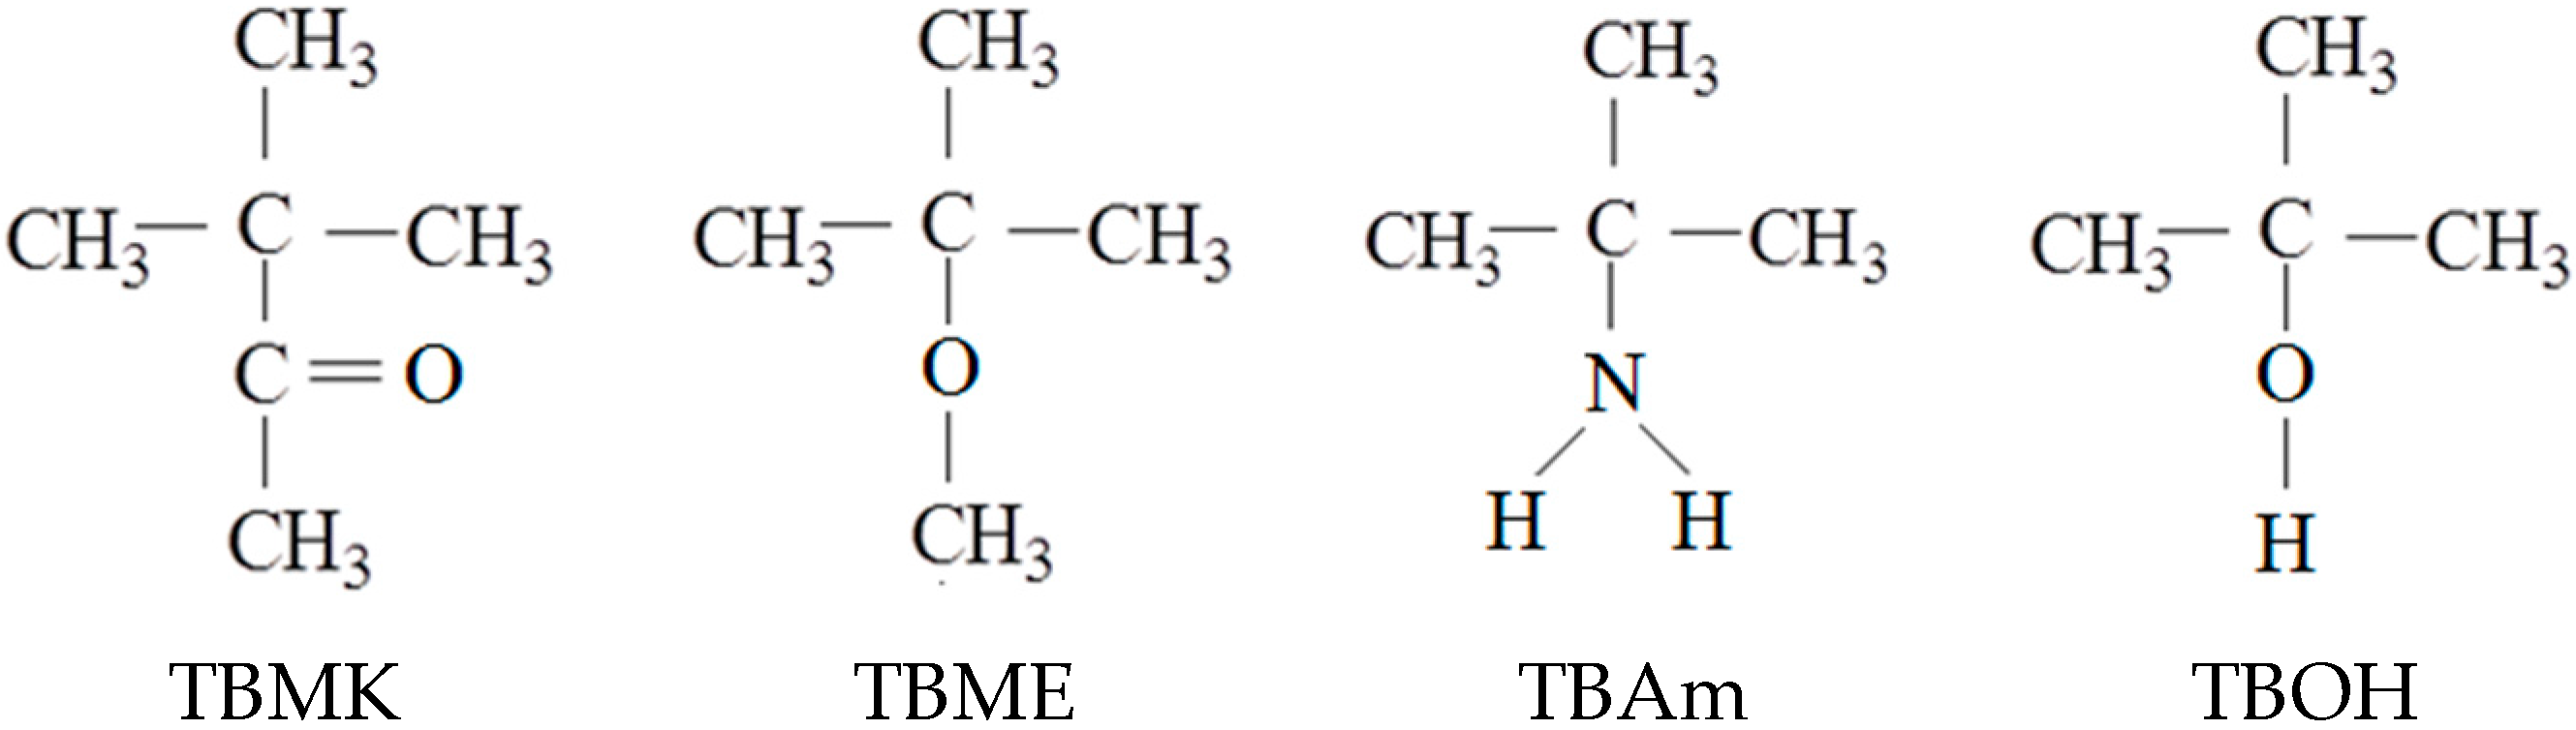
3.1. Influence of Additives on the Phase Transition
The intensity and shape of the polymer, additive, and water HDO signals in NMR spectra vary with temperature. The polymer signal vanishes from the high-resolution NMR spectra because of broadening (often extreme) of the polymer peak due to the restriction in the mobility of polymer chains upon formation of the solid-like globules [
5,
11].
Figure 2 shows
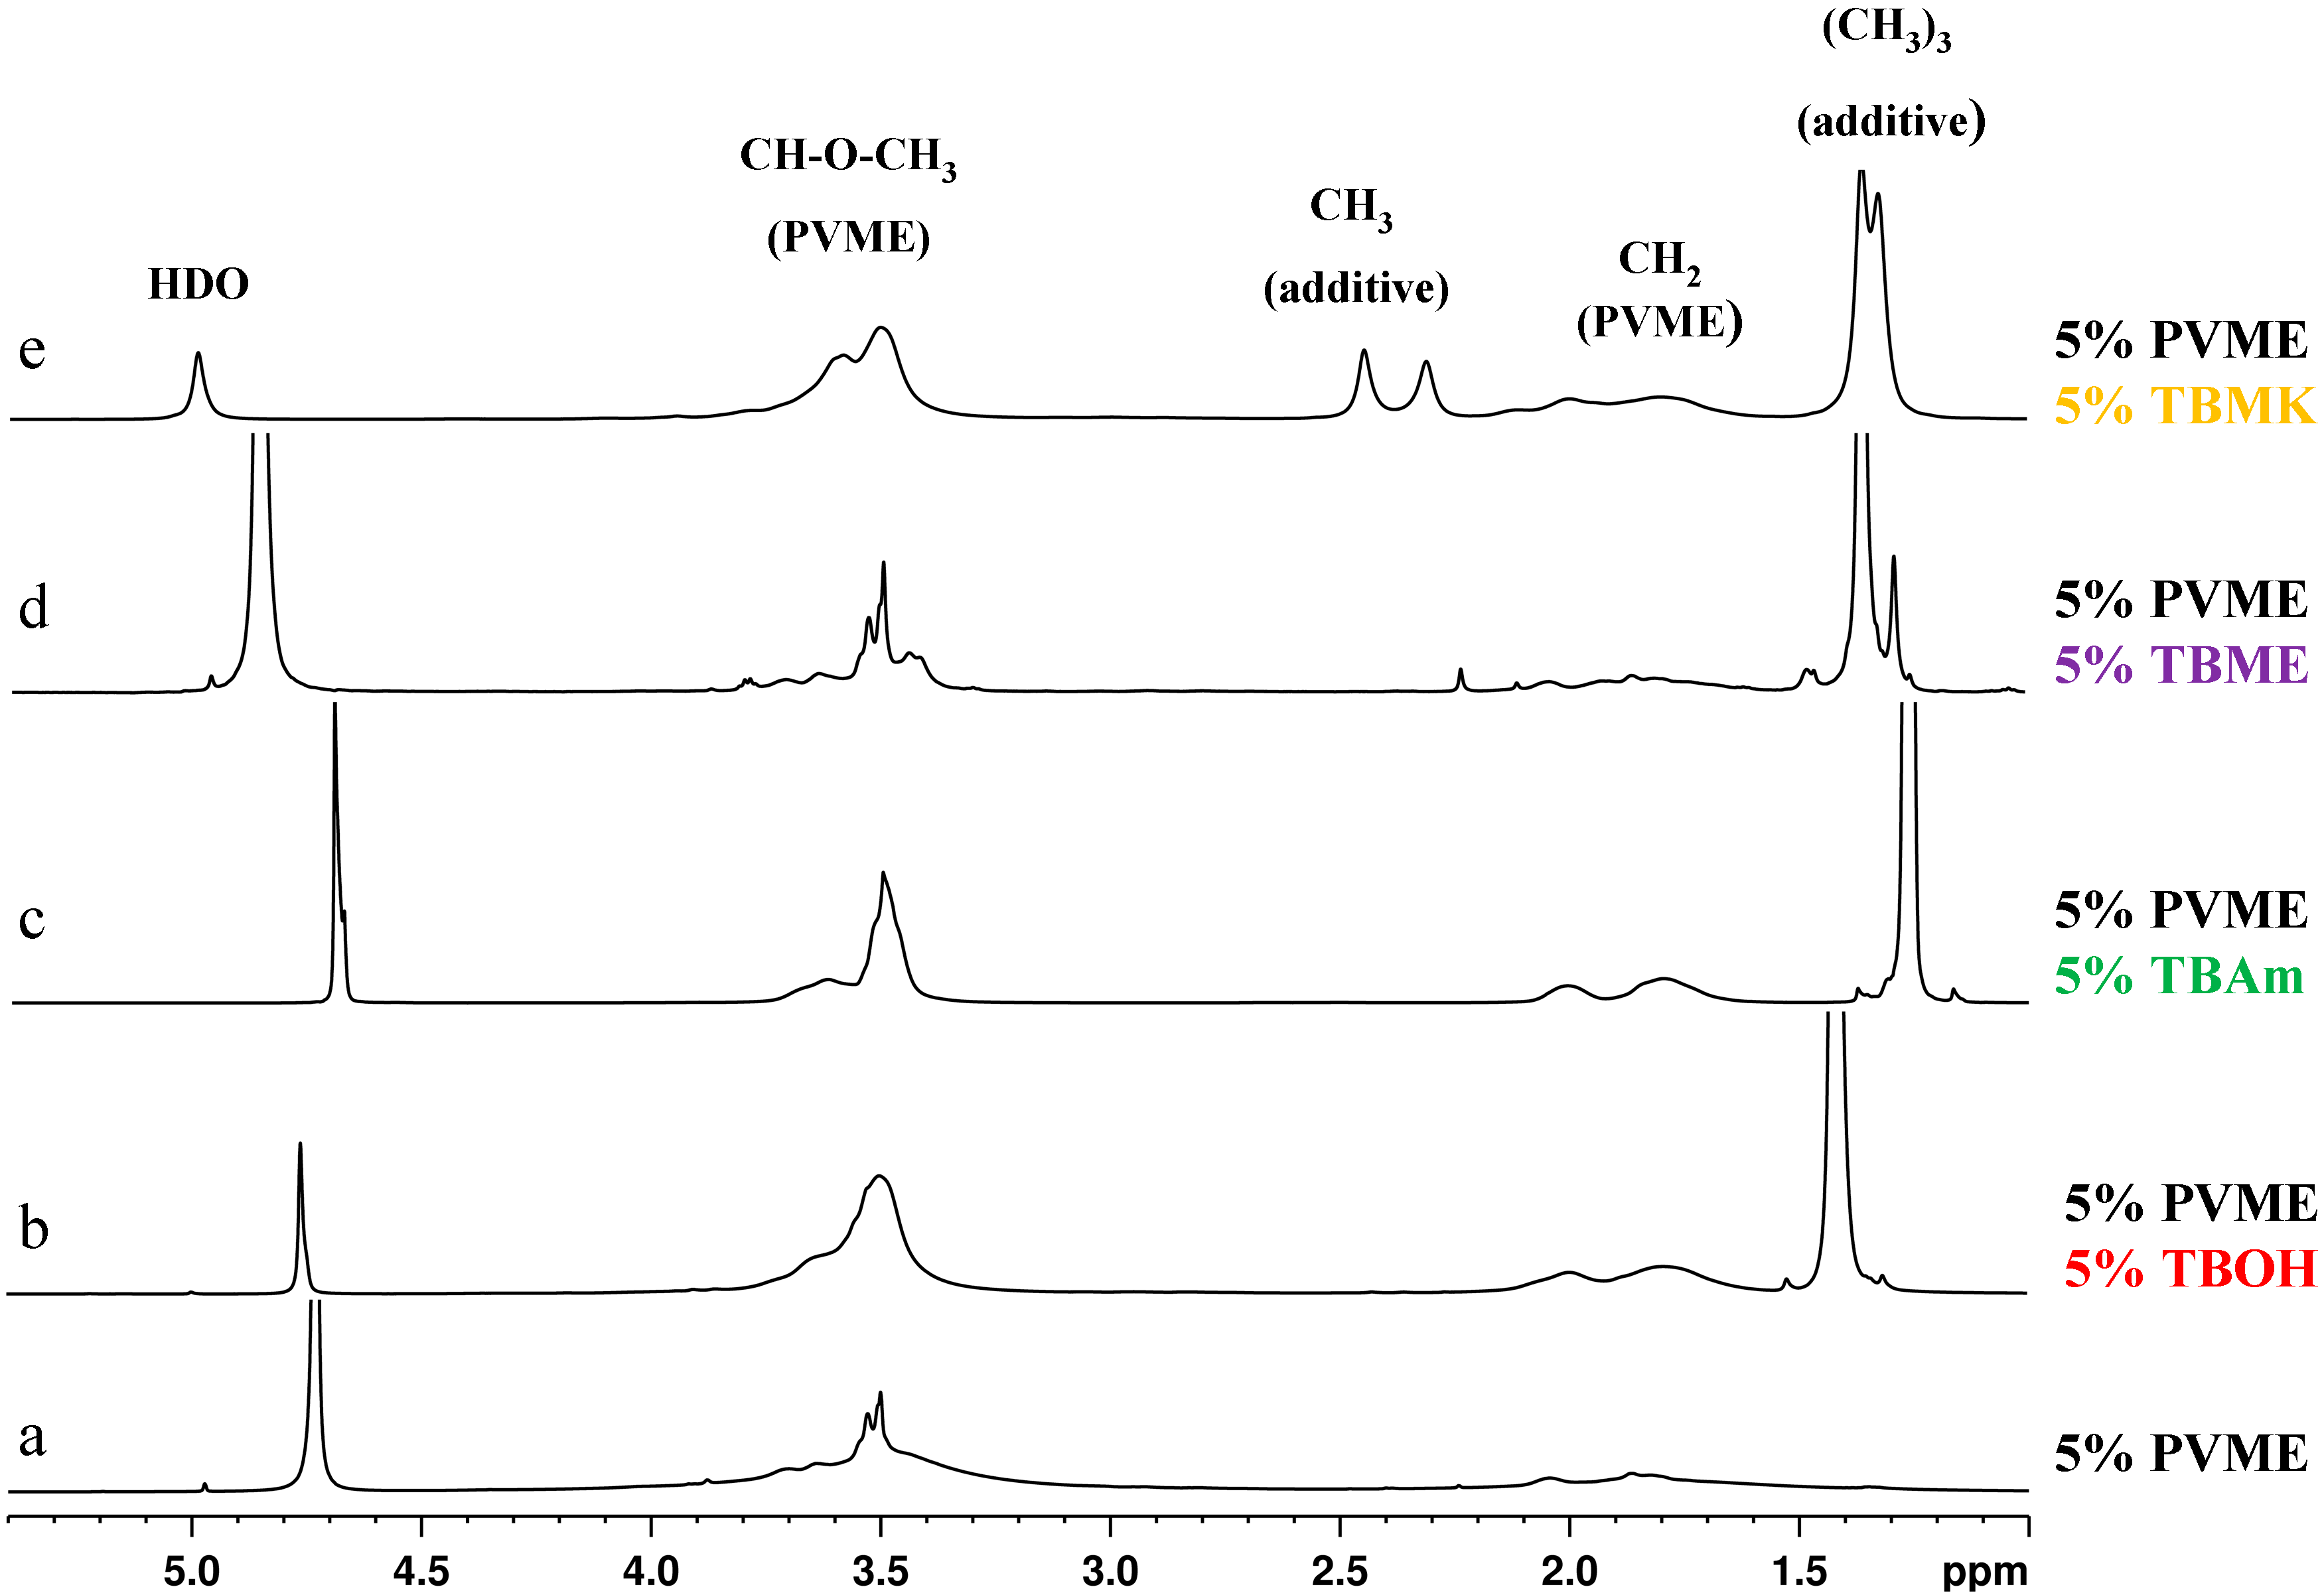
1H NMR spectra as detected for the neat PVME solution and solutions of PVME with additives at temperatures above the transition of each particular system. The shapes of the peaks in the spectra are different for individual additives and for the pure PVME solution.
We can distinguish two types of polymer peaks [
5]. The first type corresponds to flexible polymer segments which are not involved in compact globular structures (the narrow part of the CH
3O peak at 3.5 ppm in spectrum a,
Figure 2). The second type is assigned to the major part of polymer units which form solid-like globular structures (the broad part of the same peak from 4 to 5 ppm). The presence of additives strongly affects the shape of both polymer band components. As shown in
Figure 2, the signal of the units in globular structures is extremely broadened, so it is no longer visible in the spectra (spectra in
Figure 2b–e); this disappearance suggests that the polymer units involved in globules formed in solutions with additives show higher immobilization in comparison with collapsed units in the solution of neat PVME. Further, it follows from
Figure 2 that the shape of NMR signal corresponding to PVME group CHOCH
3 depends on the additive. The solution with TBME shows quite narrow CHOCH
3 peak whereas, for solutions with others additives, this peak broadens.
Figure 2.
High-resolution 1H NMR spectra of D2O solutions of neat PVME (cP = 5 wt %) (a); and solutions with additives TBOH (b); TBAm (c); TBME (d); and TBMK (e) (cP = 5 wt %, cad = 5 wt %) measured at temperatures above the transition of each particular system.
Figure 2.
High-resolution 1H NMR spectra of D2O solutions of neat PVME (cP = 5 wt %) (a); and solutions with additives TBOH (b); TBAm (c); TBME (d); and TBMK (e) (cP = 5 wt %, cad = 5 wt %) measured at temperatures above the transition of each particular system.
For further analysis, we shall define the phase separated fraction as the fraction of PVME units in concentrated, polymer-rich phase. We have determined the values of the fraction of phase-separated PVME units from the following relation
where
I is the integrated intensity of the given polymer line in a partly phase-separated system and
I0 is the integrated intensity of this line if no phase separation occurs [
11,
23].
Temperature dependences of the fraction
p as obtained from integrated intensities of CHOCH
3 protons of PVME are shown for neat PVME solution (
cP = 5 wt %) and PVME solutions with
cad = 5 wt % in
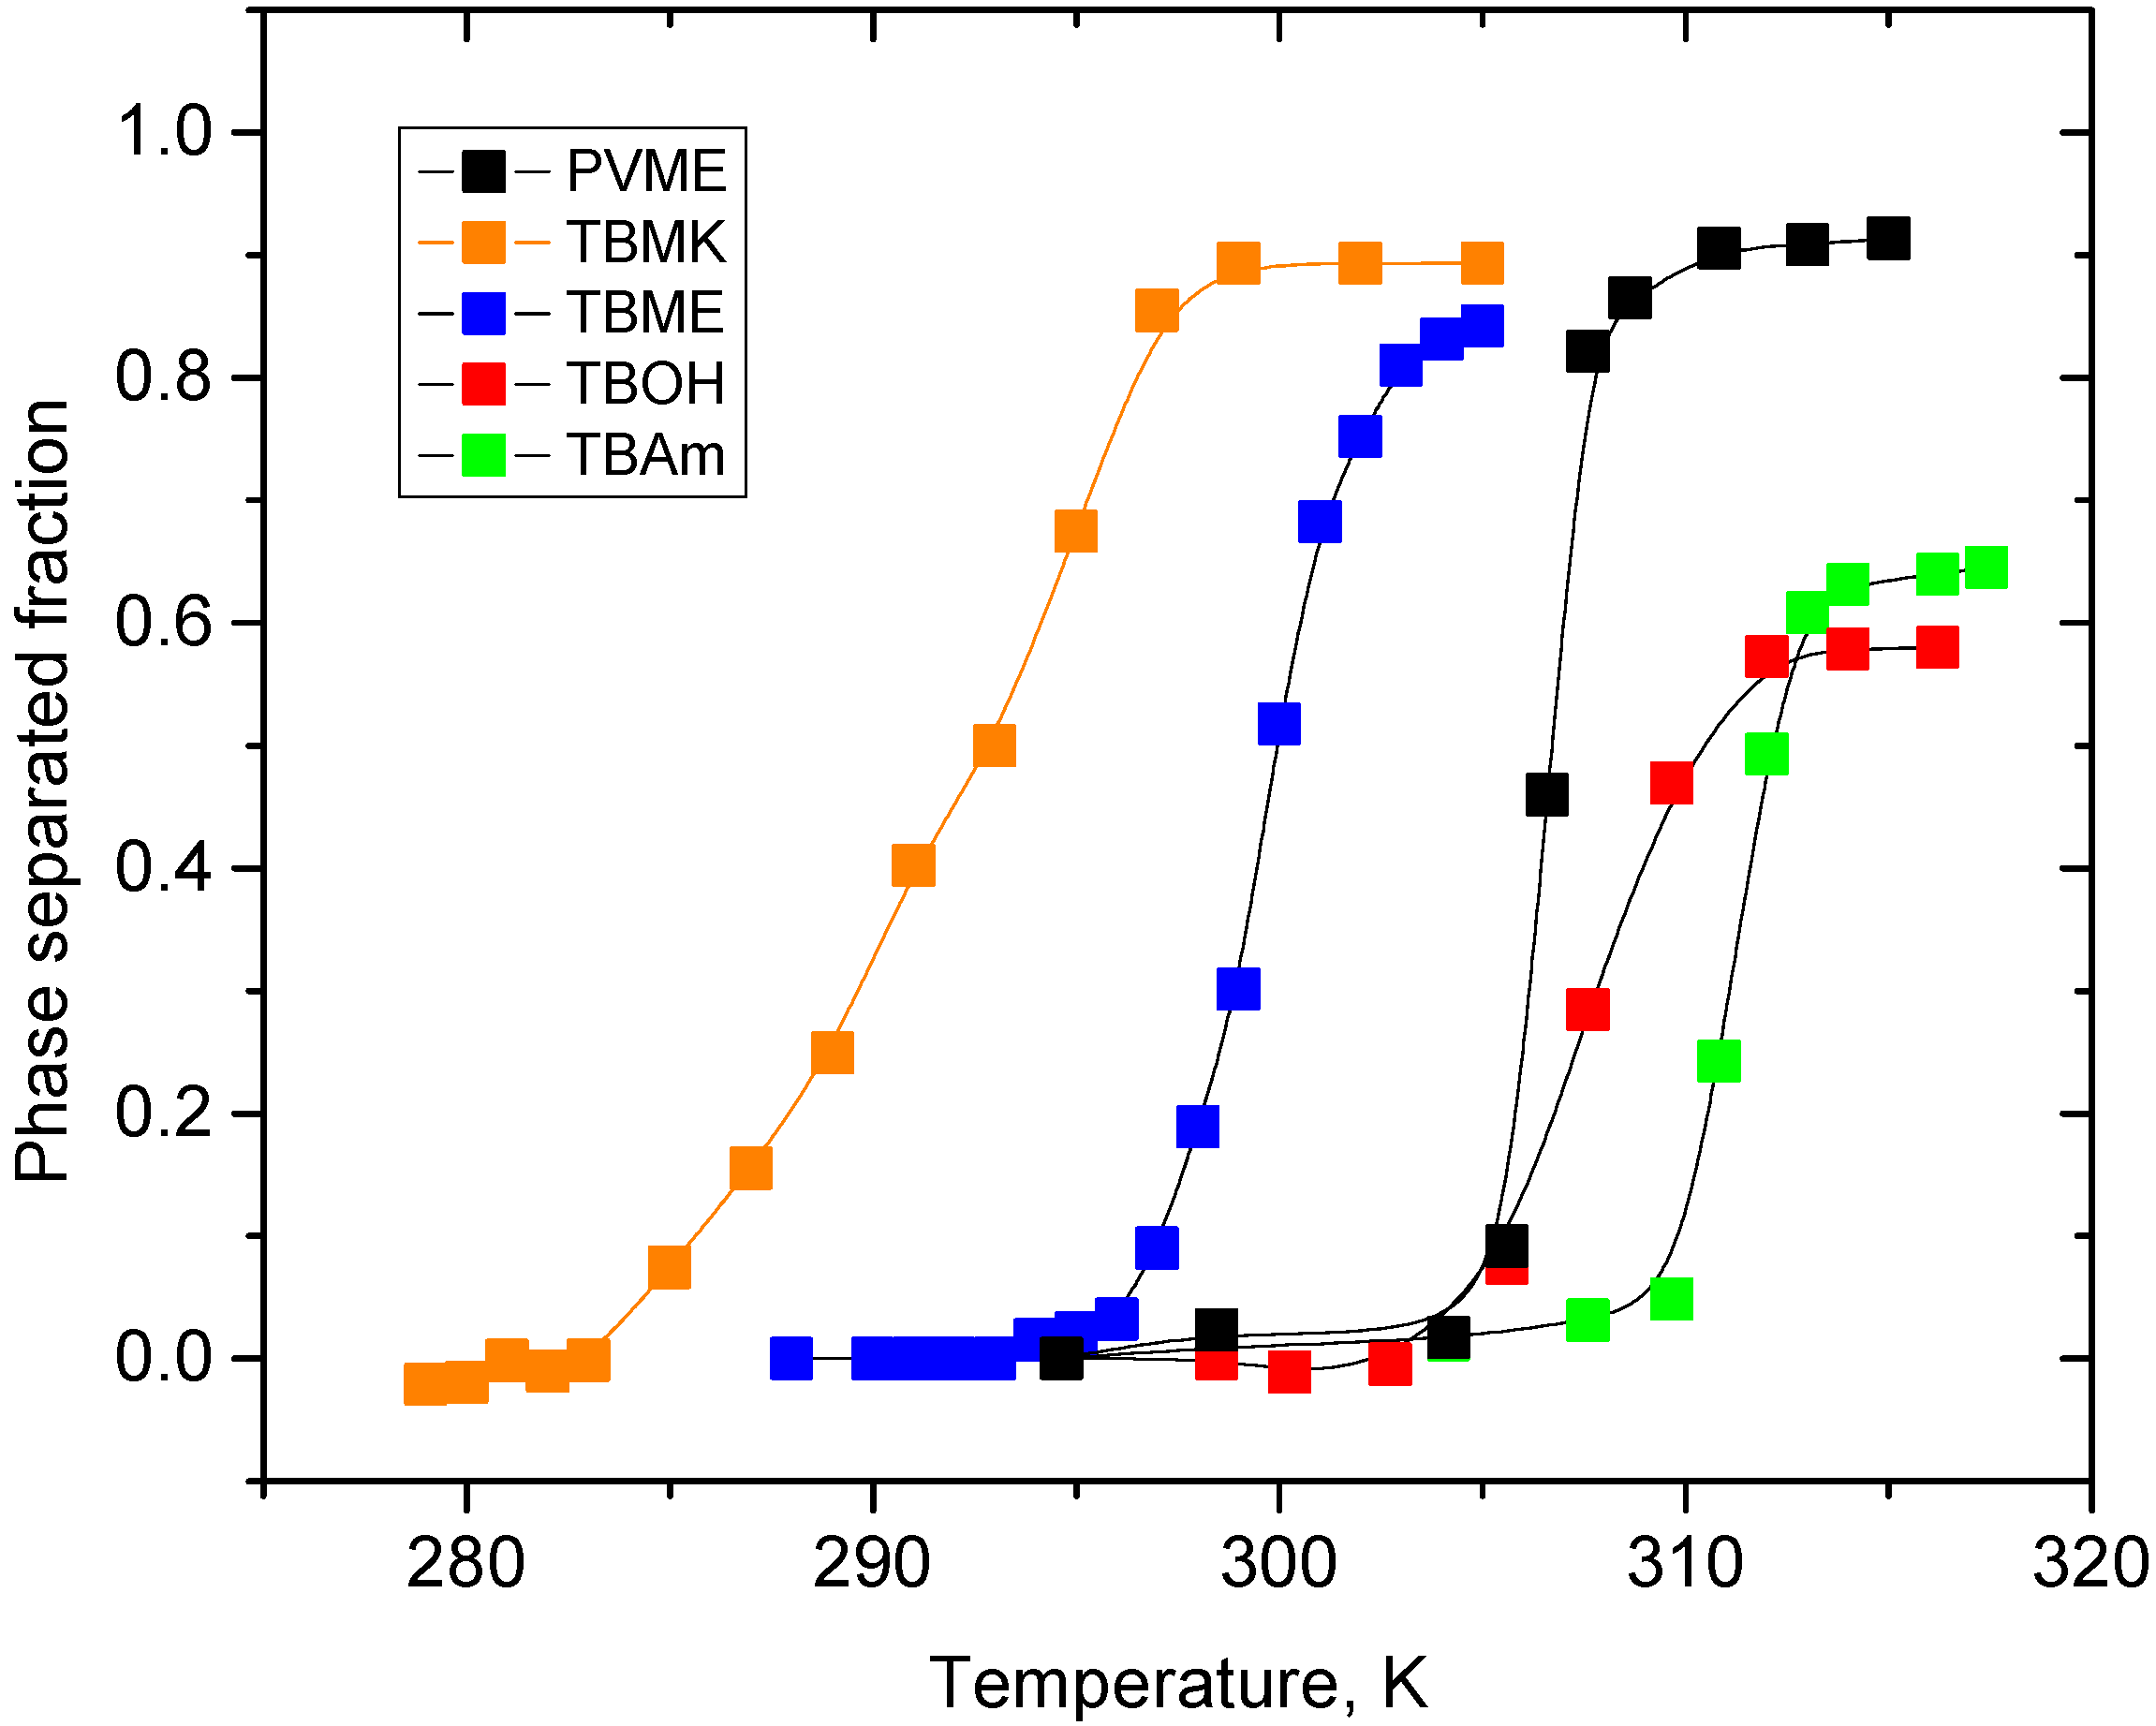
Figure 3. For all polymer and additive concentrations investigated, the solutions show a qualitatively similar behavior of the polymer CHOCH
3 proton intensities. From
Figure 3 it follows that all solutions with additives exhibit broader transition region than the solution with neat PVME; this effect is the most significant in PVME/TBMK solution where the transition is ~12 K broad. Transition temperature was detected as the temperature in the middle of the transition,
i.e., where the signal has decreased by 50%.
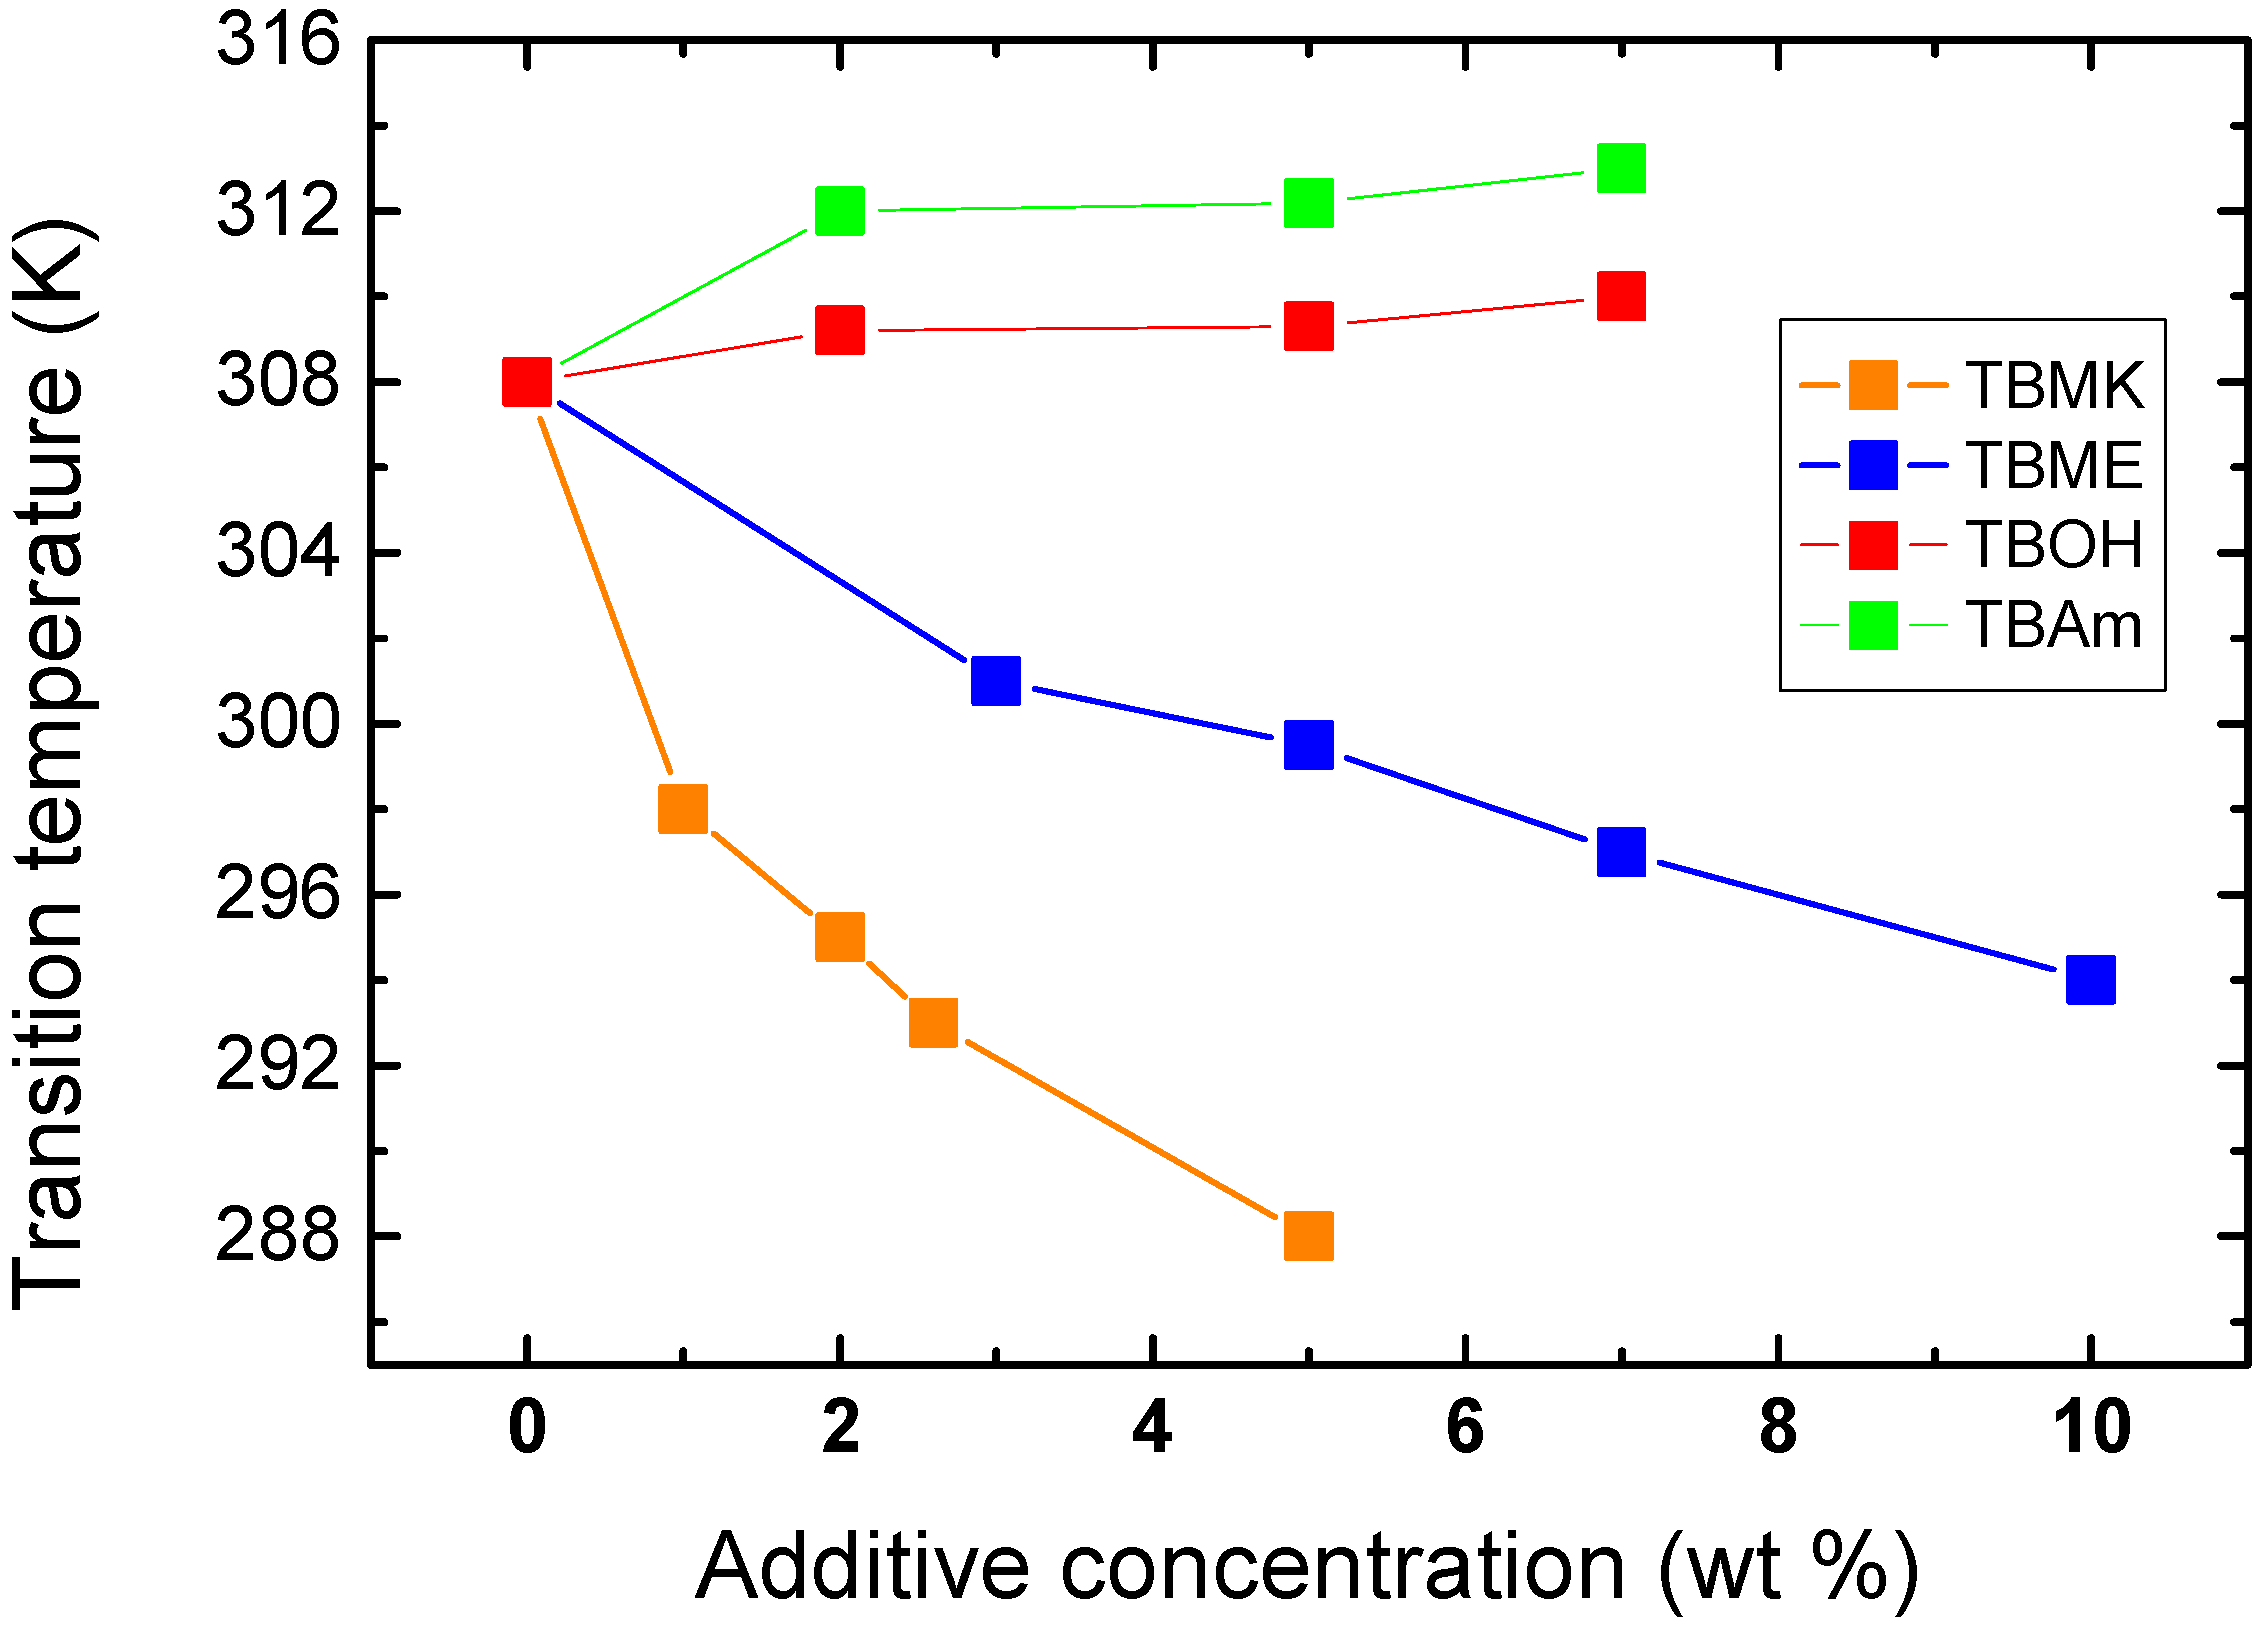
Figure 4 shows the dependence of transition temperature on additive concentration for solutions with
cP = 5 wt %. For TBAm and TBOH, increasing concentration was observed to lead to a slight shift of transition temperature to higher values; at the same time the transition extent (fraction
p above the transition in
Figure 3) decreases as compared with the neat PVME. TBAm and TBOH molecules obviously stabilize polymer-solvent interactions and prevent hydrophobic polymer-polymer interactions. Such stabilizing effect was detected in aqueous solutions of PVME and lower molecular weight alcohols [
15,
18,
22].
Figure 3.
Temperature dependences of the fraction p as obtained from integrated intensities of CHOCH3 protons of PVME in neat PVME solution (cP = 5 wt % in D2O) and PVME/additives solutions (cP = 5 wt %, cad = 5 wt % in D2O).
Figure 3.
Temperature dependences of the fraction p as obtained from integrated intensities of CHOCH3 protons of PVME in neat PVME solution (cP = 5 wt % in D2O) and PVME/additives solutions (cP = 5 wt %, cad = 5 wt % in D2O).
Figure 4.
Concentration dependence of the transition temperature for PVME/additives solutions (cP = 5 wt % PVME in D2O).
Figure 4.
Concentration dependence of the transition temperature for PVME/additives solutions (cP = 5 wt % PVME in D2O).
On the other hand, increasing the concentration of the additives TBMK and TBME in the system promotes destabilization of the hydration structure surrounding the polymer chain; increasing this concentration significantly decreases the transition temperature. As shown in
Figure 4, this effect is more pronounced for TBMK. The presence of the ether additive only results in changes of the transition temperature, and no broadening of the transition region was observed. Similarly as TBMK and TBME, higher alcohols, and simple inorganic salts tend to destabilize the structure,
i.e., lead to lower transition temperatures in aqueous solutions of PVME [
18]. The values of fraction
p above the transition in PVME/TBMK and PVME/TBME solutions reach ~0.9 similarly as the values in neat PVME solution. We assume that the remaining minority mobile component (~10%), which does not take part in the phase transition, comes from low-molecular weight oligomers as it was shown for PVME/D
2O solutions [
24].
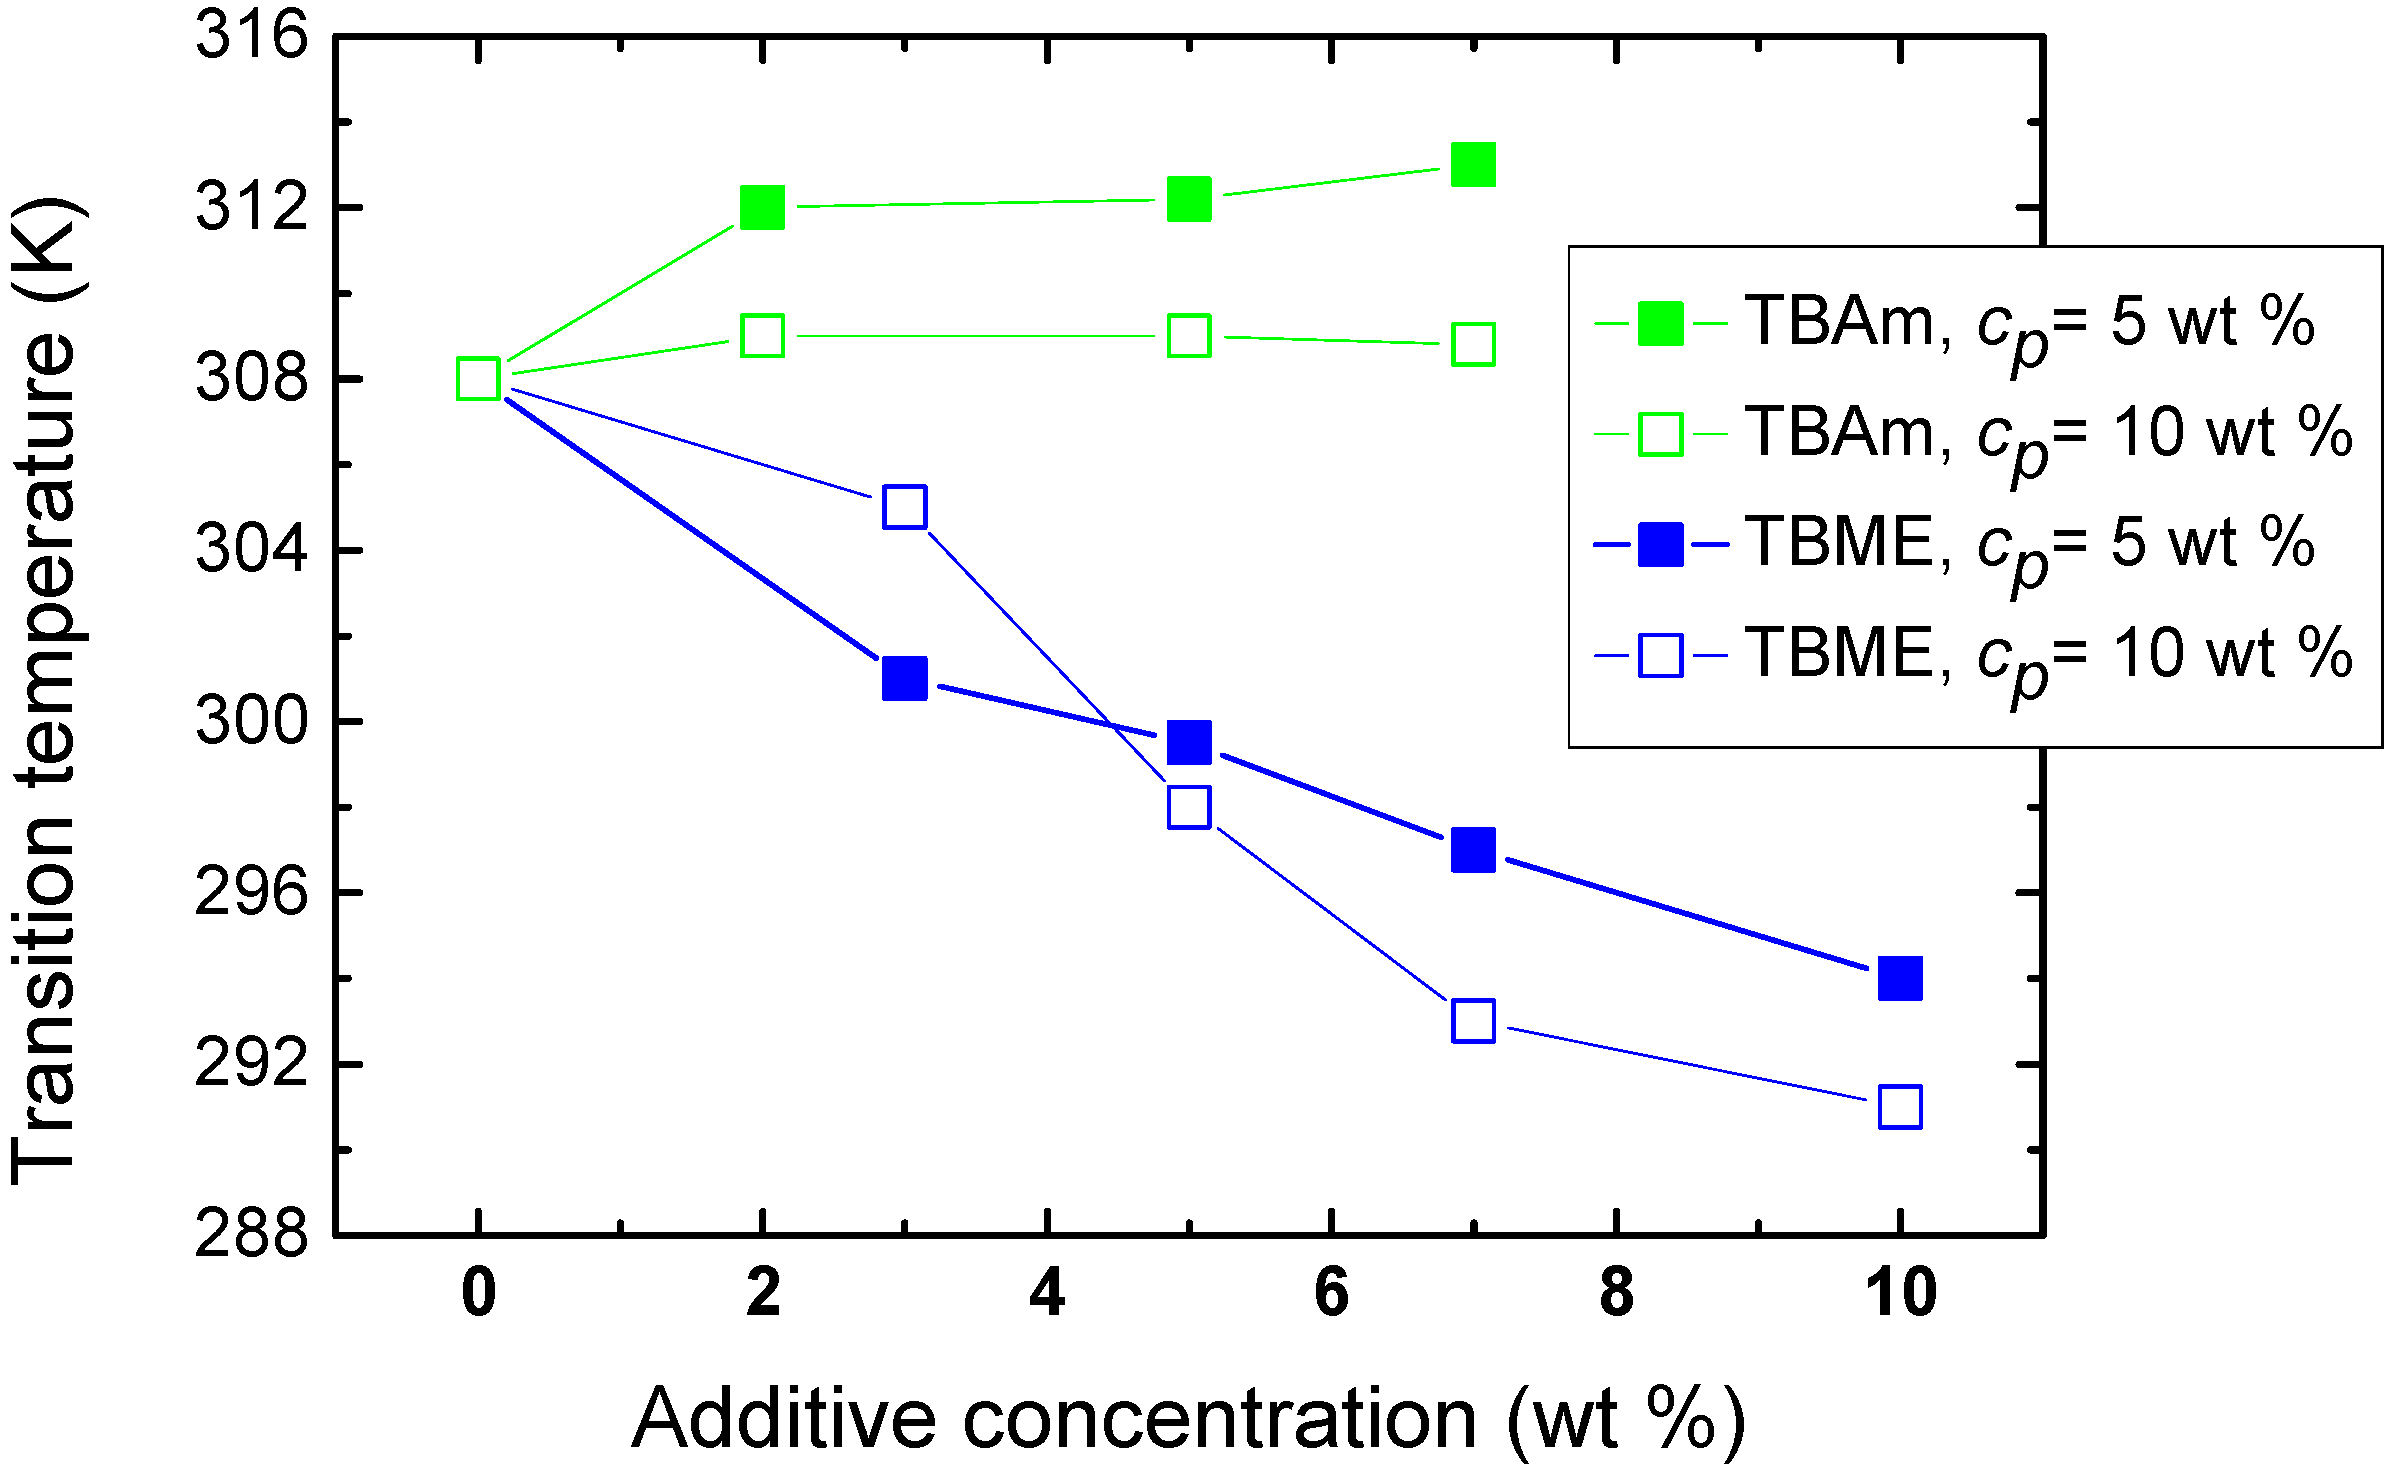
The effect of polymer concentration on the phase transition of solutions with hydrophilic and hydrophobic additives (TBAm and TBME, respectively) is seen in
Figure 5. For higher PVME concentrations (
cp = 10 wt %) in PVME/TBAm solution, the dependence is shifted by ~4 K to lower values. This shift of the transition is probably a consequence of the preferred polymer-polymer contacts at higher concentration, allowing hydrophobic interactions to predominate at lower temperatures. More complicated behavior was detected for solutions with hydrophobic TBME. An increase of the transition temperature is observed for additive concentration
cad = 3 wt % and higher polymer concentration, apparently since the number of hydrophobic additive molecules per polymer segment decreases and, thus, hydrophobic interactions of the additive with the chain are reduced. Subsequently, for more concentrated polymer solutions and
cad > 5 wt %, the transition temperature decreases by ~4 K. The solvent quality for such high TBME concentrations is probably reduced and the phase transition occurs already at lower temperatures. These two different mechanisms controlling LCST shift were described for aqueous solutions of poly(
N-isopropylacrylamide) and hydrophobic benzaldehydes [
19].
Figure 5.
Concentration dependence of the transition temperature for PVME/TBME and PVME/TBAm solutions for two various polymer concentrations cP = 5 and 10 wt % PVME in D2O.
Figure 5.
Concentration dependence of the transition temperature for PVME/TBME and PVME/TBAm solutions for two various polymer concentrations cP = 5 and 10 wt % PVME in D2O.
3.2. Mobility of Water and Additive Molecules during Phase Transition
The mobilities of the additive and water molecules were studied using NMR spin-spin relaxation time
T2 [
5,
11]. To follow the changes in the behavior of the water and additive in the presence of the polymer, a comparative analysis of
T2 was performed at temperatures below and above the transition. In this respect it is useful to define
T2im as the ratio of the measured
T2 values in the polymer-additive system
T2(pvme+additive) and in the corresponding additive/D
2O solution
T2(additive) at the same temperature (
T2im =
T2(pvme+additive)/
T2(additive)) [
20]. The value of
T2im gives temperature-independent information about the extent of the immobilization of the water and additive molecules caused by the presence of the polymer. The comparison of these quantities for HDO molecules and for the
t-butyl group of the additives is given in
Table 1. If no interaction with the polymer occurs, the value of
T2im should be equal to 1 (if the effects of viscosity can be neglected). The lower the resulting value, the higher the immobilization effect caused by the polymer–water or polymer–additive interaction.
Table 1.
T2im parameters for the PVME/additive solutions (cP = 5 wt %, cad = 5 wt %).
Table 1.
T2im parameters for the PVME/additive solutions (cP = 5 wt %, cad = 5 wt %).
| Temperature | TBMK | TBME | TBOH | TBAm |
|---|
| HDO | (CH3)3 | HDO | (CH3)3 | HDO | (CH3)3 | HDO | (CH3)3 |
|---|
| below LCST | 0.16 | 0.42 | 0.78 | 0.78 | 0.65 | 0.92 | 0.60 | 0.88 |
| above LCST | 0.14 | 0.32 | 0.60 | 0.54 | 0.34 | 0.30 | 0.83 | 0.79 |
Relaxation parameters
T2im detected in PVME/TBOH and PVME/TBAm solutions below LCST reach similar values, see
Table 1.
T2im values of the additive
t-butyl group are almost equal to 1, values as obtained for water molecules are somewhat lower which could indicate a slight interaction with the polymer as well as the influence of chemical exchange. Different relaxation behavior of molecules in solutions with hydrophilic additives was found at elevated temperatures above LCST.
T2im values of molecules in PVME/TBAm solution remain high even above the transition while a reduction of
T2im values was observed for water and additive molecules in PVME/TBOH solution. The greater immobilization above the transition temperature for TBOH and water can be attributed to the effect of incorporation of a certain portion of these molecules into the globular structures.
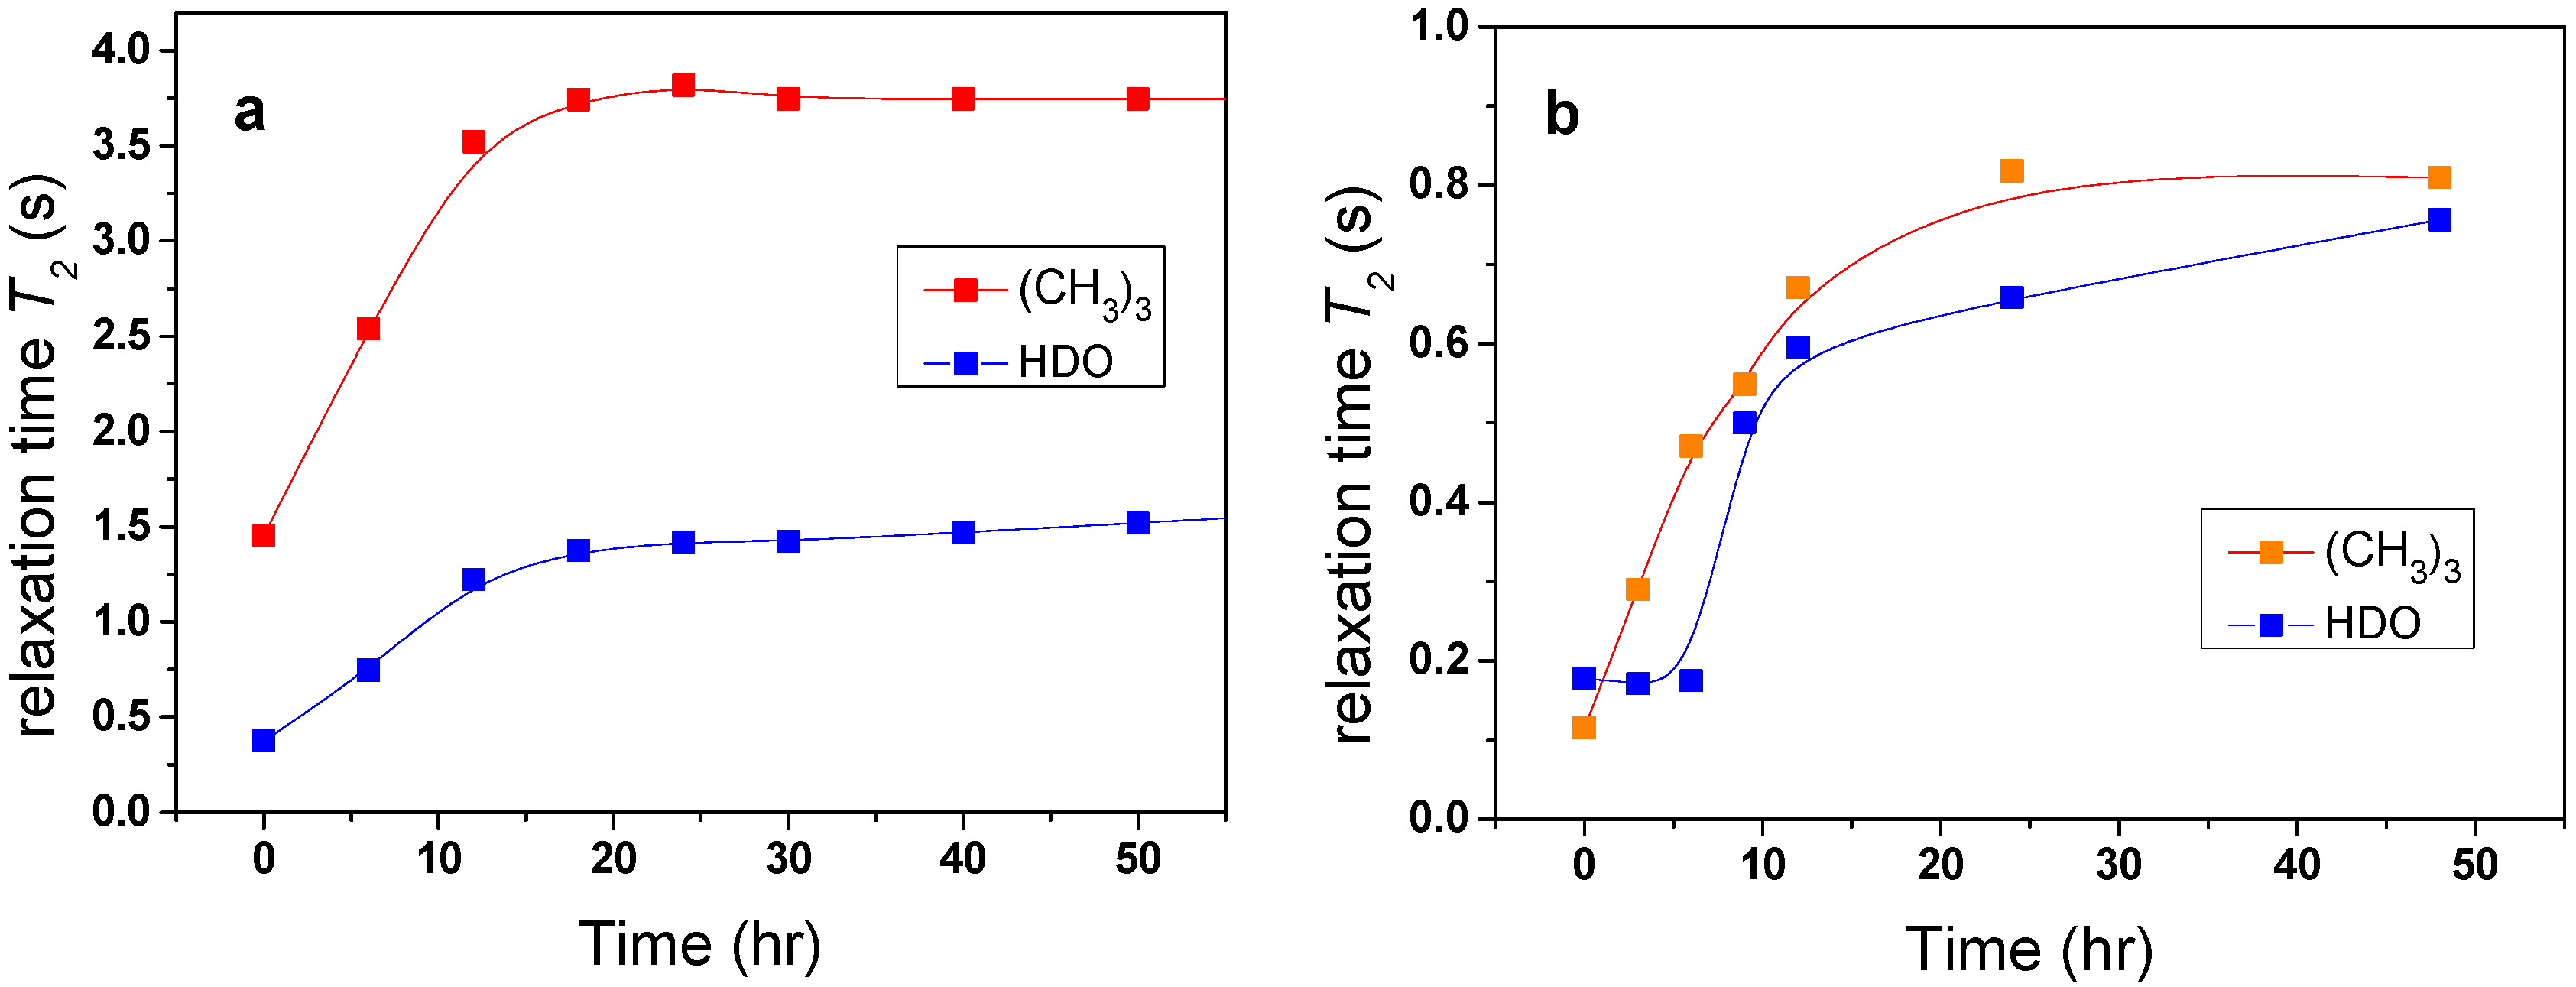
Changes in the mobility of solvent molecules as a function of time were found to arise from the effects of solvent molecules being released from the polymer globular structure. The investigated samples were kept for the whole time in the magnet of NMR spectrometer at elevated temperature and the time dependence of
T2 values was measured.
Figure 6a shows that
T2 values of HDO and
t-butyl group in the PVME/TBOH solution very slowly increased with time, reaching after tens of hours a value similar to that observed at temperatures below the transition. These results provide evidence that water and additive originally bound in globules are, over time, very slowly released (squeezed out) from the globular structures. Such behavior was previously detected in aqueous solutions of neat PVME solutions [
5,
11]. In contrast, for TBAm solutions no such changes in
T2 as a function of time were observed, confirming the idea that globules formed in these solutions do not contain bound water or/and additive.
Figure 6.
Time dependences of the spin-spin relaxation time T2 of HDO and (CH3)3 protons of additive in PVME/TBOH (a) and PVME/TBMK (b) solutions (cP = 5 wt %, cad = 5 wt % in D2O) measured above the phase transition.
Figure 6.
Time dependences of the spin-spin relaxation time T2 of HDO and (CH3)3 protons of additive in PVME/TBOH (a) and PVME/TBMK (b) solutions (cP = 5 wt %, cad = 5 wt % in D2O) measured above the phase transition.
It follows from
Table 1 that, for the solution with TBMK,
T2im of water and
t-butyl group reach substantially lower values indicating that water and additive molecules are strongly involved in interactions with the polymer at temperatures both below and above LCST. For TBME, the solvent and additive molecules are only slightly affected by the presence of the polymer. Similarly as in the case of PVME/TBOH solutions, a time-dependent experiment (
Figure 6b) confirmed that molecules originally bound in collapsed polymer structures of PVME/TBMK solution are slowly released.
3.3. FTIR Spectroscopy
As indicated by the concentration dependences of the transition temperature in
Figure 4 and NMR relaxations, solutions with TBMK and TBME showed substantial differences during phase transition. A detailed FTIR study confirmed different interaction mechanisms taking place in these solutions. On the other hand, no or negligible differences were recorded in FTIR spectra of PVME/TBOH and PVME/TBAm solutions and they were, thus, no longer analyzed.
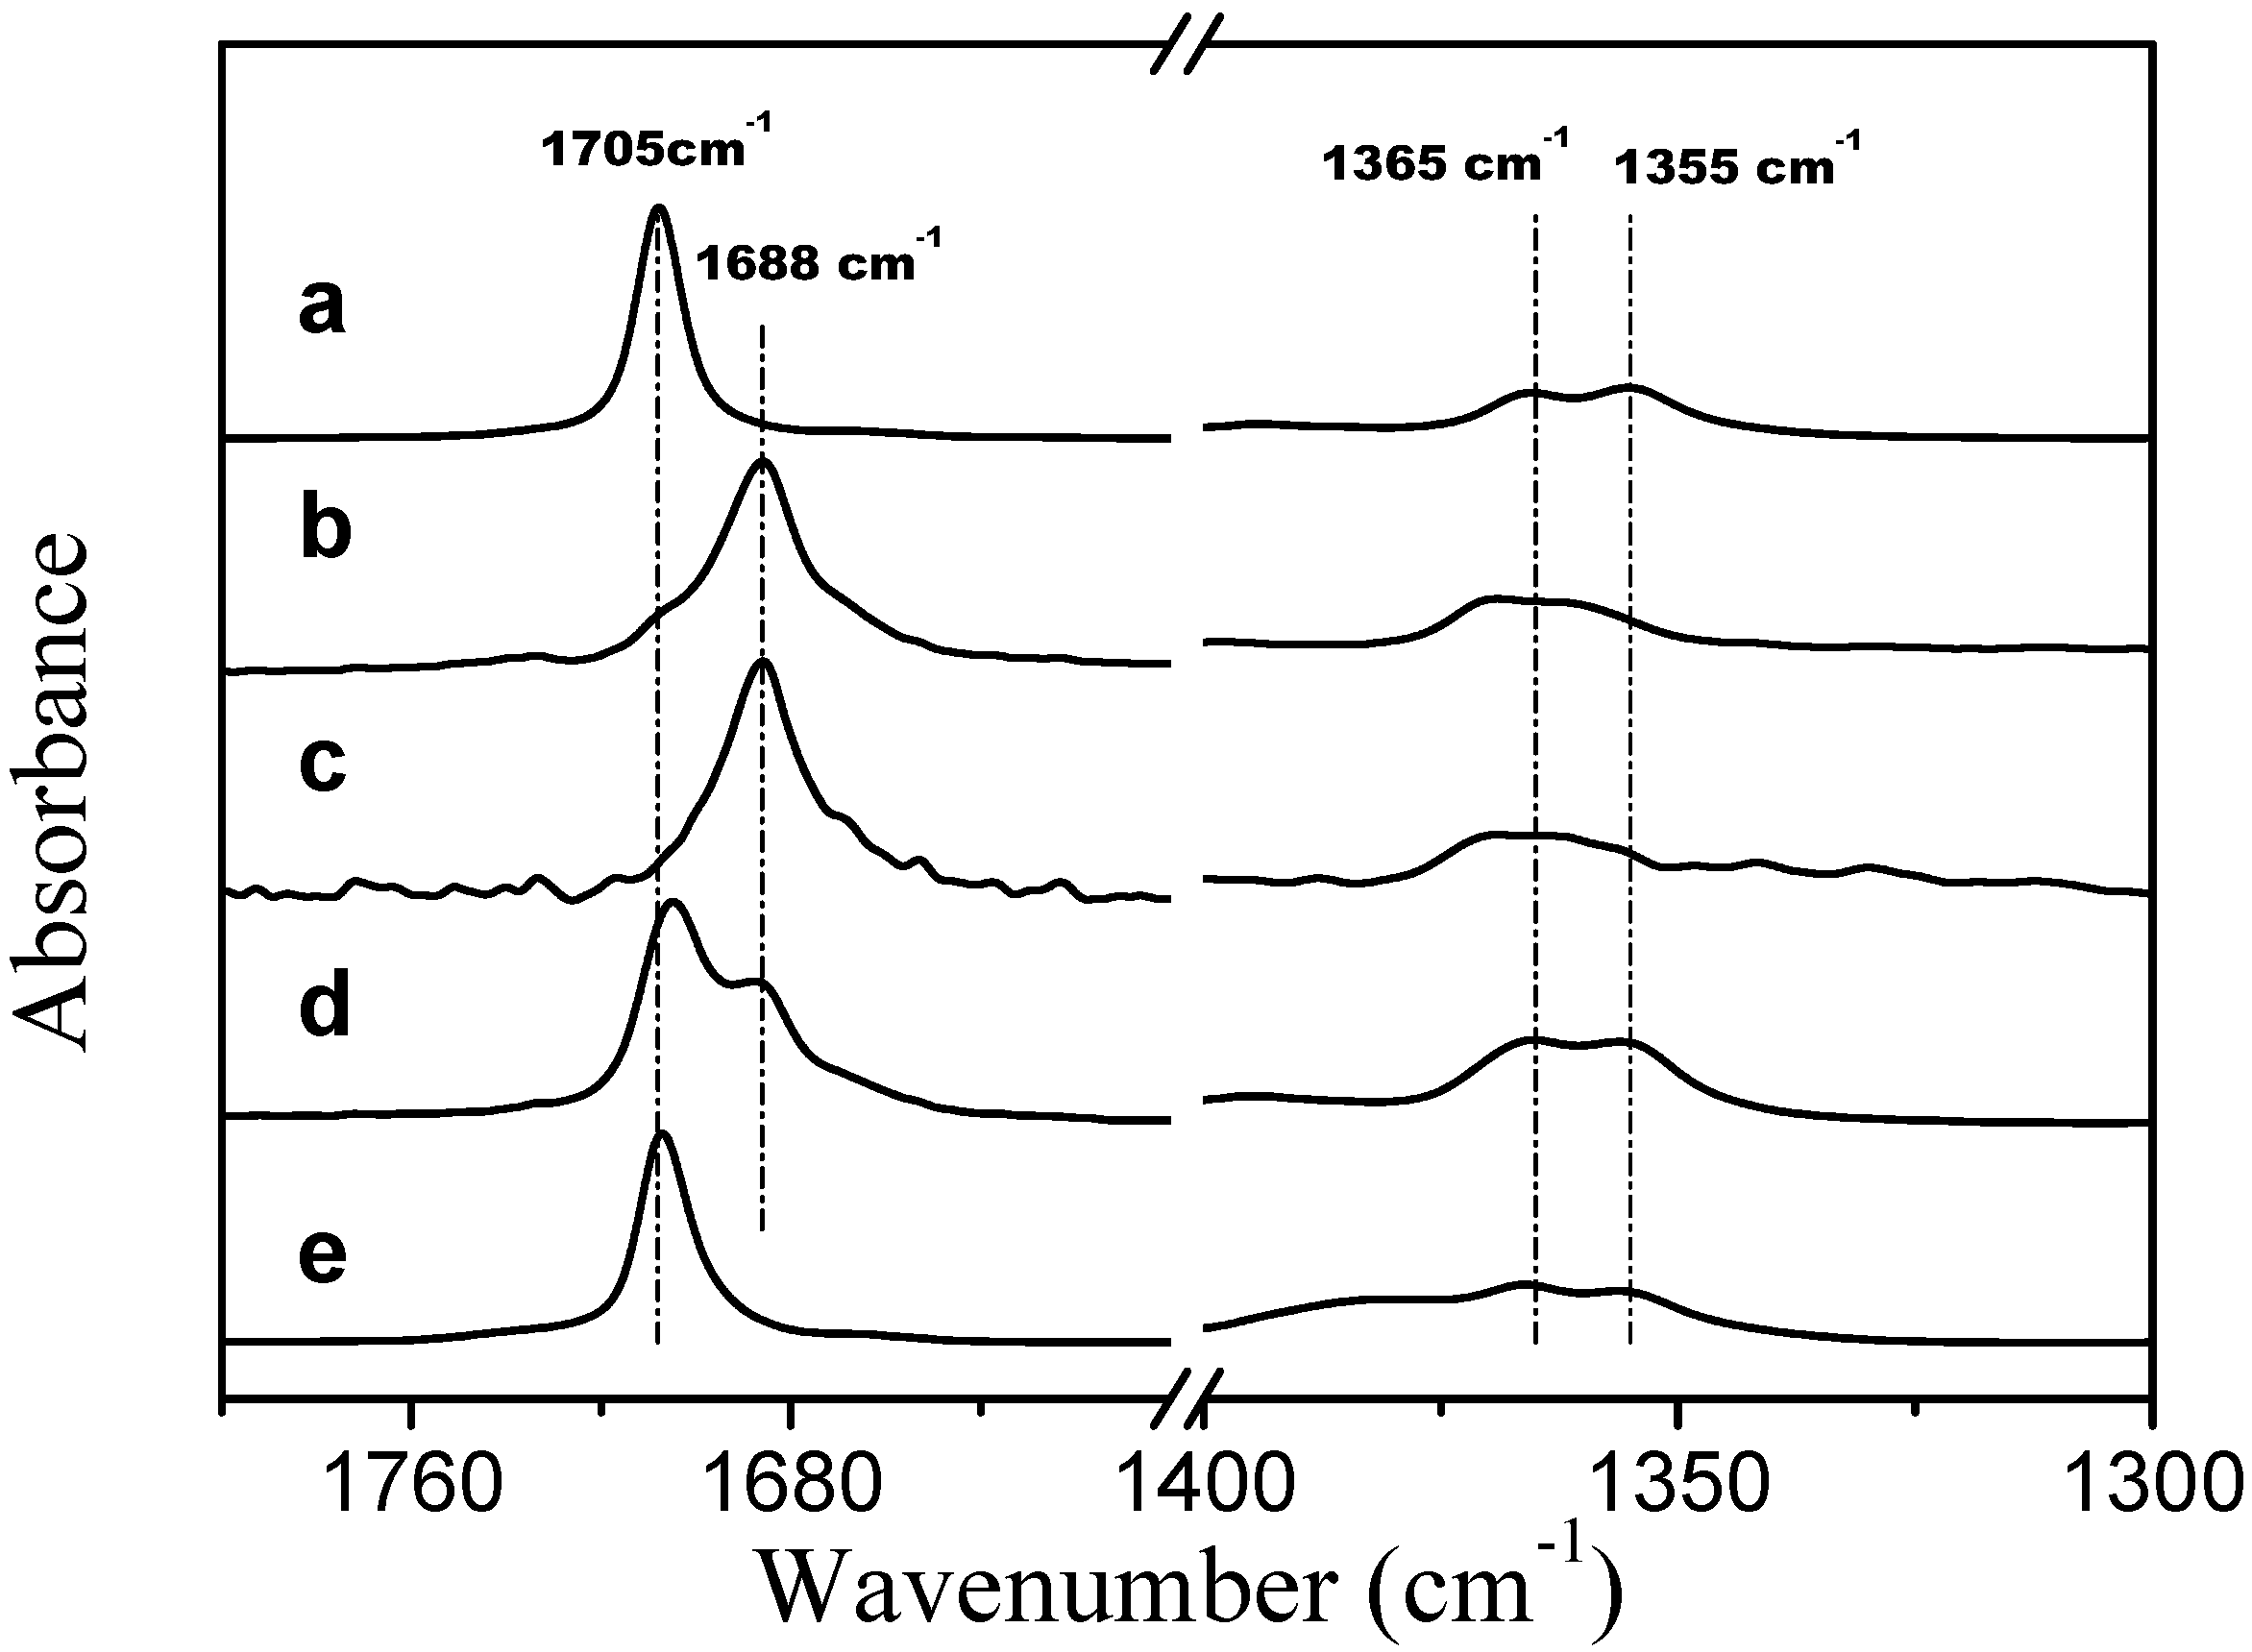
Corrected ATR FTIR spectra of TMBK systems are presented in
Figure 7. In the presence of two PVME bands that are assigned to the stretching vibration of the carbonyl group of TBMK are present at 278 K (spectrum d in
Figure 7); one band is at 1705 cm
−1, which is close to the position of the band for the neat form of the compound (spectrum a) [
25], and a second band is at 1688 cm
−1, which corresponds to the hydrated form of TBMK (spectra b and c). As the temperature increases to 301 K (well above LCST), only the band that represents the neat form is present at 1707 cm
−1. In the presence of PVME, the positions the symmetric CH
3 deformation bands are almost identical to the locations of the bands in the neat TBMK (1365 cm
−1 and 1355 cm
−1). The above observations could signify that below the transition temperature, domains rich in TBMK and attached to the polymer exist. The surfaces of these domains interact with water molecules through hydrogen bonds with the carbonyl groups of TBMK; thus, two carbonyl bands are present in the spectra below the transition—a hydrated band and a band similar to the neat TBMK. Above the transition temperature, the methyl groups remain in the same environment, whereas the carbonyl groups experience an environment similar to that of the neat TBMK and are no longer in contact with water molecules—this result could be consistent with the entrance of TBMK into the interior of the collapsed PVME globules.
Figure 7.
Corrected ATR FTIR spectra of TMBK at a temperature of 301 K (a); TBMK in D2O at a concentration of 5 wt % and a temperature 278 K (b); TBMK in D2O at a concentration of 5 wt % and a temperature 301 K (c); PVME/TBMK/D2O at cP = 0.5 wt % and cad = 5 wt % and a temperature of 278 K (d); and PVME/TBMK/D2O at cP = 0.5 wt % and cad = 5 wt % and a temperature of 301 K (e).
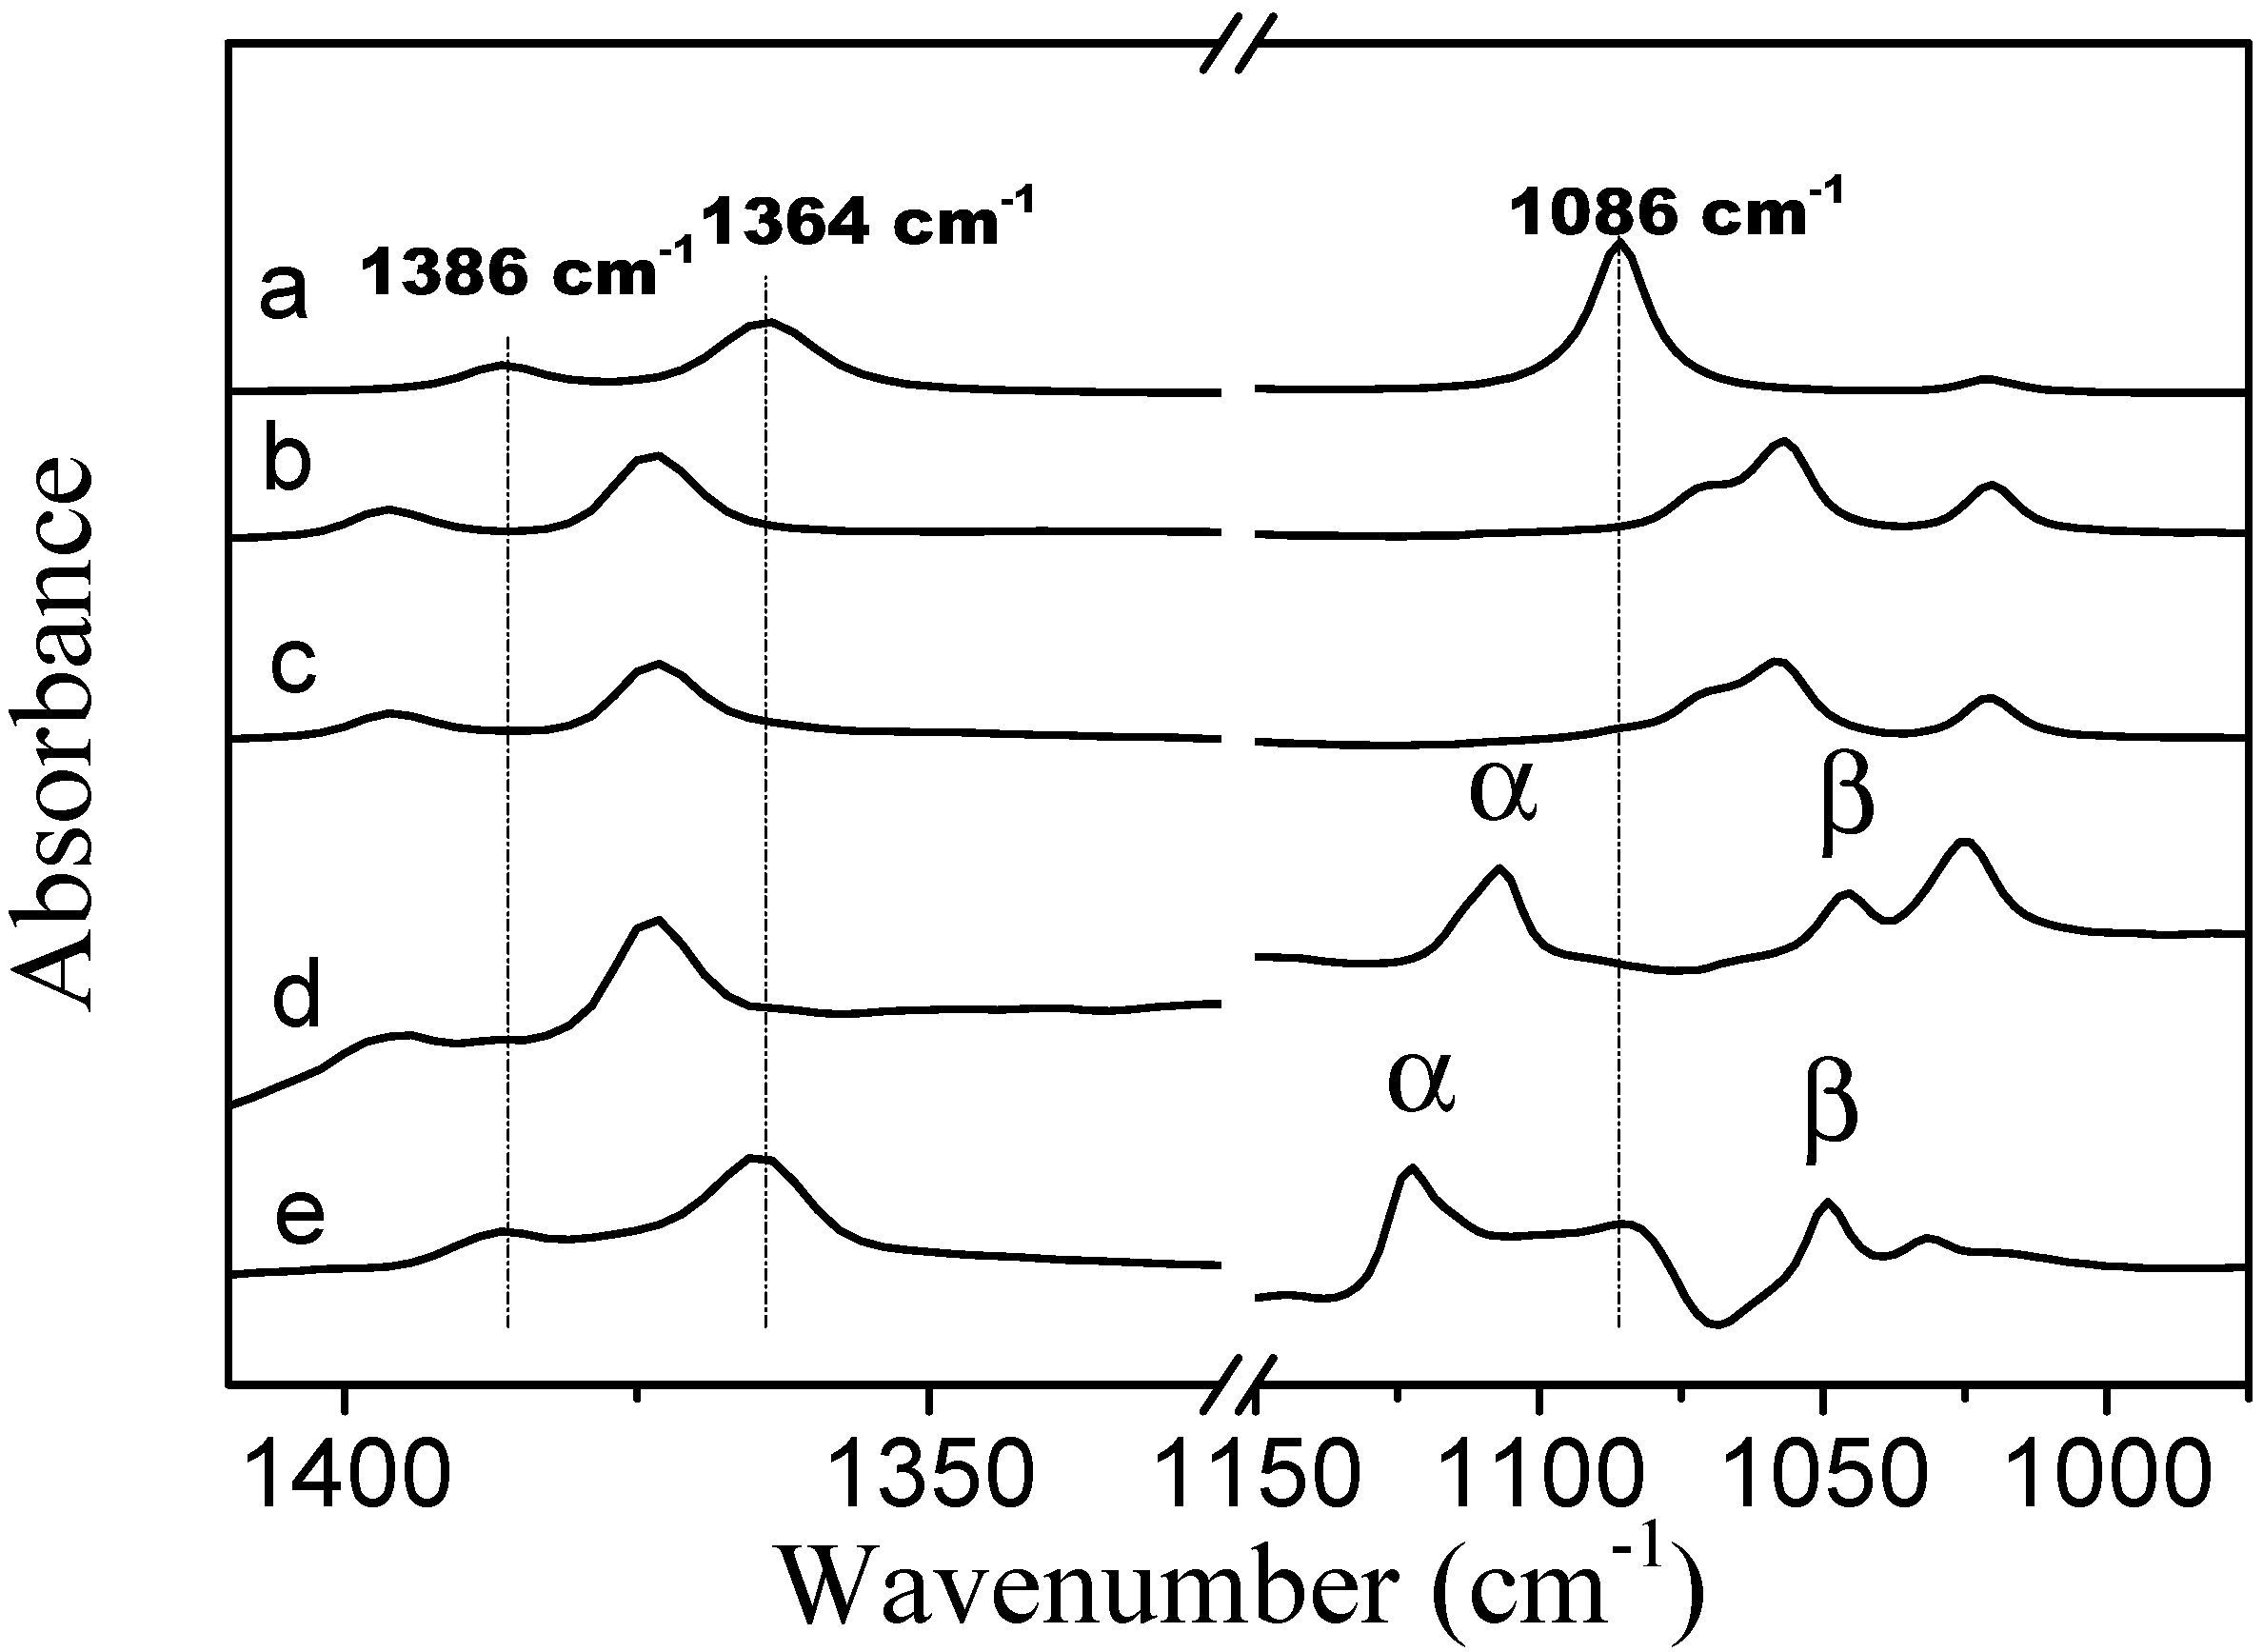
In the spectrum of neat TBME, the CH
3 symmetric deformation bands are located at 1386 and 1364 cm
−1 (spectrum
Figure 8a). In the presence of PVME the positions of these two bands are identical to the locations of the bands in the spectra of TBME hydrated with D
2O at 278 K. Upon an increase in temperature to 301 K (above LCST), these two bands shift to positions identical to those in neat TBME. In the spectrum of neat TBME, the band assigned to the C–O stretching vibration of the methoxy group is located at 1086 cm
−1 [
26]. An appearance of the second band at 1046 cm
−1, in the presence of PVME, most likely corresponds to the hydrated form of TBME. The above observations confirm that below the transition temperature the methyl groups of TBME are hydrated. Above the transition temperature, the methyl groups are located in an environment similar to neat TBME. The two C–O stretching vibration bands in the methoxy group that are present in the spectra below and above the transition temperature (spectra
Figure 8d,e) indicate the presence of two types of additive molecules; the α band most likely corresponds to TBME molecules that are isolated from each other and in which the dipole-dipole intermolecular interaction has been eliminated. The β band at the lower wavenumbers probably corresponds to hydrated TBME molecules in which the methoxy oxygen is involved in hydrogen bonds with the solvating D
2O molecules.
Figure 8.
Corrected ATR FTIR spectra of (a) TBME at a temperature of 301 K; (b) TBME in D2O at a concentration of 5 wt % and a temperature of 278 K; (c) TBME in D2O at a concentration of 5 wt % and a temperature of 301 K; (d) PVME/TBME/D2O at cP = 10 wt % and cad = 5 wt % and a temperature of 278 K; and (e) PVME/TBME/D2O at cP = 10 wt % and cad = 5 wt % and a temperature of 301 K.
From the results obtained from NMR relaxation and FTIR experiments, we can suggest that globular structures formed in TBME solutions above LCST do not contain a substantial amount of bound water or additive molecules; the slight mobility restriction of water and TBME could be caused by interactions of these molecules with the surface of the polymer globules. On the other hand, for TBMK solutions we observe a strong mobility reduction of the additive and water molecules. This fact can be explained by the interactions between the polymer chain and the TBMK carbonyl group that are mediated by one or more water molecules.
3.4. Cooperativity of the Phase Transition
The temperature dependences of
p-fraction shown in
Figure 3 can be used for determining the enthalpy and entropy changes during phase transition, considering this process as the competition between non-phase separated (coil) and phase separated (globule) states governed by the Gibbs free energy. The van´t Hoff equation describes temperature changes of the equilibrium constant
K of the coil-globule transition as follows:
where Δ
HNMR and Δ
SNMR are the changes in enthalpy and entropy, respectively, and
R is the gas constant. In relation to the
p-fraction the equilibrium constant
K can be written as the ratio:
where
pmax are values of fraction
p above the transition. The dependences of
R ln(
p/(
pmax −
p)) on −1/
T were fitted with linear regression according to Equations (2) and (3) and the parameters Δ
HNMR are summarized in
Table 2.
Table 2 contains also enthalpy changes Δ
HDSC as obtained from DSC measurements and recalculated to mol of monomer units where the enthalpy data for neat PVME quite well agree with the literature [
27,
28]. Enthalpy values Δ
HDSC can be compared with those determined from NMR. Assuming that the phase transition is a cooperative process and the polymer chain consists of cooperative units (domains) which undergo transition as a whole [
29,
30,
31], the values Δ
HNMR are thus related to mol of cooperative units. The ratio Δ
HNMR/Δ
HDSC represents the average number of monomer units in one cooperative domain and can provide a quantitative analysis of the degree of cooperativity (
cf.
Table 2). For the 5 wt % solution of neat PVME and solutions of PVME with TBME and TBAm (
cad = 5 wt %), the size of the domains agrees quite well with the average degree of polymerization (
DP of PVME ~ 348), thus showing that, in this case, the cooperative unit is the whole polymer chain. For solutions with TBMK and TBOH (
cad = 5 wt %), these domains are smaller and consist of only 140 and 170 monomer units, respectively. As follows from relaxation experiments, a certain amount of water and additive molecules is incorporated into the globules formed in these two solutions. This process is obviously time-consuming and disrupts the cooperativity of the transition; cooperative units are smaller and the phase transition is broader.
Table 2.
Thermodynamic parameters determined by NMR and DSC and the number of monomer units in the domain for mixtures of 5 wt % PVME.
Table 2.
Thermodynamic parameters determined by NMR and DSC and the number of monomer units in the domain for mixtures of 5 wt % PVME.
| Sample | ΔHNMR | ΔHDSC | Number of Mon. Units in Domain |
|---|
| MJ/mol | kJ/mol |
|---|
| PVME | 1.32 | 4.05 | 326 |
| TBMK | 0.32 | 2.23 | 143 |
| TBME | 0.78 | 2.32 | 336 |
| TBOH | 0.40 | 2.30 | 174 |
| TBAm | 0.58 | 1.98 | 293 |
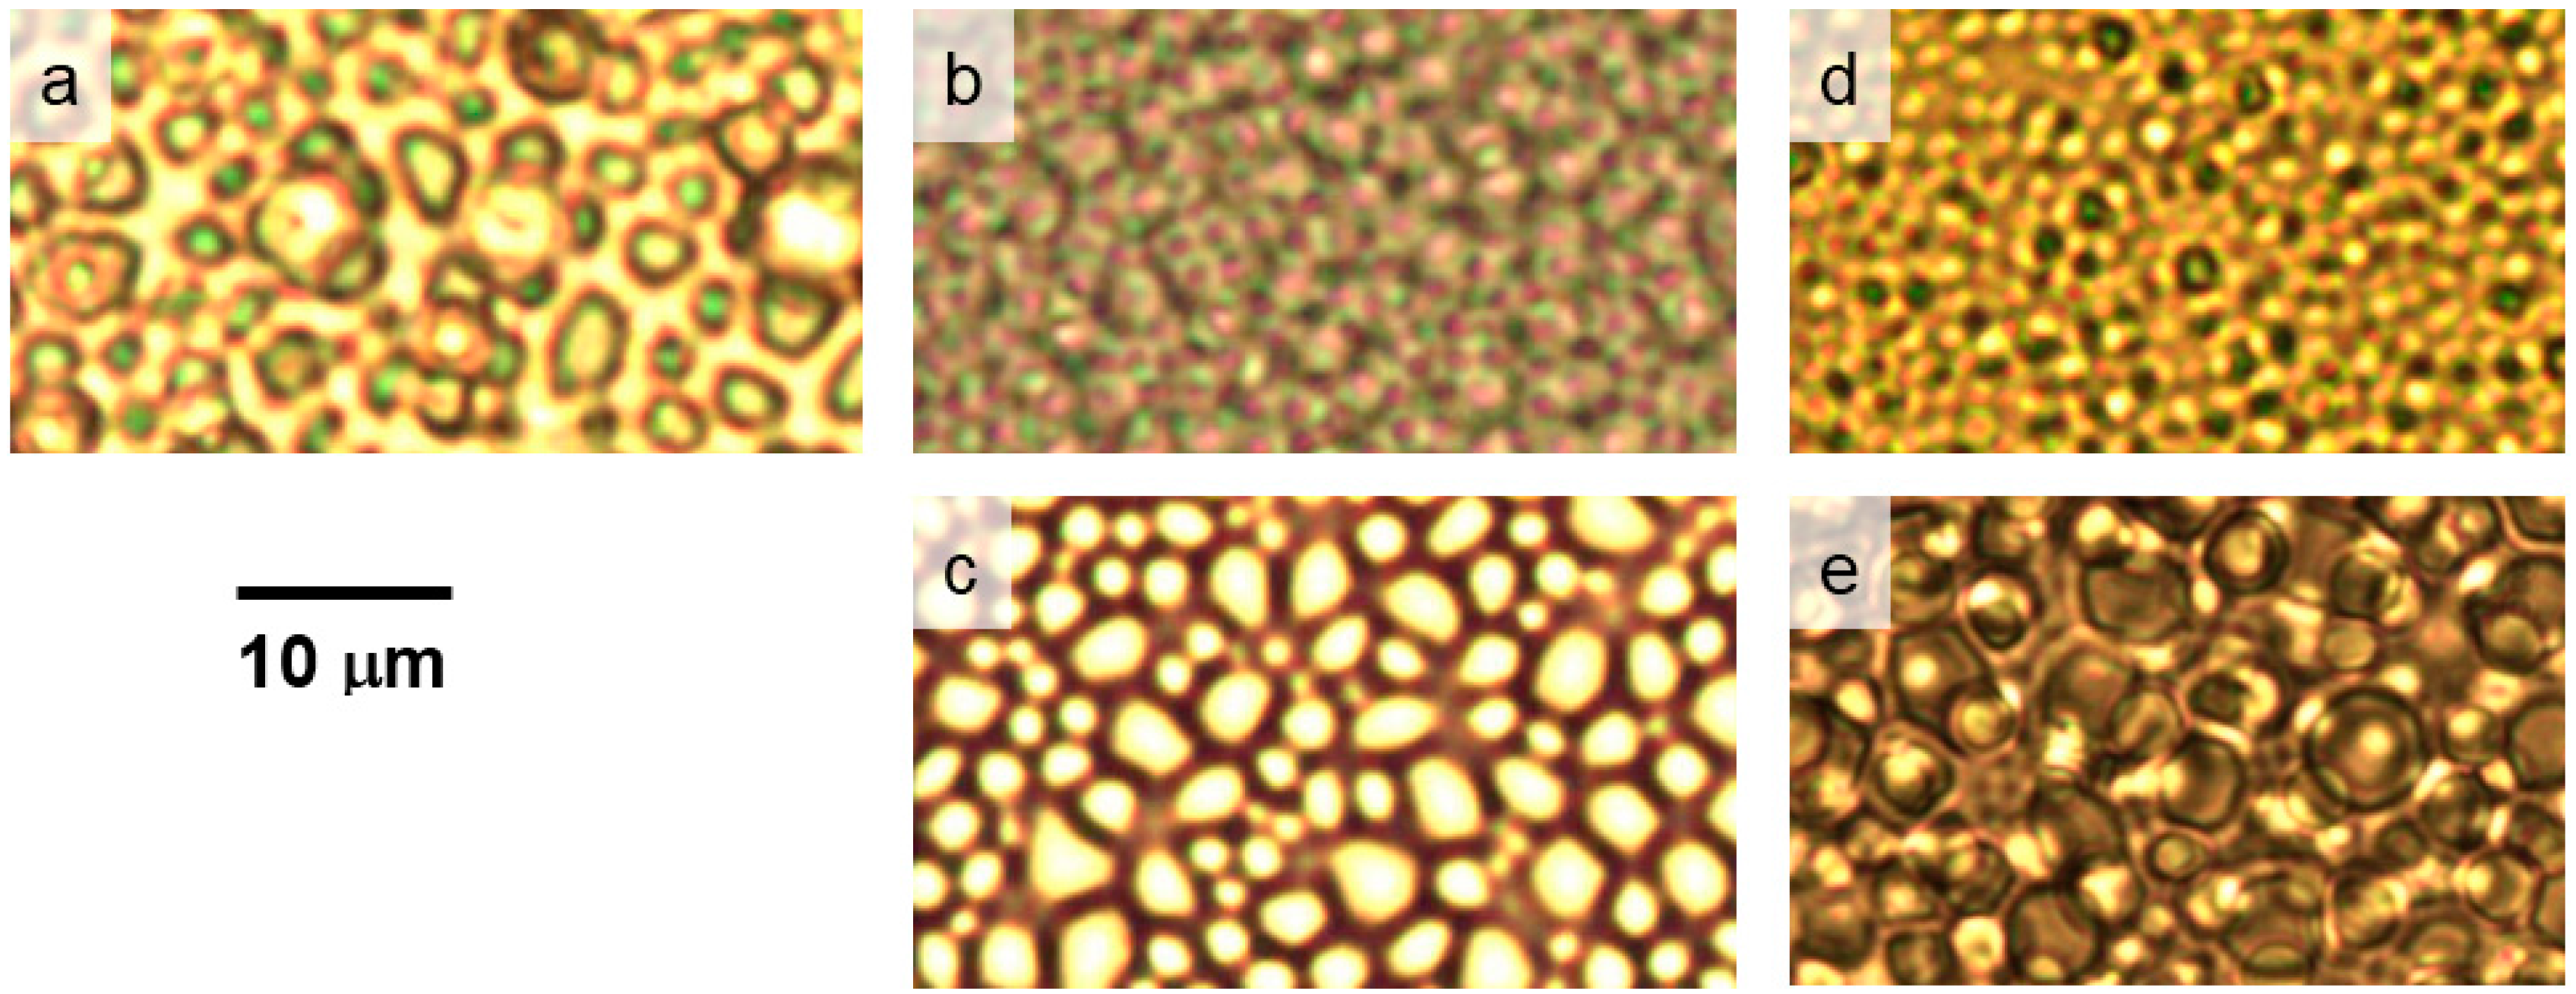
The difference in the structure and size of the polymer globules in the presence of the additives can be demonstrated by the optical microscopy images shown in
Figure 9. This figure demonstrates that globular structures formed above LCST transition in aqueous PVME/TBMK and PVME/TBOH solutions are somewhat smaller than those observed for solutions with other additives and neat PVME. This finding corresponds to the data in
Table 2 where size of cooperative domains as calculated for PVME/TBOH and PVME/TBMK solutions is about twice smaller in comparison with domains formed in other solutions and this is obviously macroscopically manifested in smaller polymer aggregations. Interestingly enough, polymer agglomerates formed in PVME/TBME solutions show strong separation and well-defined surfaces. This could be the consequence of the fact that 90% of polymer chains are involved in the collapsed structures, as follows from the fraction
p above the transition, and at the same time these structures do not contain any bound water or additive.
Figure 9.
Photomicrographs of the neat PVME solution (cP = 5 wt % in D2O) (a) and solutions with additives TBMK (b); TBME (c); TBOH (d); and TBAm (e) (cP = 5 wt %, cad = 5 wt %) recorded at temperatures above the transitions of the particular systems.
Figure 9.
Photomicrographs of the neat PVME solution (cP = 5 wt % in D2O) (a) and solutions with additives TBMK (b); TBME (c); TBOH (d); and TBAm (e) (cP = 5 wt %, cad = 5 wt %) recorded at temperatures above the transitions of the particular systems.


