
P(MMA-EMA) Random Copolymer Electrolytes Incorporating Sodium Iodide for Potential Application in a Dye-Sensitized Solar Cell

Abstract
:
1. Introduction
2. Experimental Section
2.1. Materials
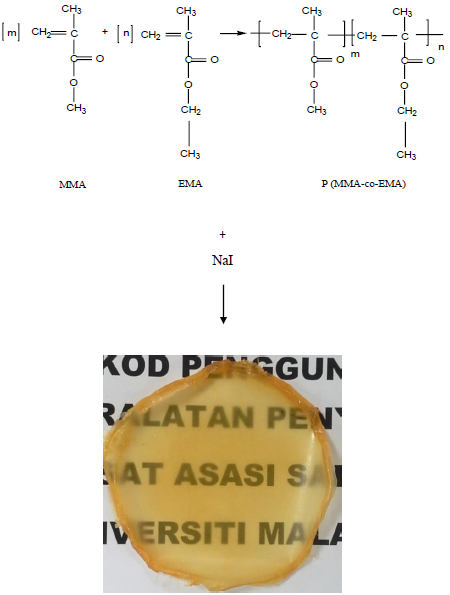
2.2. Synthesis of Polymer
2.3. Preparation of Solid Polymer Electrolytes
2.4. Characterization
2.5. Photoelectrochemical Cell Fabrication and Characterization
3. Results and Discussion
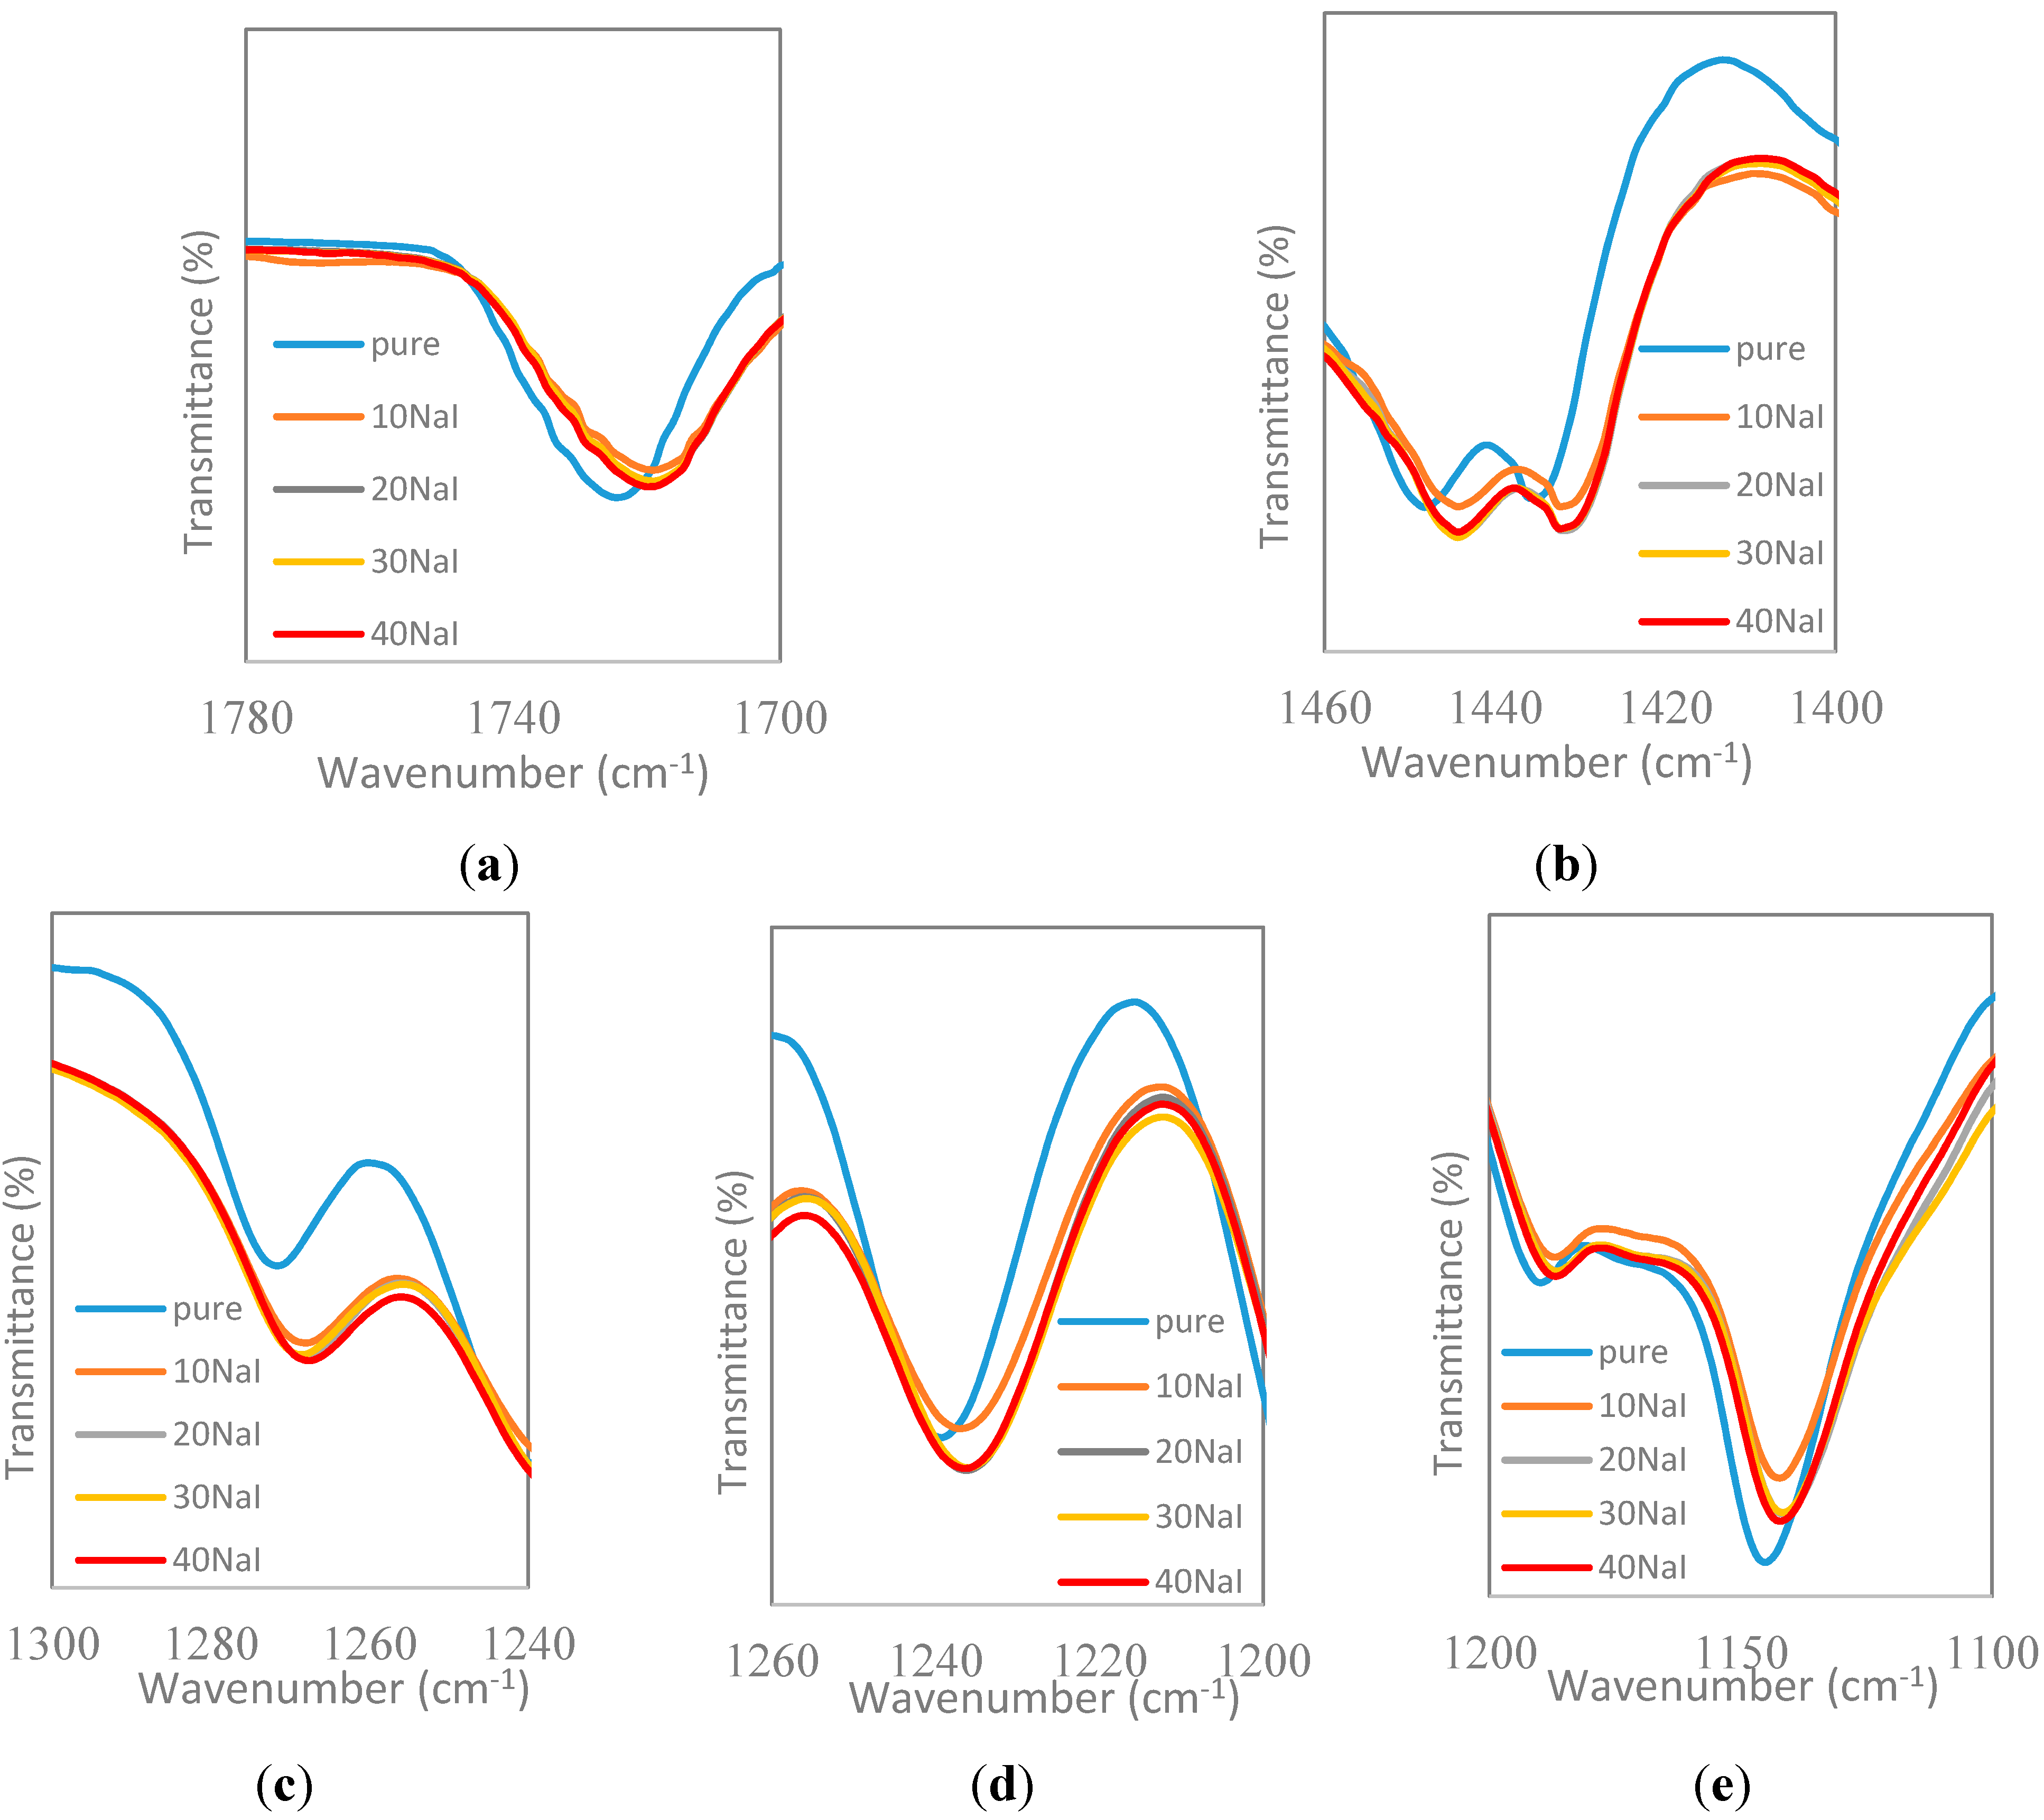
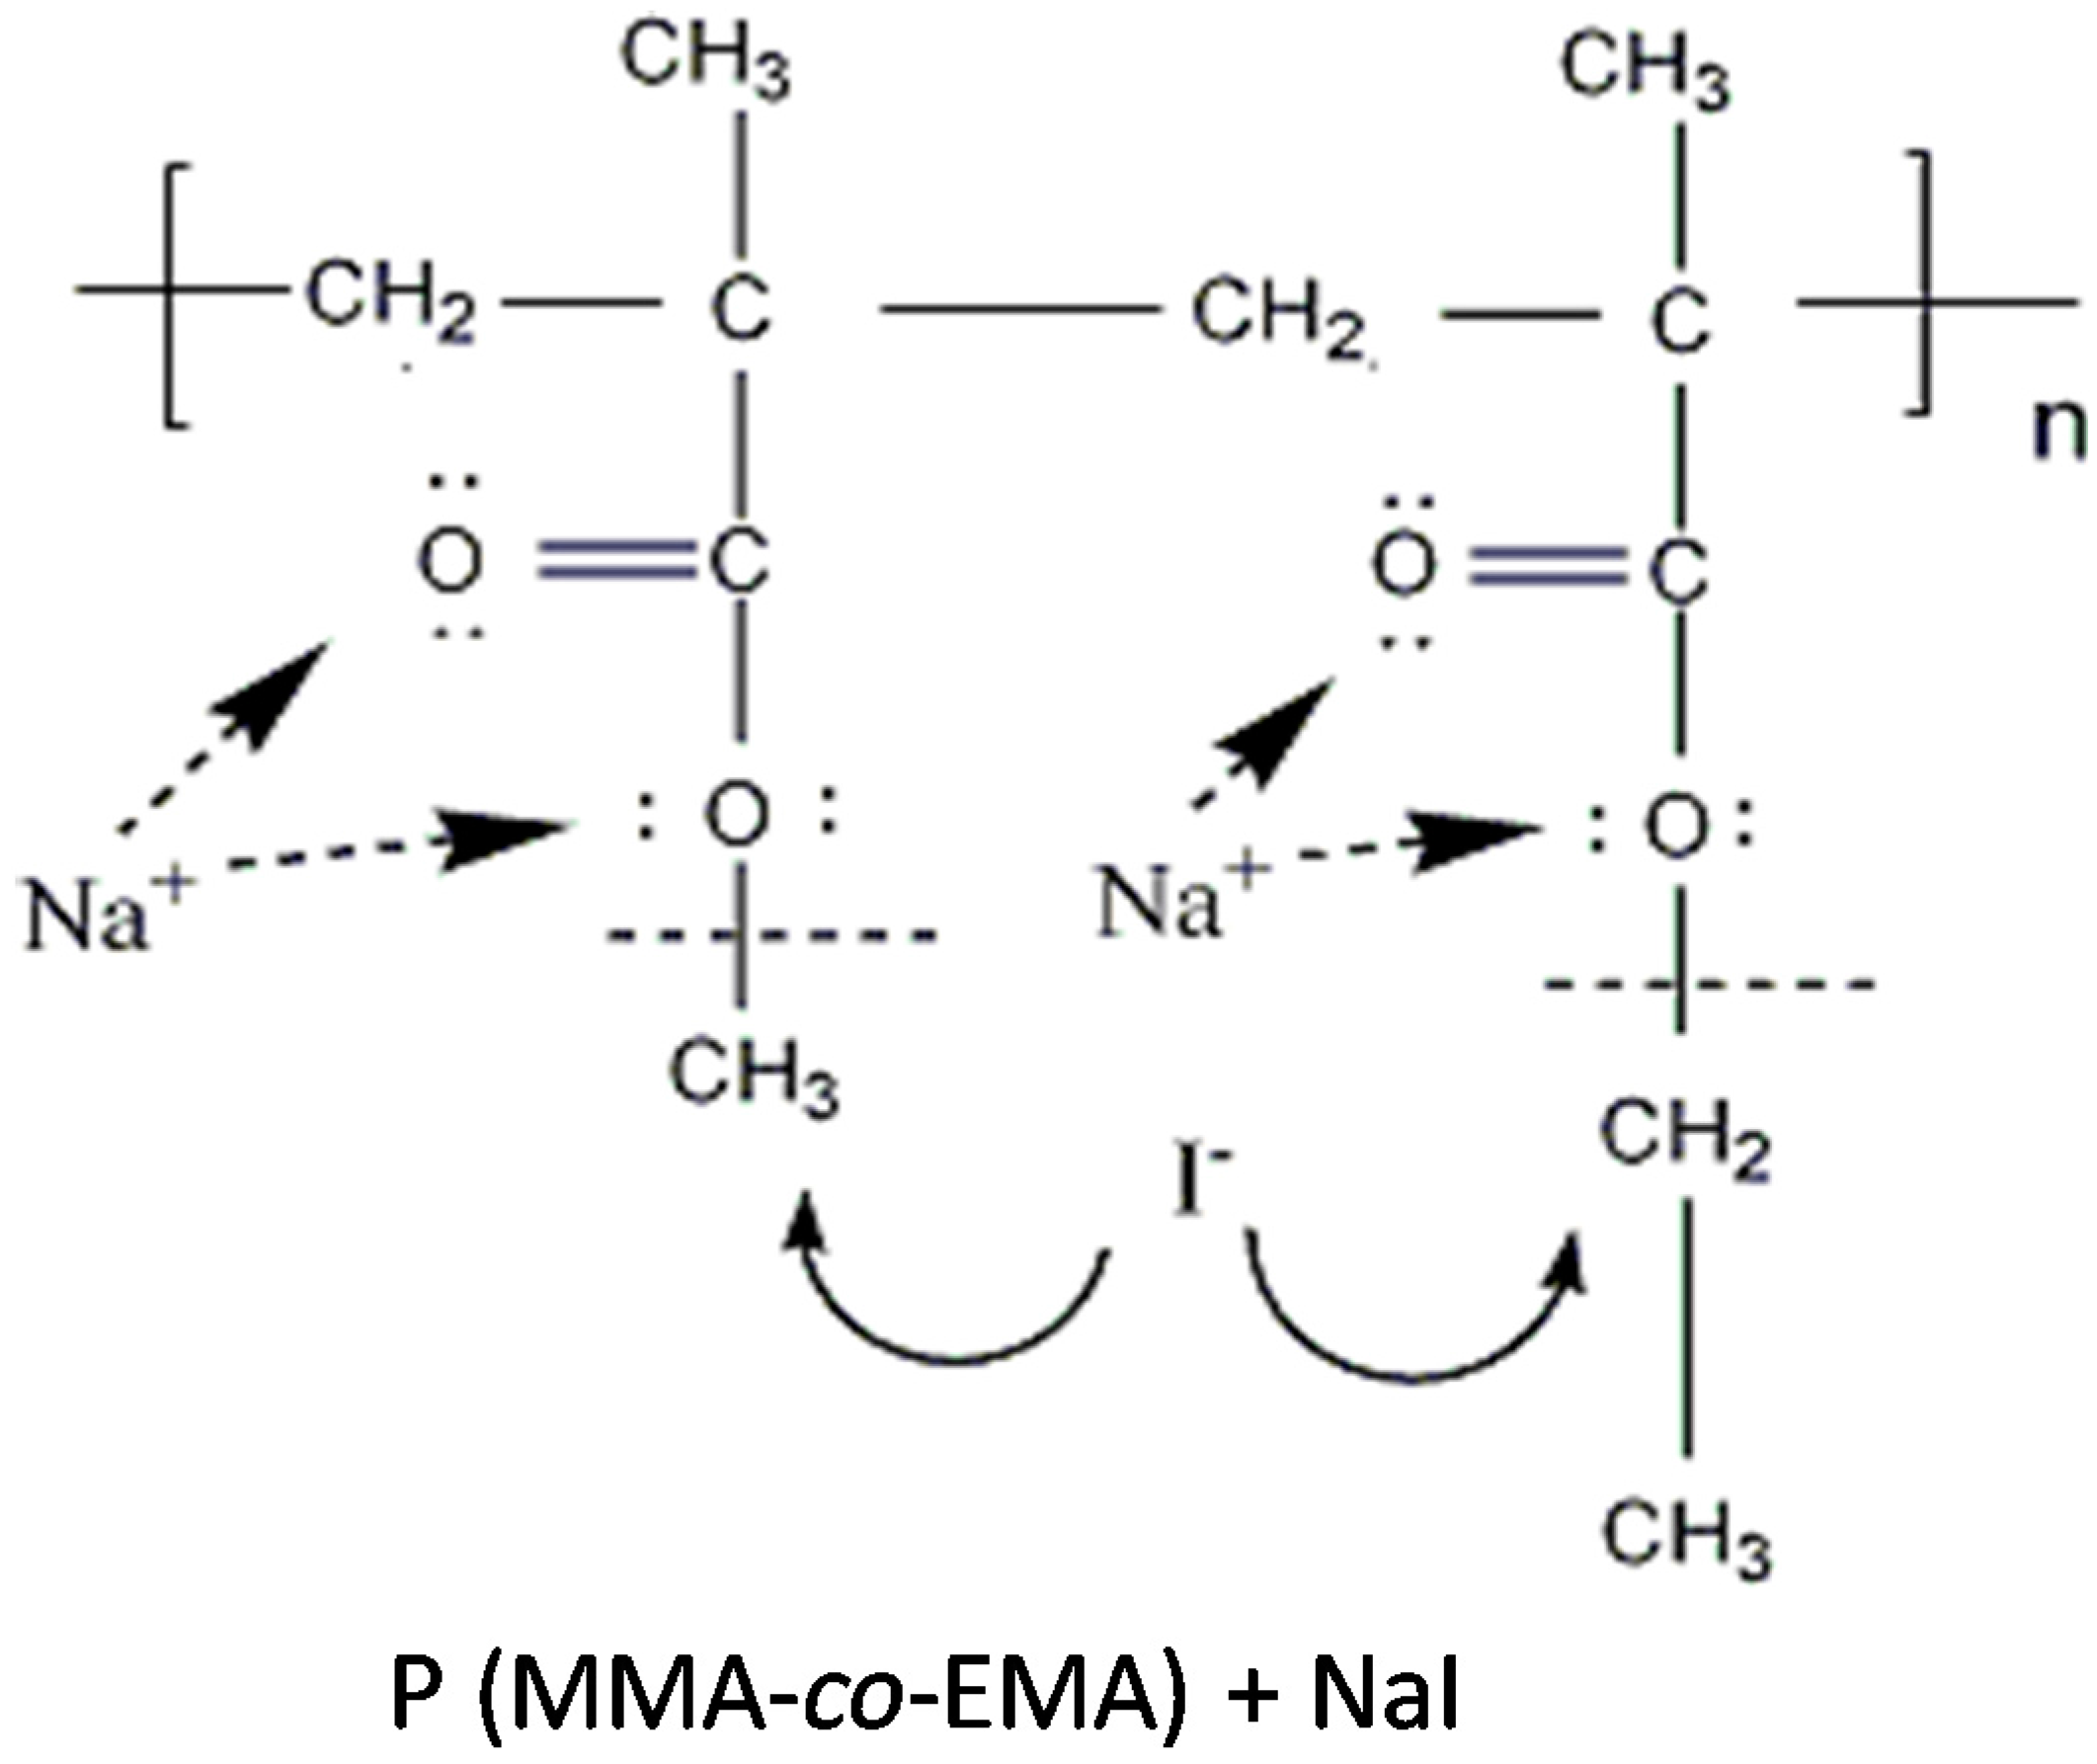
3.1. FTIR Analysis


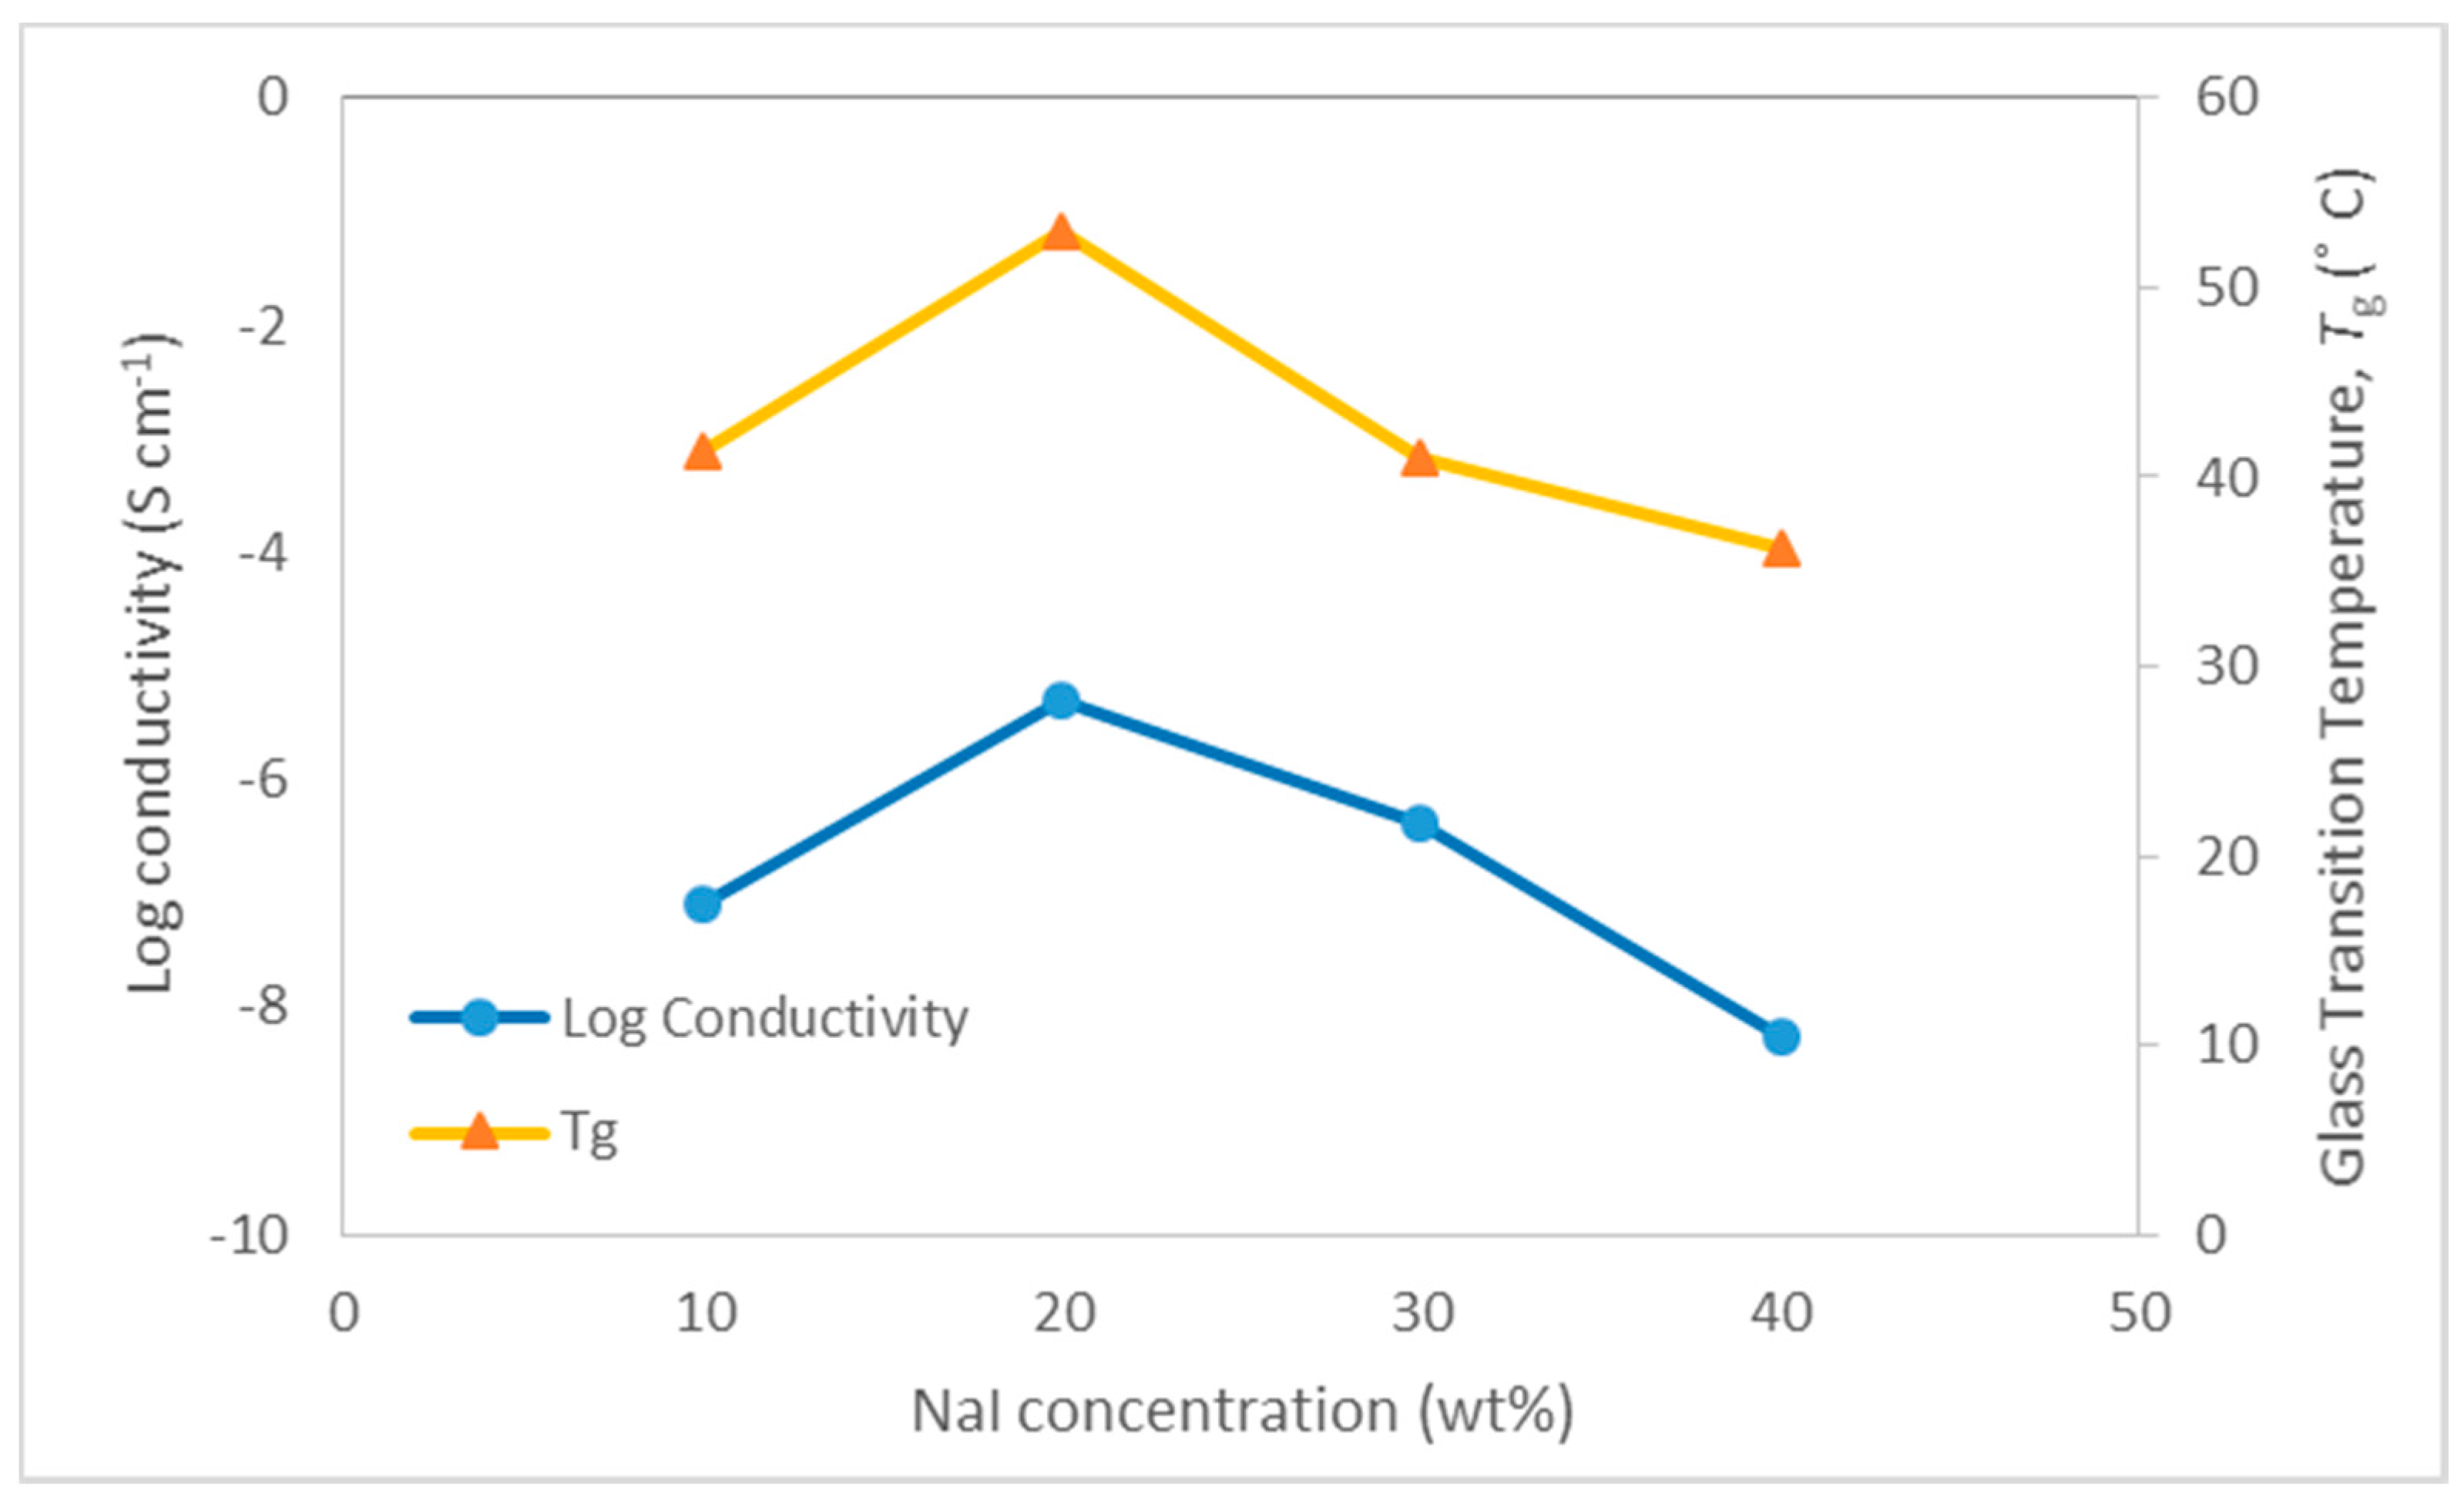
3.2. Conductivity and Thermal Analysis

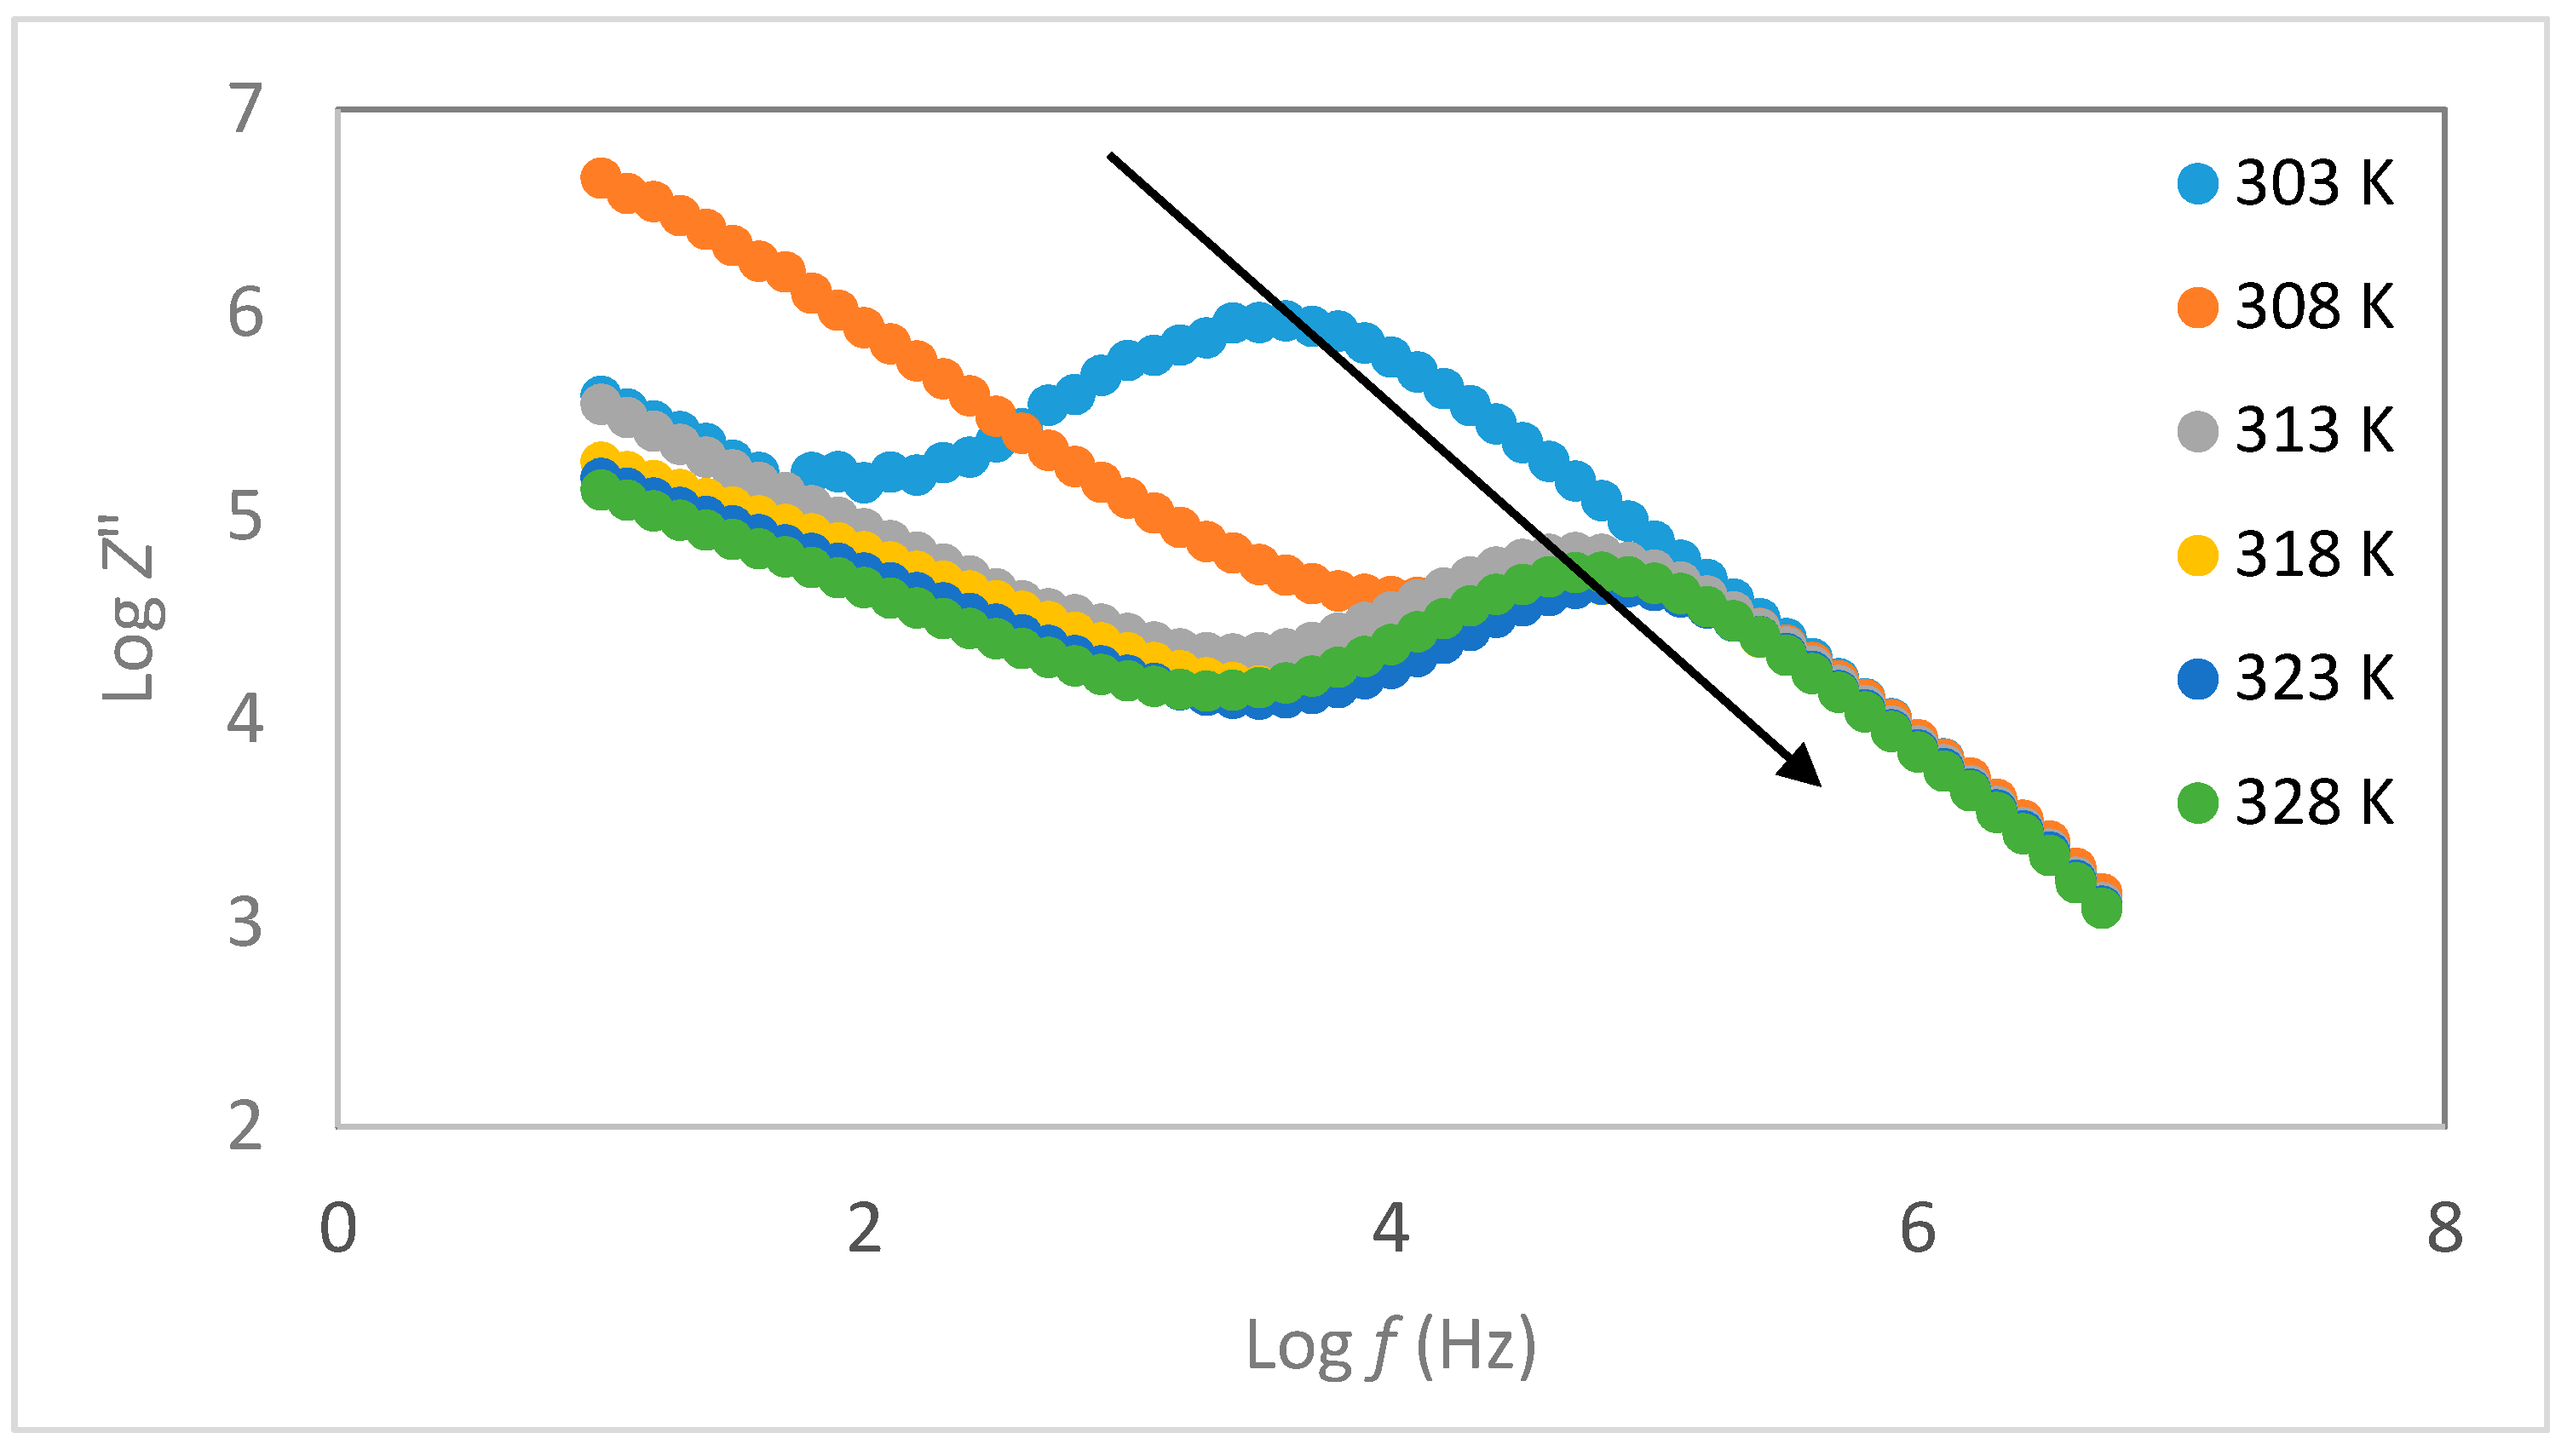
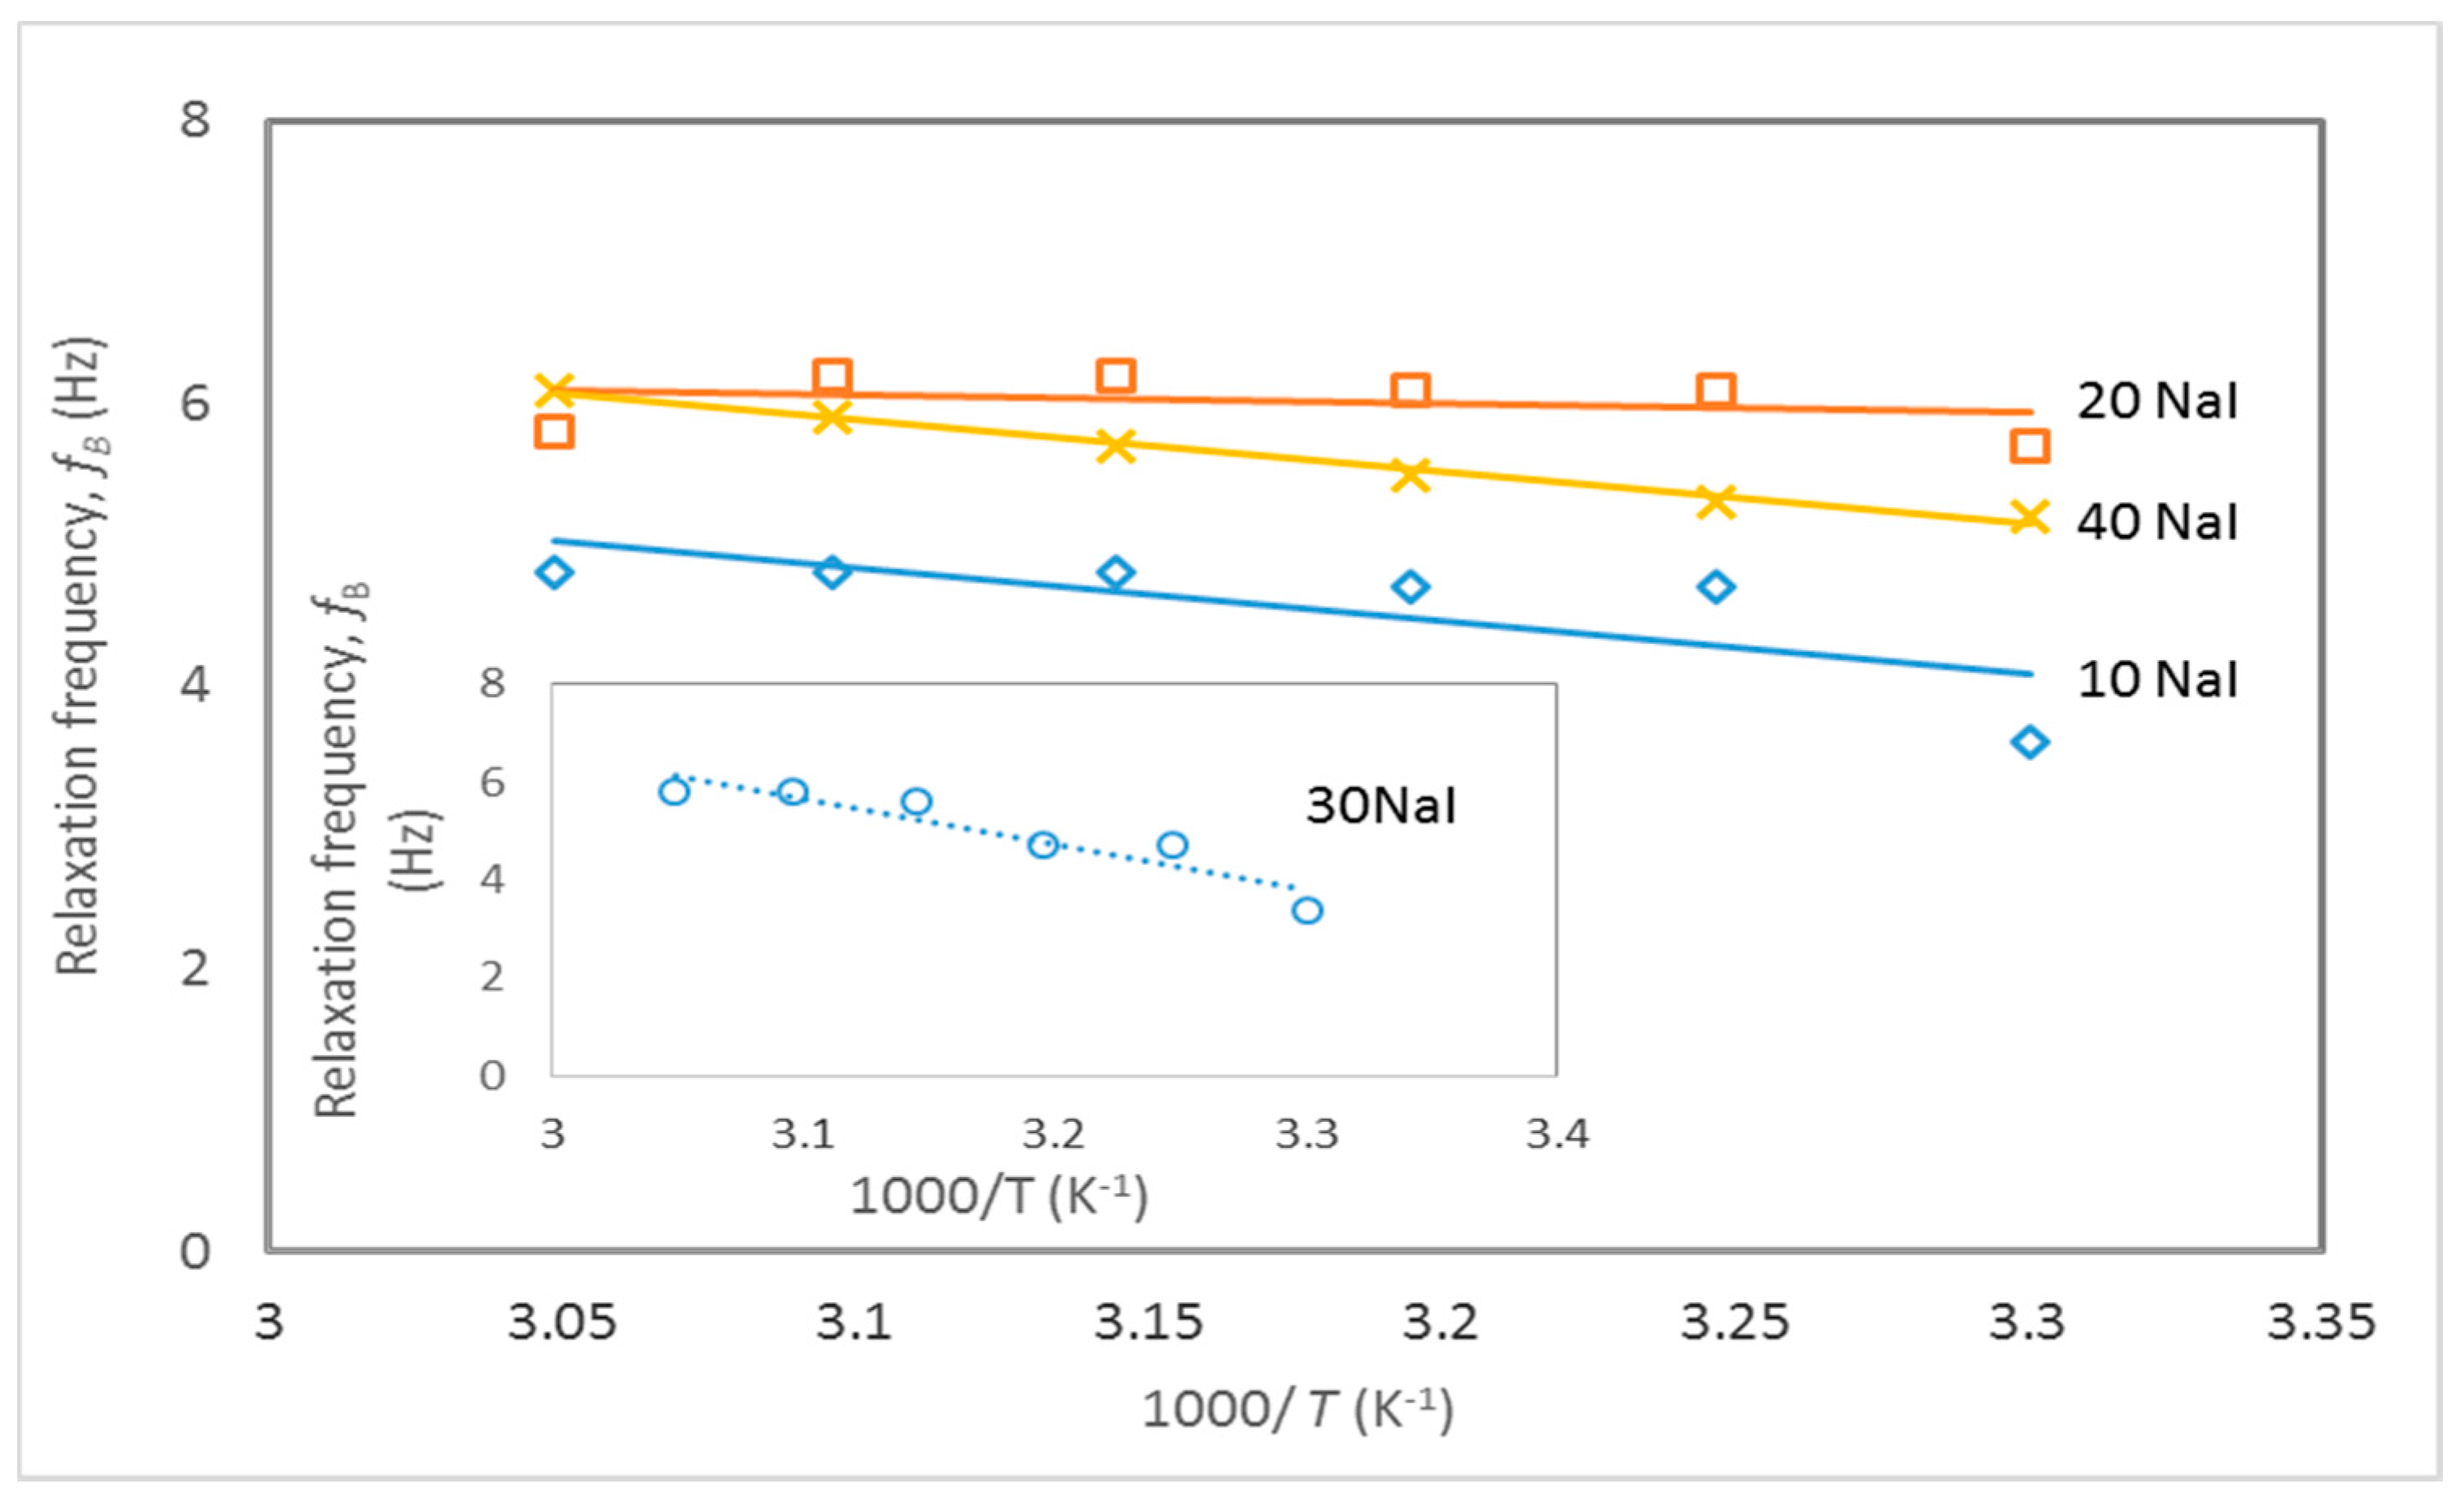
3.3. Temperature Dependence Analysis


| Concentration of Salt (wt%) | Activation Energy, Ef |
|---|---|
| 10 NaI | 0.73 |
| 20 NaI | 0.11 |
| 30 NaI | 1.83 |
| 40 NaI | 0.73 |
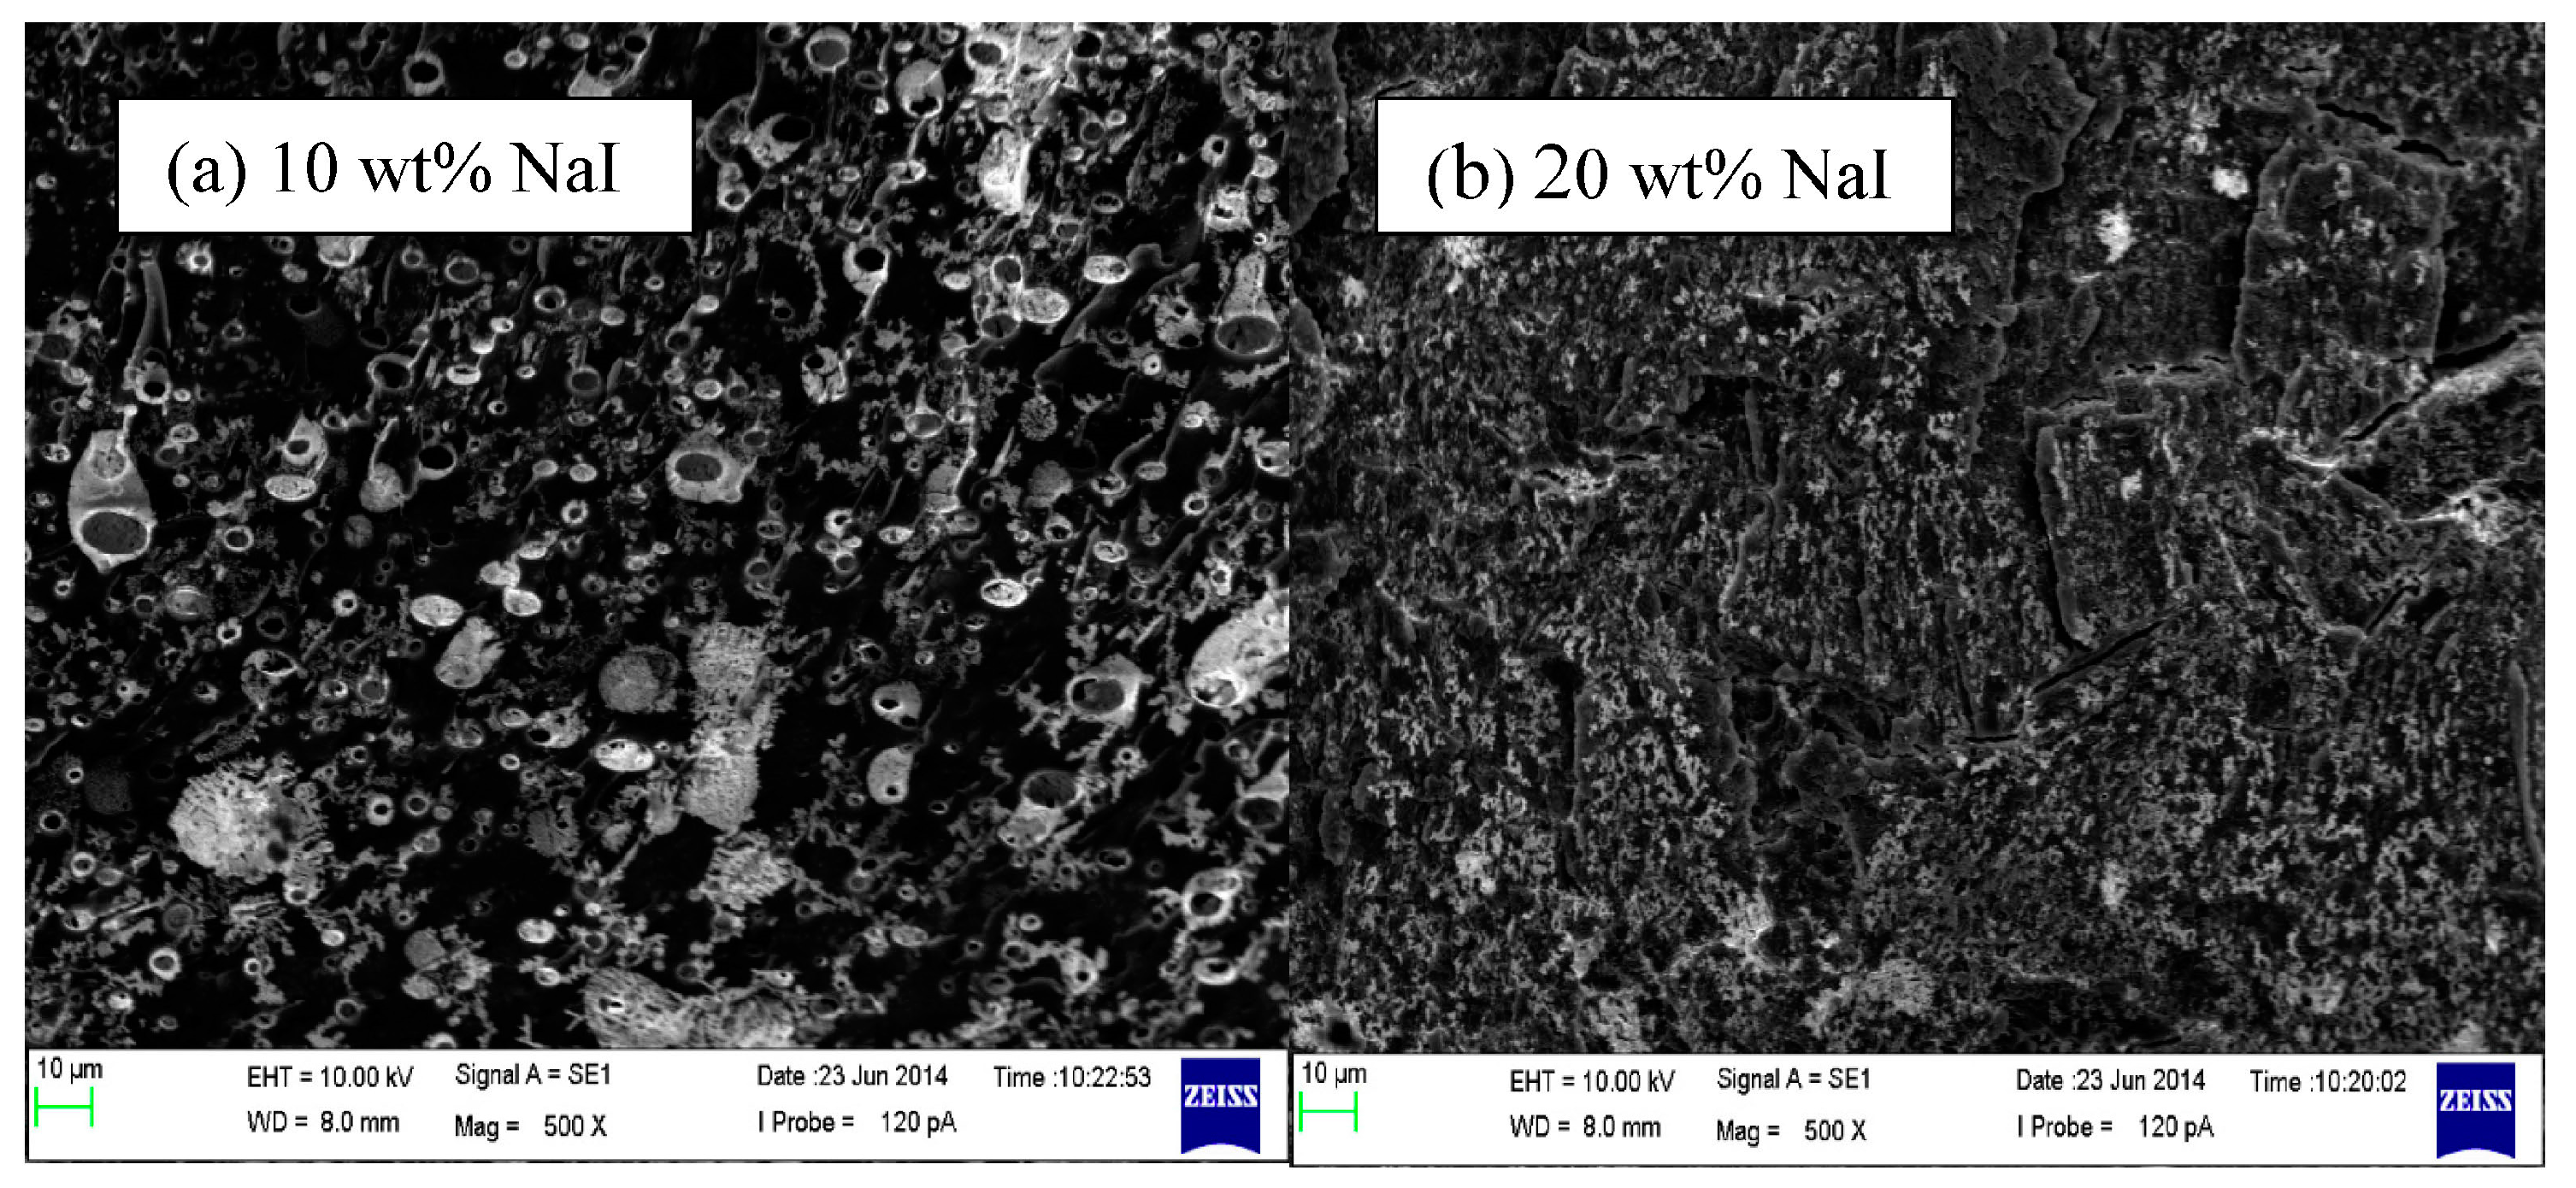
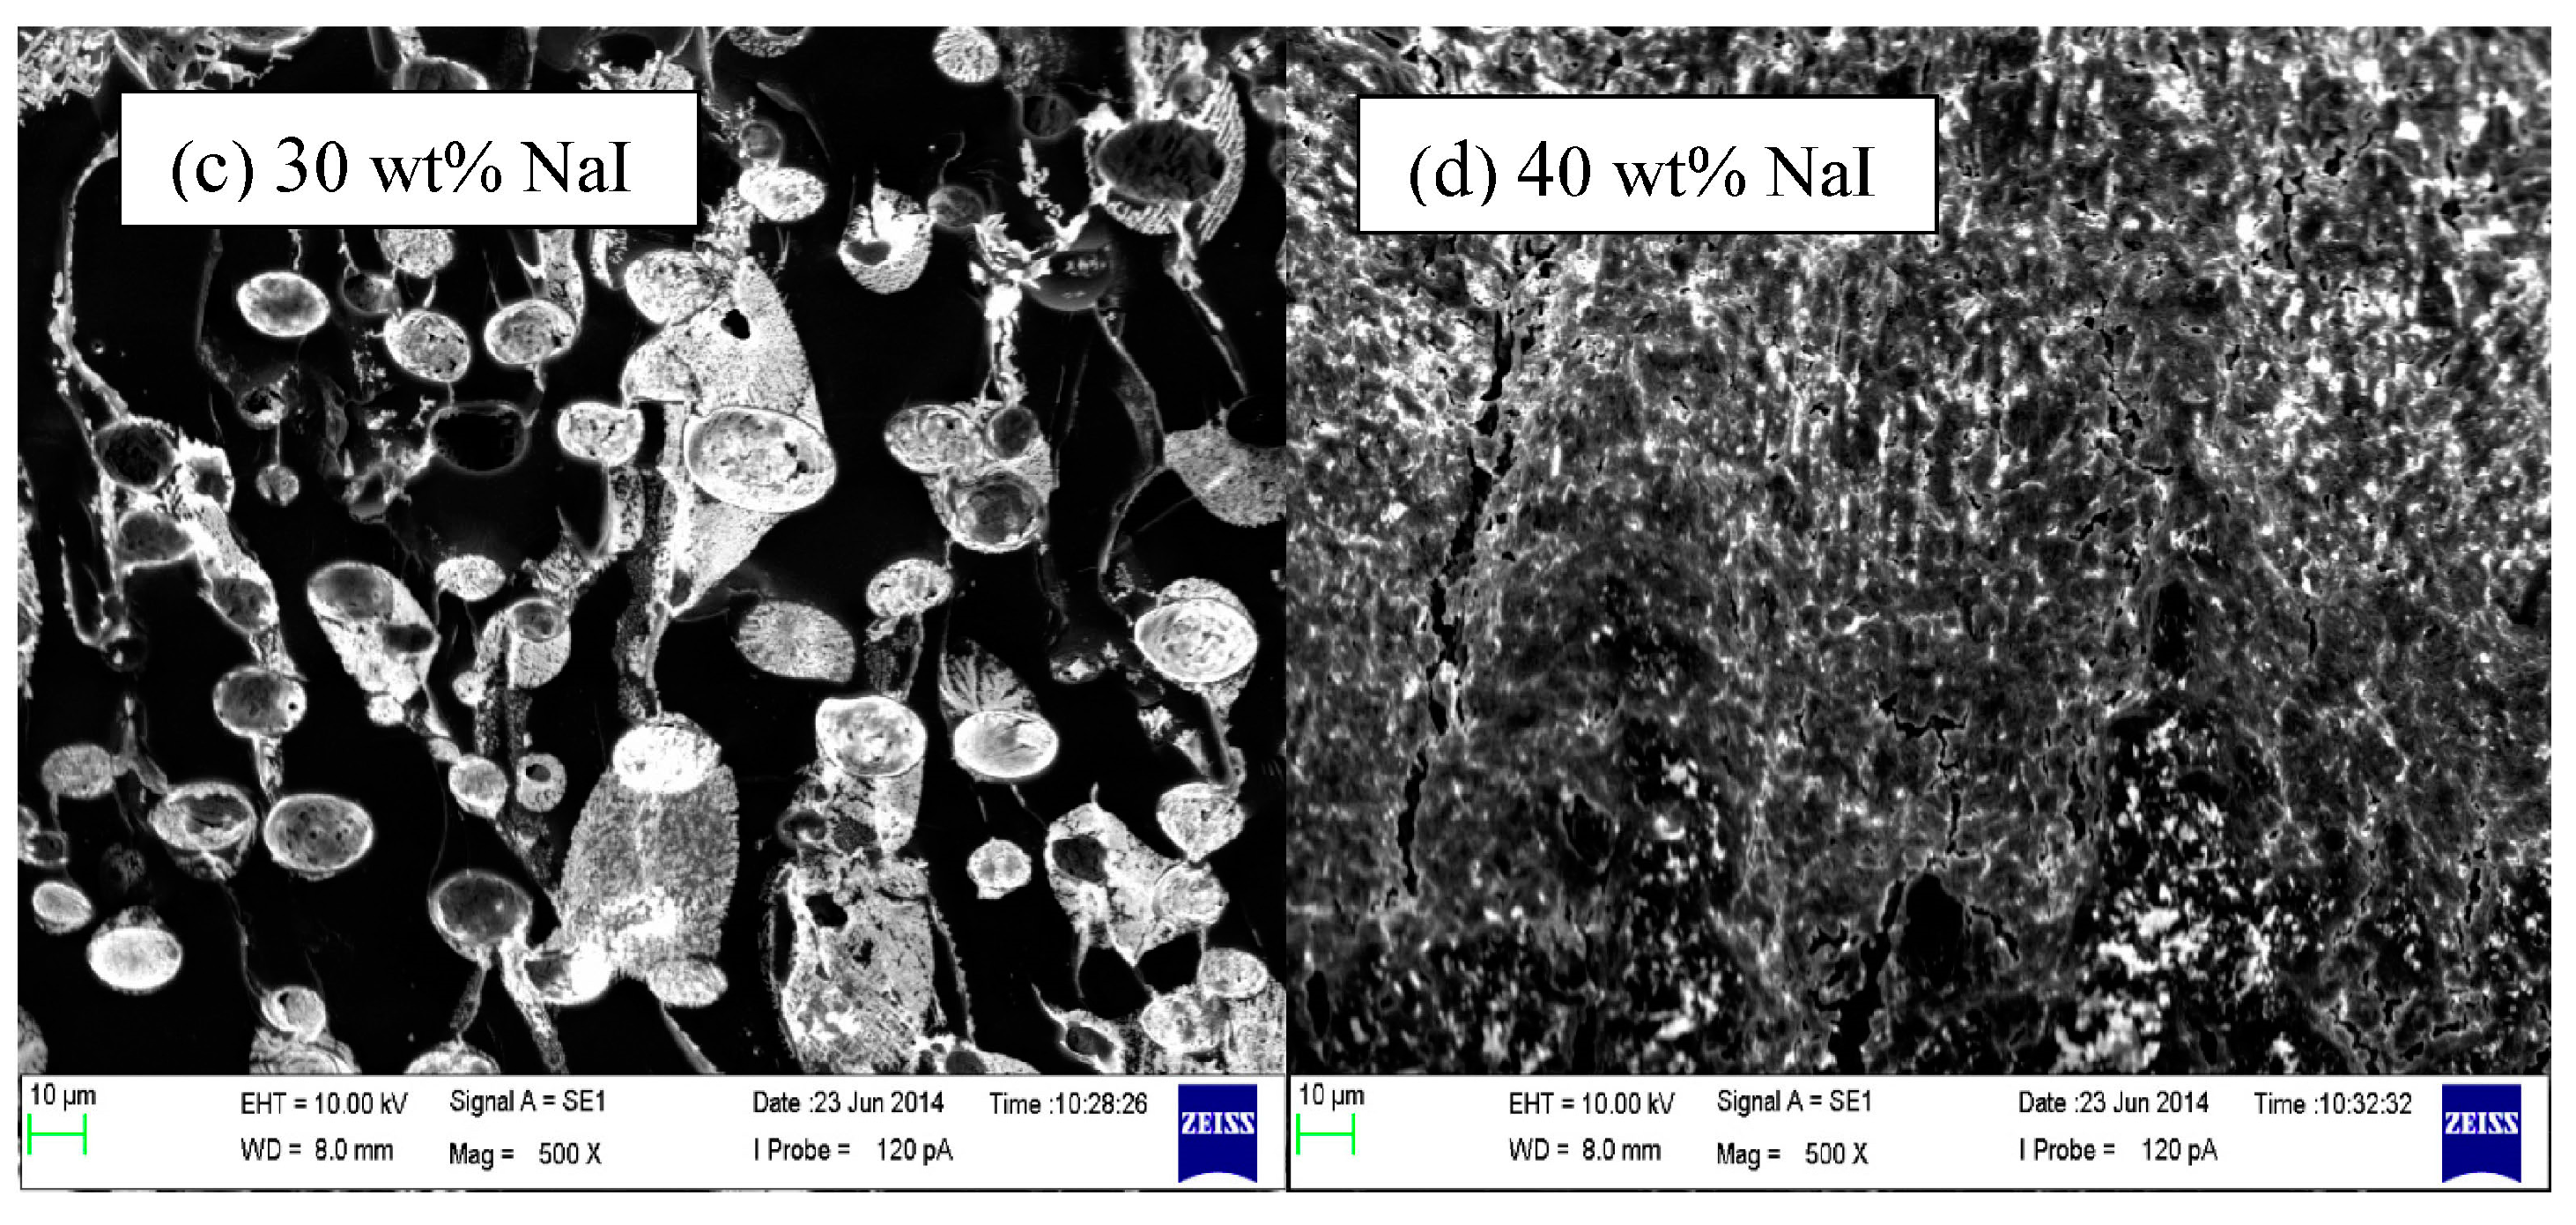
3.4. SEM Studies


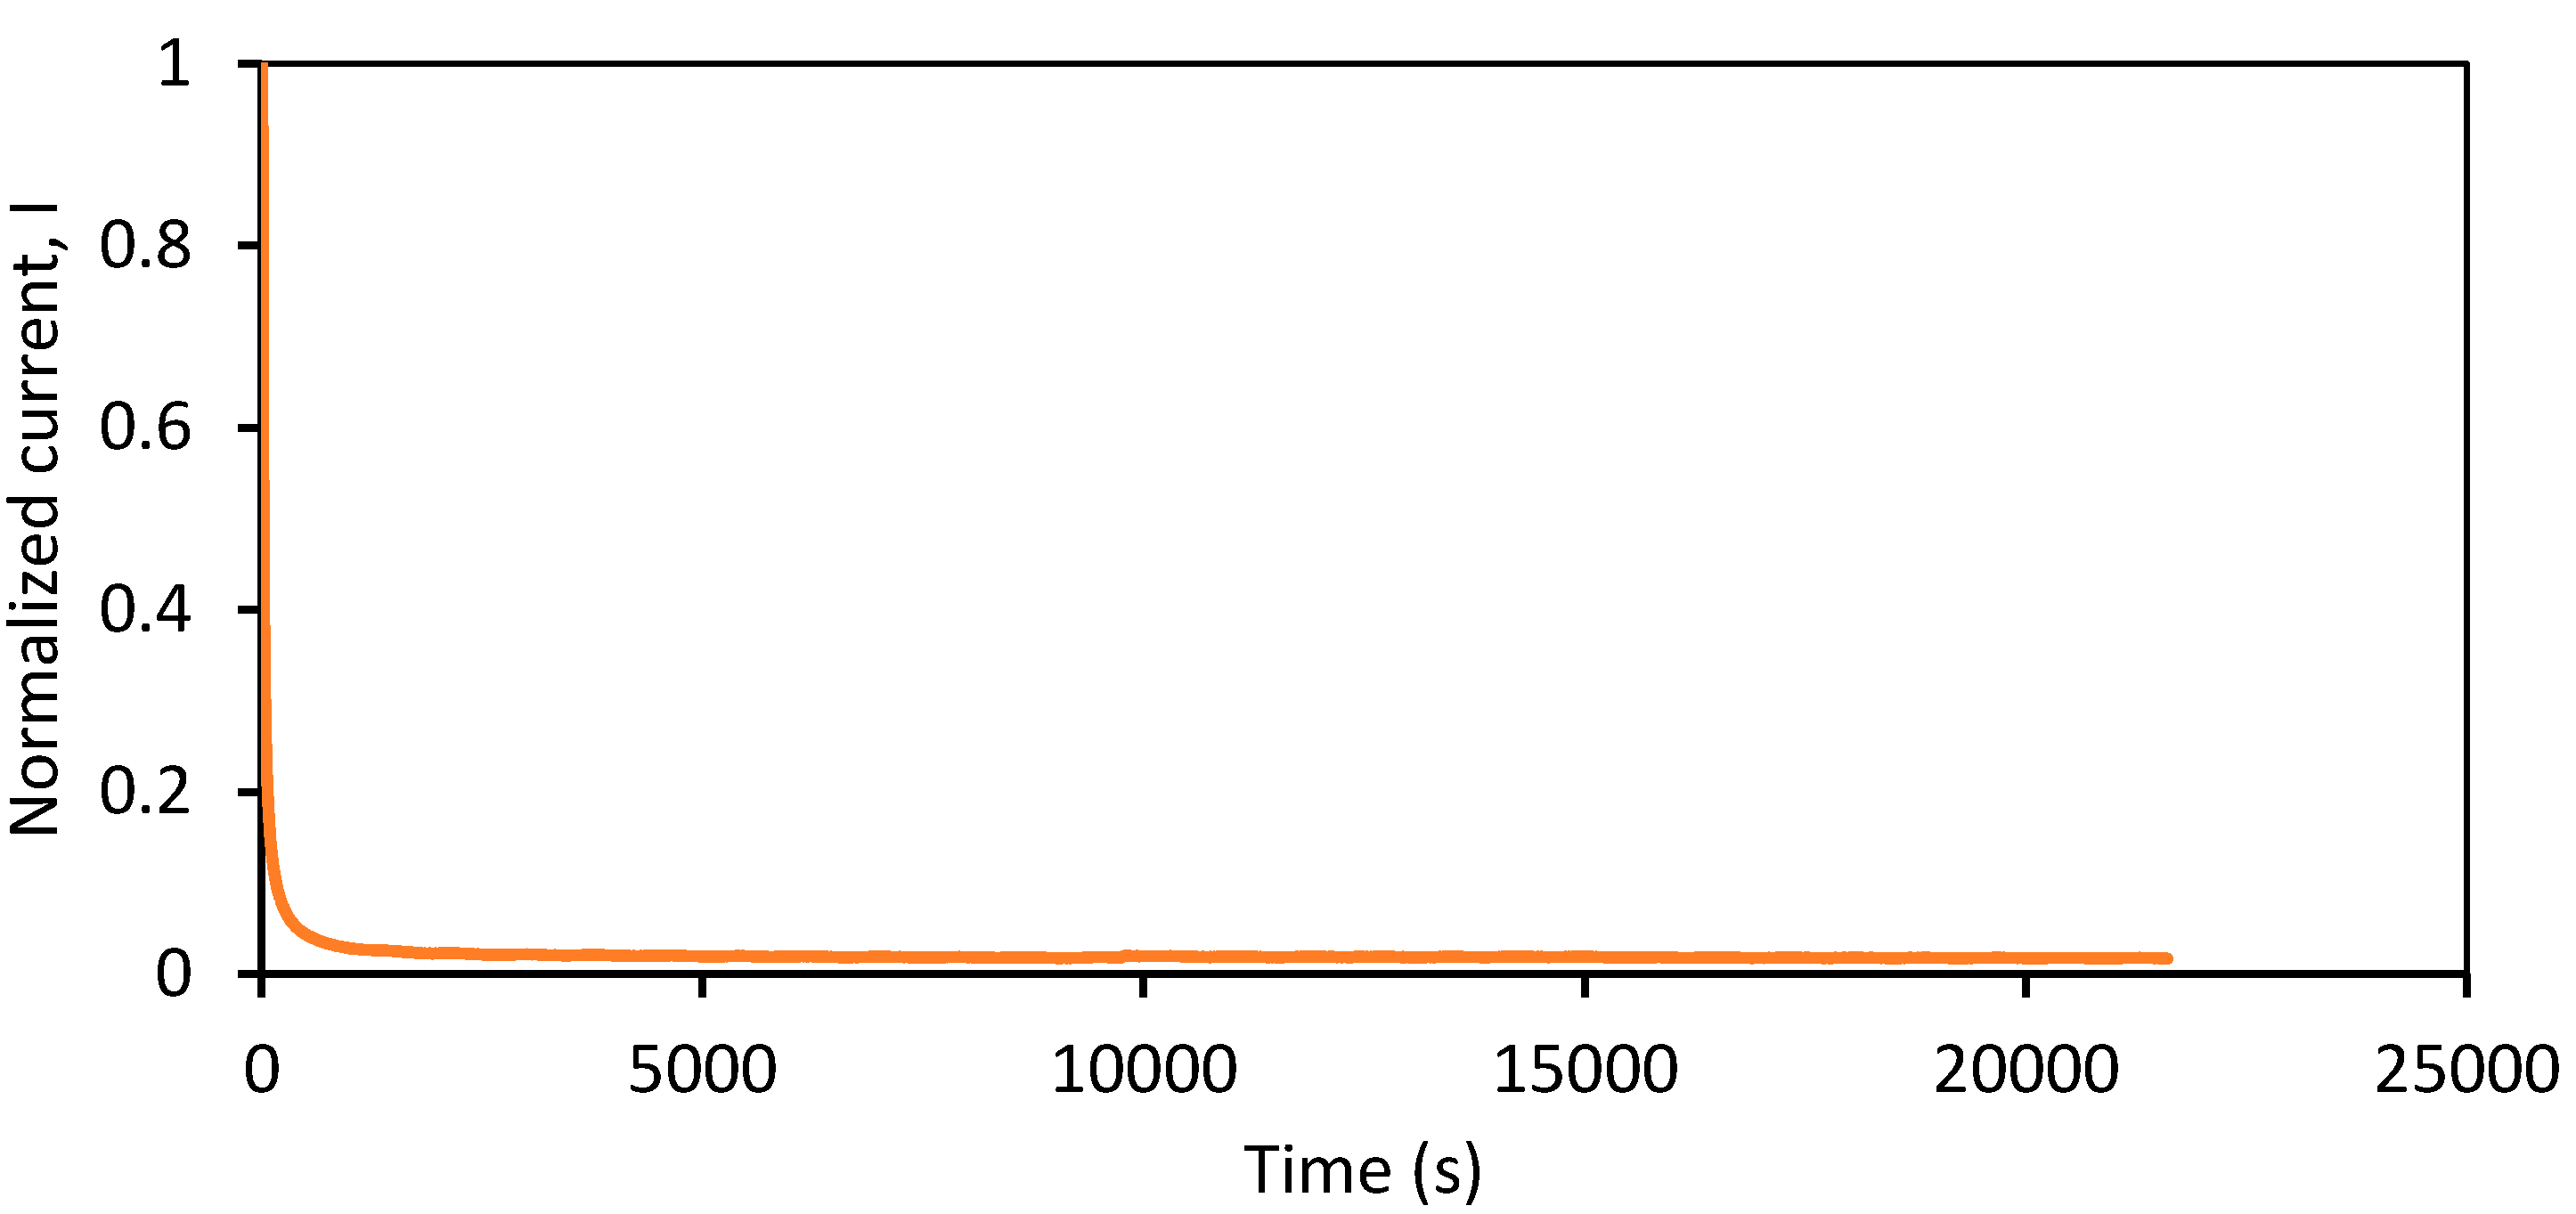
3.5. Transference Number

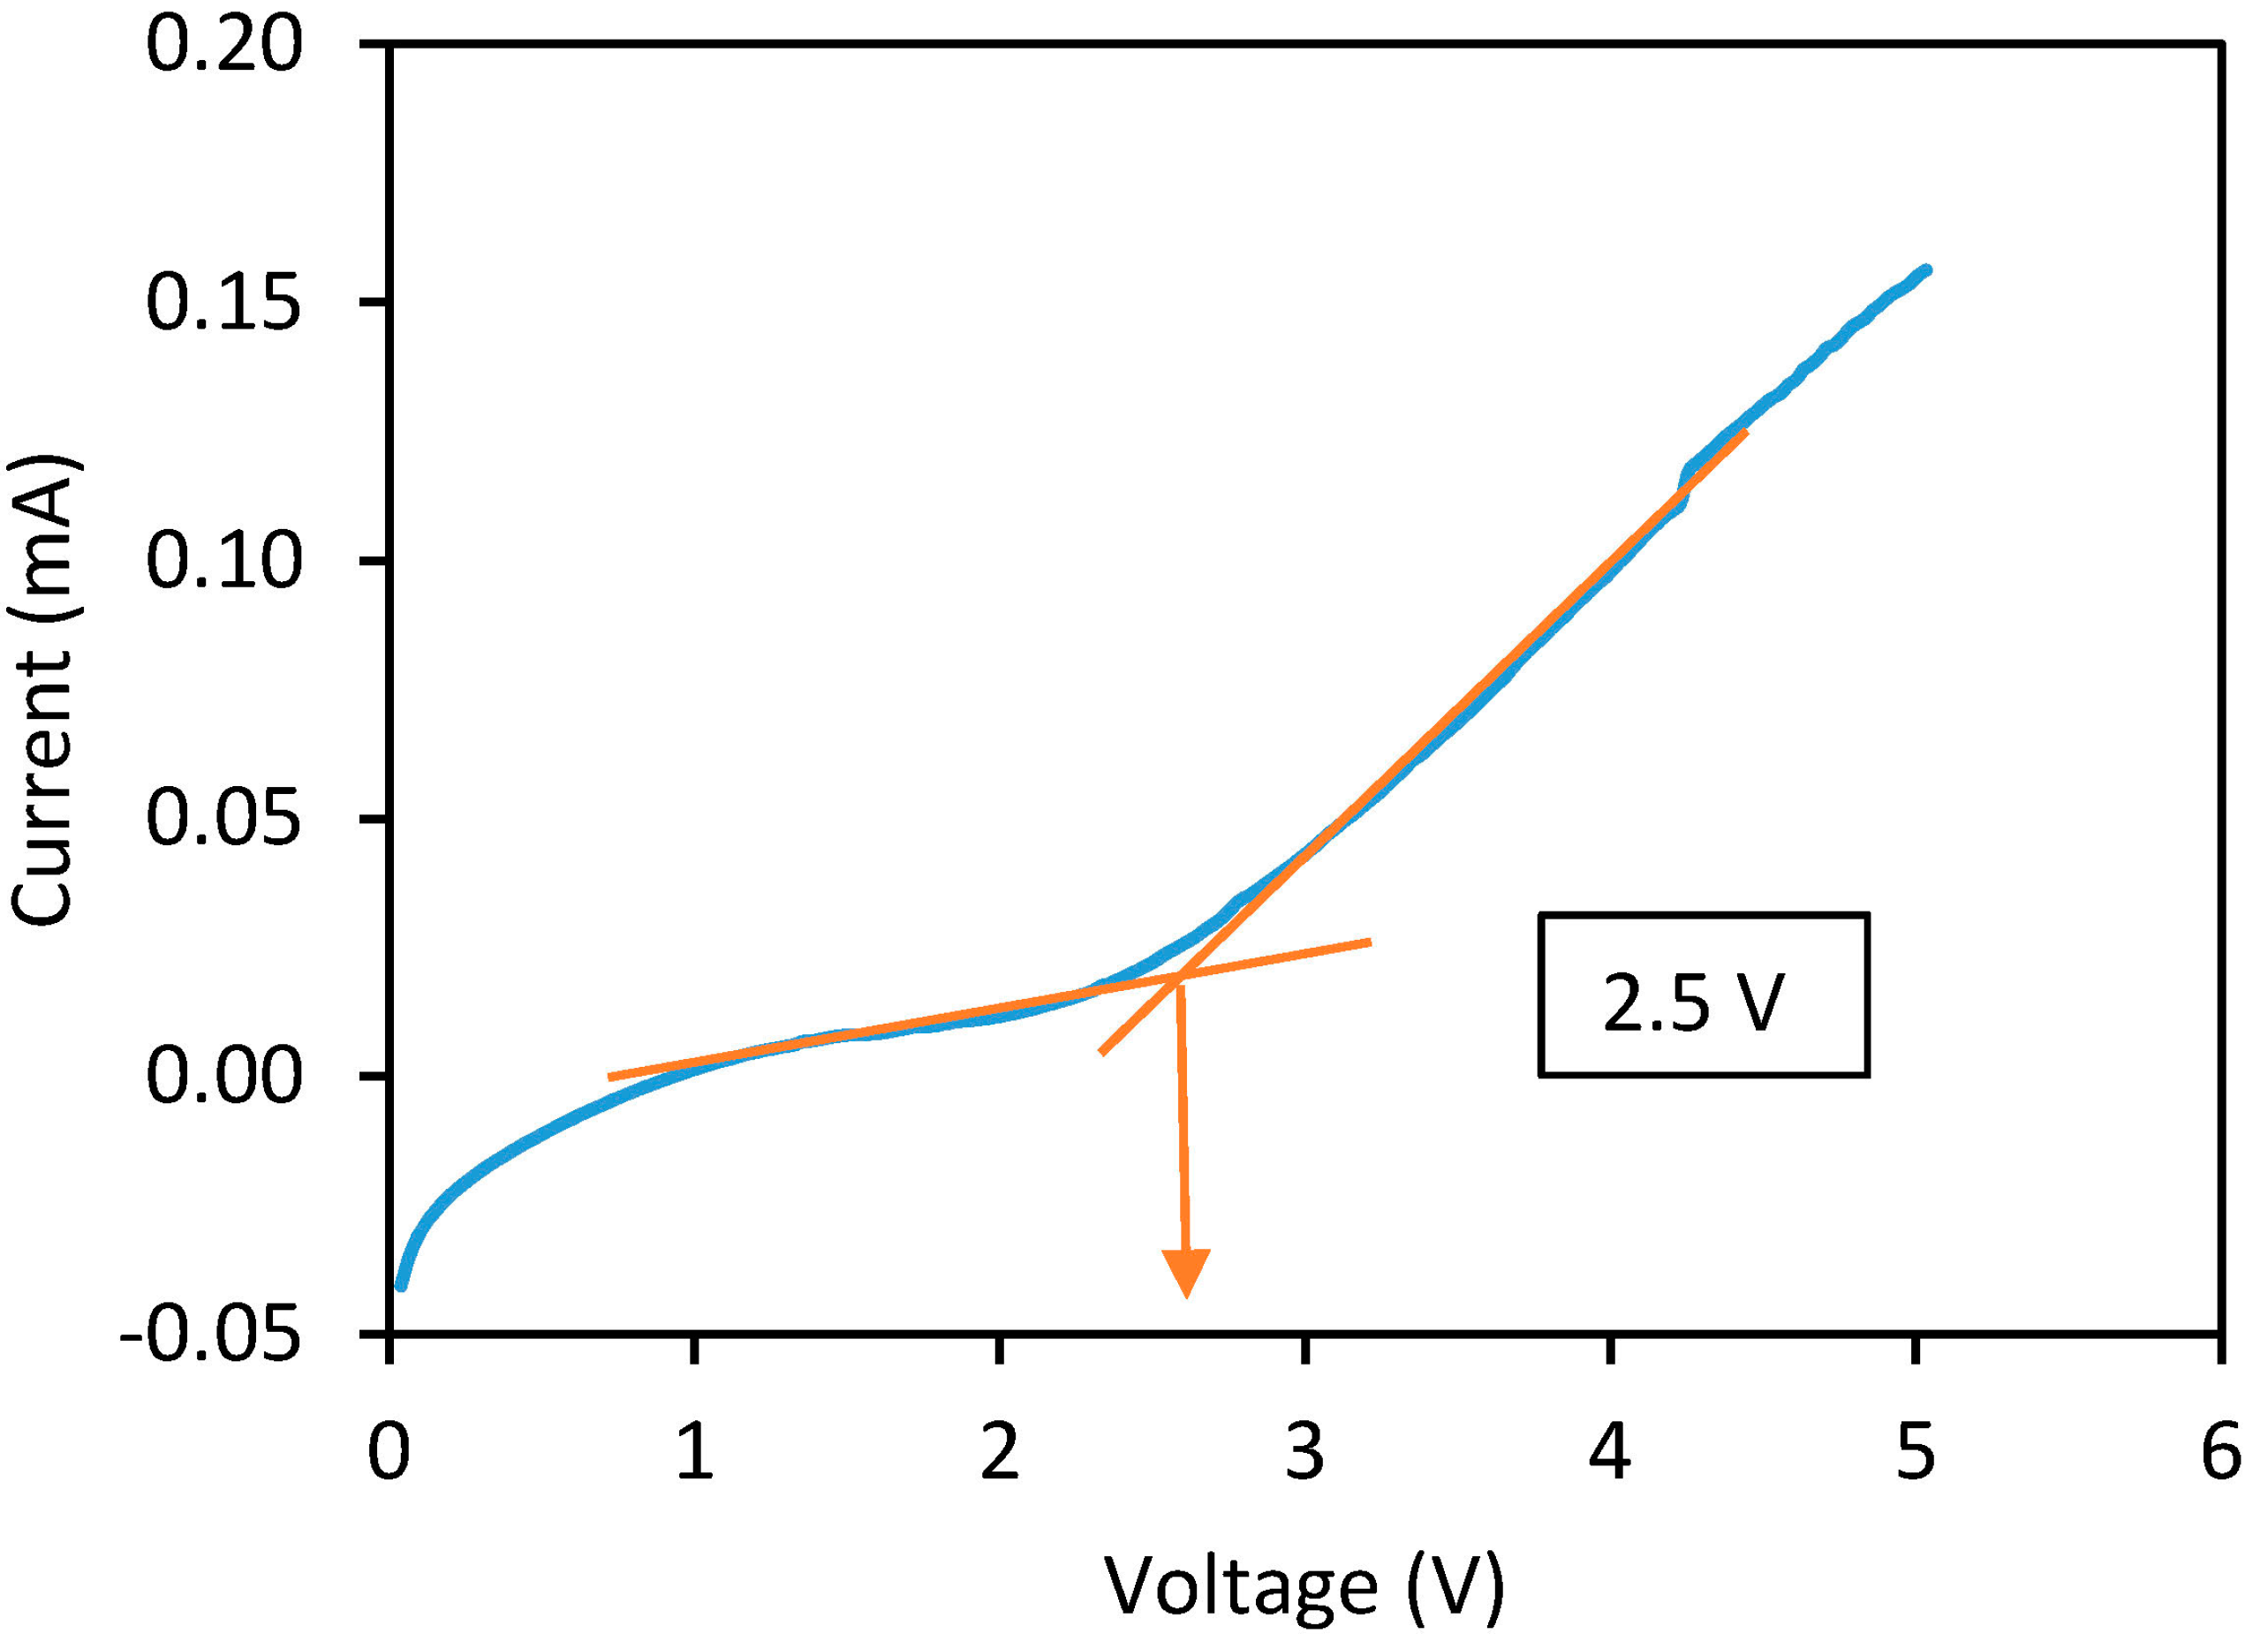
3.6. Linear Sweep Voltammetry

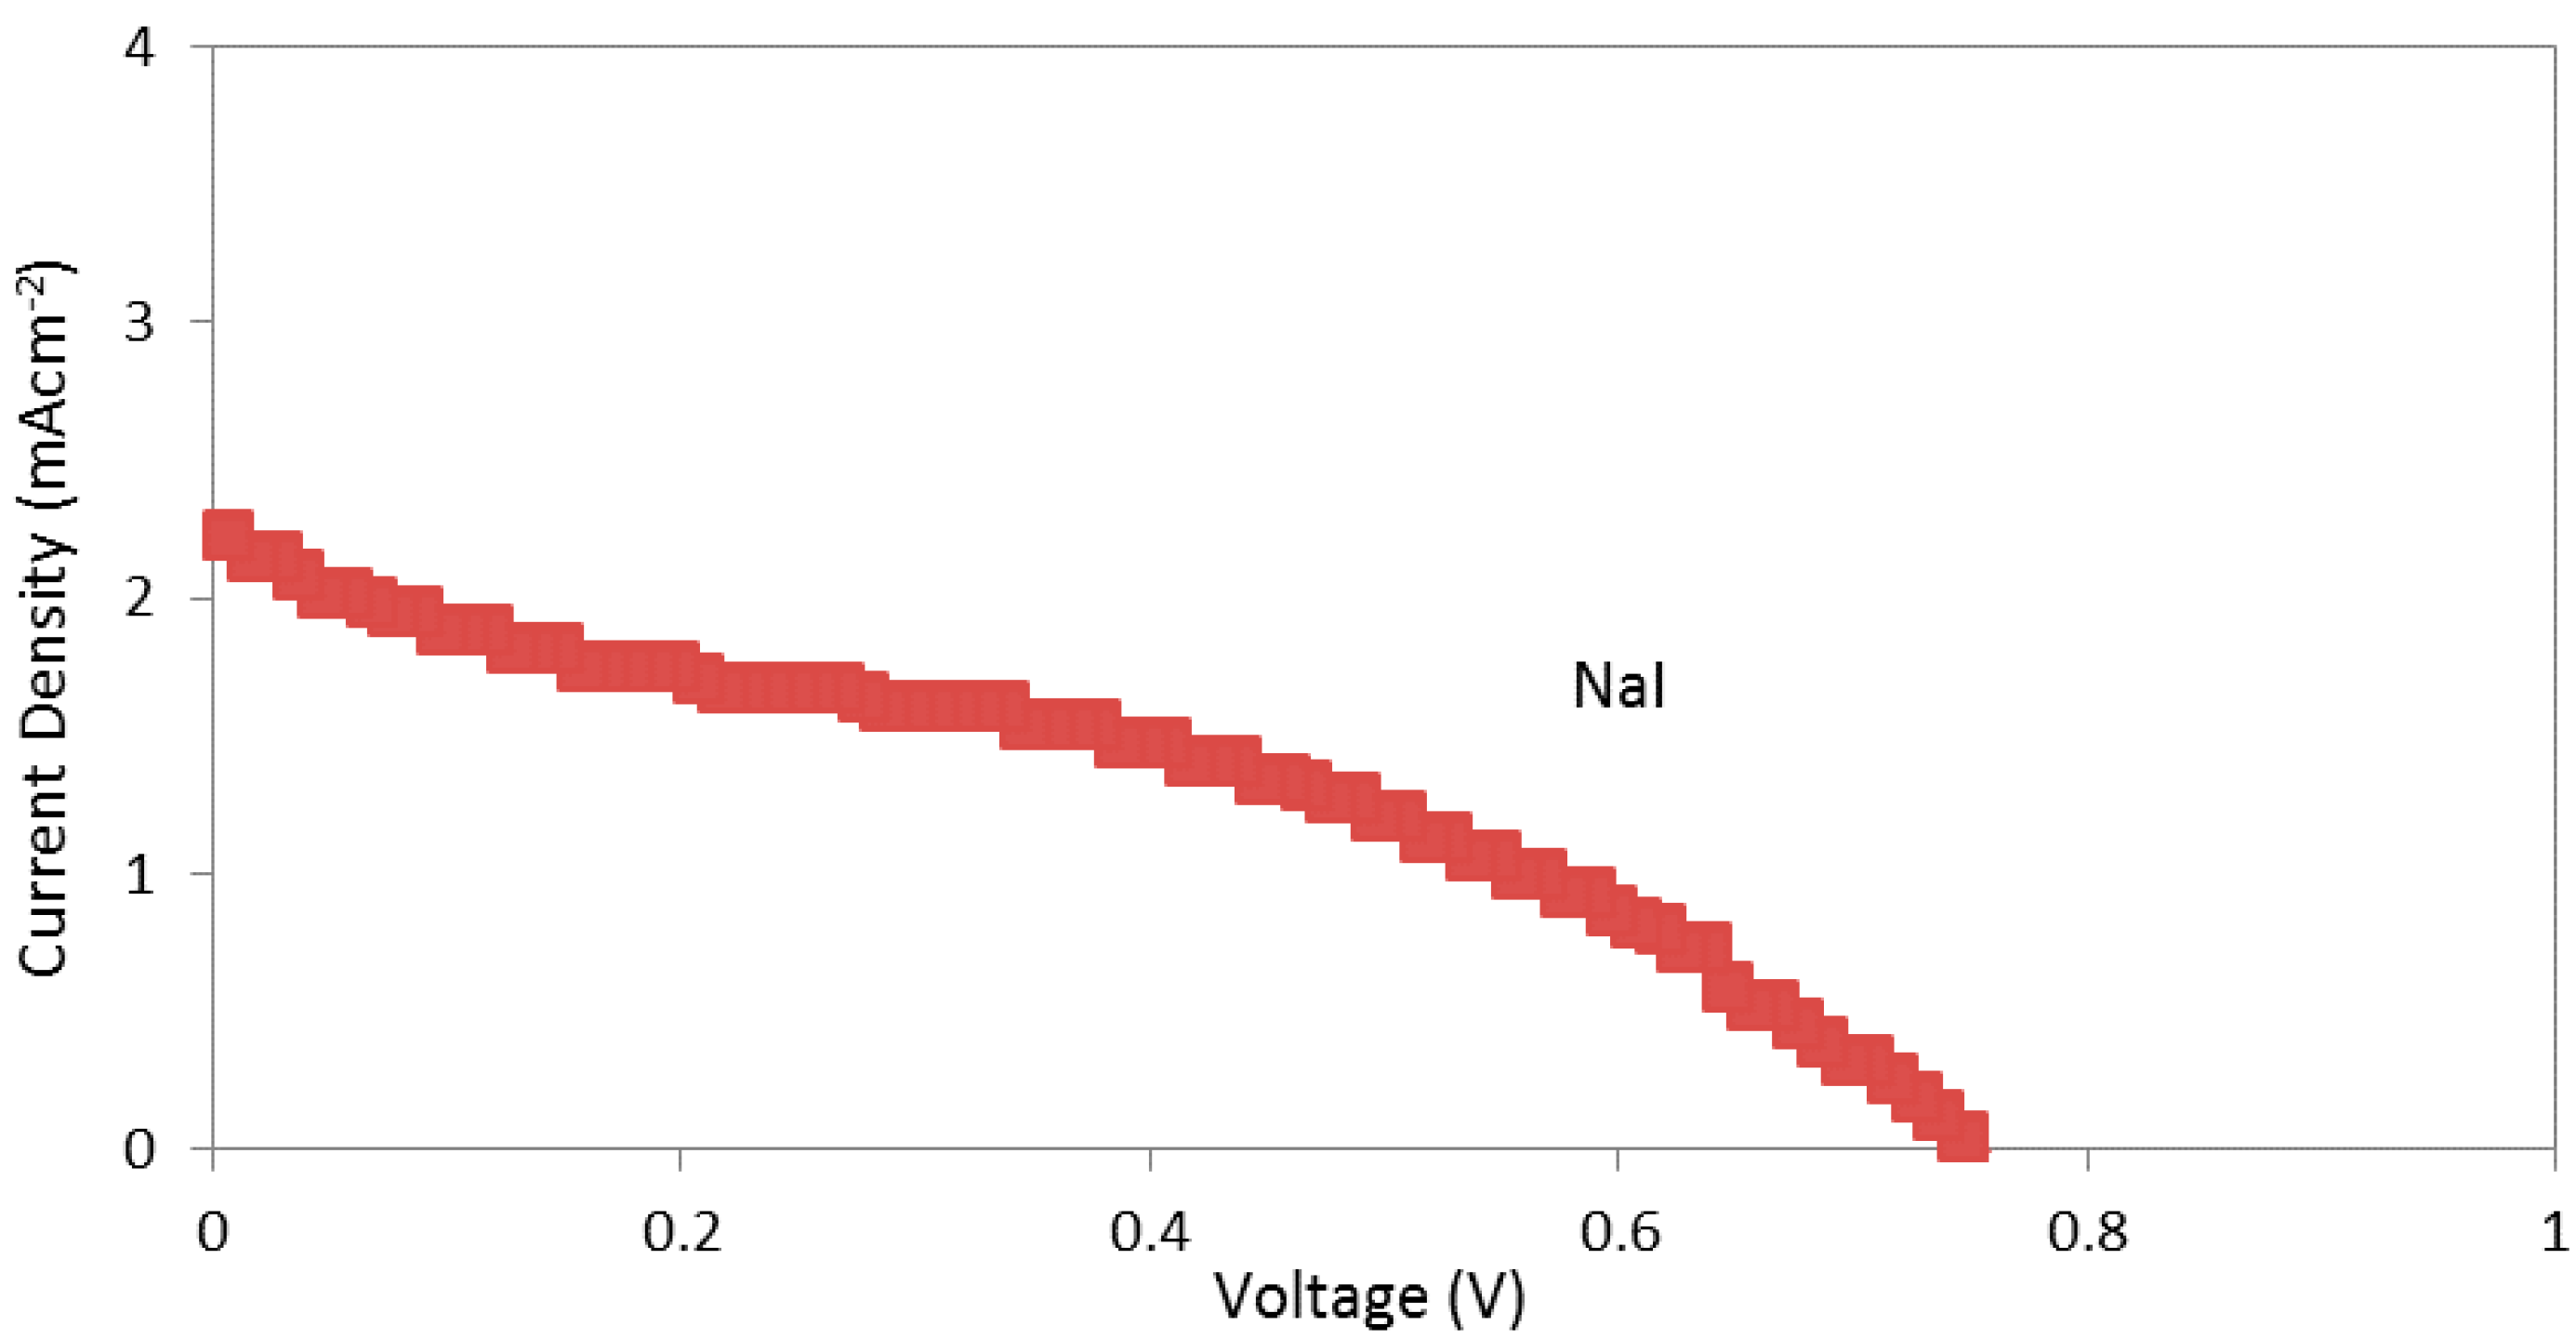
3.7. I–V Measurements

4. Conclusions
Acknowledgments
Author Contributions
Conflicts of Interest
References
- O’Regan, B.; Grätzel, M. A low-cost, high-efficiency solar cell based on dye-sensitized colloidal TiO2 films. Nature 1991, 353, 737–740. [Google Scholar] [CrossRef]
- Nogueira, A.F.; de Paoli, M.-A.; Montanari, I.; Monkhouse, R.; Nelson, J.; Durrant, J.R. Electron transfer dynamics in dye sensitized nanocrystalline solar cells using a polymer electrolyte. J. Phys. Chem. B 2001, 105, 7517–7524. [Google Scholar] [CrossRef]
- Günes, S.; Sariciftci, N.S. Hybrid solar cells. Inorg. Chim. Acta 2008, 361, 581–588. [Google Scholar] [CrossRef]
- Meng, Q.-B.; Takahashi, K.; Zhang, X.-T.; Sutanto, I.; Rao, T.; Sato, O.; Fujishima, A.; Watanabe, H.; Nakamori, T.; Uragami, M. Fabrication of an efficient solid-state dye-sensitized solar cell. Langmuir 2003, 19, 3572–3574. [Google Scholar] [CrossRef]
- Hirata, N.; Kroeze, J.E.; Park, T.; Jones, D.; Haque, S.A.; Holmes, A.B.; Durrant, J.R. Interface engineering for solid-state dye-sensitised nanocrystalline solar cells: The use of an organic redox cascade. Chem. Commun. 2006, 14, 535–537. [Google Scholar] [CrossRef]
- Yang, Y.; Zhang, J.; Zhou, C.; Wu, S.; Xu, S.; Liu, W.; Han, H.; Chen, B.; Zhao, X.-Z. Effect of lithium iodide addition on poly(ethylene oxide)−poly(vinylidene fluoride) polymer-blend electrolyte for dye-sensitized nanocrystalline solar cell. J. Phys. Chem. B 2008, 112, 6594–6602. [Google Scholar] [CrossRef] [PubMed]
- Nishimoto, A.; Watanabe, M.; Ikeda, Y.; Kohjiya, S. High ionic conductivity of new polymer electrolytes based on high molecular weight polyether comb polymers. Electrochim. Acta 1998, 43, 1177–1184. [Google Scholar] [CrossRef]
- Ramesh, S.; Arof, A. Ionic conductivity studies of plasticized poly(vinyl chloride) polymer electrolytes. Mater. Sci. Eng. B Solid 2001, 85, 11–15. [Google Scholar] [CrossRef]
- Bella, F.; Lamberti, A.; Sacco, A.; Bianco, S.; Chiodoni, A.; Bongiovanni, R. Novel electrode and electrolyte membranes: Towards flexible dye-sensitized solar cell combining vertically aligned TiO2 nanotube array and light-cured polymer network. J. Membr. Sci. 2014, 470, 125–131. [Google Scholar] [CrossRef]
- Bella, F.; Ozzello, E.D.; Sacco, A.; Bianco, S.; Bongiovanni, R. Polymer electrolytes for dye-sensitized solar cells prepared by photopolymerization of PEG-based oligomers. Int. J. Hydrog. Energy 2014, 39, 3036–3045. [Google Scholar] [CrossRef]
- Bella, F.; Sacco, A.; Salvador, G.P.; Bianco, S.; Tresso, E.; Pirri, C.F.; Bongiovanni, R. First pseudohalogen polymer electrolyte for dye-sensitized solar cells promising for in situ photopolymerization. J. Phys. Chem. C 2013, 117, 20421–20430. [Google Scholar] [CrossRef]
- Dzulkurnain, N.A.; Hanifah, S.A.; Ahmad, A.; Mohamed, N.S. Characterization of random methacrylate copolymers synthesized using free-radical bulk polymerization method. Int. J. Electrochem. Sci. 2015, 10, 84–92. [Google Scholar]
- Imperiyka, M.; Ahmad, A.; Hanifah, S.A.; Rahman, M.Y.A. Preparation and characterization of polymer electrolyte of glycidyl methacrylate-methyl methacrylate-LiClO4 plasticized with ethylene carbonate. Int. J. Polym. Sci. 2014, 2014. [Google Scholar] [CrossRef]
- Imperiyka, M.; Ahmad, A.; Hanifah, S.; Rahman, M.Y.A. Role of salt concentration lithium perchlorate on ionic conductivity and structural of (glycidyl methacrylate-co-ethyl methacrylate) (70/30) based on a solid polymer electrolyte. Adv. Mater. Res. 2013, 626, 454–458. [Google Scholar] [CrossRef]
- Dell, R.M. Batteries—Fifty years of materials development. Solid State Ion. 2000, 134, 139–158. [Google Scholar] [CrossRef]
- Ellis, B.L.; Nazar, L.F. Sodium and sodium-ion energy storage batteries. Curr. Opin. Solid State. Mater. 2012, 16, 168–177. [Google Scholar] [CrossRef]
- Egashira, M.; Asai, T.; Yoshimoto, N.; Morita, M. Ionic conductivity of ternary electrolyte containing sodium salt and ionic liquid. Electrochim. Acta 2011, 58, 95–98. [Google Scholar] [CrossRef]
- Osman, Z.; Isa, K.B.M.; Ahmad, A.; Othman, L. A comparative study of lithium and sodium salts in PAN-based ion conducting polymer electrolytes. Ionics 2010, 16, 431–435. [Google Scholar] [CrossRef]
- Bella, F.; Ozzello, E.D.; Bianco, S.; Bongiovanni, R. Photo-polymerization of acrylic/methacrylic gel–polymer electrolyte membranes for dye-sensitized solar cells. Chem. Eng. J. 2013, 225, 873–879. [Google Scholar] [CrossRef]
- Su’ait, M.; Ahmad, A.; Hamzah, H.; Rahman, M. Effect of lithium salt concentrations on blended 49% poly(methyl methacrylate) grafted natural rubber and poly(methyl methacrylate) based solid polymer electrolyte. Electrochim. Acta 2011, 57, 123–131. [Google Scholar] [CrossRef]
- Ahmad, A.; Rahman, M.; Su’ait, M.; Hamzah, H. Study of MG49-PMMA based solid polymer electrolyte. Open Mater. Sci. J. 2011, 5, 170–177. [Google Scholar] [CrossRef]
- Pavia, D.L.; Lampman, G.; Kriz, G.; Engel, R. Introduction to Organic Laboratory Techniques: A Small Scale Approach; Saunders College Pub, 1998. [Google Scholar]
- De Oliveira, H.; dos Santos, M.; dos Santos, C.; de Melo, C. Electrical properties of PVA/PPY blends. Synth. Metals 2003, 135, 447–448. [Google Scholar] [CrossRef]
- Rajendran, S.; Prabhu, M.R.; Rani, M.U. Ionic conduction in poly(vinyl chloride)/poly(ethyl methacrylate)-based polymer blend electrolytes complexed with different lithium salts. J. Power Sources 2008, 180, 880–883. [Google Scholar] [CrossRef]
- Kumar, D.; Hashmi, S. Ion transport and ion-filler-polymer interaction in poly(methyl methacrylate)-based, sodium ion conducting, gel polymer electrolytes dispersed with silica nanoparticles. J. Power Sources 2010, 195, 5101–5108. [Google Scholar] [CrossRef]
- Wu, S. Phase structure and adhesion in polymer blends: A criterion for rubber toughening. Polymer 1985, 26, 1855–1863. [Google Scholar] [CrossRef]
- Nagaoka, K.; Naruse, H.; Shinohara, I.; Watanabe, M. High ionic conductivity in poly(dimethyl siloxane-co-ethylene oxide) dissolving lithium perchlorate. J. Polym. Sci. Polym. Lett. Ed. 1984, 22, 659–663. [Google Scholar] [CrossRef]
- Kobayashi, N.; Uchiyama, M.; Shigehara, K.; Tsuchida, E. Ionically high conductive solid electrolytes composed of graft copolymer-lithium salt hybrids. J. Phys. Chem. 1985, 89, 987–991. [Google Scholar] [CrossRef]
- Subban, R.H.Y. Some Properties of plasticized and Composite PVC-Based Polymer Electrolytes and LiCoO2/PVC-LiCF3SO3-SiO2/MCMB Electrochemical Cells. Ph.D. Thesis, University of Malaya, Kuala Lumpur, Malaysis, 2004. [Google Scholar]
- Johansson, A.; Gogoll, A.; Tegenfeldt, J. Diffusion and ionic conductivity in Li(CF3SO3) PEG10 and LiN(CF3SO2)2 PEG10. Polymer 1996, 37, 1387–1393. [Google Scholar] [CrossRef]
- Adnan, S.; Mohamed, N. Electrical properties of novel Li4.08Zn0.04Si0.96O4 ceramic electrolyte at high temperatures. Ionics 2014, 20, 1641–1650. [Google Scholar]
- Orliukas, A.; Kezionis, A.; Kazakevicius, E. Impedance spectroscopy of solid electrolytes in the radio frequency range. Solid State Ion. 2005, 176, 2037–2043. [Google Scholar] [CrossRef]
- Buraidah, M.; Teo, L.; Majid, S.; Arof, A. Ionic conductivity by correlated barrier hopping in NH4I doped chitosan solid electrolyte. Phys. B 2009, 404, 1373–1379. [Google Scholar] [CrossRef]
- Su’ait, M.; Ahmad, A.; Hamzah, H.; Rahman, M. Preparation and characterization of PMMA–MG49–LiClO4 solid polymeric electrolyte. J. Phys. D Appl. Phys. 2009, 42. [Google Scholar] [CrossRef]
- Rajendran, S.; Sivakumar, P.; Babu, R.S. Studies on the salt concentration of a PVdF–PVC based polymer blend electrolyte. J. Power Sources 2007, 164, 815–821. [Google Scholar] [CrossRef]
- Subba Reddy, C.V.; Sharma, A.; Narasimha Rao, V. Conductivity and discharge characteristics of polyblend (PVP+ PVA+ KIO3) electrolyte. J. Power Sources 2003, 114, 338–345. [Google Scholar] [CrossRef]
- Rani, M.S.A.; Rudhziah, S.; Ahmad, A.; Mohamed, N.S. Biopolymer electrolyte based on derivatives of cellulose from kenaf bast fiber. Polymers 2014, 6, 2371–2385. [Google Scholar] [CrossRef]
- Ichino, T.; Takeshima, Y.; Takeshima, M.; Nishi, S. Japanese Patent Publication; NTT Co.: Tokyo, Japan, 1995; p. 335258. [Google Scholar]
- Rahman, M.; Salleh, M.; Talib, I.; Yahaya, M. Light intensity and temperature dependence on performance of a photoelectrochemical cells of ITO/TiO2/PVC–LiClO4/graphite. Ionics 2007, 13, 241–244. [Google Scholar] [CrossRef]
© 2015 by the authors; licensee MDPI, Basel, Switzerland. This article is an open access article distributed under the terms and conditions of the Creative Commons Attribution license (http://creativecommons.org/licenses/by/4.0/).
Share and Cite
Dzulkurnain, N.A.; Ahmad, A.; Mohamed, N.S. P(MMA-EMA) Random Copolymer Electrolytes Incorporating Sodium Iodide for Potential Application in a Dye-Sensitized Solar Cell. Polymers 2015, 7, 266-280. https://doi.org/10.3390/polym7020266
Dzulkurnain NA, Ahmad A, Mohamed NS. P(MMA-EMA) Random Copolymer Electrolytes Incorporating Sodium Iodide for Potential Application in a Dye-Sensitized Solar Cell. Polymers. 2015; 7(2):266-280. https://doi.org/10.3390/polym7020266
Chicago/Turabian StyleDzulkurnain, Nurul Akmaliah, Azizan Ahmad, and Nor Sabirin Mohamed. 2015. "P(MMA-EMA) Random Copolymer Electrolytes Incorporating Sodium Iodide for Potential Application in a Dye-Sensitized Solar Cell" Polymers 7, no. 2: 266-280. https://doi.org/10.3390/polym7020266