Article

Molecular Dynamics Simulations for Resolving Scaling Laws of Polyethylene Melts

1
Multi-Scale Soft-Matter Simulation Team, Research Center for Computational Design of Advanced Functional Materials, National Institute of Advanced Industrial Science and Technology (AIST), Central 2, 1-1-1 Umezono, Tsukuba, Ibaraki 305-8568, Japan
2
Department of Mechanical Engineering, Keio University, 3-14-1 Hiyoshi, Kohoku-ku, Yokohama, Kanagawa 223-8522, Japan
3
National Composite Center, Nagoya University, Furocho, Chikusa, Nagoya 464-8630, Japan
*
Author to whom correspondence should be addressed.
Polymers 2017, 9(1), 24; https://doi.org/10.3390/polym9010024
Submission received: 13 November 2016 / Revised: 16 December 2016 / Accepted: 4 January 2017 / Published: 12 January 2017
(This article belongs to the Special Issue Complex Fluid Rheology)

Abstract

:
Long-timescale molecular dynamics simulations were performed to estimate the actual physical nature of a united-atom model of polyethylene (PE). Several scaling laws for representative polymer properties are compared to theoretical predictions. Internal structure results indicate a clear departure from theoretical predictions that assume ideal chain statics. Chain motion deviates from predictions that assume ideal motion of short chains. With regard to linear viscoelasticity, the presence or absence of entanglements strongly affects the duration of the theoretical behavior. Overall, the results indicate that Gaussian statics and dynamics are not necessarily established for real atomistic models of PE. Moreover, the actual physical nature should be carefully considered when using atomistic models for applications that expect typical polymer behaviors.

1. Introduction

Rheological predictions for specific polymer materials must be improved for advances in polymer-based technologies. Fundamentally, this problem originates from the complexity of polymer structure, dynamics, and physical properties. For example, processes that govern polymer properties change drastically over different time scales. Importantly, phenomena that occur over a wide range of timescales are closely related to each other; i.e., structure and dynamics at the micro-scale can affect properties at the meso- and macro-scales [1,2,3]. Many polymer models have been developed for each scale and have been studied for many years [4,5,6,7,8,9,10,11,12]. At the micro- and meso-scales, molecular dynamics (MD), Monte Carlo, and metadynamics simulations that utilize molecular models of polymers are promising approaches [13,14,15,16]. In particular, MD simulations can estimate entangled polymer dynamics via explicit equation-of-motion calculations of intra- and intermolecular interactions. Recent advances in computer power have enabled a wide range of MD simulations for polymers [17,18,19,20,21,22,23,24,25]. It is now possible that the actual physical nature of each molecular model can be precisely evaluated and discussed. The universality of polymer dynamics predicted by theoretical approaches that use single chains and mean-fields has not been established for actual molecular models. For example, Gaussian statistics assumed in Rouse models is not observed for molecular models unless the molecular weight is sufficiently high. Non-Gaussian statistics affects the dynamics, which then deviate from predictions of the Rouse model. While these deviations are often concealed in scaling laws, this issue should be carefully considered.
An all-atomistic (AA) molecular model is potentially the most precise classical model; however, the equilibrating of AA polymer systems is much more difficult than that of united-atom (UA) polymer systems. For instance, Harmandaris and Kremer reported that the dynamics of AA polystyrene (PS) systems was about 120 times slower than that of UA PS systems [26]. It implies that the precise estimation of actual physical nature for AA polymer systems is challenging, even though using the recent computational power. Therefore, UA models are widely used to perform MD simulations of polymers. For UA models of the common polymer polyethylene (PE), the anisotropic united atom (AUA) [27], optimized potentials for liquid simulations (OPLS)-UA [28] and transferable potentials for phase equilibria force field (TraPPE)-UA [29] models are widely accepted [30,31,32,33,34,35,36]. MD simulations using UA PE models have been recently performed for a wide range of polymer nanocomposites [37,38], polymer interfaces [39,40,41], ring polymers [42], the nucleation of polymer droplets [43], the Fermi–Pasta–Ulam problem in realistic systems [44,45], and a better understanding of macroscopic mechanical properties [21,46,47,48,49]. However, polymer properties at long timescales need to be carefully evaluated for validation of models. Here, we performed long-time MD simulations using the TraPPE-UA PE model. To examine the actual physical nature of the model, several scaling laws for representative polymer properties were estimated and compared to some theoretical predictions.

2. Methodology

MD simulations of PE melts were performed using the TraPPE-UA PE model [29]. Two different types of united atoms ( CH 3 and CH 2 ) were defined in a PE chain, whose non-bonded interactions were described by Lennard–Jones 12–6 potentials. All bond lengths were kept rigid using the LINCS algorithm [50], whereas a harmonic potential was used to describe bond angle bending. Standard torsional potentials were used to describe rotations along bonds in the aliphatic backbone. These dihedral potentials counted also for the 1–4 non-bonded interactions. Using this UA model, we performed atomistic MD simulations for PE melts with molecular weight, M, ranging from 422 . 8 to 2807 g / mol . The molecular dynamics package GROMACS [51] was used for effective computing. The different PE systems that have been simulated are presented in Table 1. Initial well-equilibrated atomistic structures were obtained by long-time MD simulations (over 100 ns ) with intermittent pressure rising and temperature falling processes at constant particle number, pressure, and temperature ensembles. The equilibration of systems was confirmed from comparison with previous reports [36]. The long-time MD simulations for product runs were performed with a constant particle number, volume, and temperature ensemble using the Nosé–Hoover thermostat [52,53]. To attain the precise relaxation dynamics quickly, the density ρ and temperature T were set to 0 . 650 g / cm 3 and 500 K , respectively. Non-bonded interactions were cut off beyond 1 . 2 nm . The Verlet leapfrog integrator [54] was used with three-dimensional periodic boundary conditions and a time step of 2 fs . For M = 422 . 8 983 . 9 g / mol , a total of 5 × 10 7 time steps (= 100 ns ) of equilibrium simulations were performed for three independent initial structures. For M = 1405 2106 g / mol , a total of 2 . 5 × 10 8 time steps (= 500 ns ) in equilibrium simulations were performed for six independent initial structures. For M = 2807 g / mol , a total of 4 × 10 8 time steps (= 800 ns ) in equilibrium simulations were performed for six independent initial structures.

3. Results and Discussion

3.1. Static Properties

In Flory’s theory [55] of polymer melts, equilibrium chains with uniform lengths are expected to satisfy ideal Gaussian statics. However, the chain length required to satisfy the theory is non-trivial and depends on the polymer architecture and model description. To evaluate Gaussian statics in polymer melts, the scaling law relationship between the number of beads per chain N ( M ). In this work, N is equal to the number of carbons in the PE chain), and the mean-square end-to-end distance R 2 , and the mean-square radius of gyration R G 2 were computed. The terms R 2 and R G 2 are given by:
R 2 = R 2 ( r N r 1 ) 2 ,
R G 2 = 1 N j = 1 N ( r j r c . m . ) 2 ,
r c . m . = 1 N j = 1 N r j ,
where R is the end-to-end vector, r 1 and r N are the coordinates of the chain ends, and r c . m . is the center-of-mass coordinate of the chain. In Flory’s theory, R 2 and R G 2 scale as M. Figure 1 shows the results for (a) R 2 M, (b) R G 2 M scalings, and (c) the ratio R 2 / R G 2 with respect to M. In general, universal polymer behavior is observed for N > N e , where N e is the critical length that indicates onset of chain entanglement [1,2]. In the UA PE model, N e 80 was estimated from the primitive pass analysis [56,57,58]. Thus, curve fitting was done for the R 2 M and R G 2 M at M > M e , where M e corresponds to N e . R 2 and R G 2 scale with M 1 . 052 and M 1 . 121 , respectively. These differ by 5.2% and 12%, respectively, from values expected for ideal chains. The discrepancy was observed for short-chain conditions, indicating non-Gaussian statics. The ratio R 2 / R G 2 deviates from the behavior of an ideal chain. The slow convergence to the ideal value ( R 2 / R G 2 = 6 ) is observed with increasing M. This can be problematic when PE chains are expected to satisfy the typical polymer behavior (i.e., static universality).
The static structure factor S ( q ) of an individual chain reveals the internal structure of polymer melts, and is given by:
S ( q ) = 1 + 1 N j k exp [ i q · ( r j r k ) ] ,
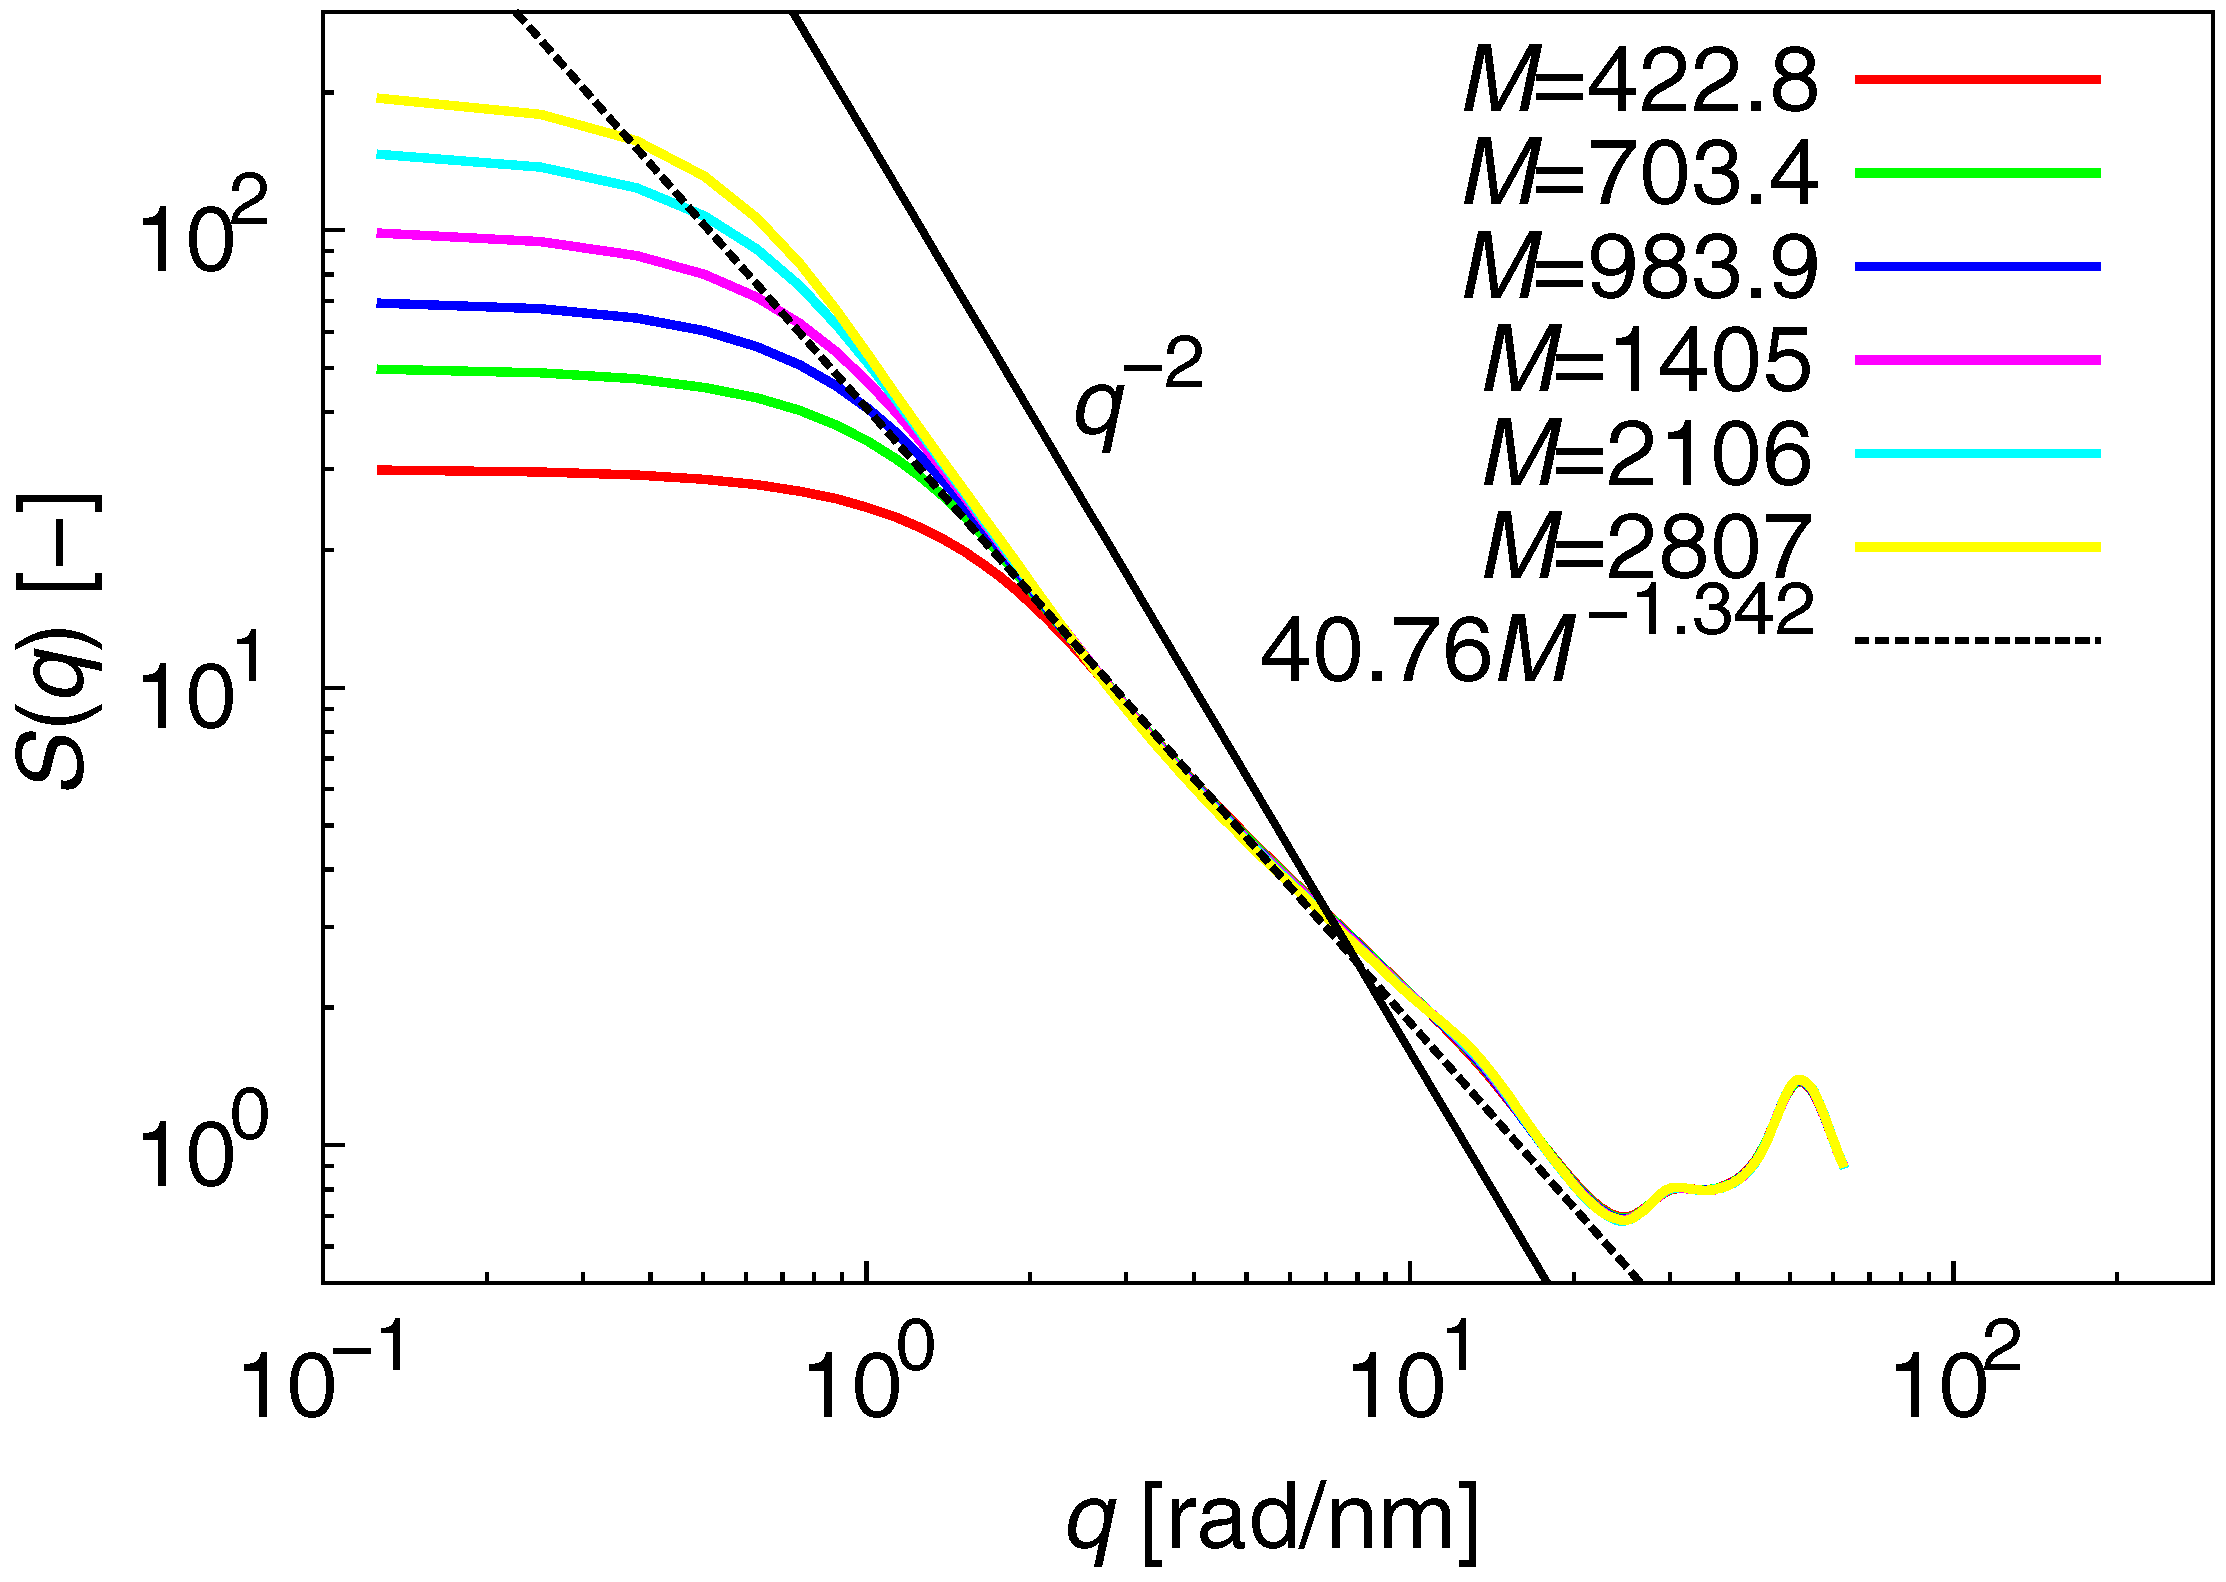
where q is a spatial frequency equal to 2 π / r , and r is an intra- or intermolecular distance. The fractal scattering of S ( q ) q 1 / ν is expected to be equal to q 2 ( ν = 1 / 2 ) and be independent of chain length. Figure 2 shows the results for S ( q ) . The unique S ( q ) shape is observed for q > 2 . 0 rad / nm ; however, the fractal scattering is clearly different from that expected for an ideal chain. This reveals that the expected cancellation of dispersion forces for polymer melts [55] is not entirely satisfied in actual molecular models. The fractal scattering of S ( q ) at 2 . 0 rad / nm < q < 10 rad / nm was estimated to be q 1 . 342 ( ν = 0 . 7452 ), which differs by 33% from the expected value. These results indicate that non-Gaussian statics dominate the internal structure of polymer melts, irrespective of chain length.
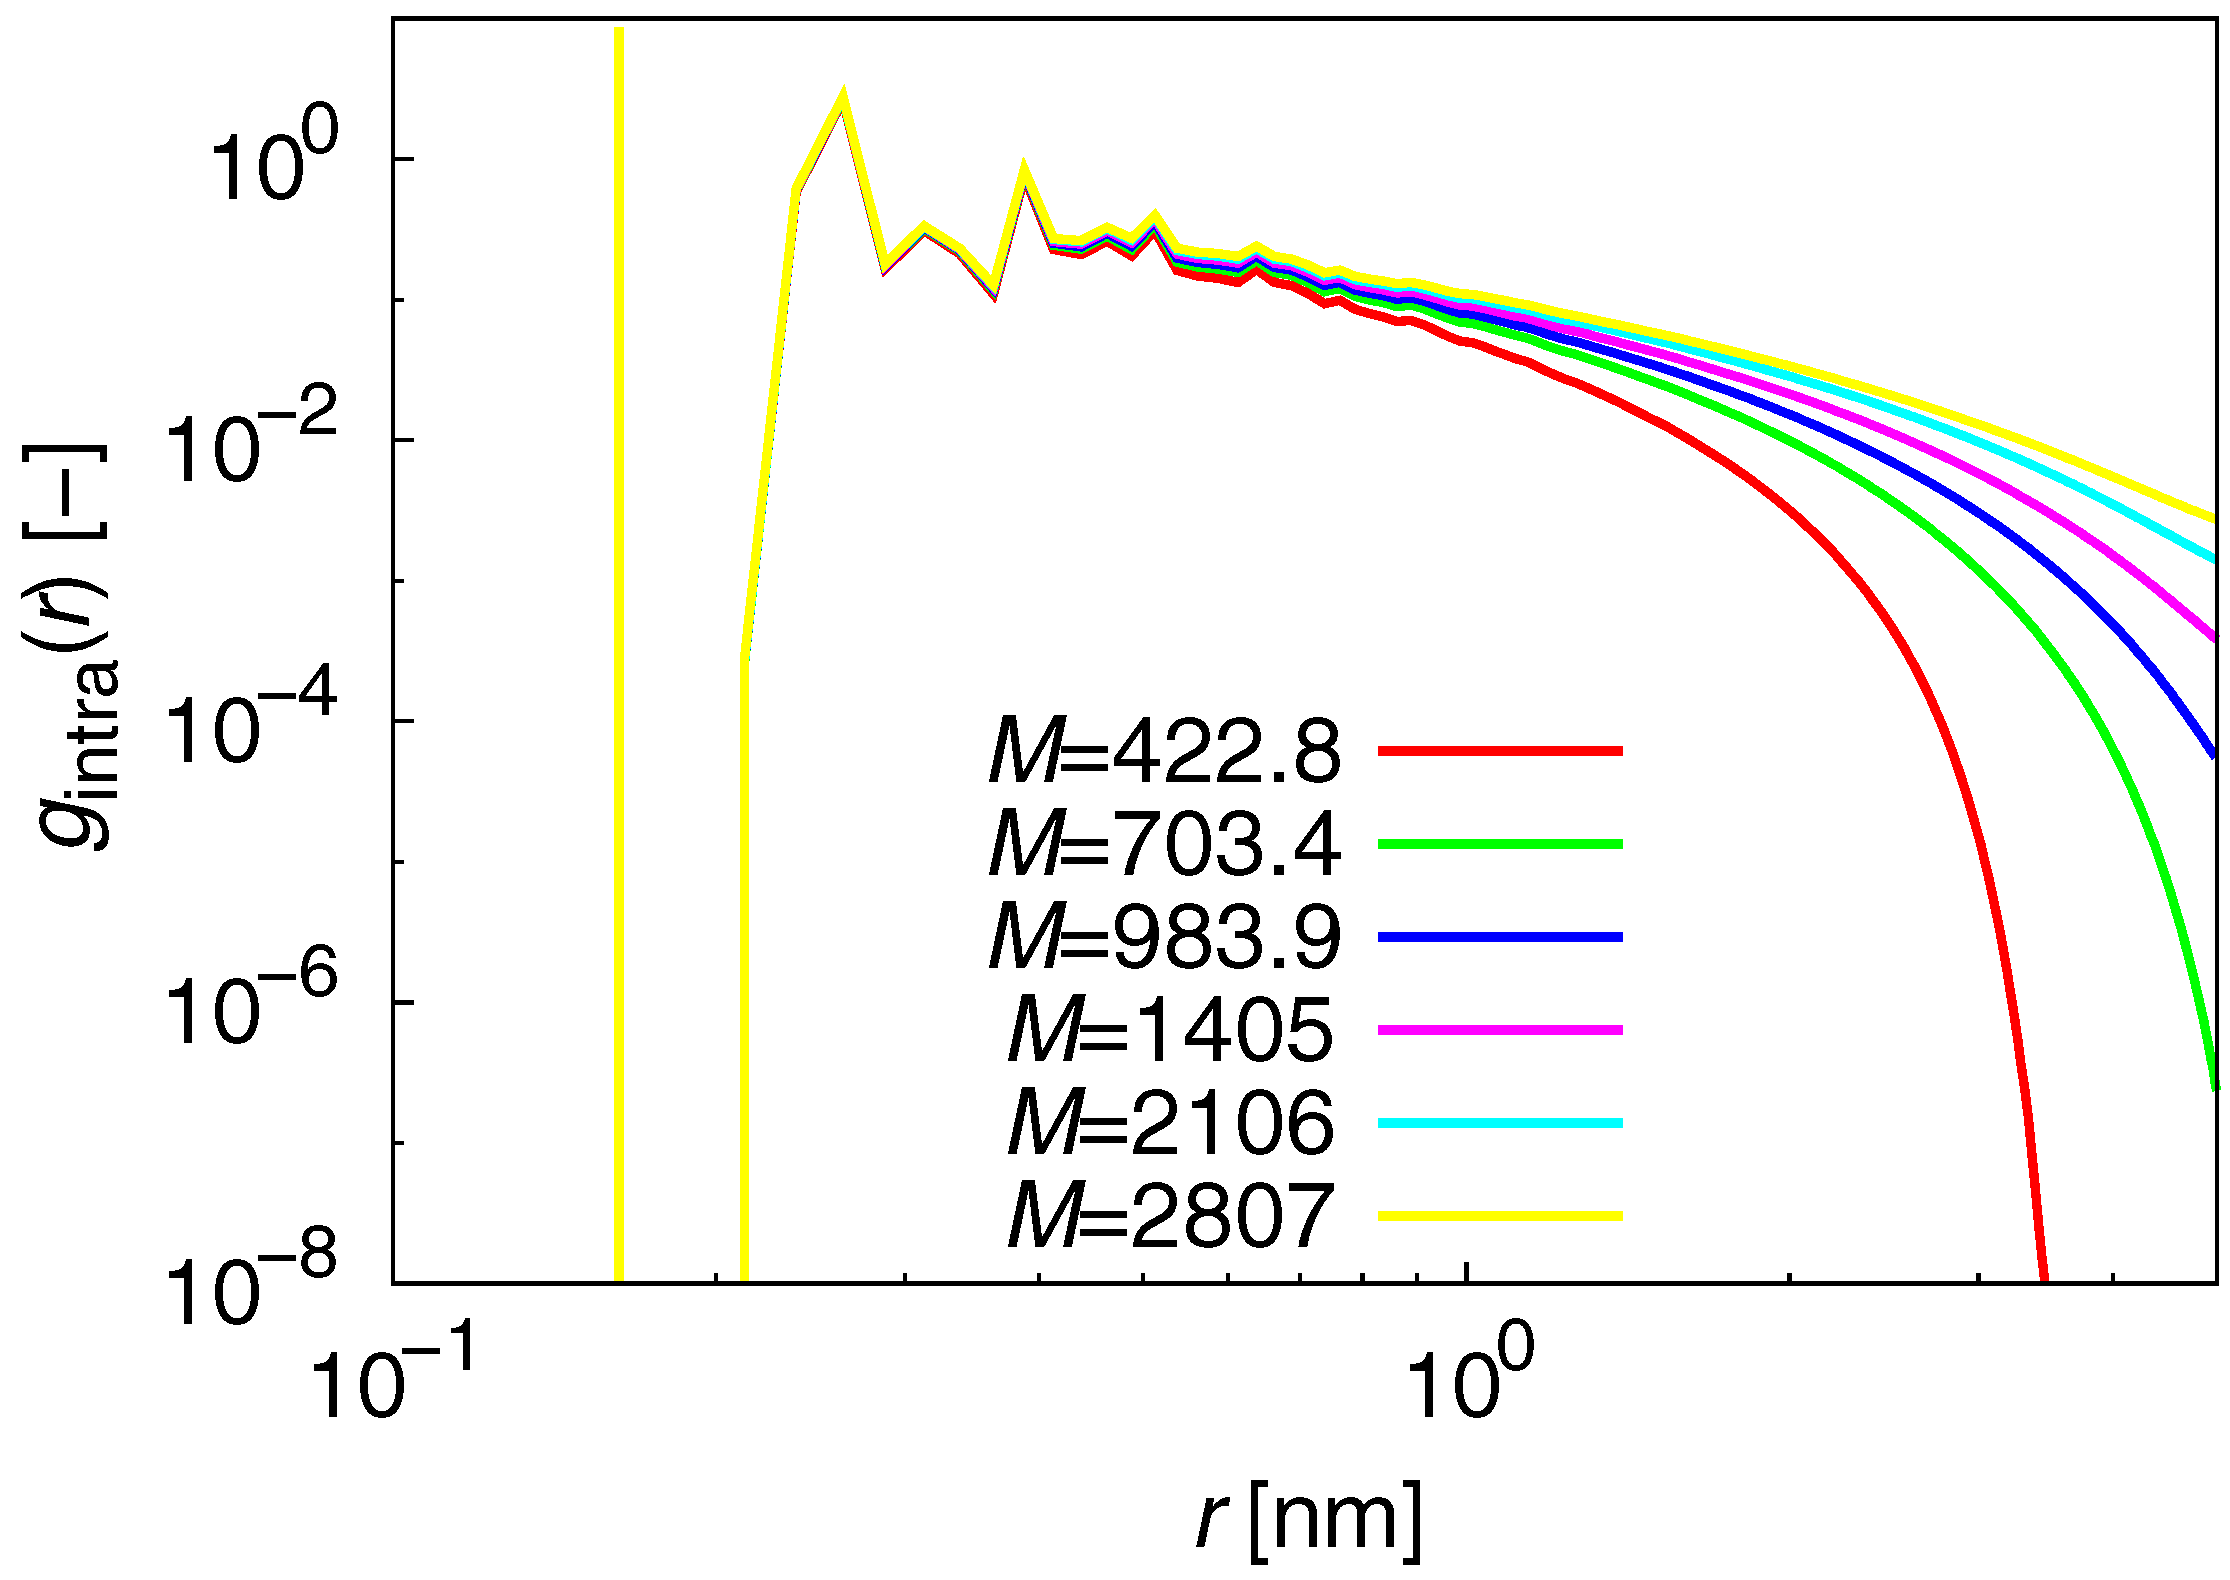
The radial distribution function g ( r ) reveals the local structure of polymer melts, and is given by:
g ( r ) = 1 4 π r 2 Δ r ρ j n j ( r ) N 1 ,
where n j ( r ) is the number of beads in the region between r and r + Δ r in the molecule j. The term n j ( r ) can be defined for the total, intermolecular, and intramolecular contributions. Figure 3 shows the results for the intramolecular contribution of g ( r ) , which describes the probability for beads in the same chain to meet each other. The g ( r ) for total and intermolecular contributions exhibit only small differences with respect to M (data not shown).

3.2. Dynamic Properties

From the Rouse [59] and reptation models [1], the scaling law relations between N and the end-to-end relaxation time τ R , and the diffusion coefficient D, are approximately given by:
τ R N 2 ( N < N e ) N 3 ( N > N e ) ,
D N 1 ( N < N e ) N 2 ( N > N e ) .
Evaluating whether the atomistic PE model follows Equations (6) and (7) is important for molecular modeling of polymer melts.
The term τ R can be estimated from the time-correlation function of the end-to-end vector C ( t ) :
C ( t ) = R ( t ) · R ( 0 ) R 2 .
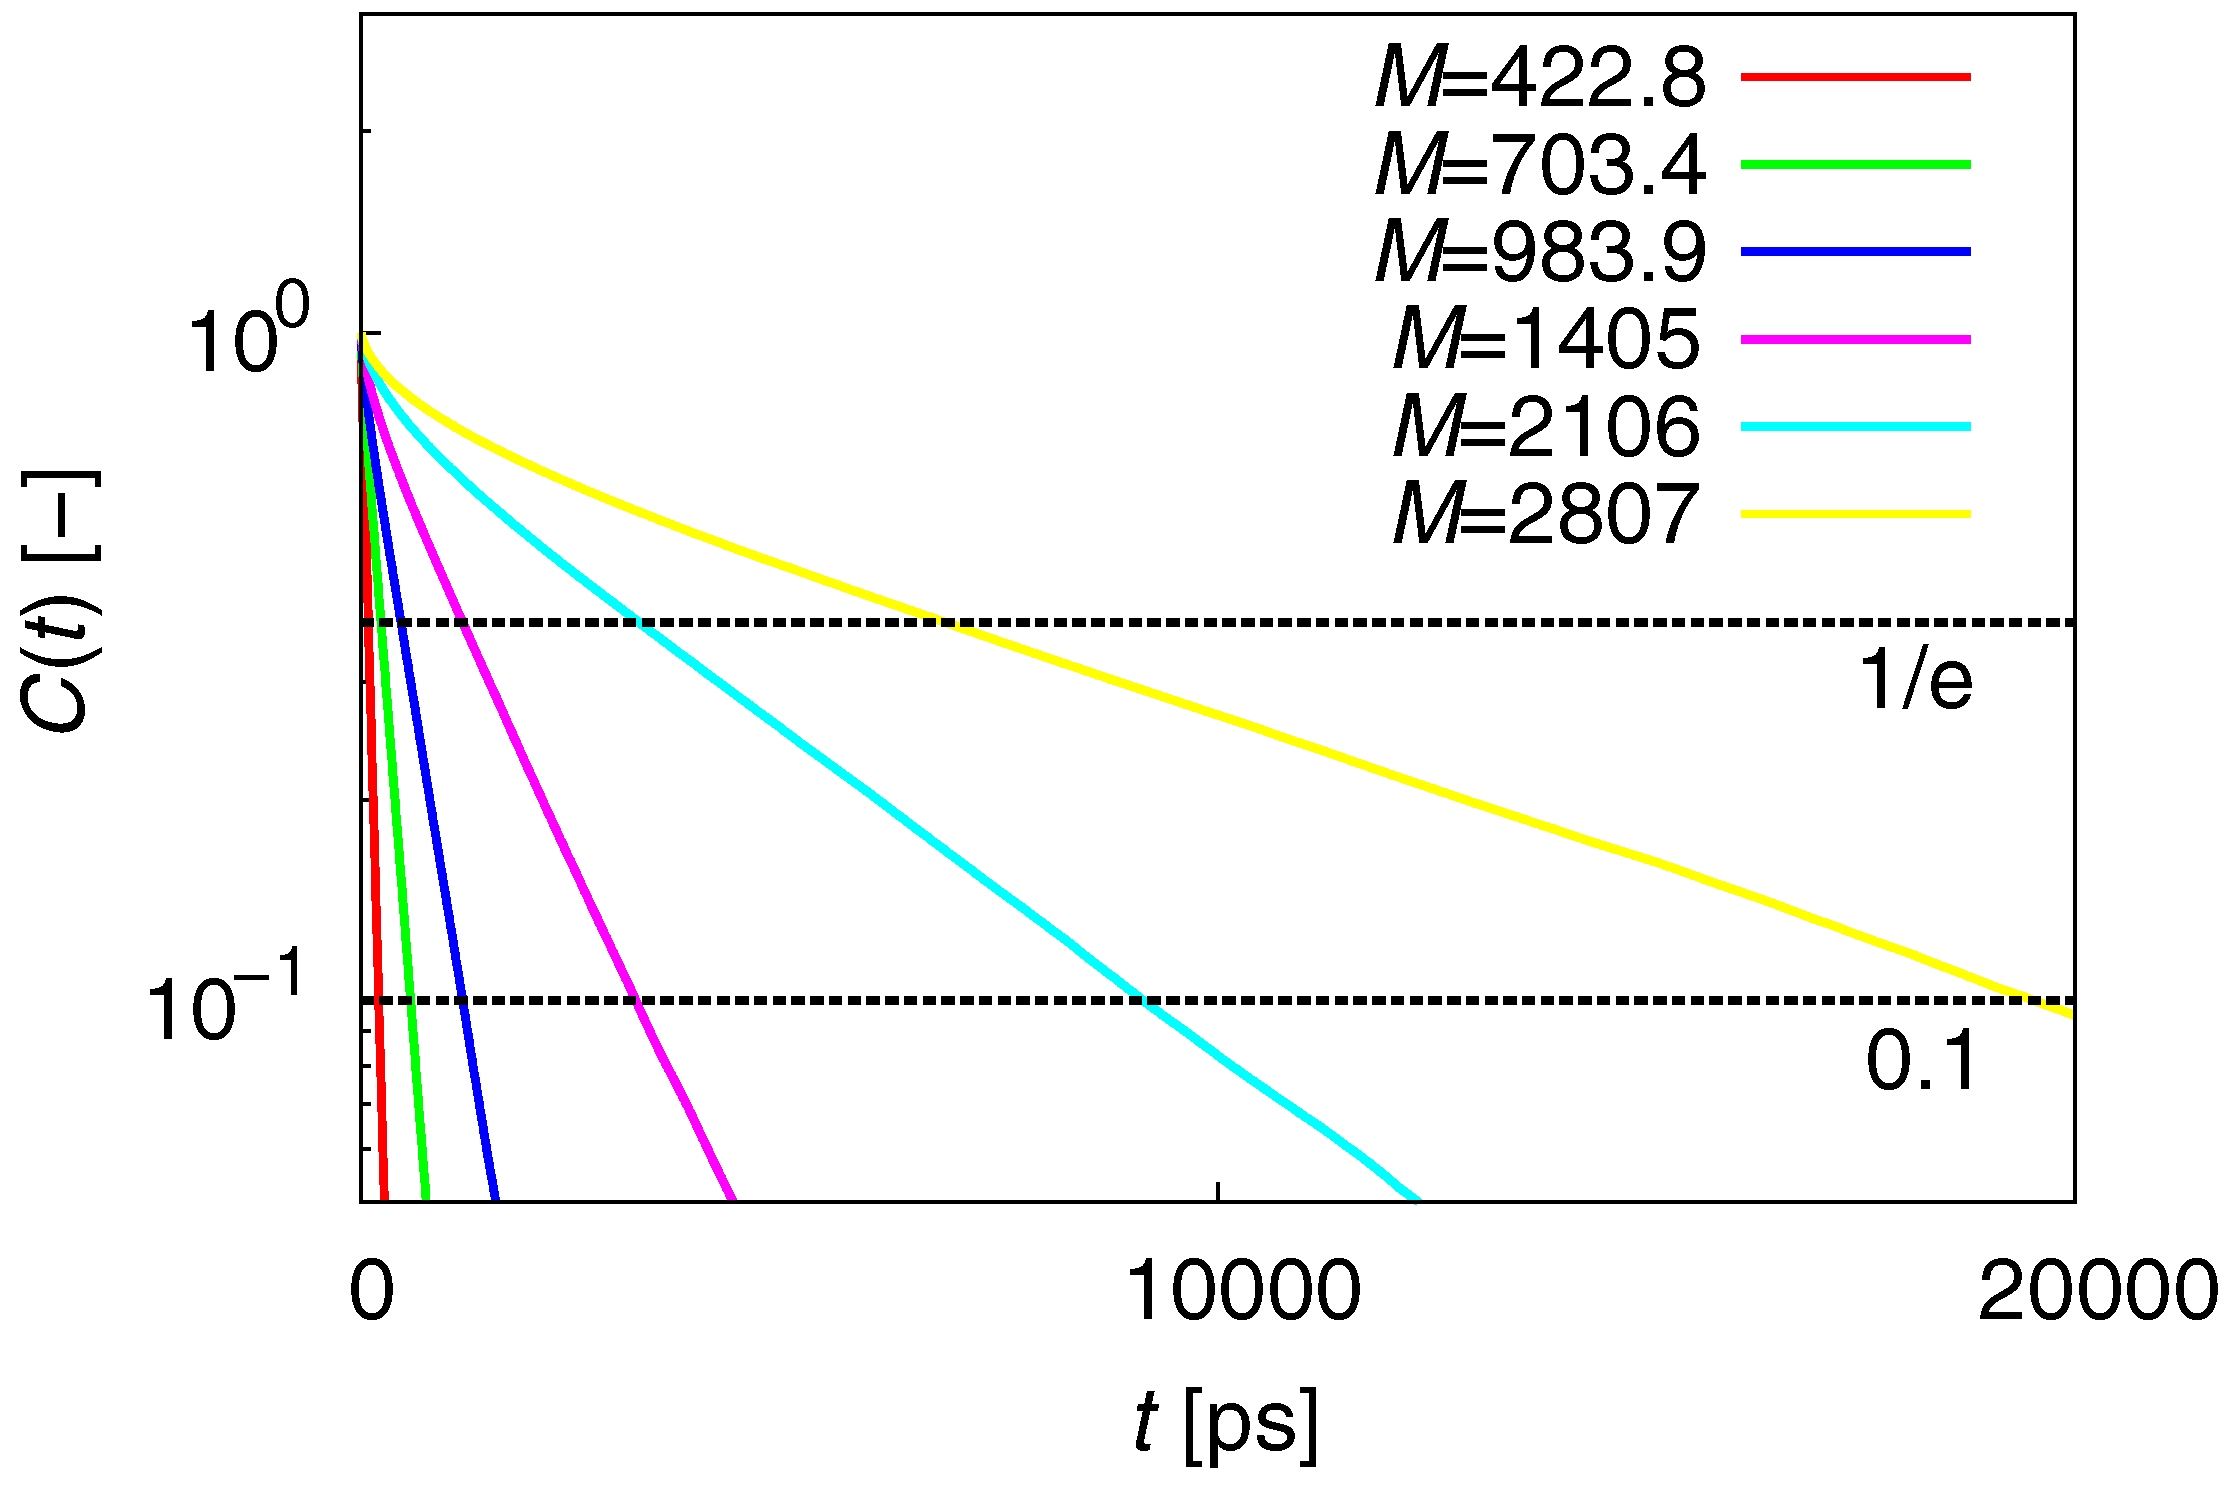
C ( t ) exp ( t / τ R ) is expected, independent of the chain length. Figure 4 is a semi-logarithmic plot of C ( t ) . For the range 0 . 1 < C ( t ) < 1 / e , C ( t ) has linear slopes, irrespective of chain length. This indicates that C ( t ) clearly satisfies the above expected relation and that τ R can be accurately estimated at 0 . 1 < C ( t ) < 1 / e .
The term τ R was estimated from C ( t ) . Figure 5 shows the results for τ R M scaling. For M < M e , τ R scales with M 2 . 1 , which is 5% different from the scaling exponent predicted from the Rouse theory. This indicates that the motion of the PE chain at M < M e is close to ideal chain motion. For M < M e , τ R scales with M 2 . 7 , which is 10% different from the scaling exponent predicted from the reptation theory. This indicates that the motion of the PE chain at M > M e is also close to ideal chain motion. However, it should be noted that a τ R M 3 . 4 scaling relation is expected from experimental data [2].
The term D can be estimated from the mean-square displacement (MSD) of the chain center g 1 ( t ) :
g 1 ( t ) = [ r c . c . ( t ) r c . c . ( 0 ) ] 2 ,
where r c . c . is the coordinate of the chain center. From the Rouse and reptation models, the scaling-law sequence for the MSD is roughly expected to be:
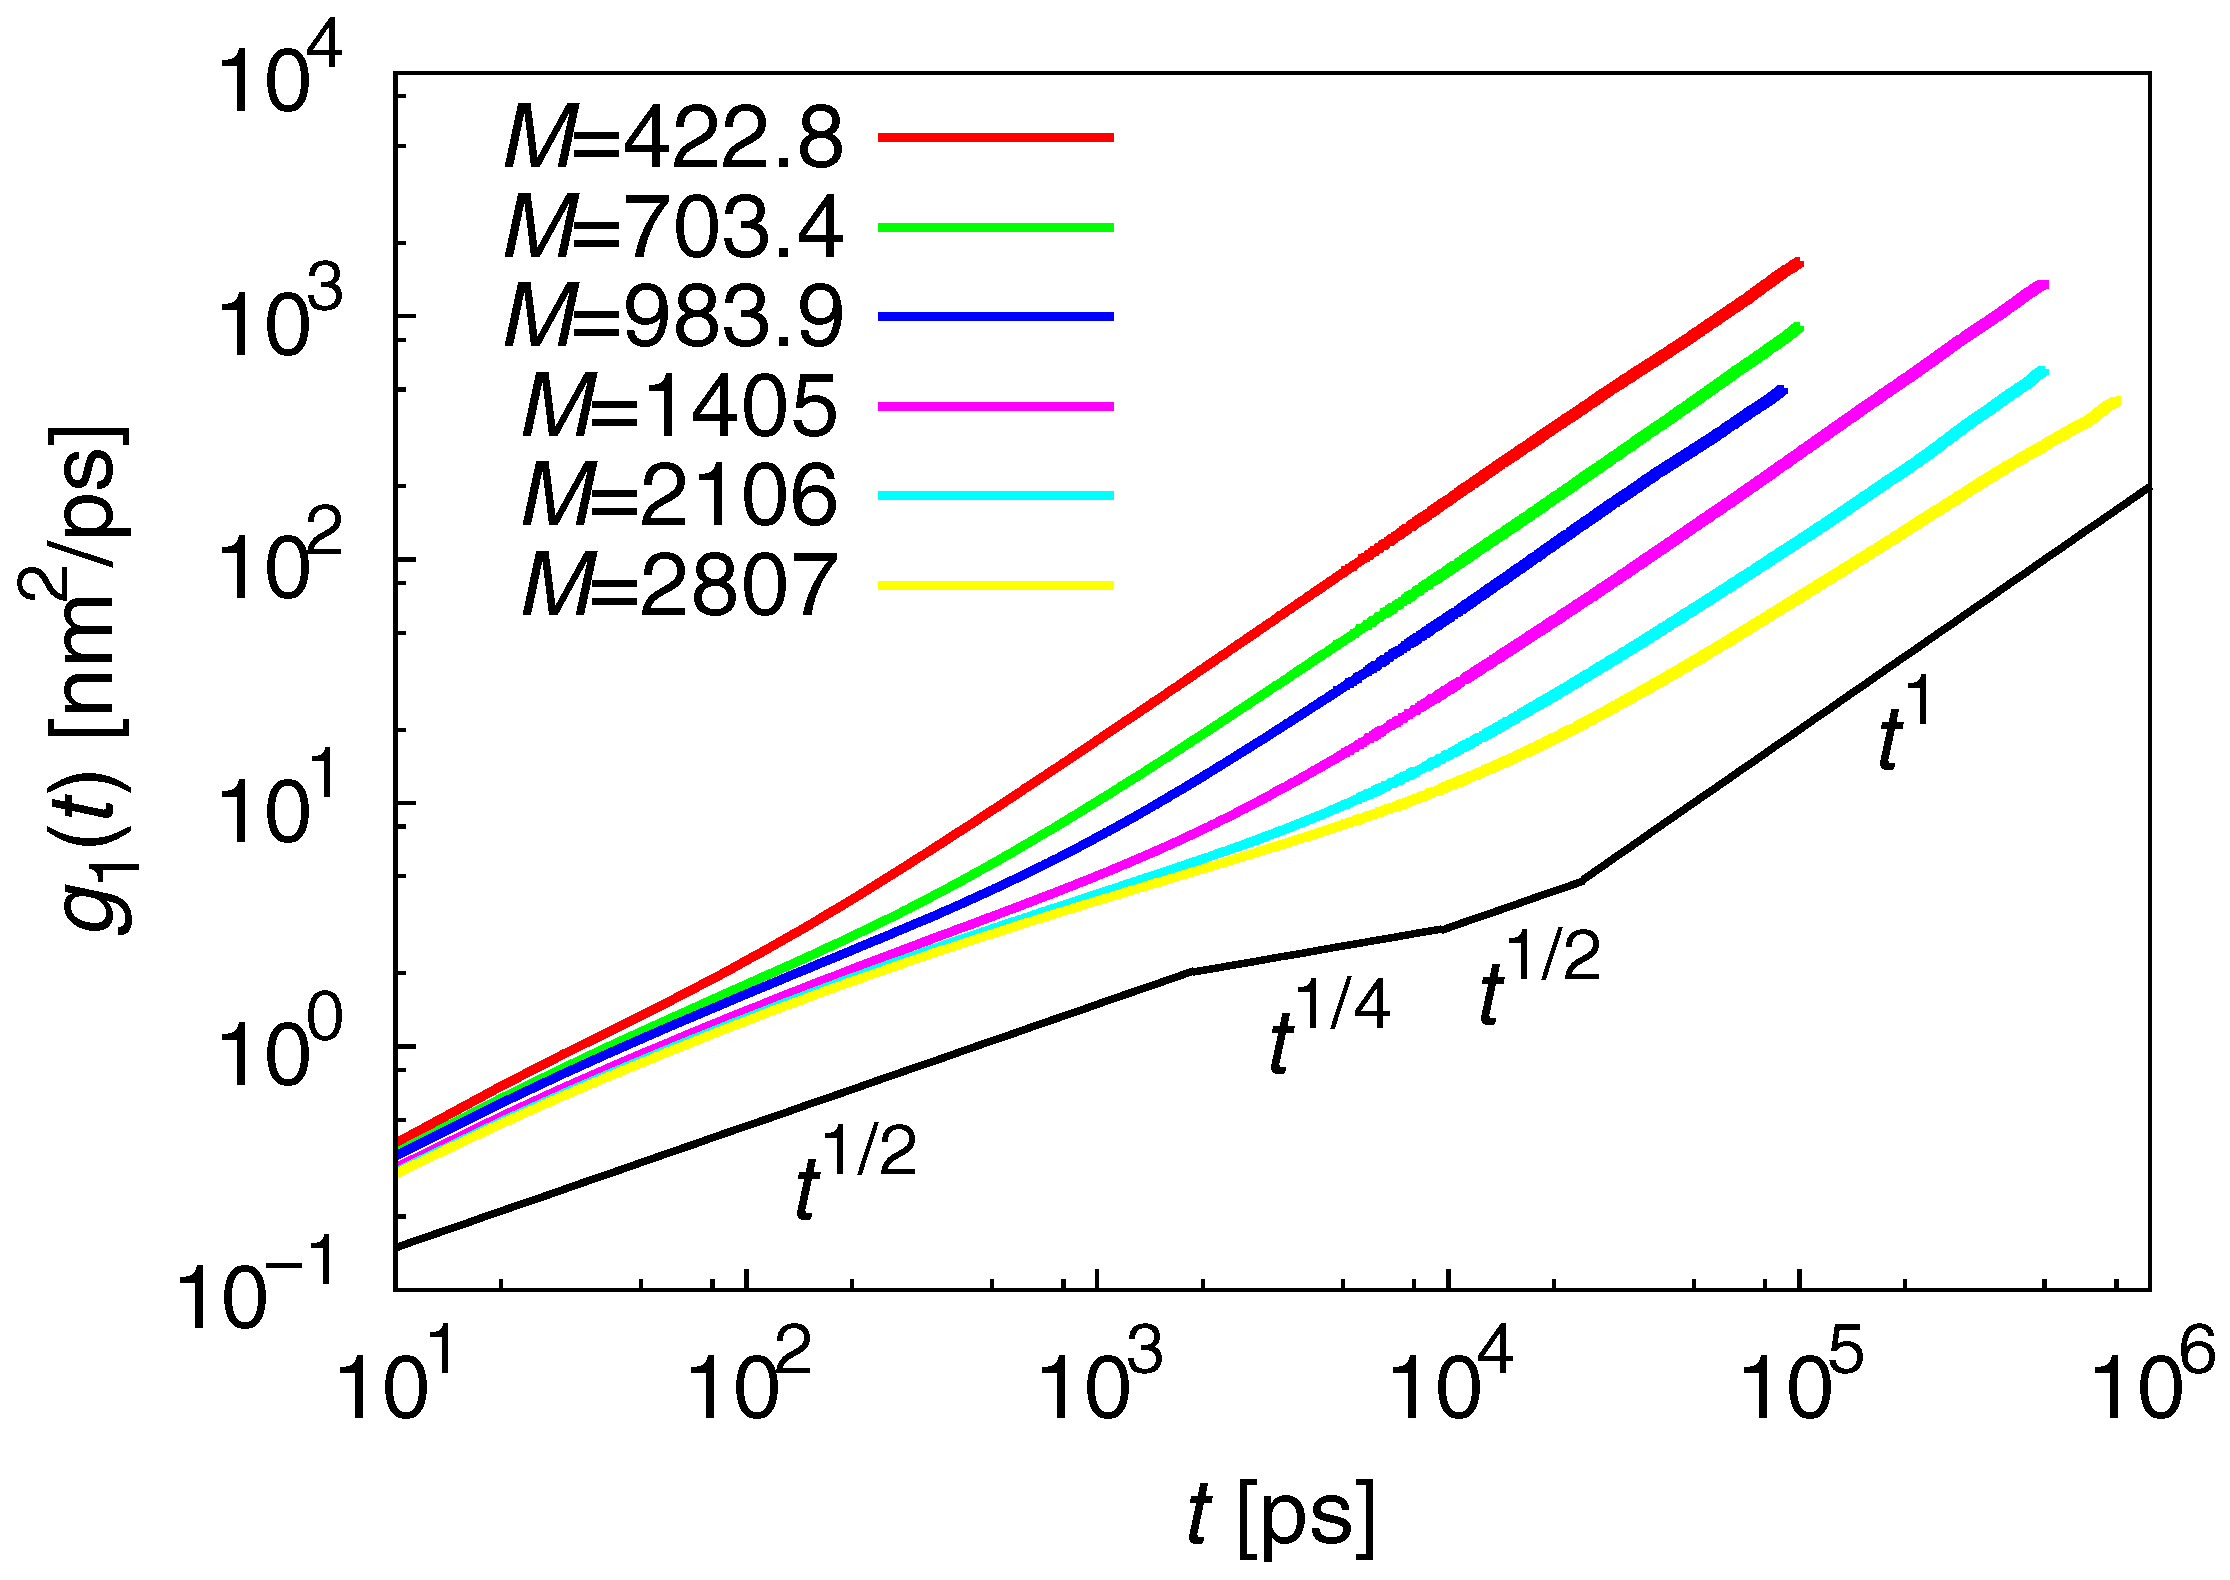
g 1 ( t ) t 1 ( t < τ 0 ) t 1 / 2 ( τ 0 < t < τ e N e 2 ) t 1 / 4 ( τ e < t < τ N N 2 ) t 1 / 2 ( τ N < t < τ R N 3 / N e ) t 1 ( t > τ R ) ,
where τ 0 is a specific short time, and τ e and τ N are the Rouse relaxation times that correspond to N e and N, respectively. Figure 6 plots g 1 ( t ) . The expected shape of g 1 ( t ) from Equation (10) for M = 2807 g / mol is also plotted. The results of g 1 ( t ) at M = 2807 g / mol have approximately the same scaling-law, as expected. However, the threshold values for Equation (10) are unclear from the MSD results.
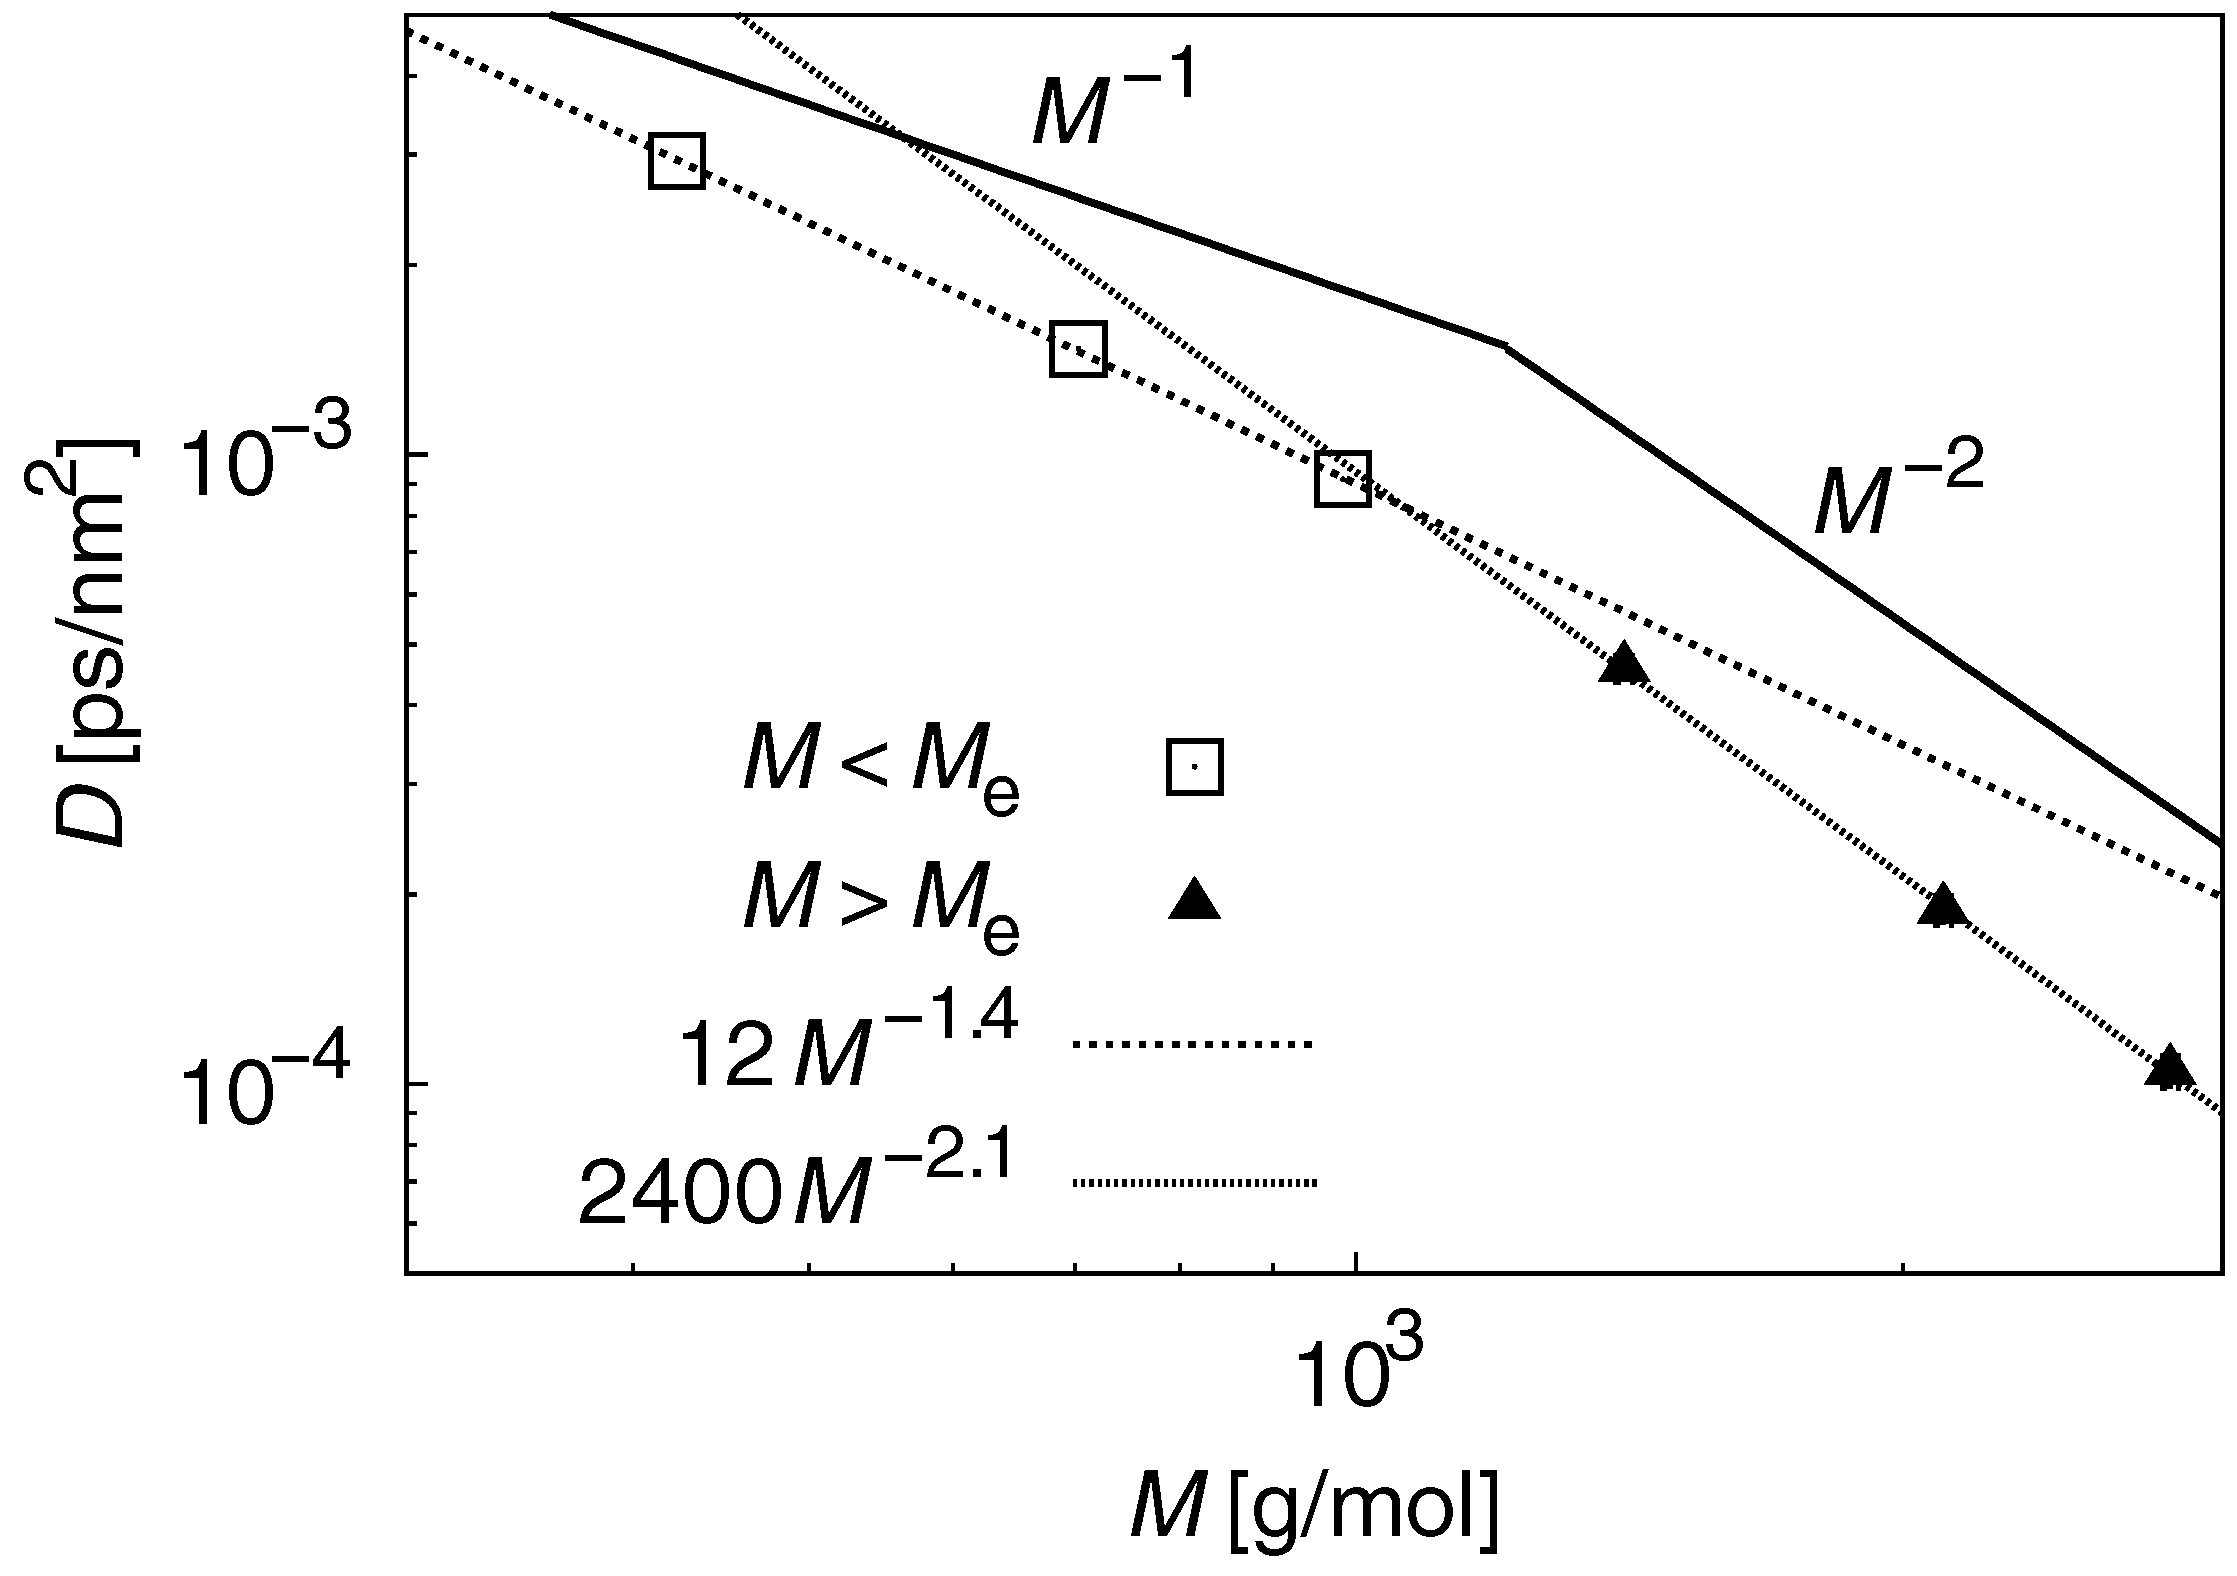
The term D was estimated from g 1 ( t ) . Figure 7 plots the results for DM scaling. For M < M e , D scales with M 1 . 4 , while the expected value is ∼ M 1 . This large discrepancy indicates that the motion of short chains does not reflect Gaussian dynamics and contradicts the results of τ R at M < M e shown above. For the atomistic PE model, the relation between τ R and D established from the Rouse theory is not satisfied. For M < M e , τ R scales with M 2 . 1 , and is 5% different from the scaling exponent predicted from the reptation theory. This indicates that PE chain motion at M > M e is close to ideal chain motion.
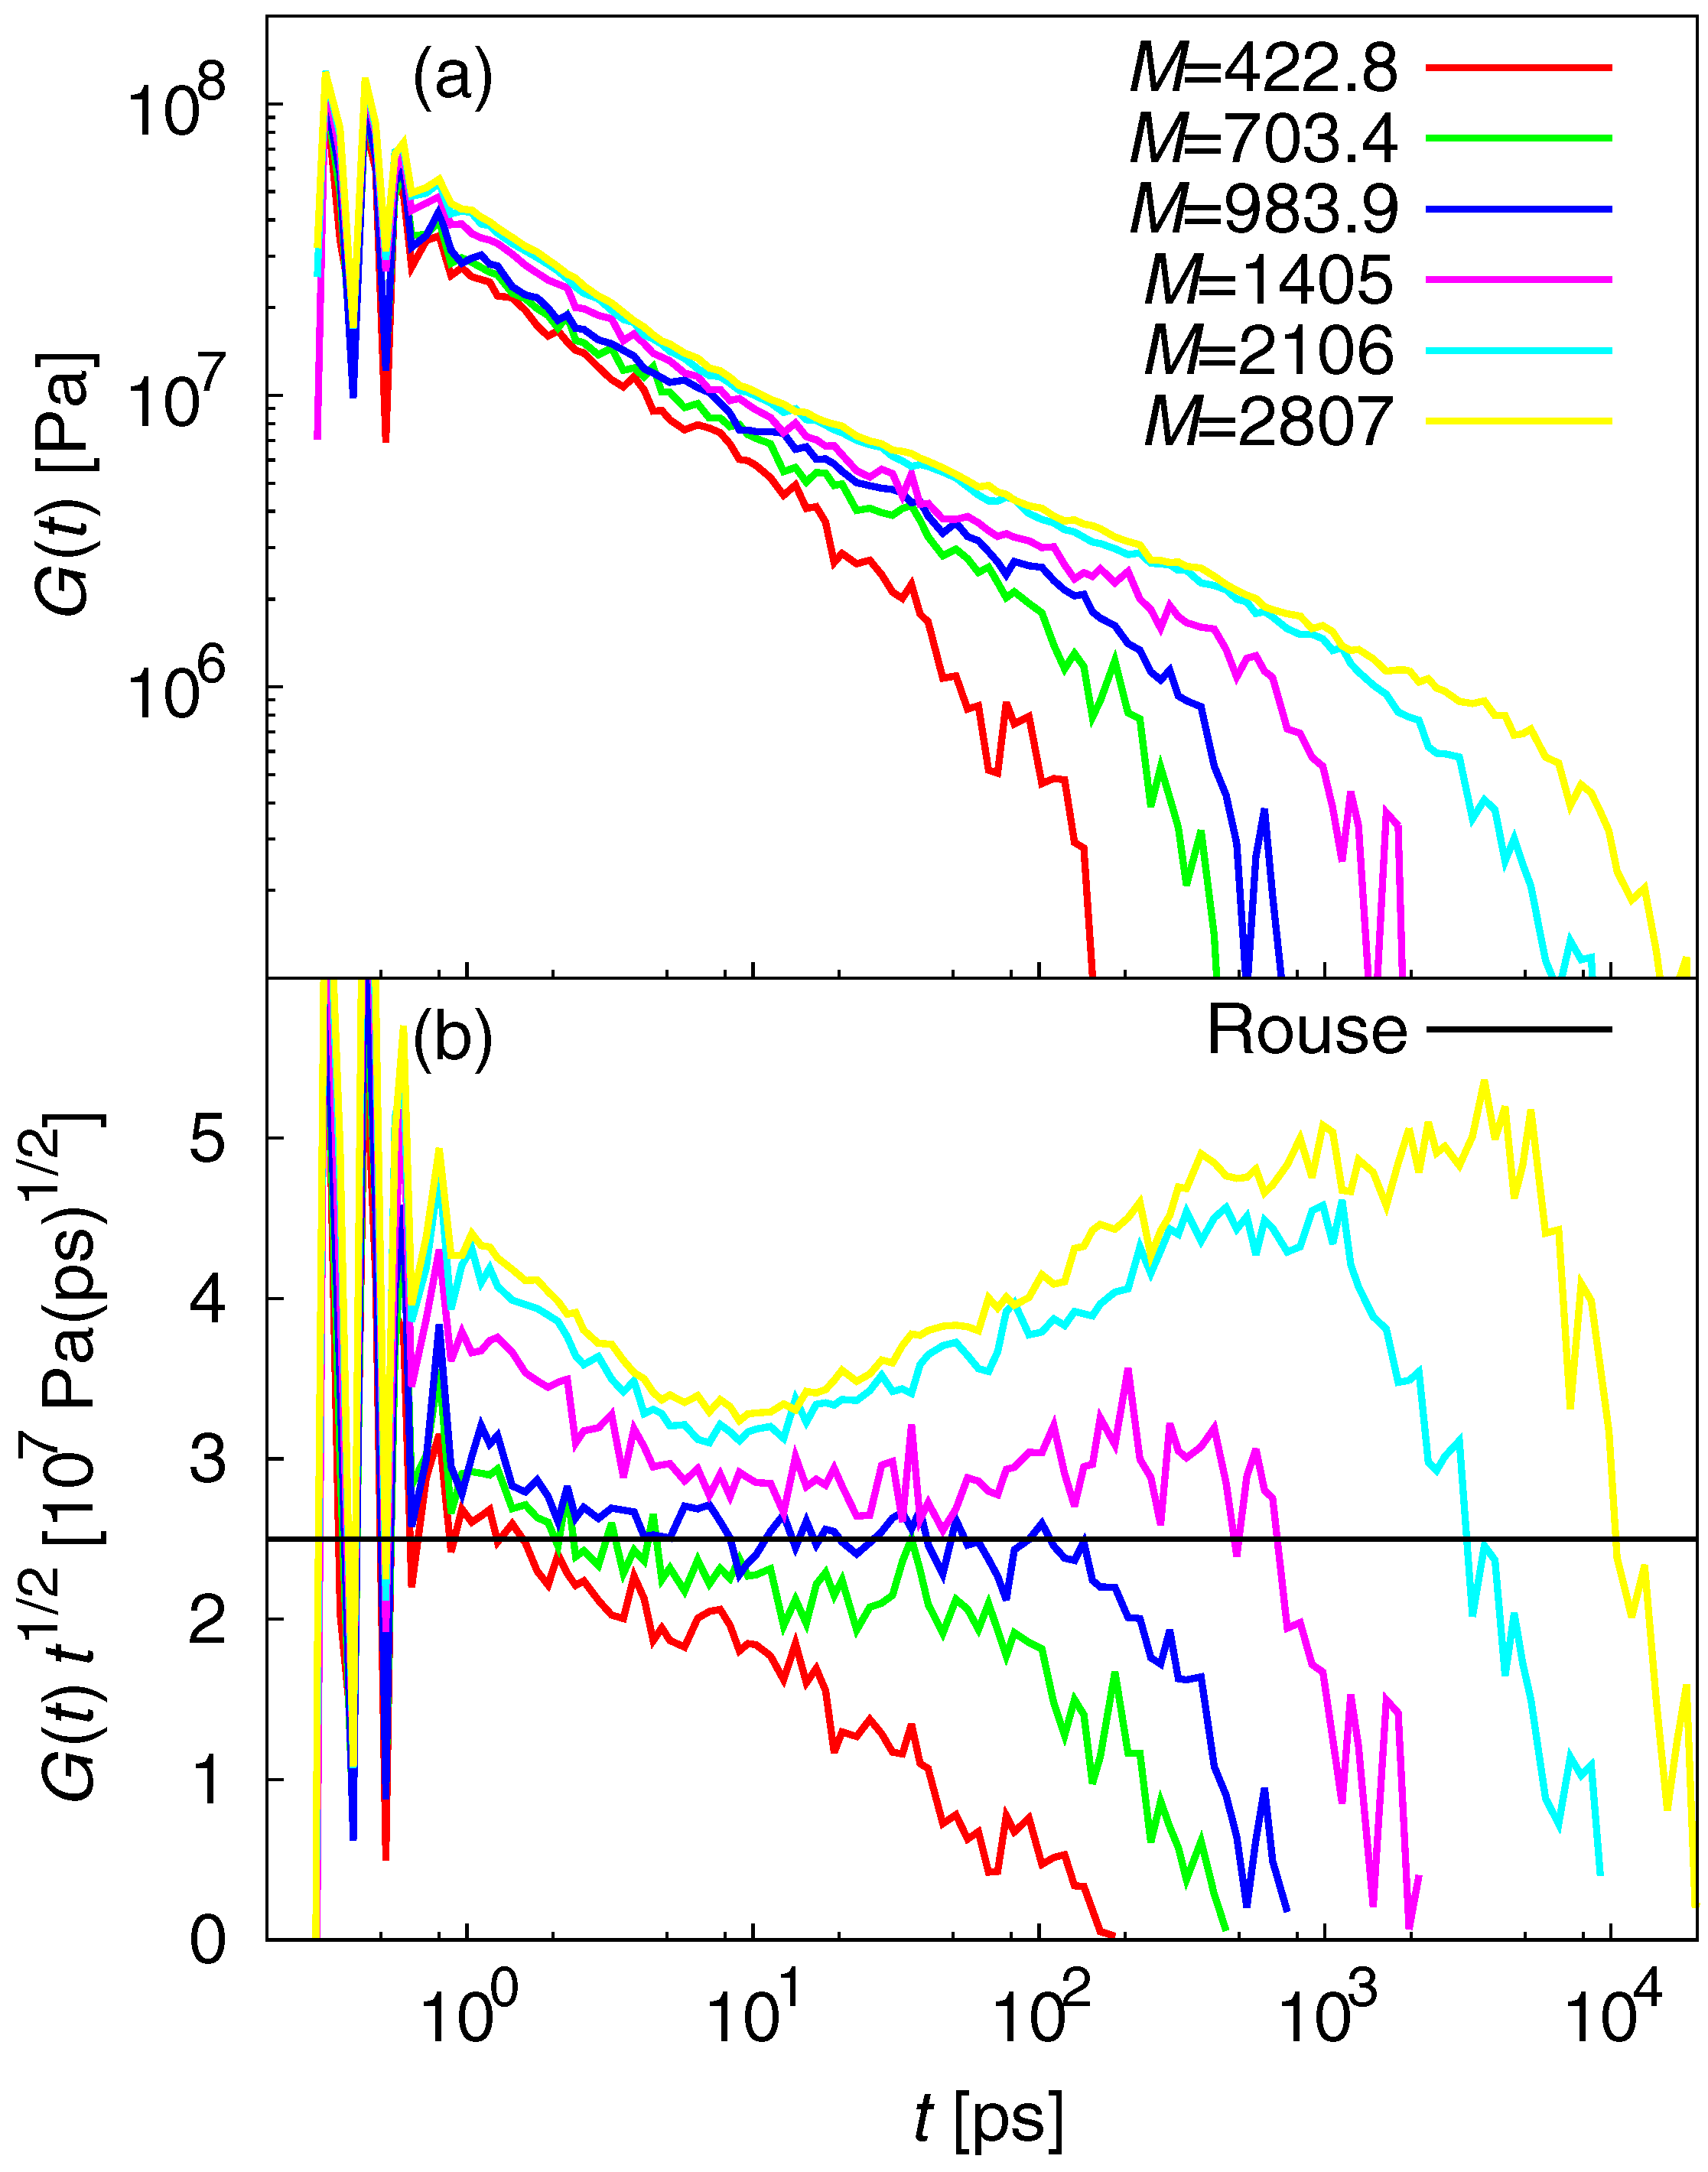
The relaxation moduli G ( t ) reveal the viscoelastic behavior of polymer melts and are given by:
G ( t ) = V k B T σ α β ( t ) σ α β ( t ) ,
where σ α β are the off-diagonal stress components x y , x z , and y z . Figure 8a shows G ( t ) (log-log plot). Figure 8b plots G ( t ) t 1 / 2 (semi-log plot) to illustrate deviations from the G ( t ) of Rouse theory that scale as ∼ t 1 / 2 . The semi-log plot has two advantages: (i) The y-axis can be compressed so that all deviations can be shown in less than one decade; and (ii) all the deviations from the Rouse theory are easily seen as deviations from the horizontal line. For M = 2106 and 2807 g / mol , the peaks indicate entanglement at long times. The deviation from the Rouse theory that indicates onset of entanglement was observed at 10 ps . Therefore, the Rouse behavior can only be seen in the short-time range (5– 10 ps ). For M = 1405 g / mol , the tendency is similar; however, the entanglement is weak (i.e., the peak is small). For M = 703 . 4 and 983 . 9 g / mol , the Rouse behavior is observed at 2– 100 ps . These results indicate that the duration of the Rouse behavior highly depends on the presence or absence of entanglement. Long-time MD simulation is a powerful way to obtain detailed results for an atomistic PE model. In contrast, the bead–spring model cannot reveal short duration Rouse behavior of entangled PE chains [60]. This illustrates the limitations of simplified models and the effectiveness of atomistic MD simulations.

4. Conclusions

We performed long-time MD simulations using an atomistic model of PE. To examine the actual physical nature of the model, representative polymer properties were estimated. Scaling laws were compared to theoretical predictions. For the internal structure, results for R 2 and R G 2 indicate that the atomistic PE model for short chains does not satisfy Gaussian statics. The results for S ( q ) show a clear deviation from theoretical predictions that assume ideal chain statics, irrespective of chain length. With regard to chain motion, τ R satisfies the prediction from the Rouse theory, while D clearly deviates from it. Thus, the relationship between τ R and D in the Rouse theory is not satisfied. Regarding linear viscoelasticity, the presence or absence of entanglement strongly affects the duration of Rouse behavior. Entangled PE chains have a very short duration. These actual physical attributes should be carefully considered when using the atomistic model for applications that expect typical polymer behavior.
In general, the theoretical predictions do not reflect strictly the microscopic factors for estimating properties. For instance, the Rouse model and Flory’s theory of polymer melts rely on the single-chain motion and Gaussian statistics; however, the actual physical nature of polymers strongly affects from the many-body effect which usually cannot be expressed using the simple Gaussian statistics. This microscopic effect becomes small as the time and length scales increase but is never ignorable. MD simulations can deal with the many-body effect explicitly. This can be thought of as the main reason of the discrepancy between MD simulations and theoretical predictions.
Overall, different atomistic models may lead to different results [26,36]. The AA PE model has the potential to improve the results. The slow dynamics of AA models is a bottleneck; however, the massively parallel computing may resolve this problem.

Acknowledgments

Kazuaki Z. Takahashi was partially supported by the Japan Society for the Promotion of Science (JSPS) Grants-in-Aid for Scientific Research (KAKENHI) Grant Number 16H06071.

Author Contributions

Kazuaki Z. Takahashi, Kenji Yasuoka, and Yuichi Masubuchi designed the study; Kazuaki Z. Takahashi and Ryuto Nishimura performed the study; and Kazuaki Z. Takahashi wrote the paper.

Conflicts of Interest

The authors declare no conflict of interest.

References

  1. Doi, M.; Edwards, S.F. The Theory of Polymer Dynamics; Oxford University Press: Oxford, UK, 1988; Volume 73. [Google Scholar]
  2. Ferry, J.D. Viscoelastic Properties of Polymers; John Wiley & Sons: Hoboken, NJ, USA, 1980. [Google Scholar]
  3. Masubuchi, Y. Simulating the flow of entangled polymers. Annu. Rev. Chem. Biomol. Eng. 2014, 5, 11–33. [Google Scholar] [CrossRef] [PubMed]
  4. Baaden, M.; Marrink, S.J. Coarse-grain modelling of protein–protein interactions. Curr. Opin. Struct. Biol. 2013, 23, 878–886. [Google Scholar] [CrossRef] [PubMed]
  5. Brini, E.; Algaer, E.A.; Ganguly, P.; Li, C.; Rodríguez-Ropero, F.; van der Vegt, N.F. Systematic coarse-graining methods for soft matter simulations—A review. Soft Matter 2013, 9, 2108–2119. [Google Scholar] [CrossRef]
  6. Everaers, R.; Sukumaran, S.K.; Grest, G.S.; Svaneborg, C.; Sivasubramanian, A.; Kremer, K. Rheology and microscopic topology of entangled polymeric liquids. Science 2004, 303, 823–826. [Google Scholar] [CrossRef] [PubMed]
  7. Gay, J.; Berne, B. Modification of the overlap potential to mimic a linear site–site potential. J. Chem. Phys. 1981, 74, 3316–3319. [Google Scholar] [CrossRef]
  8. Groot, R.D.; Warren, P.B. Dissipative particle dynamics: Bridging the gap between atomistic and mesoscopic simulation. J. Chem. Phys. 1997, 107, 4423. [Google Scholar] [CrossRef]
  9. Jury, S.; Bladon, P.; Cates, M.; Krishna, S.; Hagen, M.; Ruddock, N.; Warren, P. Simulation of amphiphilic mesophases using dissipative particle dynamics. Phys. Chem. Chem. Phys. 1999, 1, 2051–2056. [Google Scholar] [CrossRef]
  10. Karimi-Varzaneh, H.A.; van der Vegt, N.F.; Müller-Plathe, F.; Carbone, P. How good are coarse-grained polymer models? A comparison for atactic polystyrene. ChemPhysChem 2012, 13, 3428–3439. [Google Scholar] [CrossRef] [PubMed]
  11. Kremer, K.; Grest, G.S. Dynamics of entangled linear polymer melts: A molecular-dynamics simulation. J. Chem. Phys. 1990, 92, 5057. [Google Scholar] [CrossRef]
  12. Riniker, S.; Allison, J.R.; van Gunsteren, W.F. On developing coarse-grained models for biomolecular simulation: A review. Phys. Chem. Chem. Phys. 2012, 14, 12423–12430. [Google Scholar] [CrossRef] [PubMed]
  13. Barducci, A.; Bonomi, M.; Parrinello, M. Metadynamics. Wiley Interdiscip. Rev. 2011, 1, 826–843. [Google Scholar] [CrossRef]
  14. Baumgärtner, A.; Binder, K.; Hansen, J.P.; Kalos, M.; Kehr, K.; Landau, D.; Levesque, D.; Müller-Krumbhaar, H.; Rebbi, C.; Saito, Y.; et al. Applications of the Monte Carlo Method in Statistical Physics; Springer Science & Business Media: Berlin, Germany, 2013; Volume 36. [Google Scholar]
  15. Binder, K. Monte Carlo and Molecular Dynamics Simulations in Polymer Science; Oxford University Press: Oxford, UK, 1995. [Google Scholar]
  16. Rapaport, D.C. The Art of Molecular Dynamics Simulation; Cambridge University Press: Cambridge, UK, 2004. [Google Scholar]
  17. Baig, C.; Mavrantzas, V.G.; Kröger, M. Flow effects on melt structure and entanglement network of linear polymers: Results from a nonequilibrium molecular dynamics simulation study of a polyethylene melt in steady shear. Macromolecules 2010, 43, 6886–6902. [Google Scholar]
  18. Barrat, J.L.; Baschnagel, J.; Lyulin, A. Molecular dynamics simulations of glassy polymers. Soft Matter 2010, 6, 3430–3446. [Google Scholar] [CrossRef]
  19. Chung, H.S.; Piana-Agostinetti, S.; Shaw, D.E.; Eaton, W.A. Structural origin of slow diffusion in protein folding. Science 2015, 349, 1504–1510. [Google Scholar] [CrossRef] [PubMed]
  20. Do, C.; Lunkenheimer, P.; Diddens, D.; Götz, M.; Weiß, M.; Loidl, A.; Sun, X.G.; Allgaier, J.; Ohl, M. Li+ transport in poly (ethylene oxide) based electrolytes: Neutron scattering, dielectric spectroscopy, and molecular dynamics simulations. Phys. Rev. Lett. 2013, 111, 018301. [Google Scholar] [CrossRef] [PubMed]
  21. Hossain, D.; Tschopp, M.; Ward, D.; Bouvard, J.; Wang, P.; Horstemeyer, M. Molecular dynamics simulations of deformation mechanisms of amorphous polyethylene. Polymer 2010, 51, 6071–6083. [Google Scholar] [CrossRef]
  22. Hur, K.; Jeong, C.; Winkler, R.G.; Lacevic, N.; Gee, R.H.; Yoon, D.Y. Chain dynamics of ring and linear polyethylene melts from molecular dynamics simulations. Macromolecules 2011, 44, 2311–2315. [Google Scholar] [CrossRef]
  23. Mitchell, J.S.; Harris, S.A. Thermodynamics of writhe in DNA minicircles from molecular dynamics simulations. Phys. Rev. Lett. 2013, 110, 148105. [Google Scholar] [CrossRef]
  24. Ndoro, T.V.; Voyiatzis, E.; Ghanbari, A.; Theodorou, D.N.; Böhm, M.C.; Müller-Plathe, F. Interface of grafted and ungrafted silica nanoparticles with a polystyrene matrix: Atomistic molecular dynamics simulations. Macromolecules 2011, 44, 2316–2327. [Google Scholar] [CrossRef]
  25. Stephanou, P.S.; Baig, C.; Tsolou, G.; Mavrantzas, V.G.; Kröger, M. Quantifying chain reptation in entangled polymer melts: Topological and dynamical mapping of atomistic simulation results onto the tube model. J. Chem. Phys. 2010, 132, 124904. [Google Scholar] [CrossRef] [PubMed]
  26. Harmandaris, V.A.; Kremer, K. Dynamics of polystyrene melts through hierarchical multiscale simulations. Macromolecules 2009, 42, 791–802. [Google Scholar] [CrossRef]
  27. Pant, P.K.; Han, J.; Smith, G.D.; Boyd, R.H. A molecular dynamics simulation of polyethylene. J. Chem. Phys. 1993, 99, 597–604. [Google Scholar] [CrossRef]
  28. Jorgensen, W.L.; Madura, J.D.; Swenson, C.J. Optimized intermolecular potential functions for liquid hydrocarbons. J. Am. Chem. Soc. 1984, 106, 6638–6646. [Google Scholar] [CrossRef]
  29. Martin, M.G.; Siepmann, J.I. Transferable potentials for phase equilibria. 1. United-atom description of n-alkanes. J. Phys. Chem. B 1998, 102, 2569–2577. [Google Scholar] [CrossRef]
  30. Boyd, R.H.; Gee, R.H.; Han, J.; Jin, Y. Conformational dynamics in bulk polyethylene: A molecular dynamics simulation study. J. Chem. Phys. 1994, 101, 788–797. [Google Scholar] [CrossRef]
  31. Harmandaris, V.A.; Mavrantzas, V.G.; Theodorou, D.N. Atomistic molecular dynamics simulation of polydisperse linear polyethylene melts. Macromolecules 1998, 31, 7934–7943. [Google Scholar] [CrossRef]
  32. Jin, Y.; Boyd, R.H. Subglass chain dynamics and relaxation in polyethylene: A molecular dynamics simulation study. J. Chem. Phys. 1998, 108, 9912–9923. [Google Scholar] [CrossRef]
  33. Kavassalis, T.; Sundararajan, P. A molecular-dynamics study of polyethylene crystallization. Macromolecules 1993, 26, 4144–4150. [Google Scholar] [CrossRef]
  34. Moore, J.; Cui, S.; Cochran, H.; Cummings, P. A molecular dynamics study of a short-chain polyethylene melt.: I. steady-state shear. J. Non-Newton. Fluid Mech. 2000, 93, 83–99. [Google Scholar] [CrossRef]
  35. Paul, W.; Smith, G.; Yoon, D.Y.; Farago, B.; Rathgeber, S.; Zirkel, A.; Willner, L.; Richter, D. Chain motion in an unentangled polyethylene melt: A critical test of the rouse model by molecular dynamics simulations and neutron spin echo spectroscopy. Phys. Rev. Lett. 1998, 80, 2346. [Google Scholar] [CrossRef]
  36. Ramos, J.; Vega, J.F.; Theodorou, D.N.; Martinez-Salazar, J. Entanglement relaxation time in polyethylene: Simulation versus experimental data. Macromolecules 2008, 41, 2959–2962. [Google Scholar] [CrossRef]
  37. Rissanou, A.N.; Power, A.J.; Harmandaris, V. Structural and dynamical properties of polyethylene/graphene nanocomposites through molecular dynamics simulations. Polymers 2015, 7, 390–417. [Google Scholar] [CrossRef]
  38. Zhang, Y.; Zhuang, X.; Muthu, J.; Mabrouki, T.; Fontaine, M.; Gong, Y.; Rabczuk, T. Load transfer of graphene/carbon nanotube/polyethylene hybrid nanocomposite by molecular dynamics simulation. Compos. Part B Eng. 2014, 63, 27–33. [Google Scholar] [CrossRef]
  39. Harmandaris, V.A.; Daoulas, K.C.; Mavrantzas, V.G. Molecular dynamics simulation of a polymer melt/solid interface: Local dynamics and chain mobility in a thin film of polyethylene melt adsorbed on graphite. Macromolecules 2005, 38, 5796–5809. [Google Scholar] [CrossRef]
  40. Hu, M.; Keblinski, P.; Schelling, P.K. Kapitza conductance of silicon–amorphous polyethylene interfaces by molecular dynamics simulations. Phys. Rev. B 2009, 79, 104305. [Google Scholar] [CrossRef]
  41. Taylor, D.; Strawhecker, K.; Shanholtz, E.; Sorescu, D.; Sausa, R. Investigations of the intermolecular forces between RDX and polyethylene by force—Distance spectroscopy and molecular dynamics simulations. J. Phys. Chem. A 2014, 118, 5083–5097. [Google Scholar] [CrossRef] [PubMed]
  42. Hur, K.; Winkler, R.G.; Yoon, D.Y. Comparison of ring and linear polyethylene from molecular dynamics simulations. Macromolecules 2006, 39, 3975–3977. [Google Scholar] [CrossRef]
  43. Yi, P.; Locker, C.R.; Rutledge, G.C. Molecular dynamics simulation of homogeneous crystal nucleation in polyethylene. Macromolecules 2013, 46, 4723–4733. [Google Scholar] [CrossRef]
  44. Henry, A.; Chen, G. High thermal conductivity of single polyethylene chains using molecular dynamics simulations. Phys. Rev. Lett. 2008, 101, 235502. [Google Scholar] [CrossRef] [PubMed]
  45. Henry, A.; Chen, G. Anomalous heat conduction in polyethylene chains: Theory and molecular dynamics simulations. Phys. Rev. B 2009, 79, 144305. [Google Scholar] [CrossRef]
  46. Kim, J.M.; Locker, R.; Rutledge, G.C. Plastic deformation of semicrystalline polyethylene under extension, compression, and shear using molecular dynamics simulation. Macromolecules 2014, 47, 2515–2528. [Google Scholar] [CrossRef]
  47. Lavine, M.S.; Waheed, N.; Rutledge, G.C. Molecular dynamics simulation of orientation and crystallization of polyethylene during uniaxial extension. Polymer 2003, 44, 1771–1779. [Google Scholar] [CrossRef]
  48. Yeh, I.C.; Andzelm, J.W.; Rutledge, G.C. Mechanical and structural characterization of semicrystalline polyethylene under tensile deformation by molecular dynamics simulations. Macromolecules 2015, 48, 4228–4239. [Google Scholar] [CrossRef]
  49. Vu-Bac, N.; Lahmer, T.; Keitel, H.; Zhao, J.; Zhuang, X.; Rabczuk, T. Stochastic predictions of bulk properties of amorphous polyethylene based on molecular dynamics simulations. Mech. Mater. 2014, 68, 70–84. [Google Scholar] [CrossRef]
  50. Hess, B.; Bekker, H.; Berendsen, H.J.; Fraaije, J.G. LINCS: A linear constraint solver for molecular simulations. J. Comput. Chem. 1997, 18, 1463–1472. [Google Scholar] [CrossRef]
  51. Pronk, S.; Páll, S.; Schulz, R.; Larsson, P.; Bjelkmar, P.; Apostolov, R.; Shirts, M.R.; Smith, J.C.; Kasson, P.M.; van der Spoel, D.; et al. GROMACS 4.5: A high-throughput and highly parallel open source molecular simulation toolkit. Bioinformatics 2013, 29, 845–854. [Google Scholar] [CrossRef] [PubMed]
  52. Hoover, W.G. Canonical dynamics: Equilibrium phase-space distributions. Phys. Rev. A 1985, 31, 1695–1697. [Google Scholar] [CrossRef]
  53. Nosé, S. A unified formulation of the constant temperature molecular dynamics methods. J. Chem. Phys. 1984, 81, 511–519. [Google Scholar] [CrossRef]
  54. Hockney, R.W. The potential calculation and some applications. Methods Comput. Phys. 1970, 9, 135–211. [Google Scholar]
  55. Flory, P.J. The configuration of real polymer chains. J. Chem. Phys. 1949, 17, 303–310. [Google Scholar] [CrossRef]
  56. Hoy, R.S.; Foteinopoulou, K.; Kröger, M. Topological analysis of polymeric melts: Chain-length effects and fast-converging estimators for entanglement length. Phys. Rev. E 2009, 80, 031803. [Google Scholar] [CrossRef] [PubMed]
  57. Kröger, M. Shortest multiple disconnected path for the analysis of entanglements in two-and three-dimensional polymeric systems. Comput. Phys. Commun. 2005, 168, 209–232. [Google Scholar] [CrossRef]
  58. Shanbhag, S.; Kröger, M. Primitive path networks generated by annealing and geometrical methods: Insights into differences. Macromolecules 2007, 40, 2897–2903. [Google Scholar] [CrossRef]
  59. Rouse, P.E., Jr. A theory of the linear viscoelastic properties of dilute solutions of coiling polymers. J. Chem. Phys. 1953, 21, 1272–1280. [Google Scholar] [CrossRef]
  60. Likhtman, A.E.; Sukumaran, S.K.; Ramirez, J. Linear viscoelasticity from molecular dynamics simulation of entangled polymers. Macromolecules 2007, 40, 6748–6757. [Google Scholar] [CrossRef]
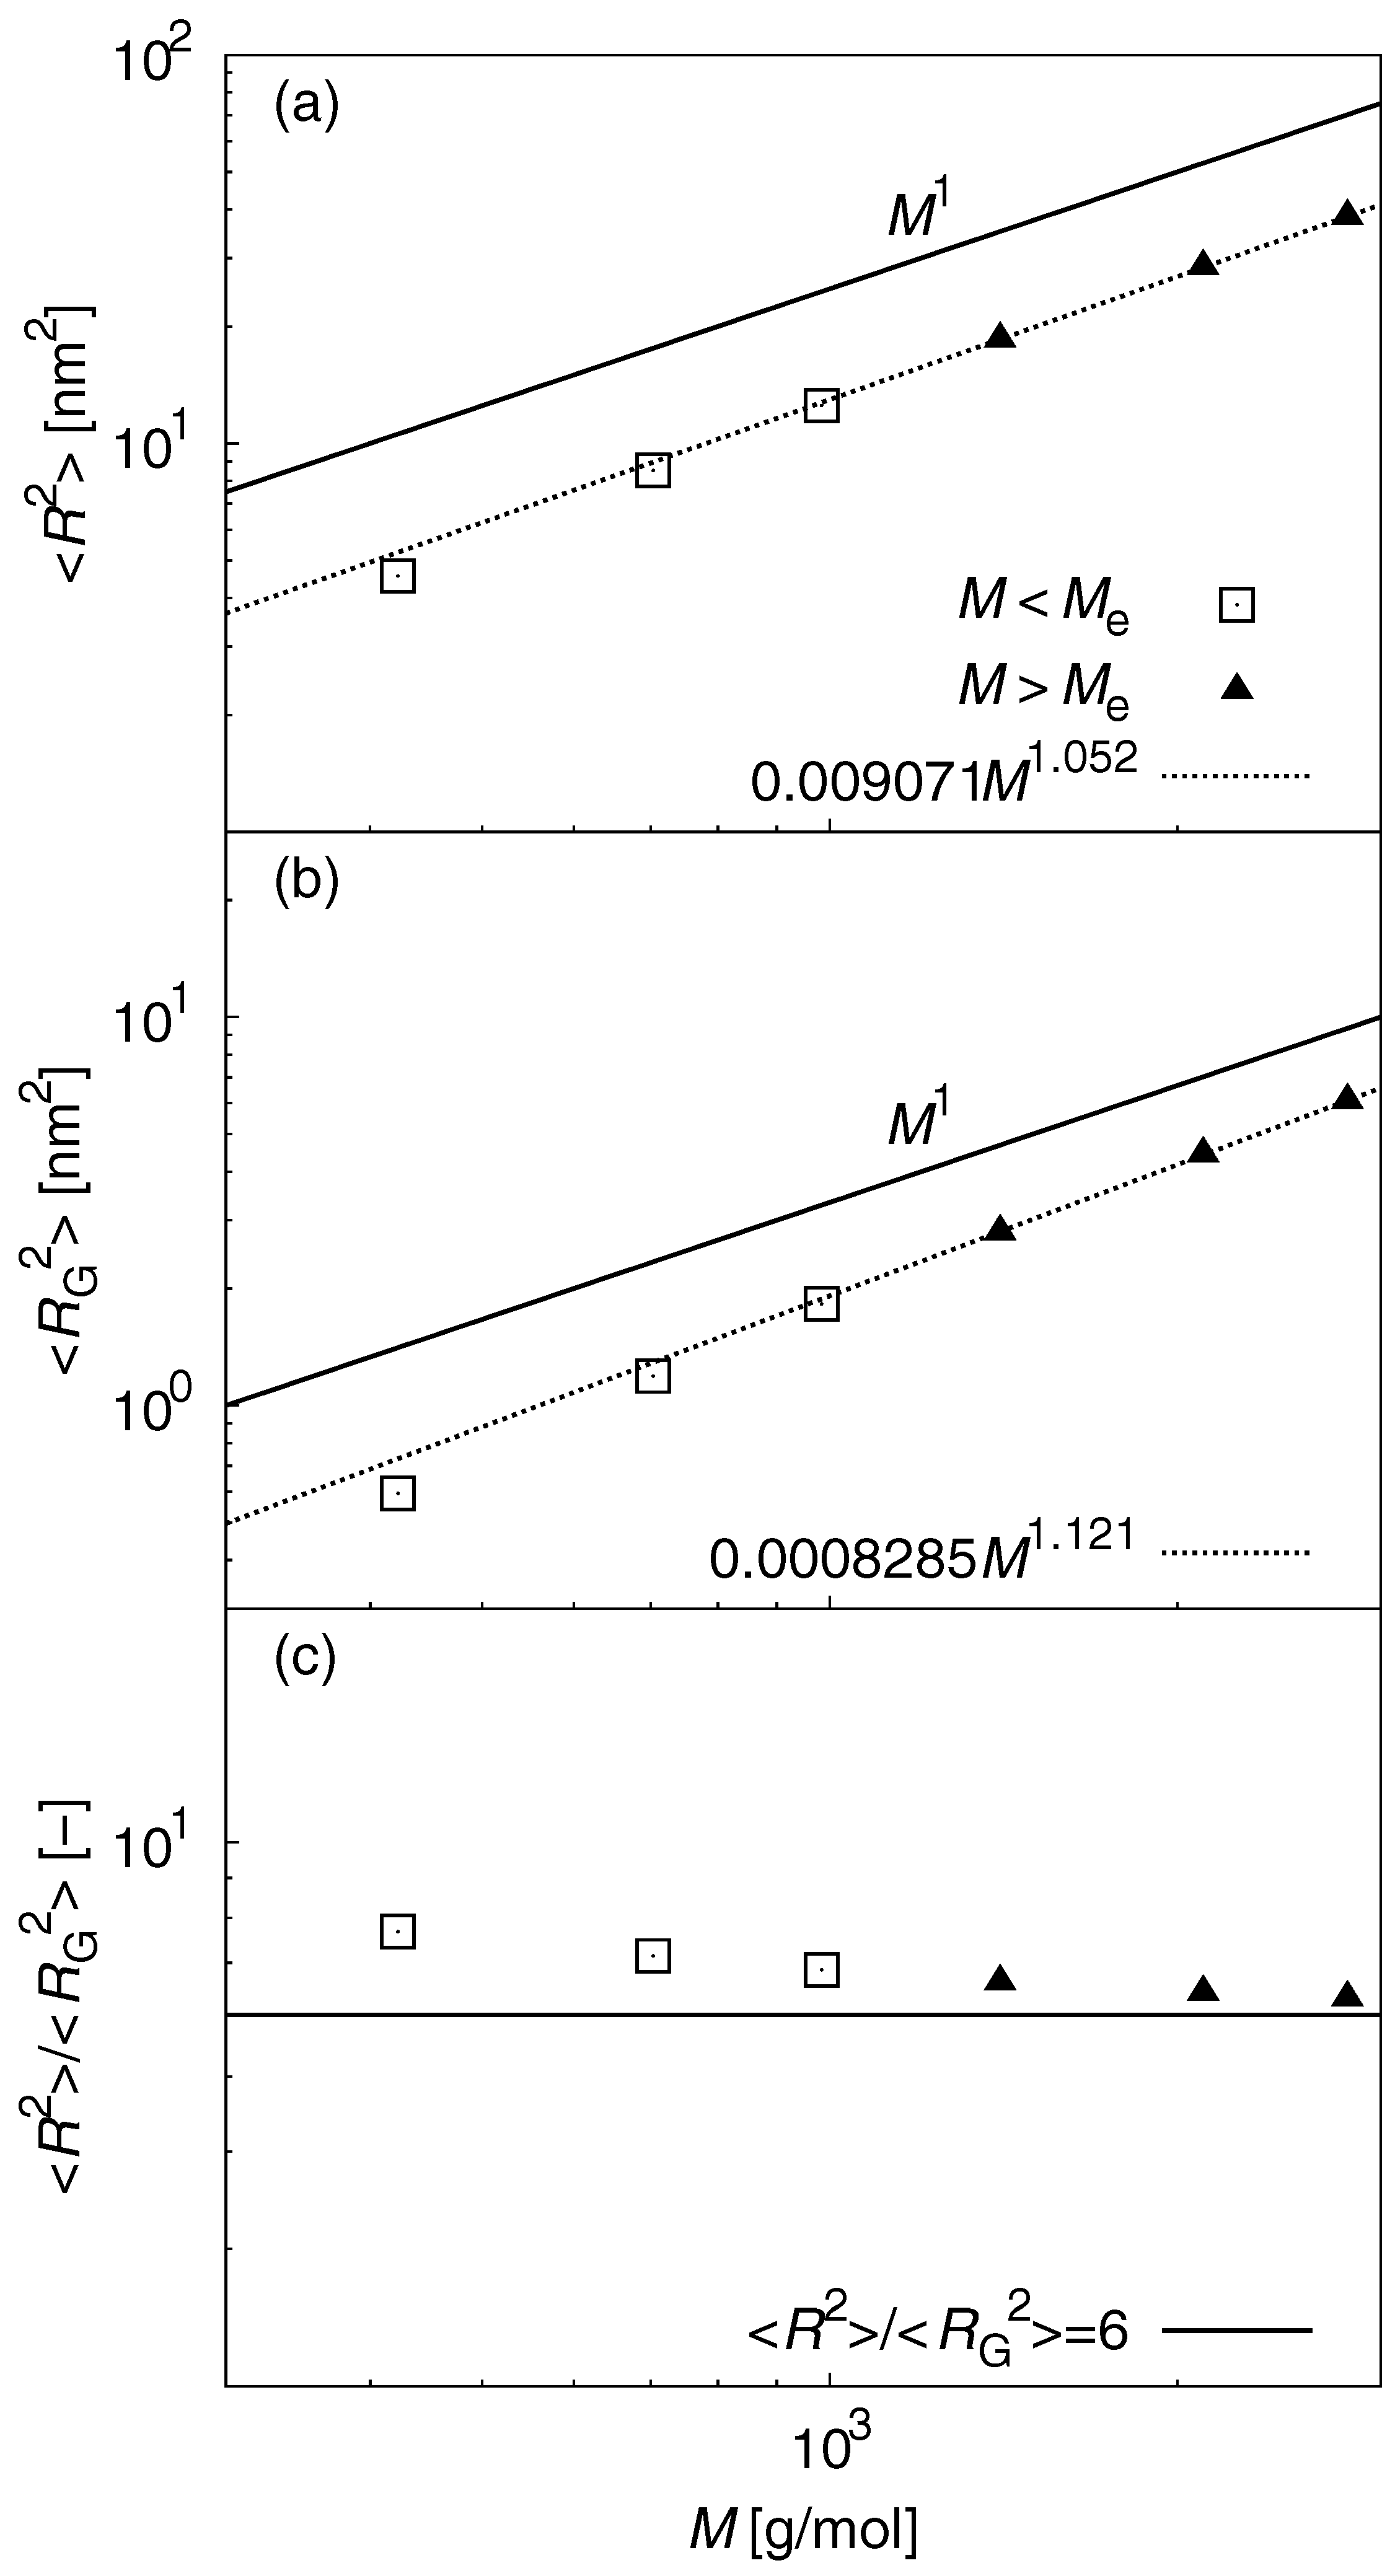
Figure 1. Results for (a) R 2 M; (b) R G 2 M scalings; and (c) the ratio R 2 / R G 2 with respect to M. Fitting curves for data at M > M e are also plotted. R 2 and R G 2 scale with M 1 . 052 and M 1 . 121 , respectively. These differ by 5.2% and 12%, respectively, from values expected for ideal chains. The ratio R 2 / R G 2 deviates from ideal chain behavior. The slow convergence to the ideal value ( R 2 / R G 2 = 6 ) is observed with increasing M.
Polymers 09 00024 g001
Figure 2. Results for S ( q ) . The unique S ( q ) shape is observed for q > 2 . 0 rad / nm ; however, the fractal scattering is clearly different from that expected for an ideal chain. The fractal scattering of S ( q ) at 2 . 0 rad / nm < q < 10 rad / nm was estimated to be q 1 . 342 ( ν = 0 . 7452 ), which differs by 33% from the expected value.
Polymers 09 00024 g002
Figure 3. Results for the intramolecular contribution of g ( r ) .
Polymers 09 00024 g003
Figure 4. Semi-log plot of C ( t ) . For the range 0 . 1 < C ( t ) < 1 / e , C ( t ) have linear slopes, irrespective of chain length.
Polymers 09 00024 g004
Figure 5. τ R M scaling law. For M < M e , τ R scales with M 2 . 1 , and is 5% different from the scaling exponent predicted from the Rouse theory. For M < M e , τ R scales with M 2 . 7 and is 10% different from the scaling exponent predicted from the reptation theory.
Polymers 09 00024 g005
Figure 6. Results for g 1 ( t ) . The expected shape of g 1 ( t ) from Equation (10) for M = 2807 g / mol is also plotted. The results of g 1 ( t ) at M = 2807 g / mol roughly have the same scaling-law, as expected. However, the threshold values for Equation (10) are unclear from the mean-square displacement results.
Polymers 09 00024 g006
Figure 7. Results for the DM scaling law. For M < M e , τ R scales with M 1 . 4 , while the expected value is ∼ M 1 . For M < M e , τ R scales with M 2 . 1 , which is 5% different from the scaling exponent predicted from the reptation theory.
Polymers 09 00024 g007
Figure 8. (a) log-log plot of G ( t ) ; and (b) semi-log plot of G ( t ) t 1 / 2 . For M = 2106 and 2807 g / mol , peaks that indicate entanglement were observed at long times. Deviation from the Rouse theory that indicates onset of entanglement was observed at 10 ps . The Rouse behavior can only be seen over the short-time range (5– 10 ps ). For M = 1405 g / mol , the tendency is roughly the same; however, the entanglement is weak (i.e., the peak is small). For M = 703 . 4 and 983 . 9 g / mol , Rouse behavior is observed at 2– 100 ps .
Polymers 09 00024 g008
Table 1. United-atom polyethylene systems studied in the present work ( ρ = 0 . 65 g / mol and T = 500 K ).
M (g/mol)No. of chainsSimulation time (ns)No. of initial structures
422.810001003
703.46001003
983.94281003
14053005006
21062005006
28071508006