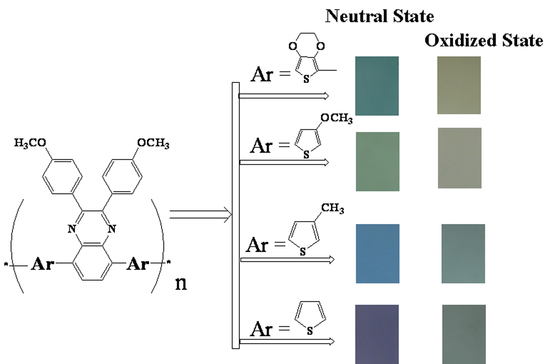
The Availability of Neutral Cyan, Green, Blue and Purple Colors from Simple D–A Type Polymers with Commercially Available Thiophene Derivatives as the Donor Units


Abstract
:
1. Introduction
2. Experimental
2.1. Materials
2.2. Analysis Method
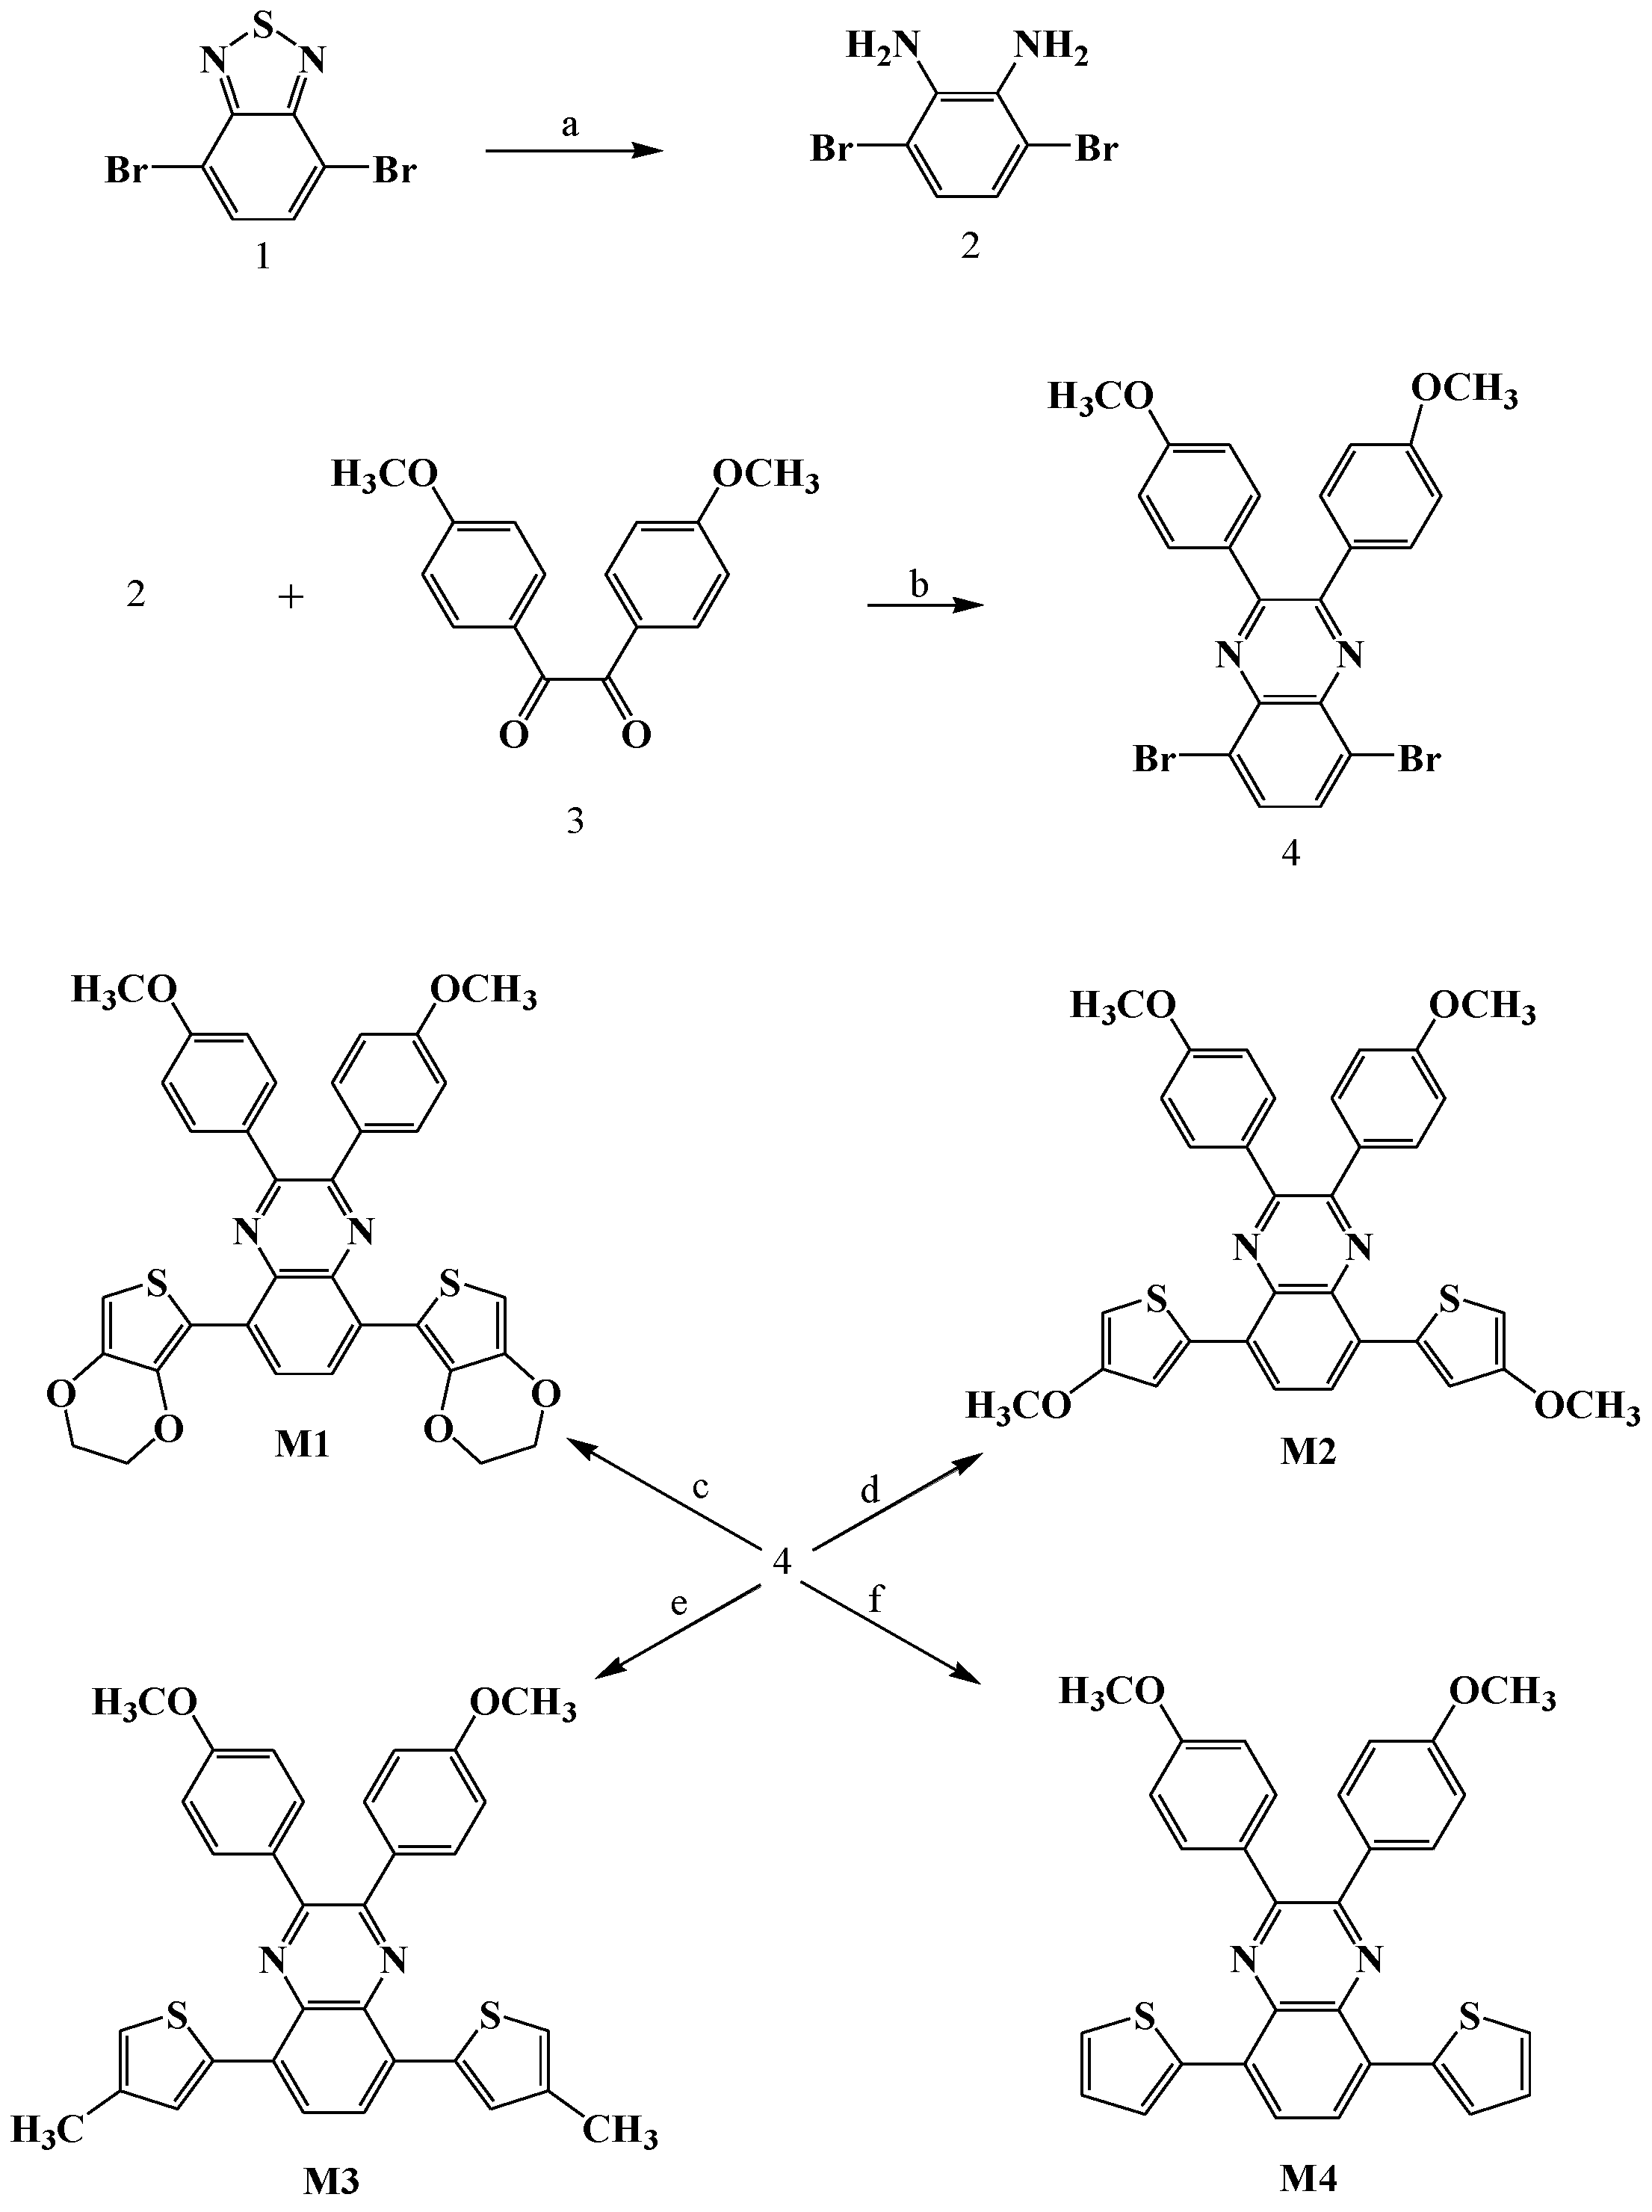
2.3. Synthesis
3. Results and Discussion
3.1. Electrochemical Polymerization
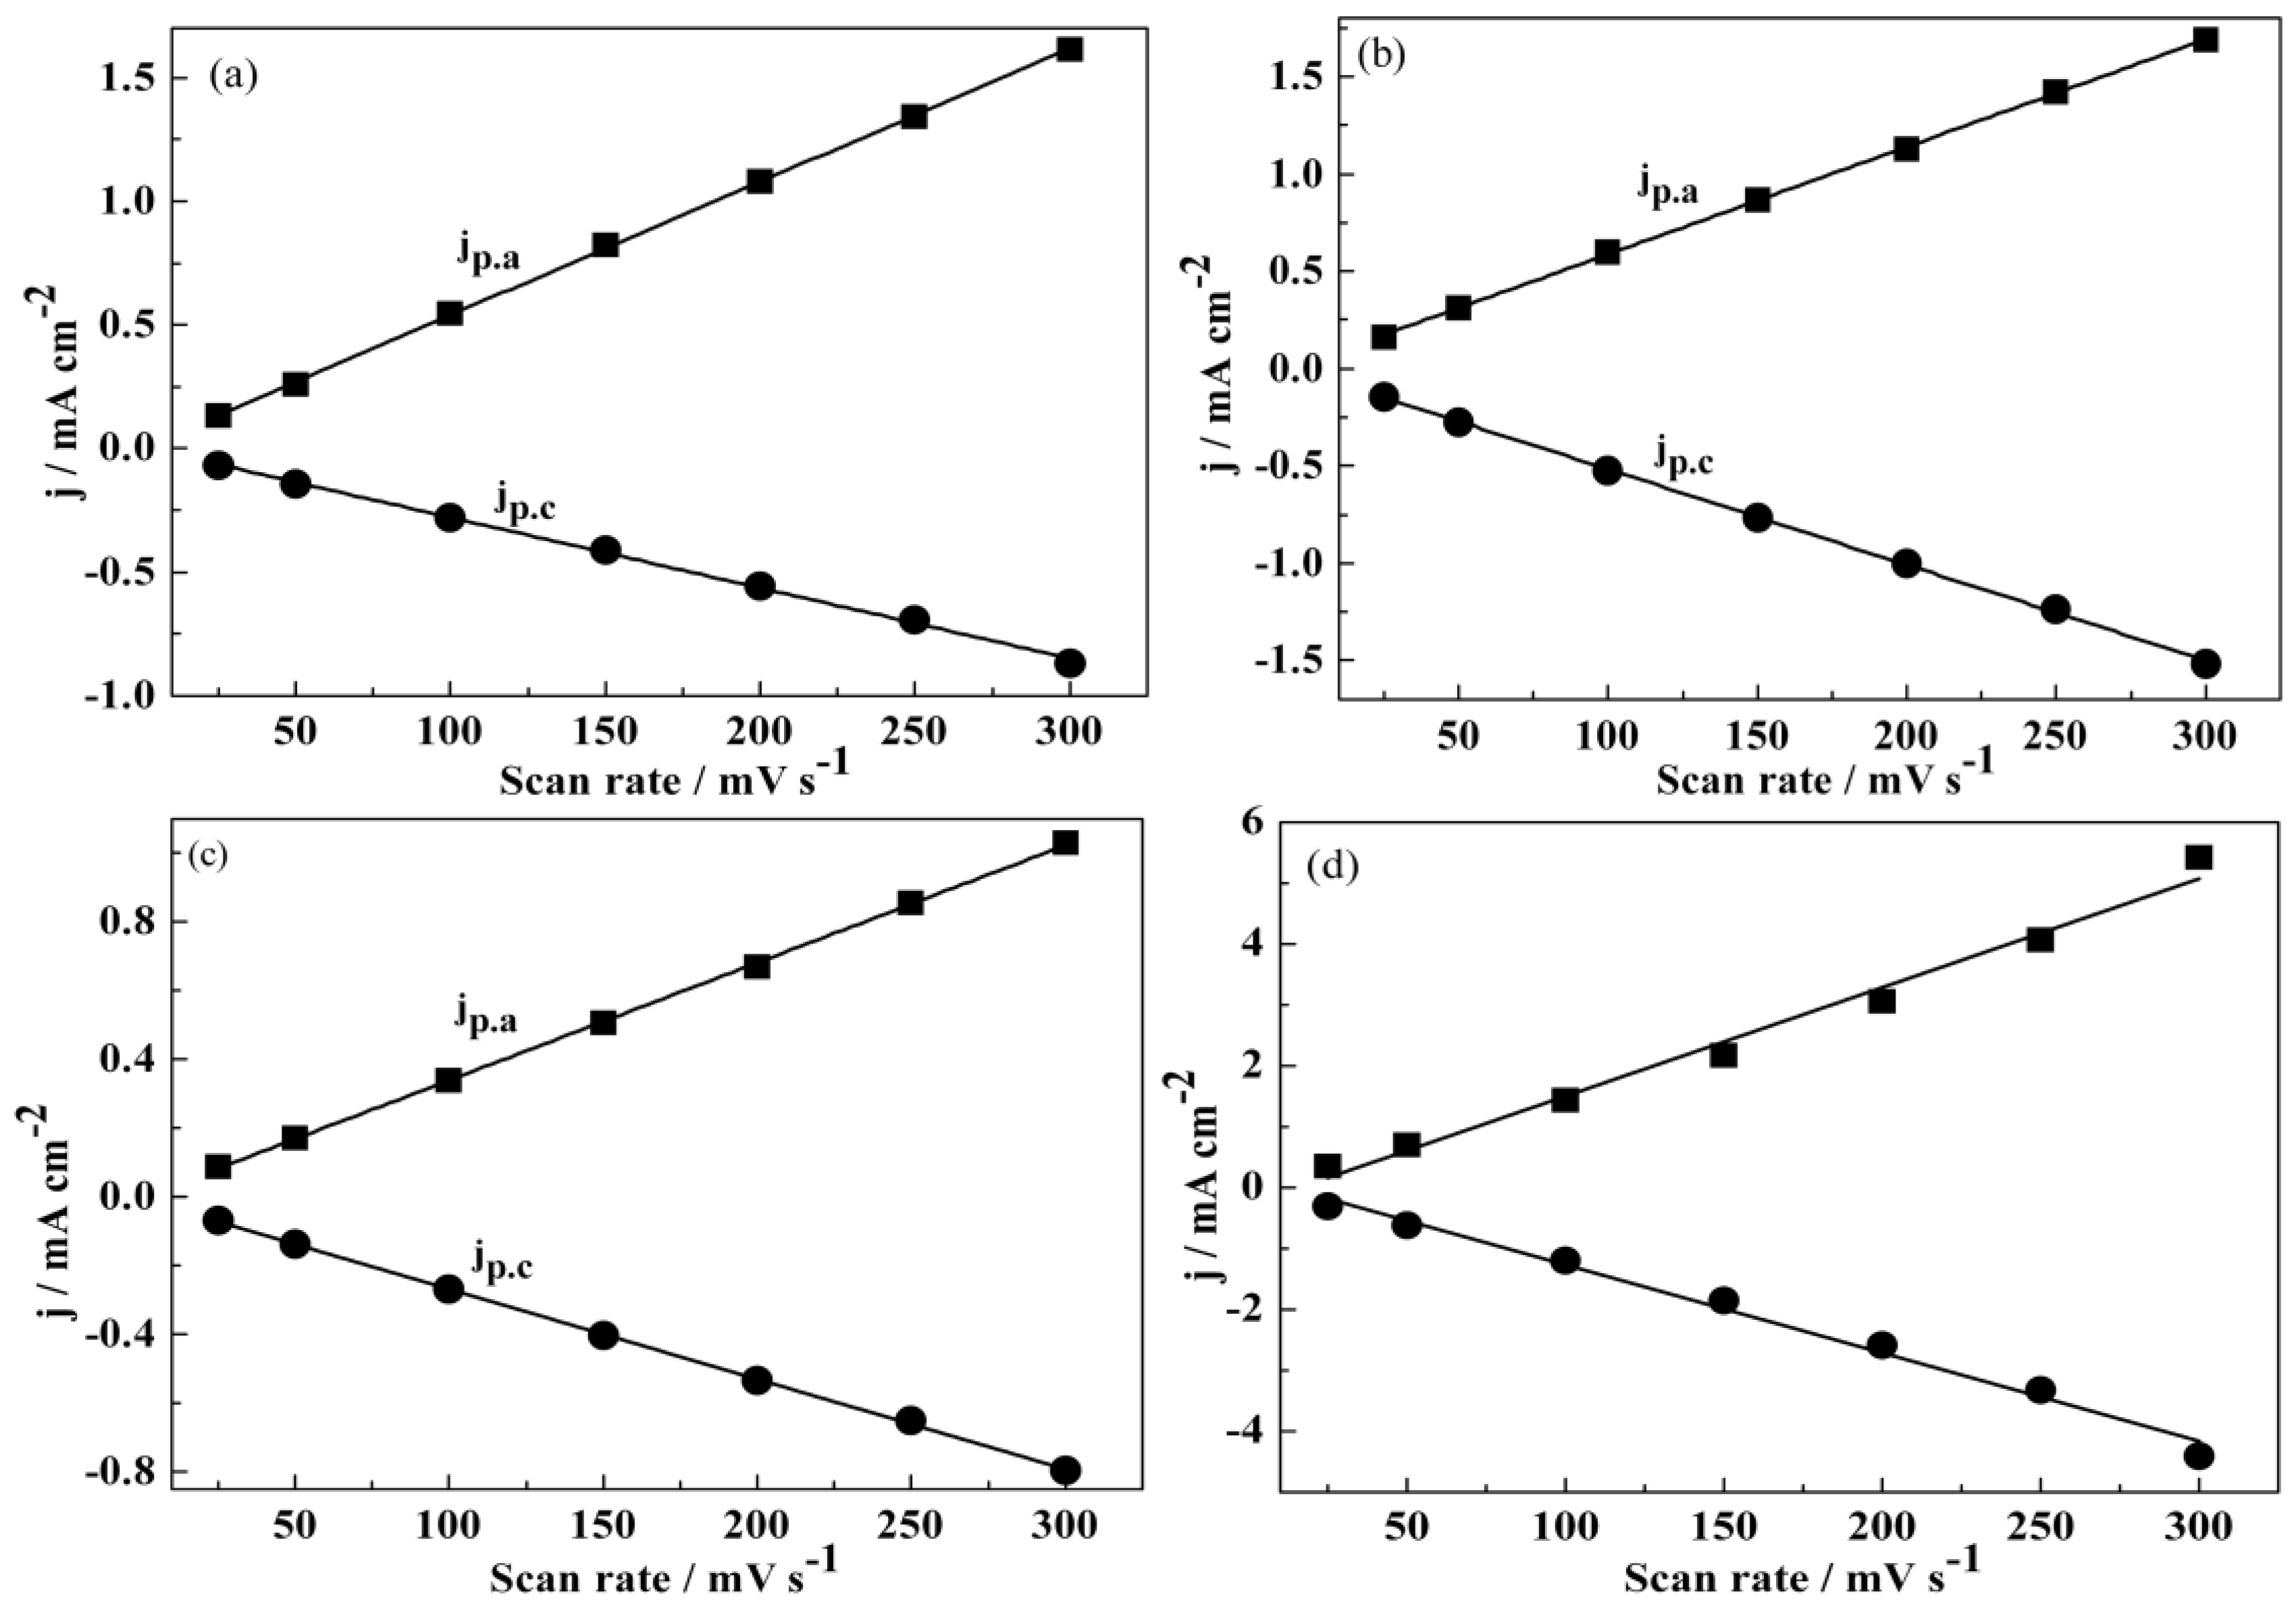
3.2. Redox Behaviour
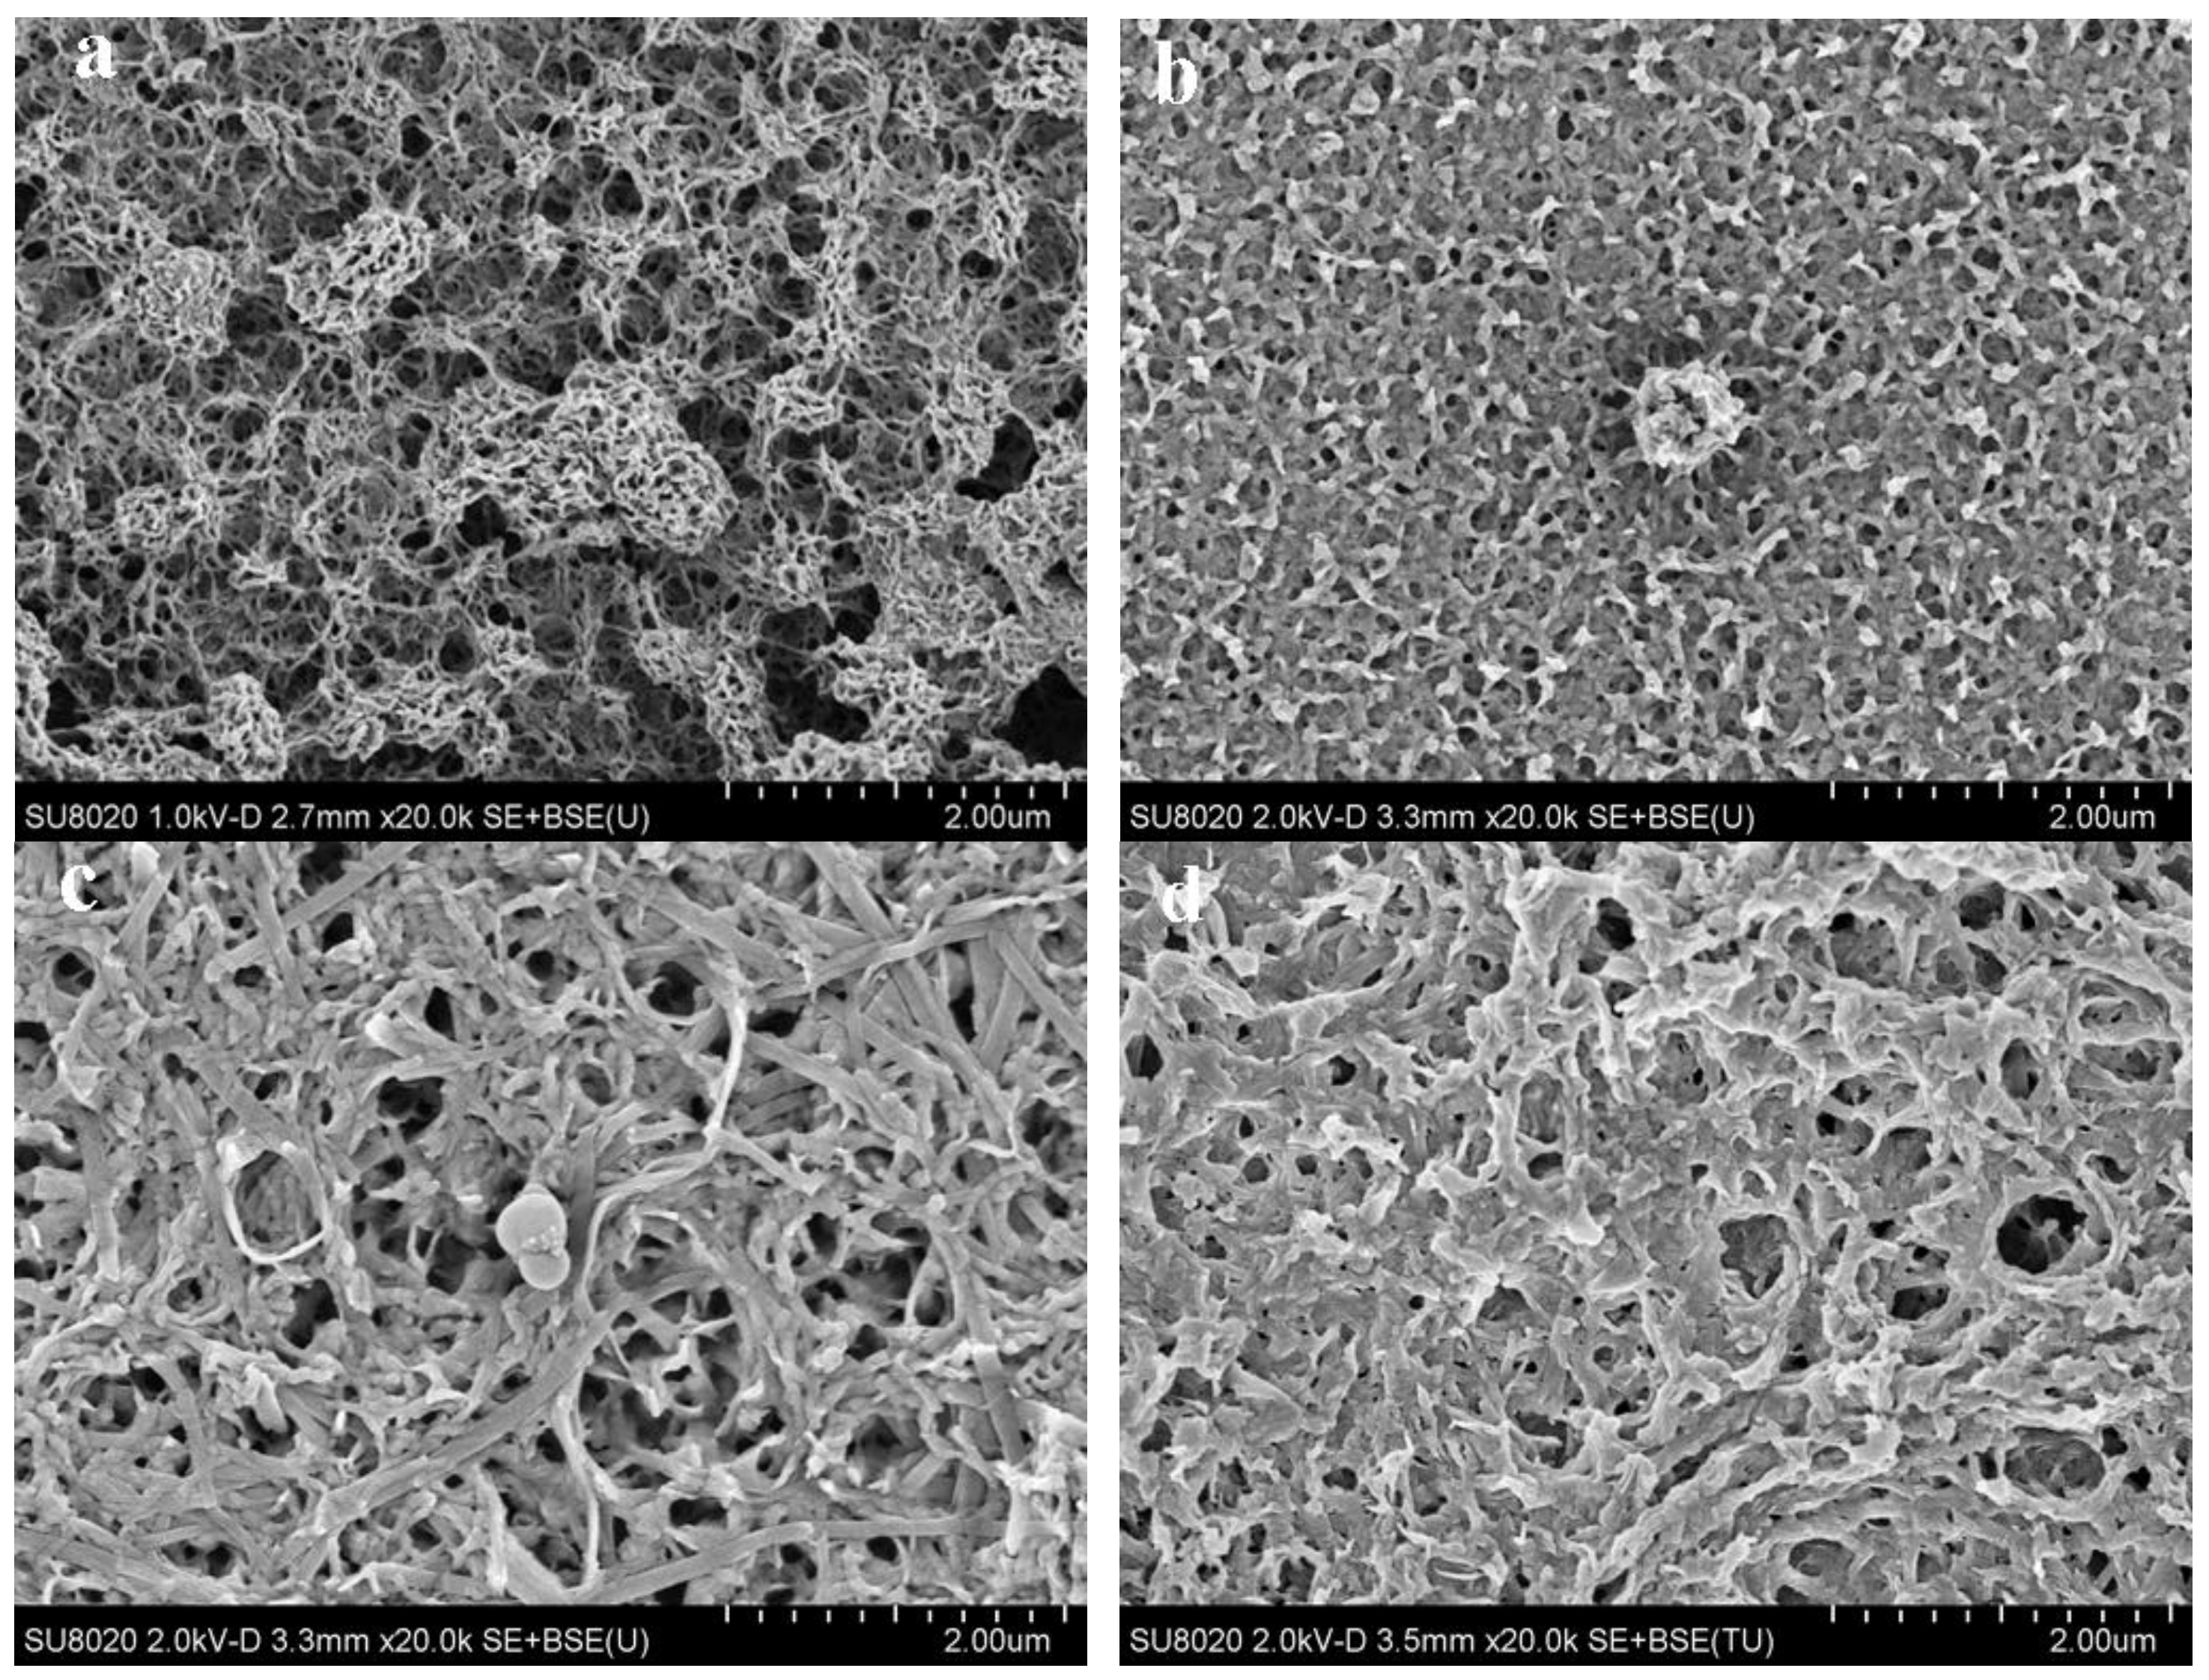
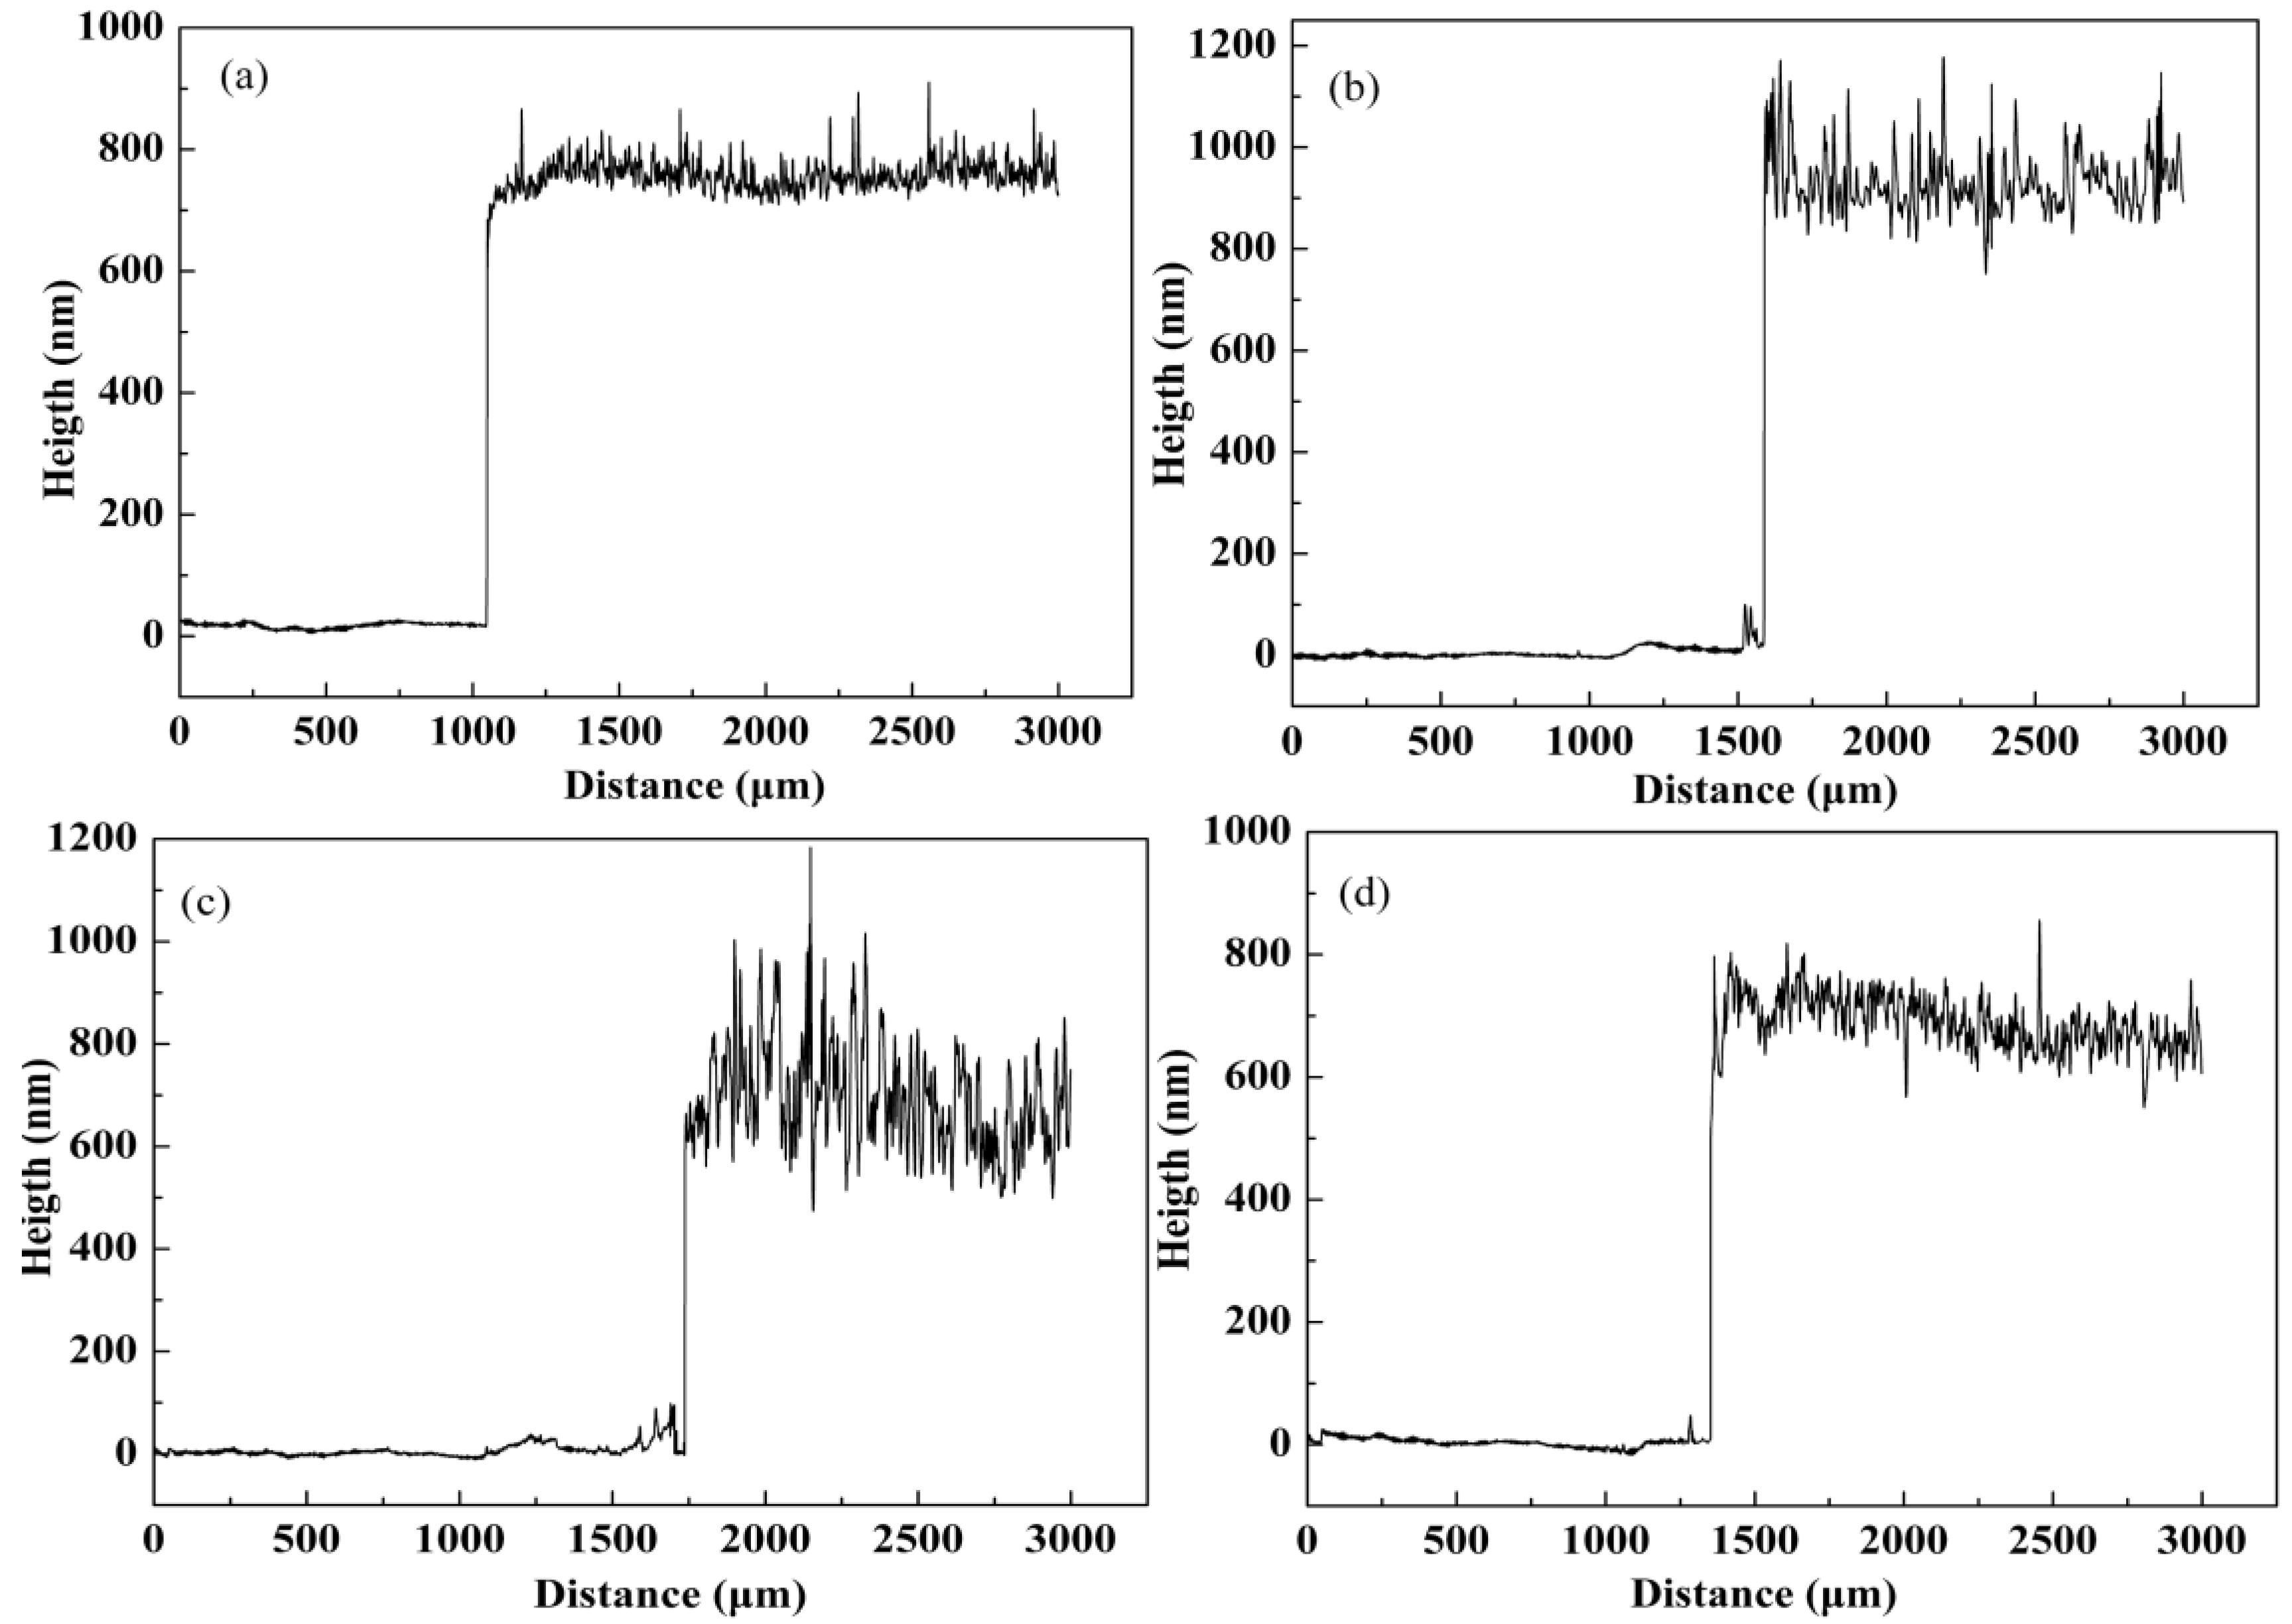
3.3. Morphology
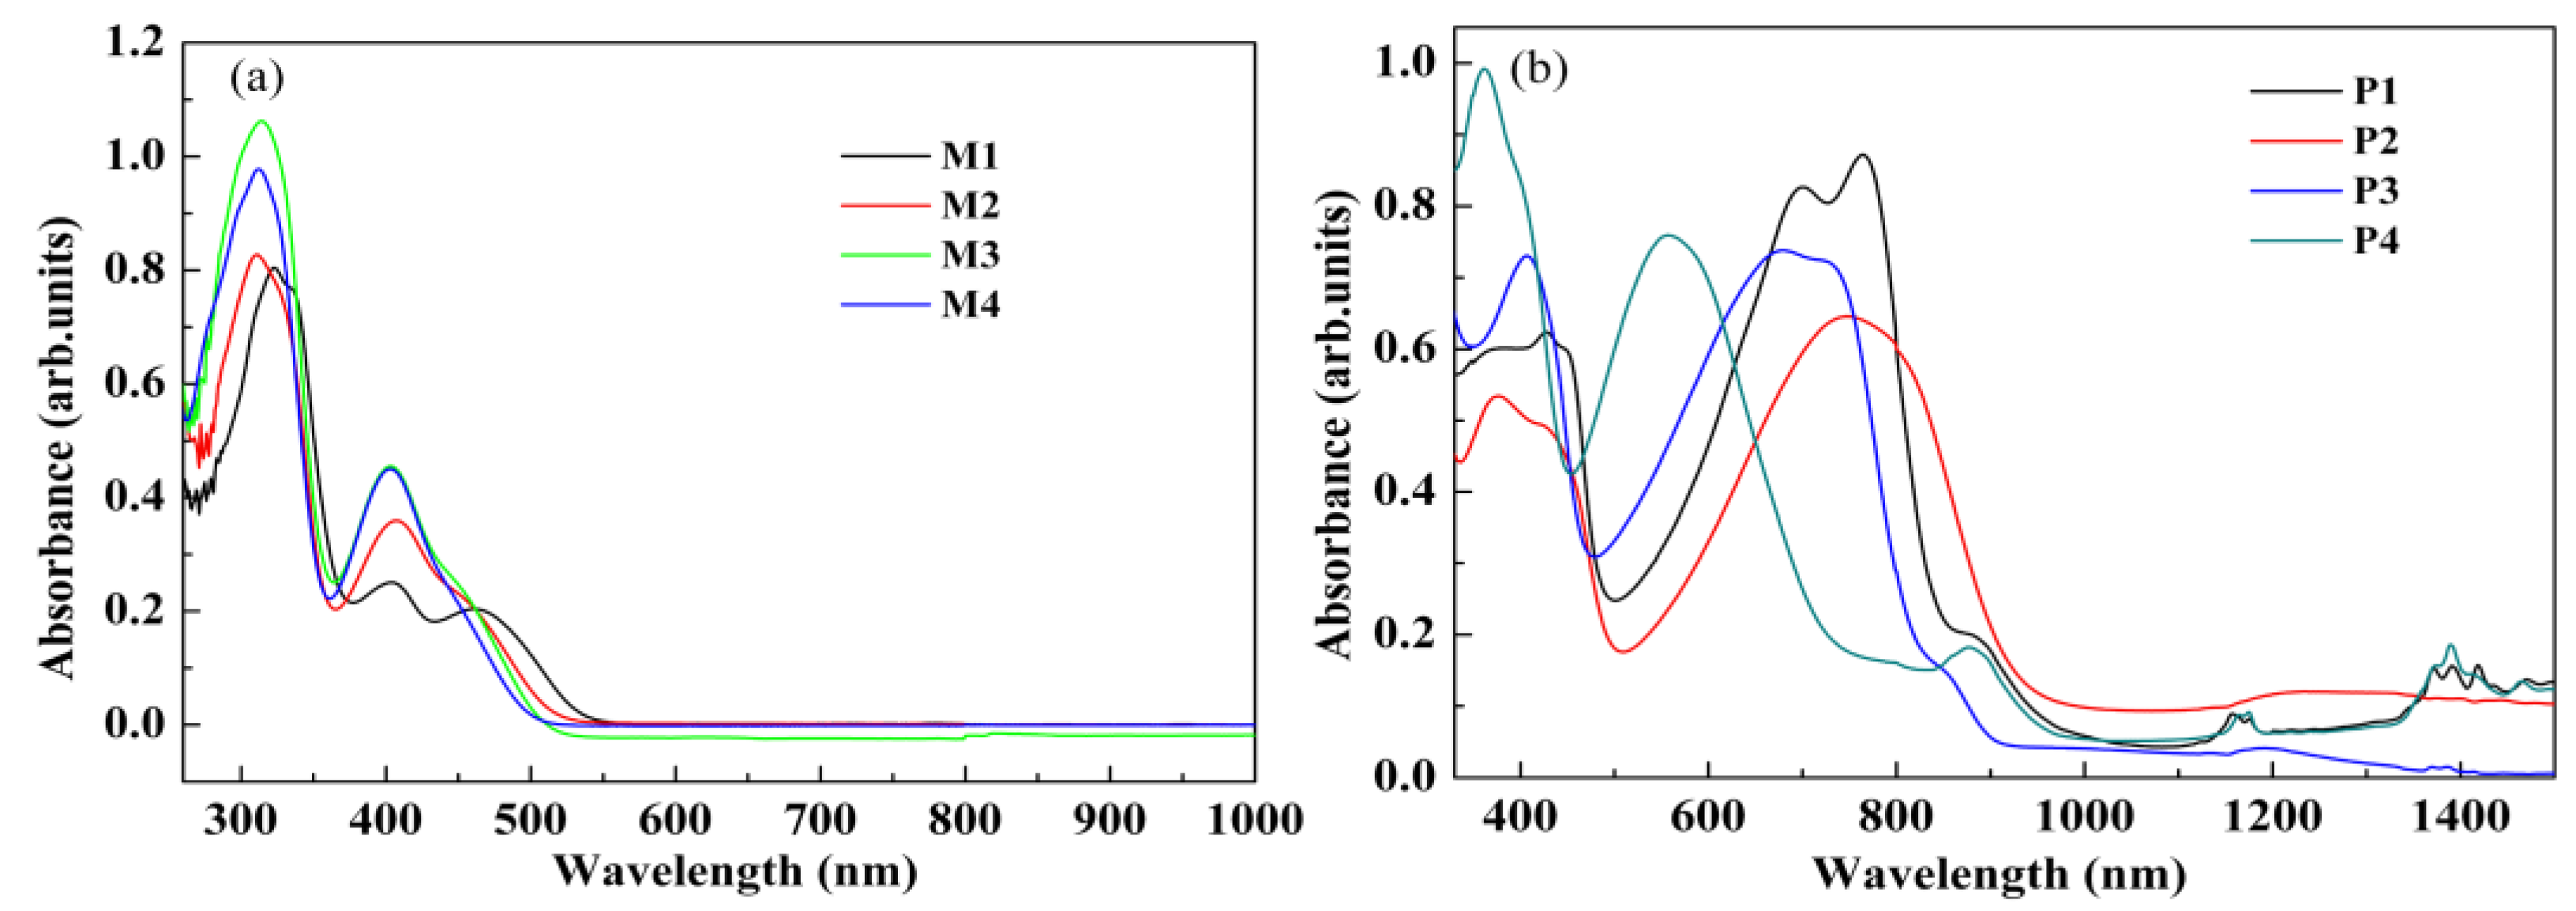
3.4. Optical Properties of the Monomers and Films
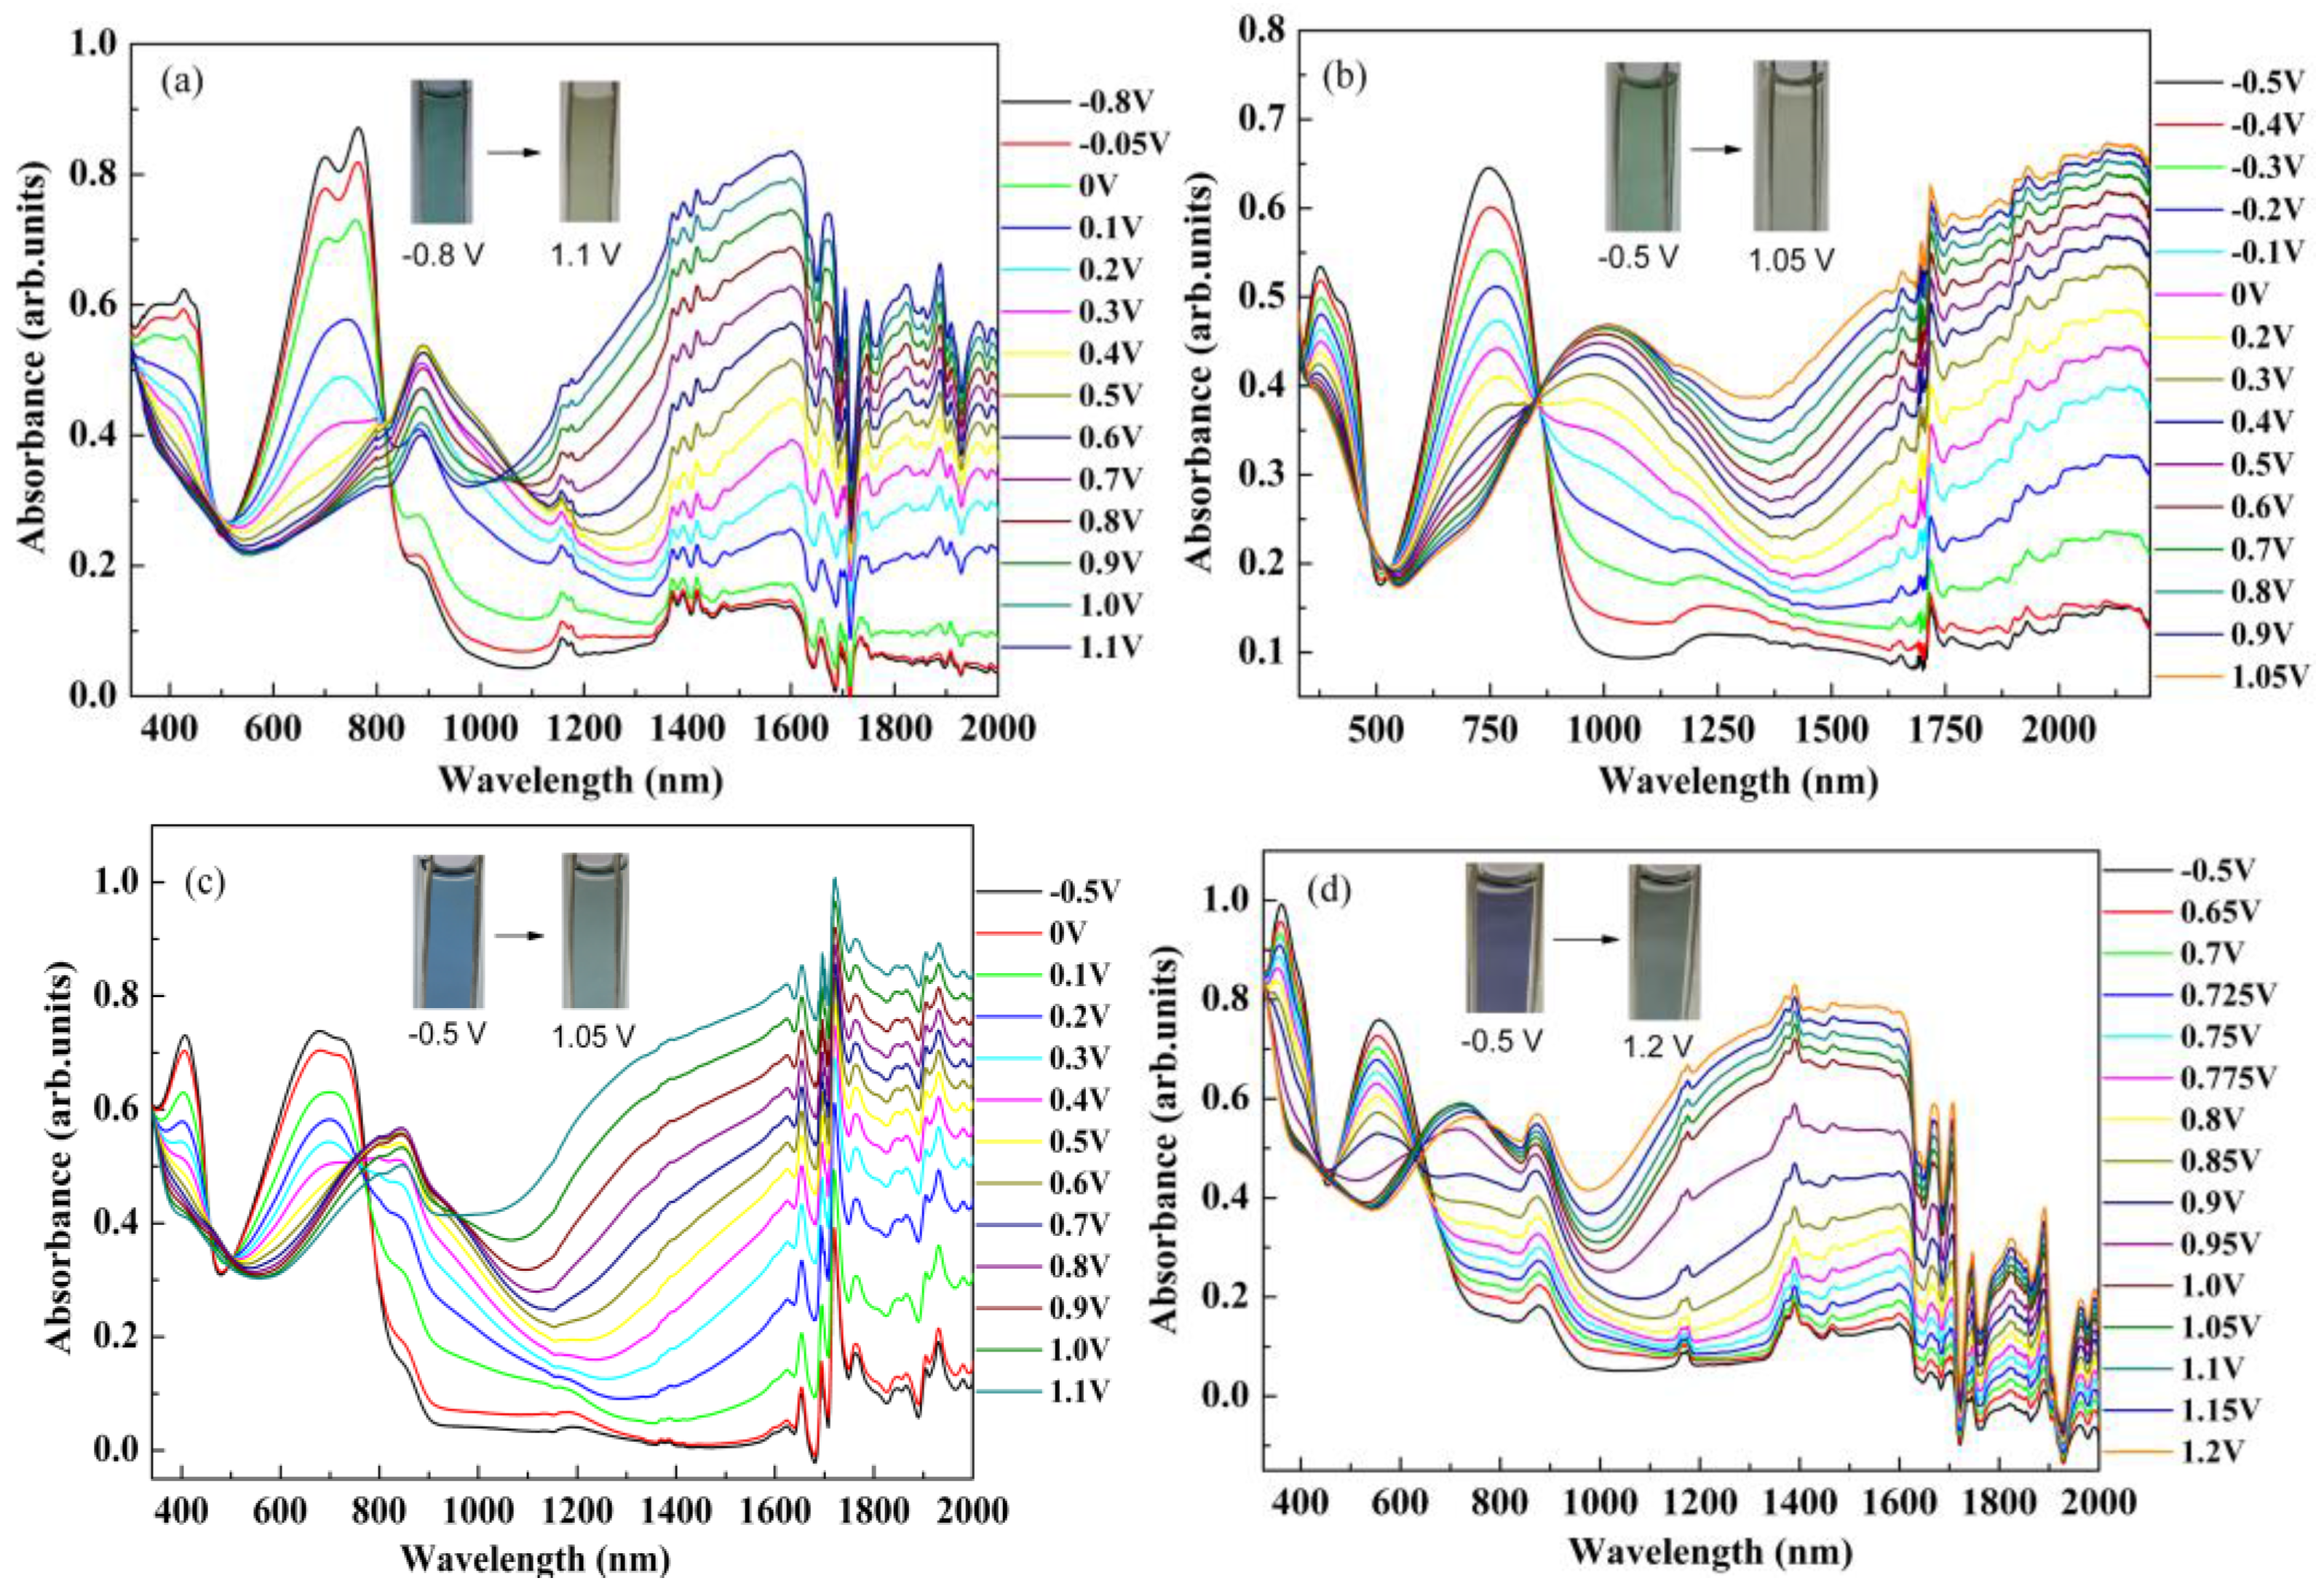
3.5. The Dependence of Optical Absorption on the Biased Potentials
3.6. Optical Switching Performance
4. Conclusions
Supplementary Materials
Acknowledgments
Author Contributions
Conflicts of Interest
References
- Alesanco, Y.; Vinuales, A.; Cabanero, G.; Rodriguez, J.; Tena-Zaera, R. Colorless to Neutral Color Electrochromic Devices Based on Asymmetric Viologens. ACS Appl. Mater. Interfaces 2016, 8, 29619–29627. [Google Scholar] [CrossRef] [PubMed]
- Osterholm, A.M.; Shen, D.E.; Kerszulis, J.A.; Bulloch, R.H.; Kuepfert, M.; Dyer, A.L.; Reynolds, J.R. Four shades of brown: Tuning of electrochromic polymer blends toward high-contrast eyewear. ACS Appl. Mater. Interfaces 2015, 7, 1413–1421. [Google Scholar] [CrossRef] [PubMed]
- Mortimer, R.J.; Graham, K.R.; Grenier, C.R.; Reynolds, J.R. Influence of the film thickness and morphology on the colorimetric properties of spray-coated electrochromic disubstituted 3,4-propylenedioxythiophene polymers. ACS Appl. Mater. Interfaces 2009, 1, 2269–2276. [Google Scholar] [CrossRef] [PubMed]
- Kerszulis, J.A.; Amb, C.M.; Dyer, A.L.; Reynolds, J.R. Follow the Yellow Brick Road: Structural Optimization of Vibrant Yellow-to-Transmissive Electrochromic Conjugated Polymers. Macromolecules 2014, 47, 5462–5469. [Google Scholar] [CrossRef]
- Cao, K.; Shen, D.E.; Österholm, A.M.; Kerszulis, J.A.; Reynolds, J.R. Tuning Color, Contrast, and Redox Stability in High Gap Cathodically Coloring Electrochromic Polymers. Macromolecules 2016, 49, 8498–8507. [Google Scholar] [CrossRef]
- Amb, C.M.; Dyer, A.L.; Reynolds, J.R. Navigating the Color Palette of Solution-Processable Electrochromic Polymers. Chem. Mater. 2011, 23, 397–415. [Google Scholar] [CrossRef]
- Hacioglu, S.O.; Unlu, N.A.; Aktas, E.; Hizalan, G.; Yildiz, E.D.; Cirpan, A.; Toppare, L. A triazoloquinoxaline and benzodithiophene bearing low band gap copolymer for electrochromic and organic photovoltaic applications. Synth. Met. 2017, 228, 111–119. [Google Scholar] [CrossRef]
- Özkut, M.İ.; Algi, M.P.; Öztaş, Z.; Algi, F.; Önal, A.M.; Cihaner, A. Members of CMY Color Space: Cyan and Magenta Colored Polymers Based on Oxadiazole Acceptor Unit. Macromolecules 2012, 45, 729–734. [Google Scholar] [CrossRef]
- Li, W.; Guo, Y.; Shi, J.; Yu, H.; Meng, H. Solution-Processable Neutral Green Electrochromic Polymer Containing Thieno[3,2-b]thiophene Derivative as Unconventional Donor Units. Macromolecules 2016, 49, 7211–7219. [Google Scholar] [CrossRef]
- Cihaner, A.; Algı, F. A Novel Neutral State Green Polymeric Electrochromic with Superior n- and p-Doping Processes: Closer to Red-Blue-Green (RGB) Display Realization. Adv. Funct. Mater. 2008, 18, 3583–3589. [Google Scholar] [CrossRef]
- Ming, S.; Zhen, S.; Lin, K.; Zhao, L.; Xu, J.; Lu, B. Thiadiazolo[3,4-c]pyridine as an Acceptor toward Fast-Switching Green Donor-Acceptor-Type Electrochromic Polymer with Low Bandgap. ACS. Appl. Mater. Interfaces 2015, 7, 11089–11098. [Google Scholar] [CrossRef] [PubMed]
- Çelikbilek, Ö.; İçli-Özkut, M.; Algi, F.; Önal, A.M.; Cihaner, A. Donor–acceptor polymer electrochromes with cyan color: Effect of alkyl chain length on doping processes. Org. Electron. 2012, 13, 206–213. [Google Scholar] [CrossRef]
- Fagour, S.; Thirion, D.; Vacher, A.; Sallenave, X.; Sini, G.; Aubert, P.H.; Vidal, F.; Chevrot, C. Understanding the colorimetric properties of quinoxaline-based pi-conjugated copolymers by tuning their acceptor strength: A joint theoretical and experimental approach. RSC Adv. 2017, 7, 22311–22319. [Google Scholar] [CrossRef]
- Xie, H.; Wang, M.; Kong, L.; Zhang, Y.; Ju, X.; Zhao, J. The optimization of donor-to-acceptor feed ratios with the aim of obtaining black-to-transmissive switching polymers based on isoindigo as the electron-deficient moiety. RSC Adv. 2017, 7, 11840–11851. [Google Scholar] [CrossRef]
- Beaujuge, P.M.; Vasilyeva, S.V.; Liu, D.Y.; Ellinger, S.; McCarley, T.D.; Reynolds, J.R. Structure-Performance Correlations in Spray-Processable Green Dioxythiophene-Benzothiadiazole Donor-Acceptor Polymer Electrochromes. Chem. Mater. 2012, 24, 255–268. [Google Scholar] [CrossRef]
- Fernandes, S.S.M.; Mesquita, I.; Andrade, L.; Mendes, A.; Justino, L.L.G.; Burrows, H.D.; Raposo, M.M.M. Synthesis and characterization of push-pull bithiophene and thieno[3,2-b]thiophene derivatives bearing an ethyne linker as sensitizers for dye-sensitized solar cells. Org. Electron. 2017, 49, 194–205. [Google Scholar] [CrossRef]
- Jiang, Y.; Cabanetos, C.; Allain, M.; Liu, P.; Roncali, J. Molecular electron-acceptors based on benzodithiophene for organic photovoltaics. Tetrahedron. Lett. 2015, 56, 2324–2328. [Google Scholar] [CrossRef] [Green Version]
- Ju, X.; Kong, L.; Zhao, J.; Bai, G. Synthesis and electrochemical capacitive performance of thieno[3,4-b]pyrazine-based Donor-Acceptor type copolymers used as supercapacitor electrode material. Electrochim. Acta 2017, 238, 36–48. [Google Scholar] [CrossRef]
- Gora, M.; Krzywiec, W.; Mieczkowski, J.; Rodrigues Maia, E.C.; Louarn, G.; Zagorska, M.; Pron, A. Alternating copolymers of diketopyrrolopyrrole or benzothiadiazole and alkoxy-substituted oligothiophenes: Spectroscopic, electrochemical and spectroelectrochemical investigations. Electrochim. Acta 2014, 144, 211–220. [Google Scholar] [CrossRef]
- Neo, W.T.; Loo, L.M.; Song, J.; Wang, X.; Cho, C.M.; On Chan, H.S.; Zong, Y.; Xu, J. Solution-processable blue-to-transmissive electrochromic benzotriazole-containing conjugated polymers. Polym. Chem. 2013, 4, 4663–4675. [Google Scholar] [CrossRef]
- Xu, Z.; Wang, M.; Fan, W.; Zhao, J.; Wang, H. The synthesis of new donor–acceptor polymers containing the 2,3-di(2-furyl) quinoxaline moiety: Fast-switching, low-band-gap, p- and n-dopable, neutral green-colored materials. Electrochim. Acta 2015, 160, 271–280. [Google Scholar] [CrossRef]
- Kroon, R.; Gehlhaar, R.; Steckler, T.T.; Henriksson, P.; Müller, C.; Bergqvist, J.; Hadipour, A.; Heremans, P.; Andersson, M.R. New quinoxaline and pyridopyrazine-based polymers for solution-processable photovoltaics. Sol. Energy Mater. Sol. C 2012, 105, 280–286. [Google Scholar] [CrossRef]
- Hellström, S.; Henriksson, P.; Kroon, R.; Wang, E.; Andersson, M.R. Blue-to-transmissive electrochromic switching of solution processable donor-acceptor polymers. Org. Electron. 2011, 12, 1406–1413. [Google Scholar] [CrossRef]
- Hellström, S.; Cai, T.; Inganäs, O.; Andersson, M.R. Influence of side chains on electrochromic properties of green donor-acceptor-donor polymers. Electrochim. Acta 2011, 56, 3454–3459. [Google Scholar] [CrossRef]
- Zhao, H.; Wei, Y.; Zhao, J.; Wang, M. Three donor-acceptor polymeric electrochromic materials employing 2,3-bis(4-(decyloxy)phenyl)pyrido[4,3-b]pyrazine as acceptor unit and thiophene derivatives as donor units. Electrochim. Acta 2014, 146, 231–241. [Google Scholar] [CrossRef]
- Zhang, Y.; Liu, X.; Wang, M.; Liu, X.; Zhao, J. Low Band Gap Donor–Acceptor Type Polymers Containing 2,3-Bis(4-(decyloxy)phenyl)pyrido[4,3-b]pyrazine as Acceptor and Different Thiophene Derivatives as Donors. Polymers 2016, 8, 377. [Google Scholar] [CrossRef]
- Xu, Z.; Wang, M.; Zhao, J.S.; Cui, C.S.; Fan, W.Y.; Liu, J.F. Donor–acceptor type neutral green polymers containing 2,3-di(5-methylfuran-2-yl) quinoxaline acceptor and different thiophene donors. Electrochim. Acta 2014, 125, 241–249. [Google Scholar] [CrossRef]
- Tao, Y.; Zhang, K.; Zhang, Z.; Cheng, H. Novel electrochromic copolymers based on thiophene-anthracene derivatives via electrochemical polymerization in boron trifluoride diethyl etherate. J. Electroanal. Chem. 2016, 769, 80–88. [Google Scholar] [CrossRef]


| Compounds | Eonset, vs. (Ag-wire) (V) | λmax (nm)/λonset (nm) | Eg a (eV) | HOMO b (eV) | LUMO c (eV) | ΔE d (eV) | HOMO d (eV) | LUMO d (eV) |
|---|---|---|---|---|---|---|---|---|
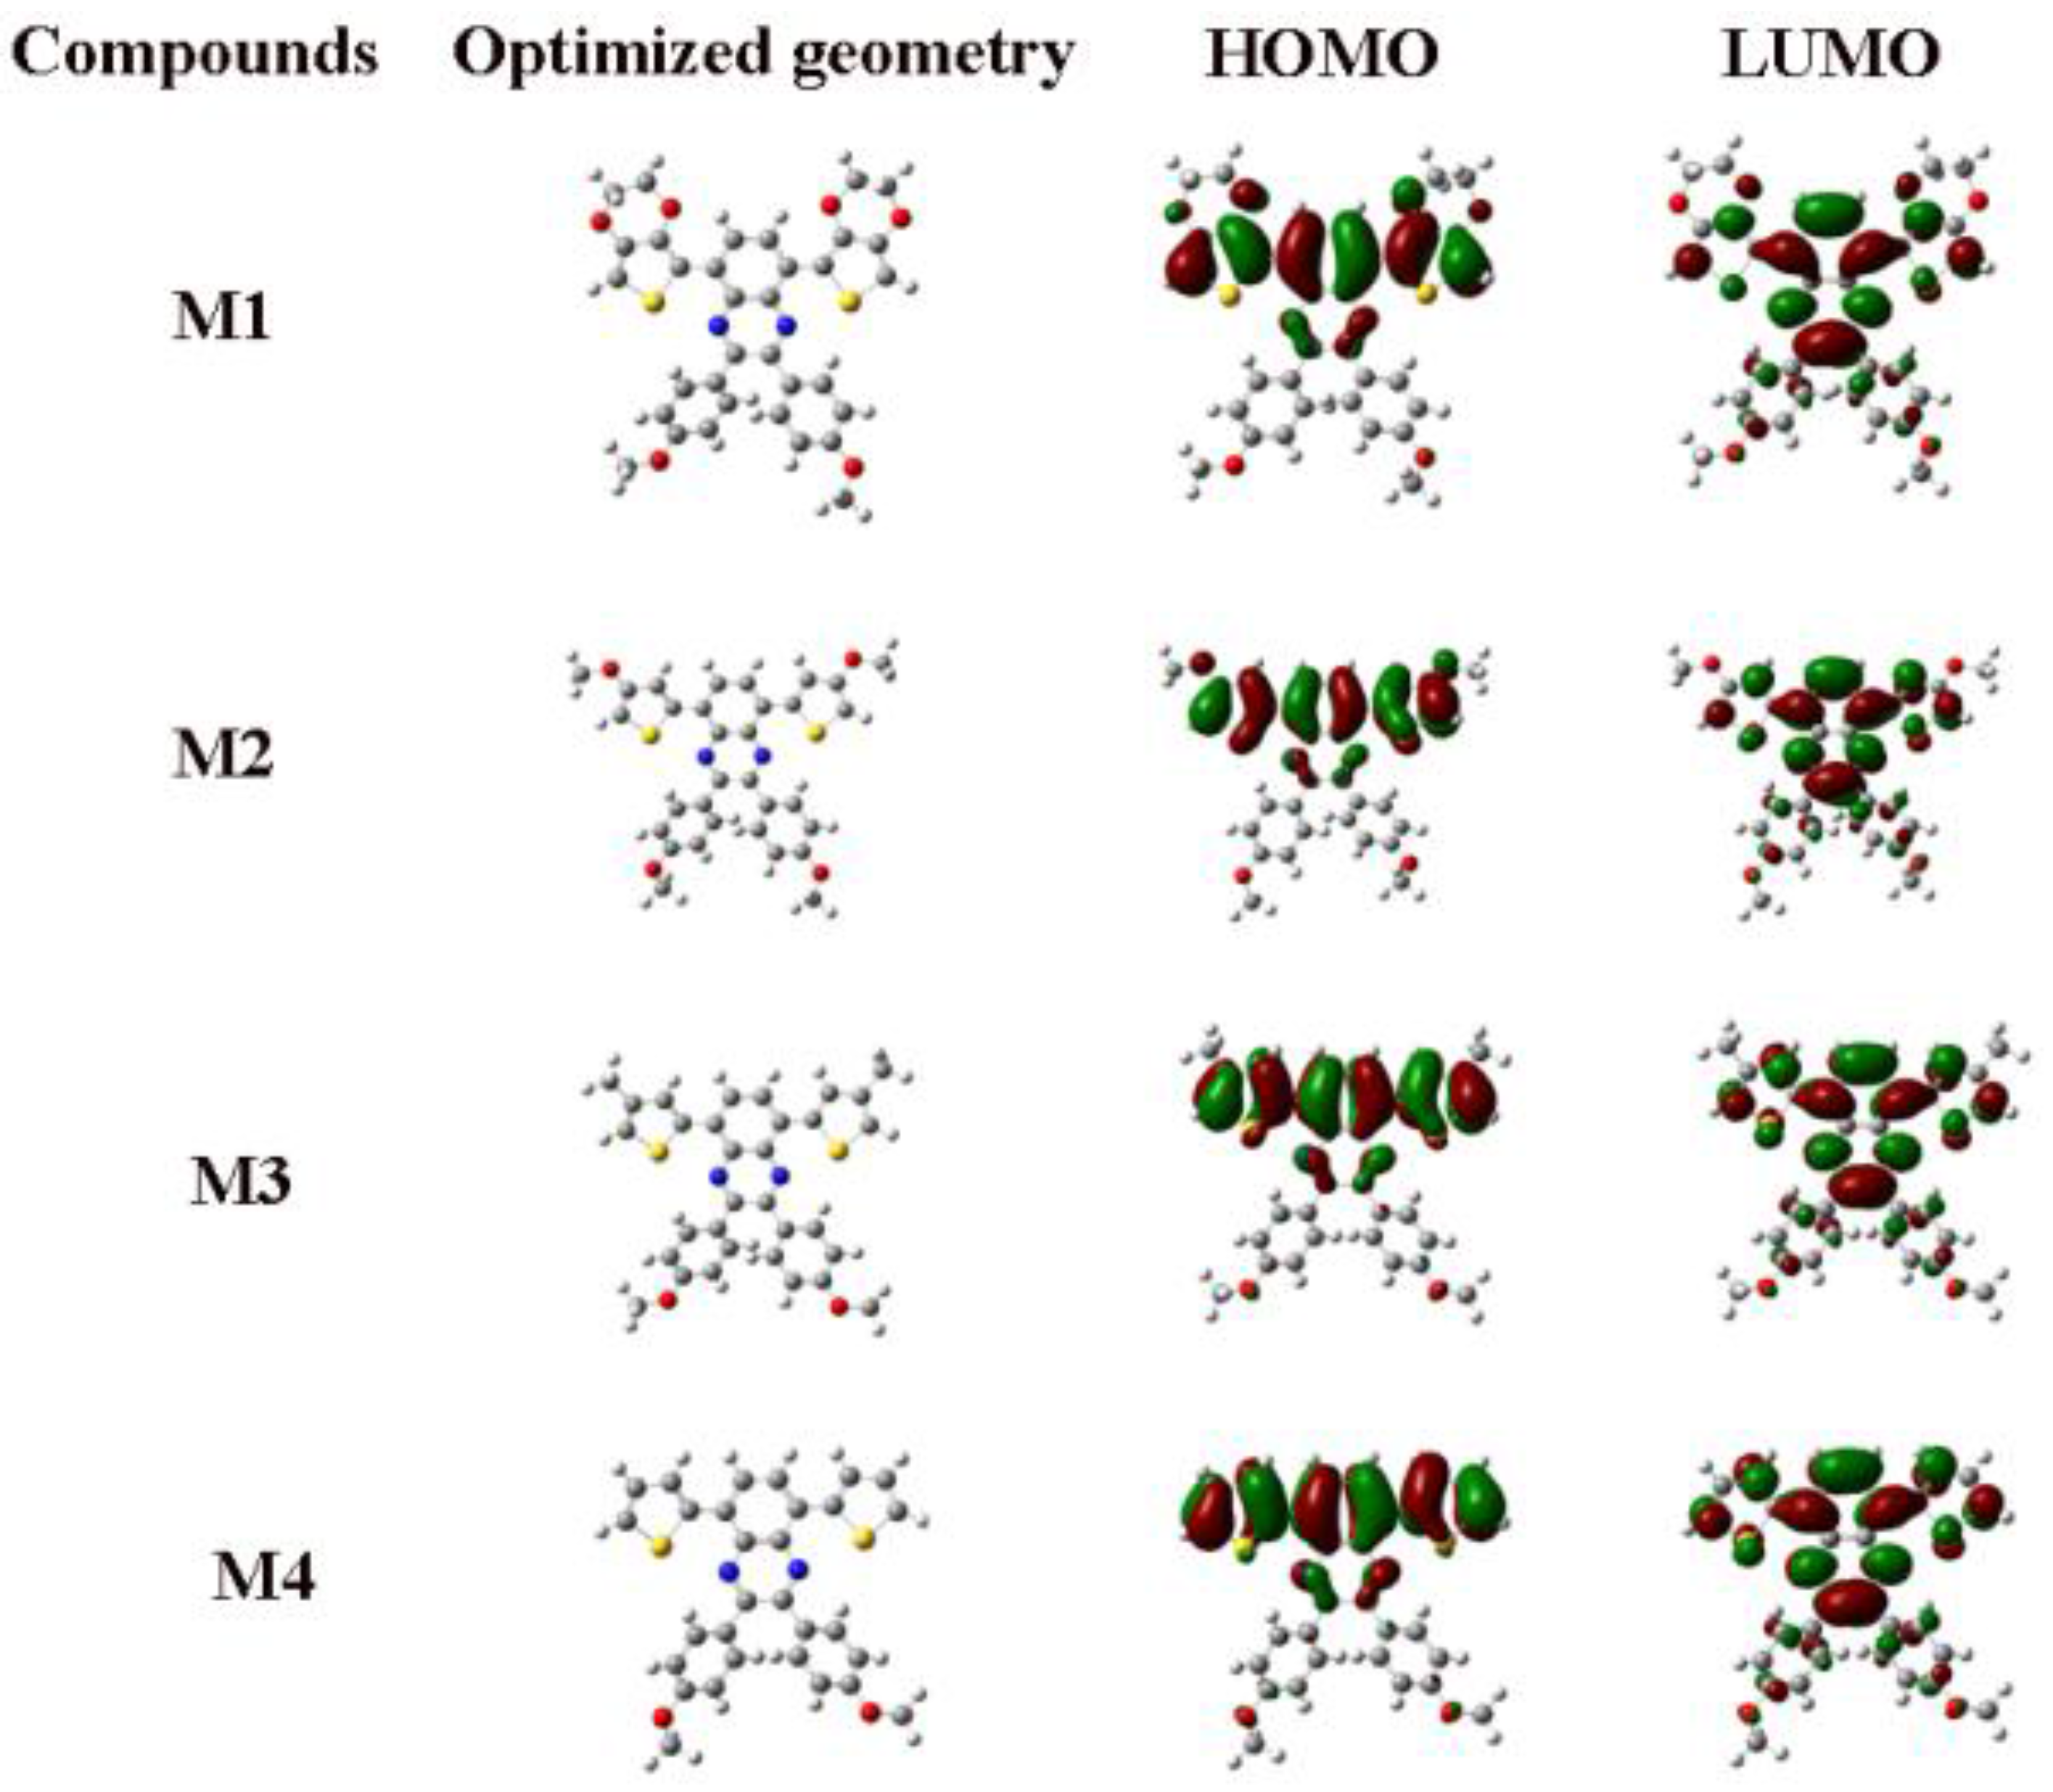
| M1 | 0.77 | 322,461/534 | 2.32 | −5.19 | −2.87 | 2.83 | −5.06 | −2.23 |
| M2 | 0.90 | 310,407/517 | 2.39 | −5.32 | −2.93 | 2.89 | −5.31 | −2.42 |
| M3 | 0.97 | 314,403/511 | 2.42 | −5.39 | −2.97 | 2.94 | −5.31 | −2.37 |
| M4 | 1.05 | 313,403/499 | 2.49 | −5.47 | −2.98 | 2.95 | −5.39 | −2.44 |
| P1 | −0.11 | 427,764/839 | 1.48 | −4.31 | −2.83 | - | - | - |
| P2 | −0.17 | 377,749/915 | 1.36 | −4.25 | −2.89 | - | - | - |
| P3 | 0.06 | 406,679/840 | 1.49 | −4.48 | −2.99 | - | - | - |
| P4 | 0.17 | 362,560/808 | 1.54 | −4.59 | −3.05 | - | - | - |
| PMFTQ e | −0.40 | - | 1.26 | - | - | - | - | - |
| PMFEQ e | −0.18 | - | 1.22 | - | - | - | - | - |
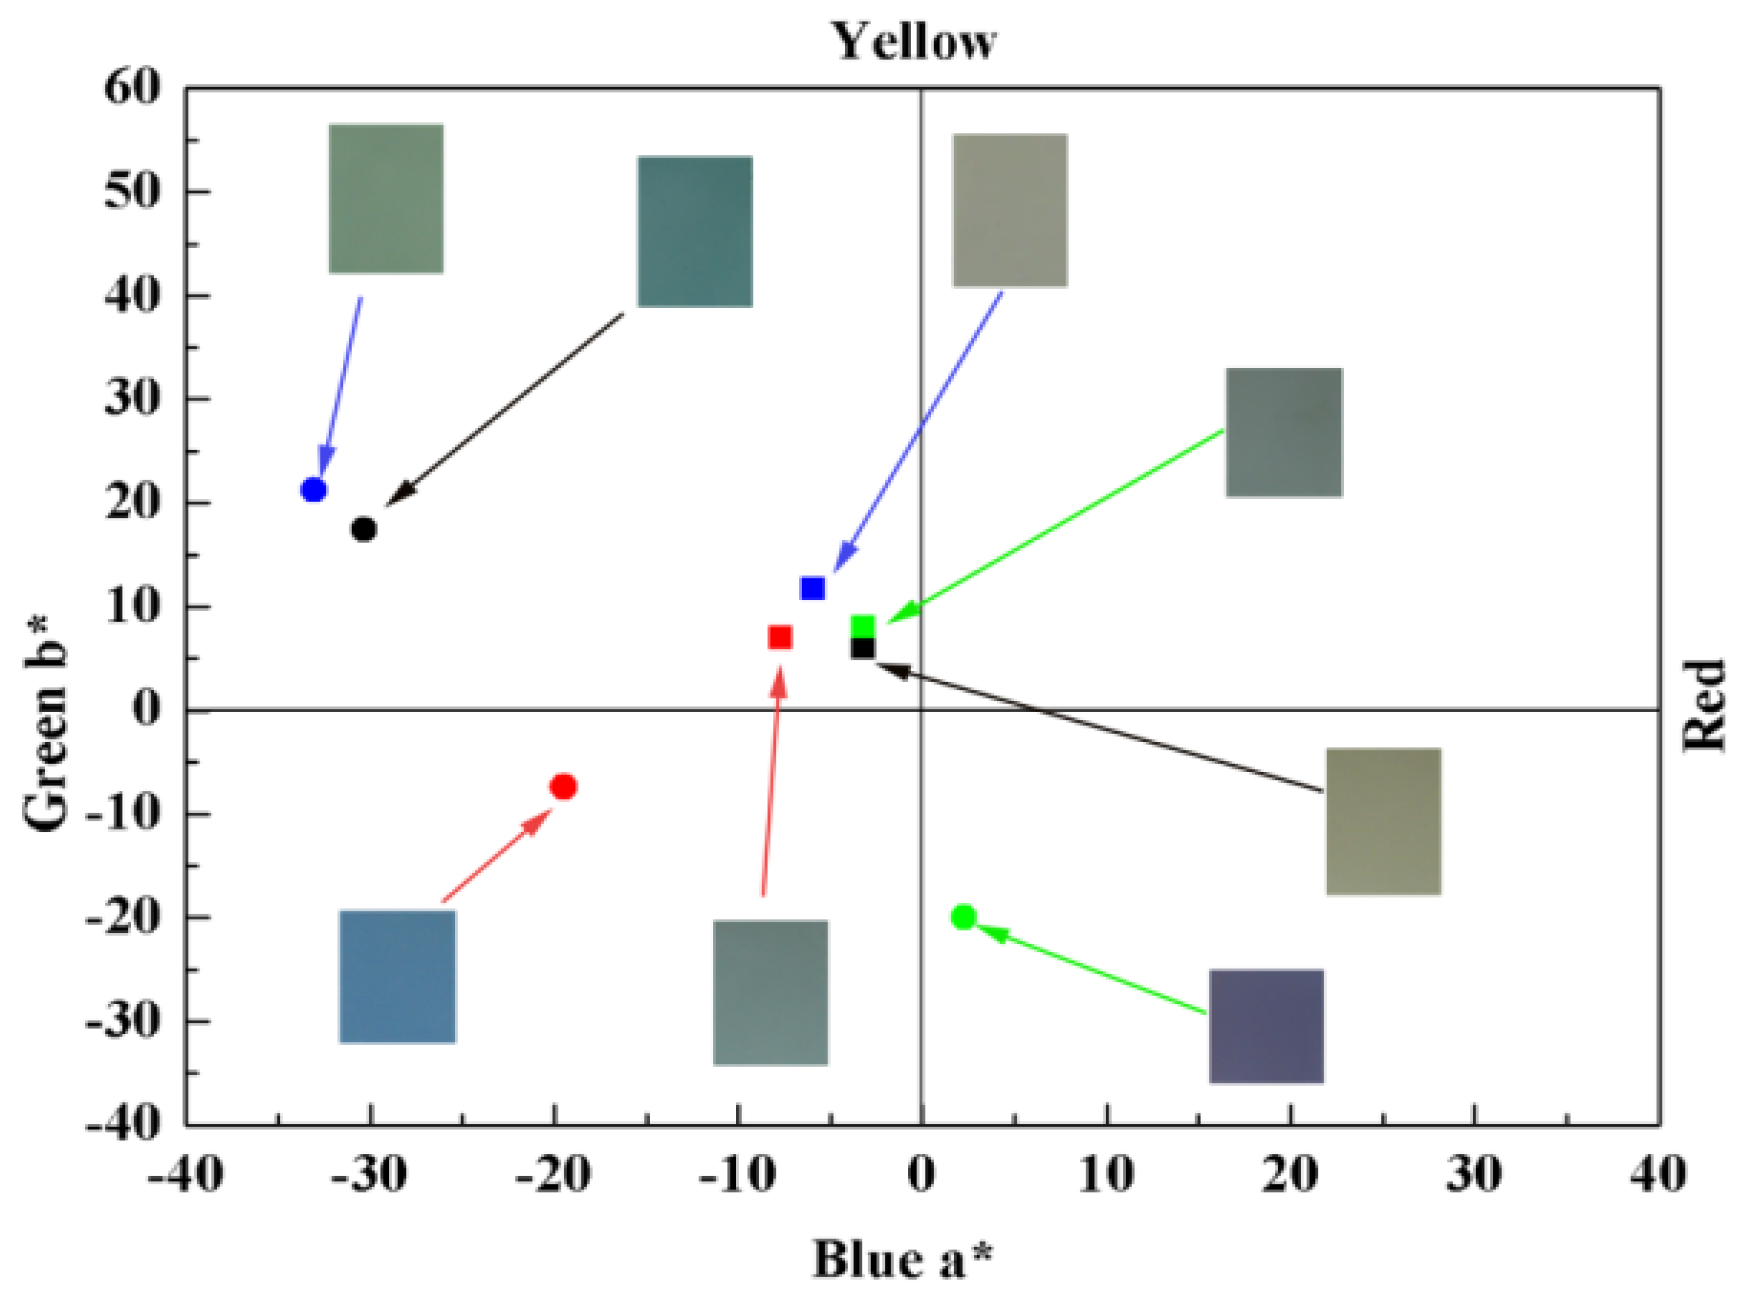
| Polymer | E, vs. (Ag-wire) (V) | CIELAB 1976 (L*a*b*) | CIE 1931 Color coordinates | ||
|---|---|---|---|---|---|
| L* | a* | b* | |||
| P1 | −0.8 | 78.76 | −30.32 | 17.42 | x = 0. 30; y = 0.40 |
| 0 | 82.58 | −14.93 | 10.26 | x = 0. 31; y = 0.36 | |
| 1.1 | 87.35 | −3.17 | 5.97 | x = 0.32; y = 0.34 | |
| P2 | −0.5 | 61.81 | −33.03 | 21.24 | x = 0.30; y = 0.43 |
| 0.5 | 67.30 | −12.22 | 15.04 | x = 0.32; y = 0.38 | |
| 1.05 | 68.26 | −5.88 | 11.69 | x = 0.33; y = 0.36 | |
| P3 | −0.5 | 64.92 | −19.46 | −7.40 | x = 0.26; y = 0.33 |
| 0.5 | 71.36 | −12.22 | 3.10 | x = 0.30; y = 0.35 | |
| 1.1 | 75.89 | −7.69 | 6.92 | x = 0.31; y = 0.36 | |
| P4 | −0.5 | 46.88 | 2.26 | −20.01 | x = 0.26; y = 0.27 |
| 0.75 | 64.30 | −6.79 | 5.38 | x = 0.31; y = 0.35 | |
| 1.2 | 68.60 | −3.17 | 7.96 | x = 0.33; y = 0.35 | |
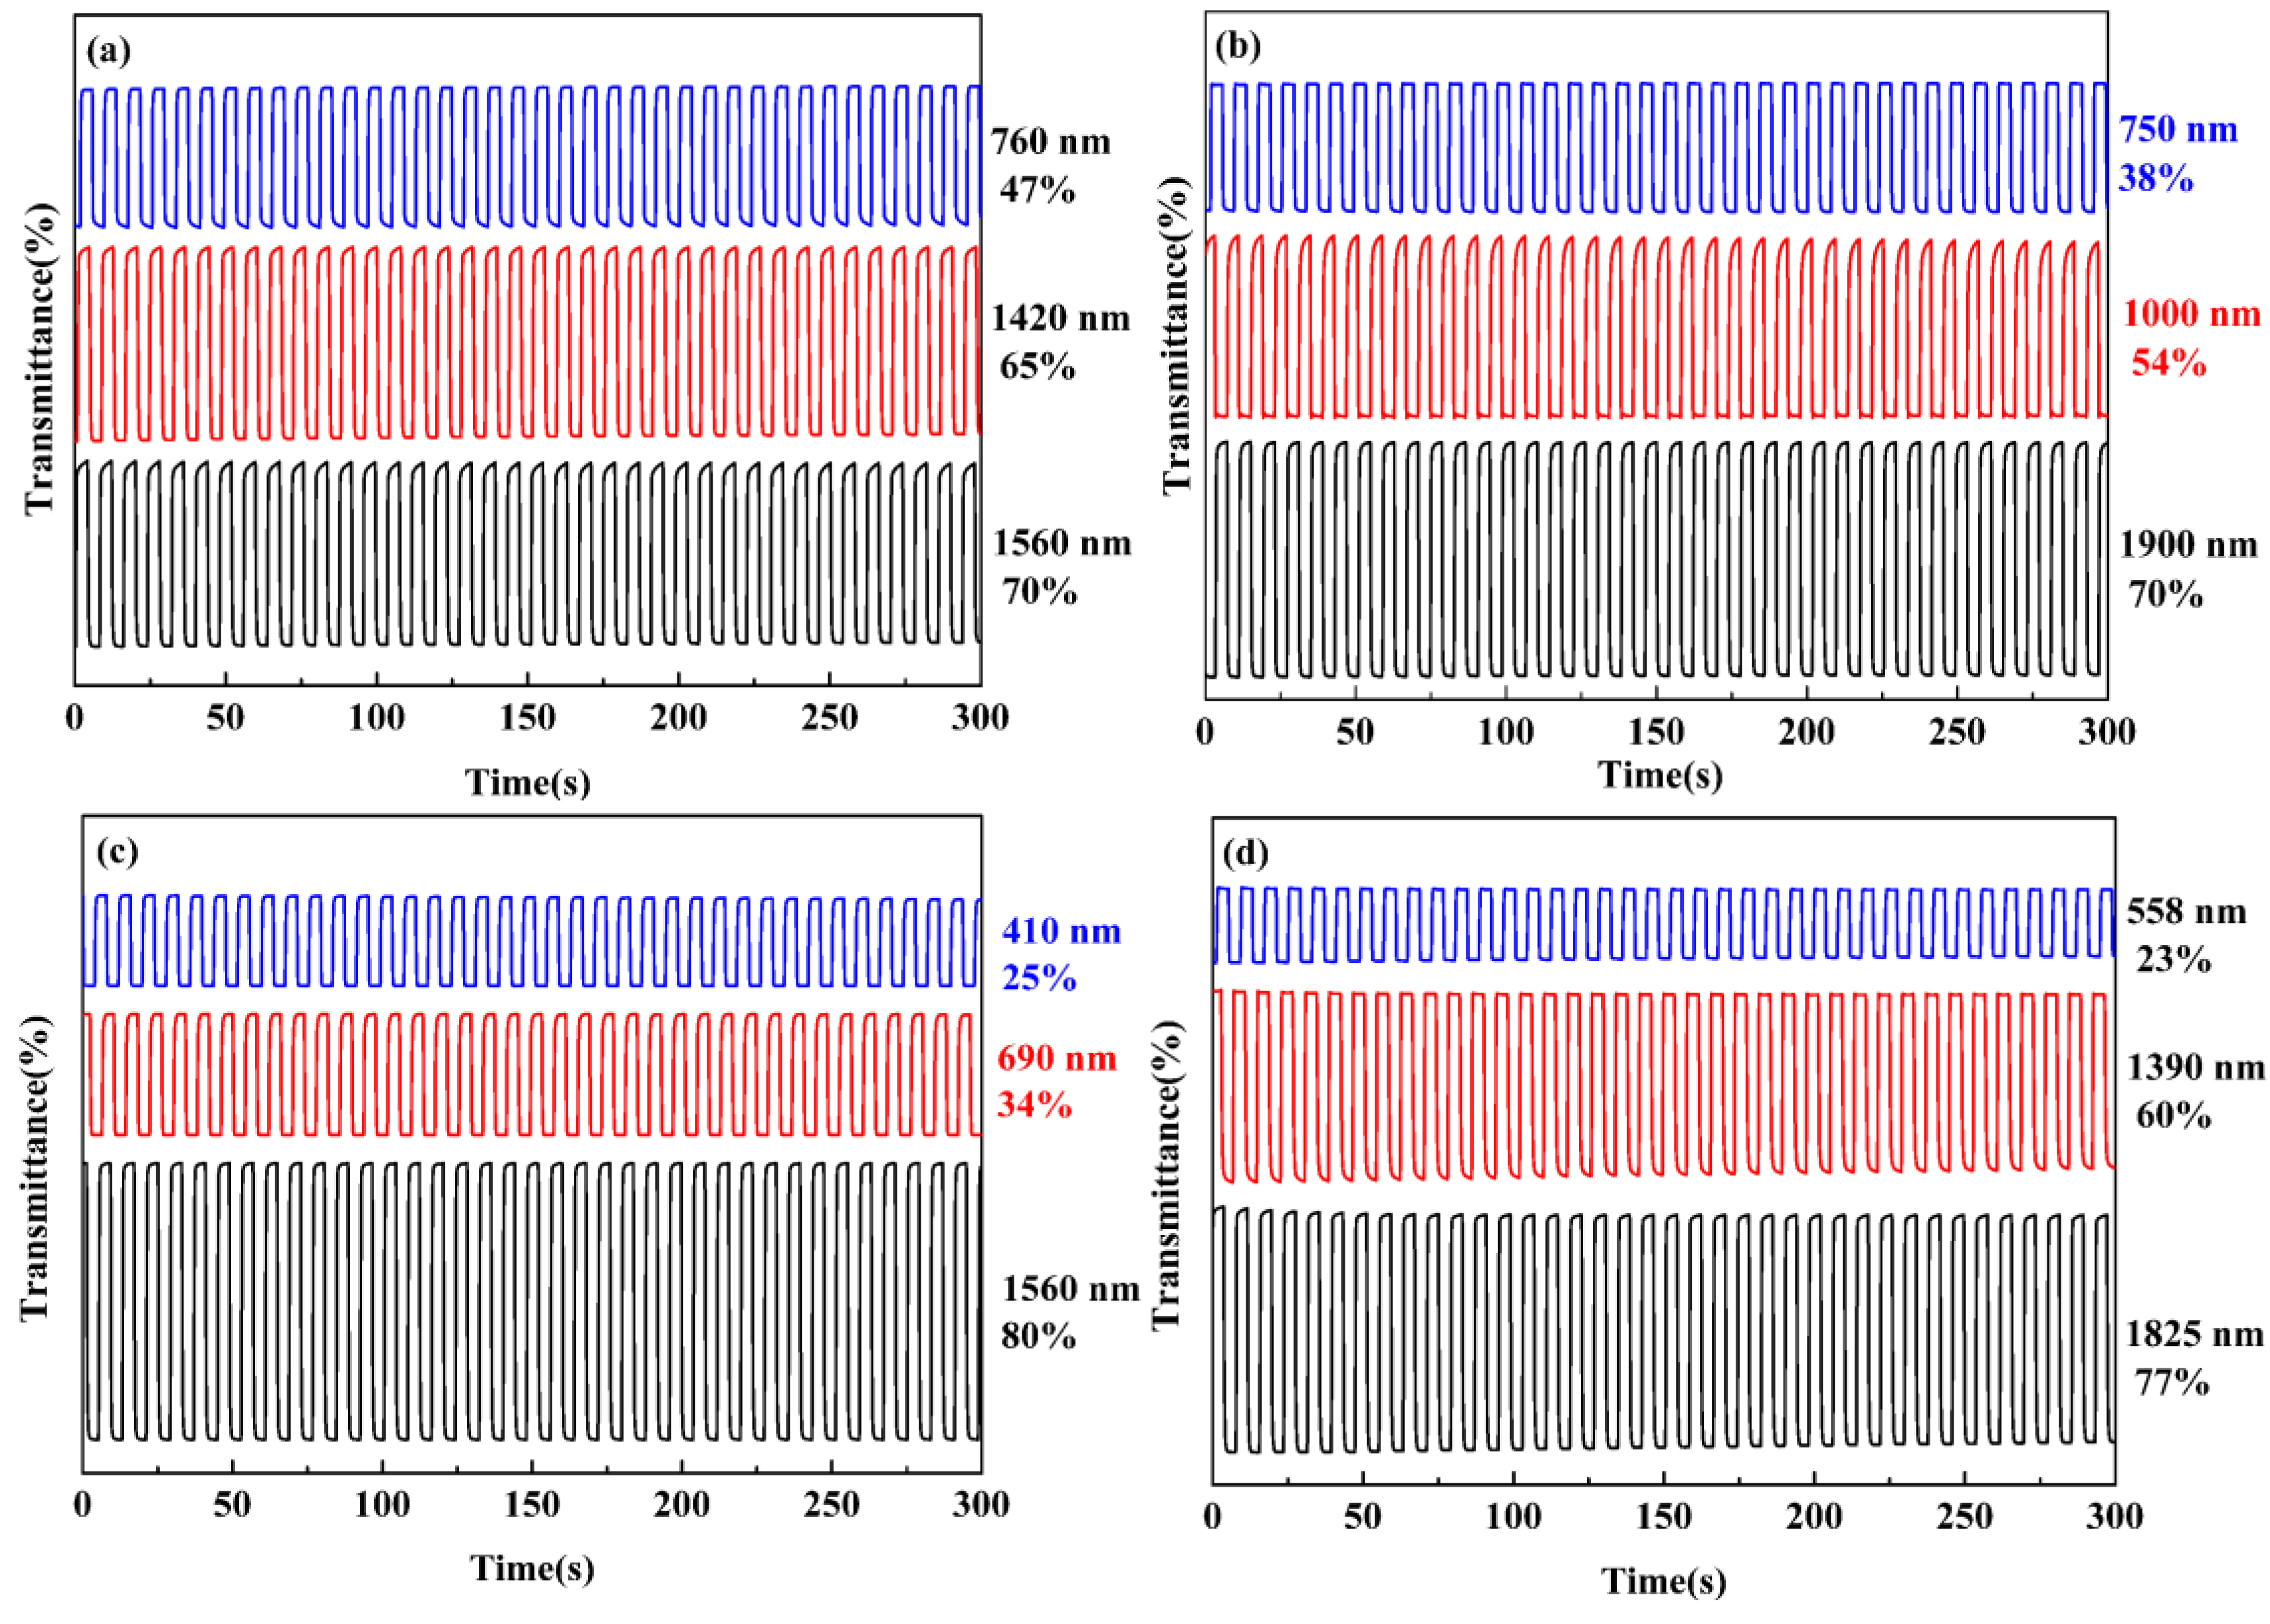
| Compounds | λ (nm) | Optical contrast (ΔT%) | Response time (s) | Coloration efficiency (CE, cm2 C−1) |
|---|---|---|---|---|
| P1 | 760 | 47 | 0.24 | 264.7 |
| 1420 | 65 | 1.21 | 247.6 | |
| 1560 | 70 | 0.60 | 300.0 | |
| P2 | 750 | 38 | 1.00 | 185.4 |
| 1000 | 54 | 0.80 | 135.3 | |
| 1900 | 70 | 1.80 | 254.4 | |
| P3 | 410 | 25 | 2.32 | 171.3 |
| 690 | 34 | 3.00 | 252.8 | |
| 1560 | 80 | 0.83 | 350.0 | |
| P4 | 558 | 23 | 0.34 | 102.1 |
| 1390 | 60 | 0.83 | 243.4 | |
| 1825 | 77 | 0.84 | 210.6 | |
| PMFTQ a | 560 | 18 | 1.6 | - |
| 790 | 60 | 1.4 | - | |
| 1300 | 80 | 1.8 | - | |
| PMFEQ a | 443 | 22 | 0.8 | - |
| 780 | 28 | 0.7 | - | |
| 1600 | 76 | 1.0 | - |
© 2017 by the authors. Licensee MDPI, Basel, Switzerland. This article is an open access article distributed under the terms and conditions of the Creative Commons Attribution (CC BY) license (http://creativecommons.org/licenses/by/4.0/).
Share and Cite
Kong, L.; Wang, M.; Ju, X.; Zhao, J.; Zhang, Y.; Xie, Y. The Availability of Neutral Cyan, Green, Blue and Purple Colors from Simple D–A Type Polymers with Commercially Available Thiophene Derivatives as the Donor Units. Polymers 2017, 9, 656. https://doi.org/10.3390/polym9120656
Kong L, Wang M, Ju X, Zhao J, Zhang Y, Xie Y. The Availability of Neutral Cyan, Green, Blue and Purple Colors from Simple D–A Type Polymers with Commercially Available Thiophene Derivatives as the Donor Units. Polymers. 2017; 9(12):656. https://doi.org/10.3390/polym9120656
Chicago/Turabian StyleKong, Lingqian, Min Wang, Xiuping Ju, Jinsheng Zhao, Yan Zhang, and Yu Xie. 2017. "The Availability of Neutral Cyan, Green, Blue and Purple Colors from Simple D–A Type Polymers with Commercially Available Thiophene Derivatives as the Donor Units" Polymers 9, no. 12: 656. https://doi.org/10.3390/polym9120656