Bacterial Nanocellulose from Side-Streams of Kombucha Beverages Production: Preparation and Physical-Chemical Properties

 , , , ,
  , , , ,
Abstract
: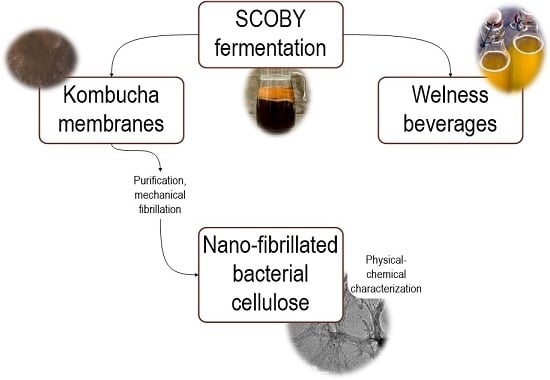
1. Introduction
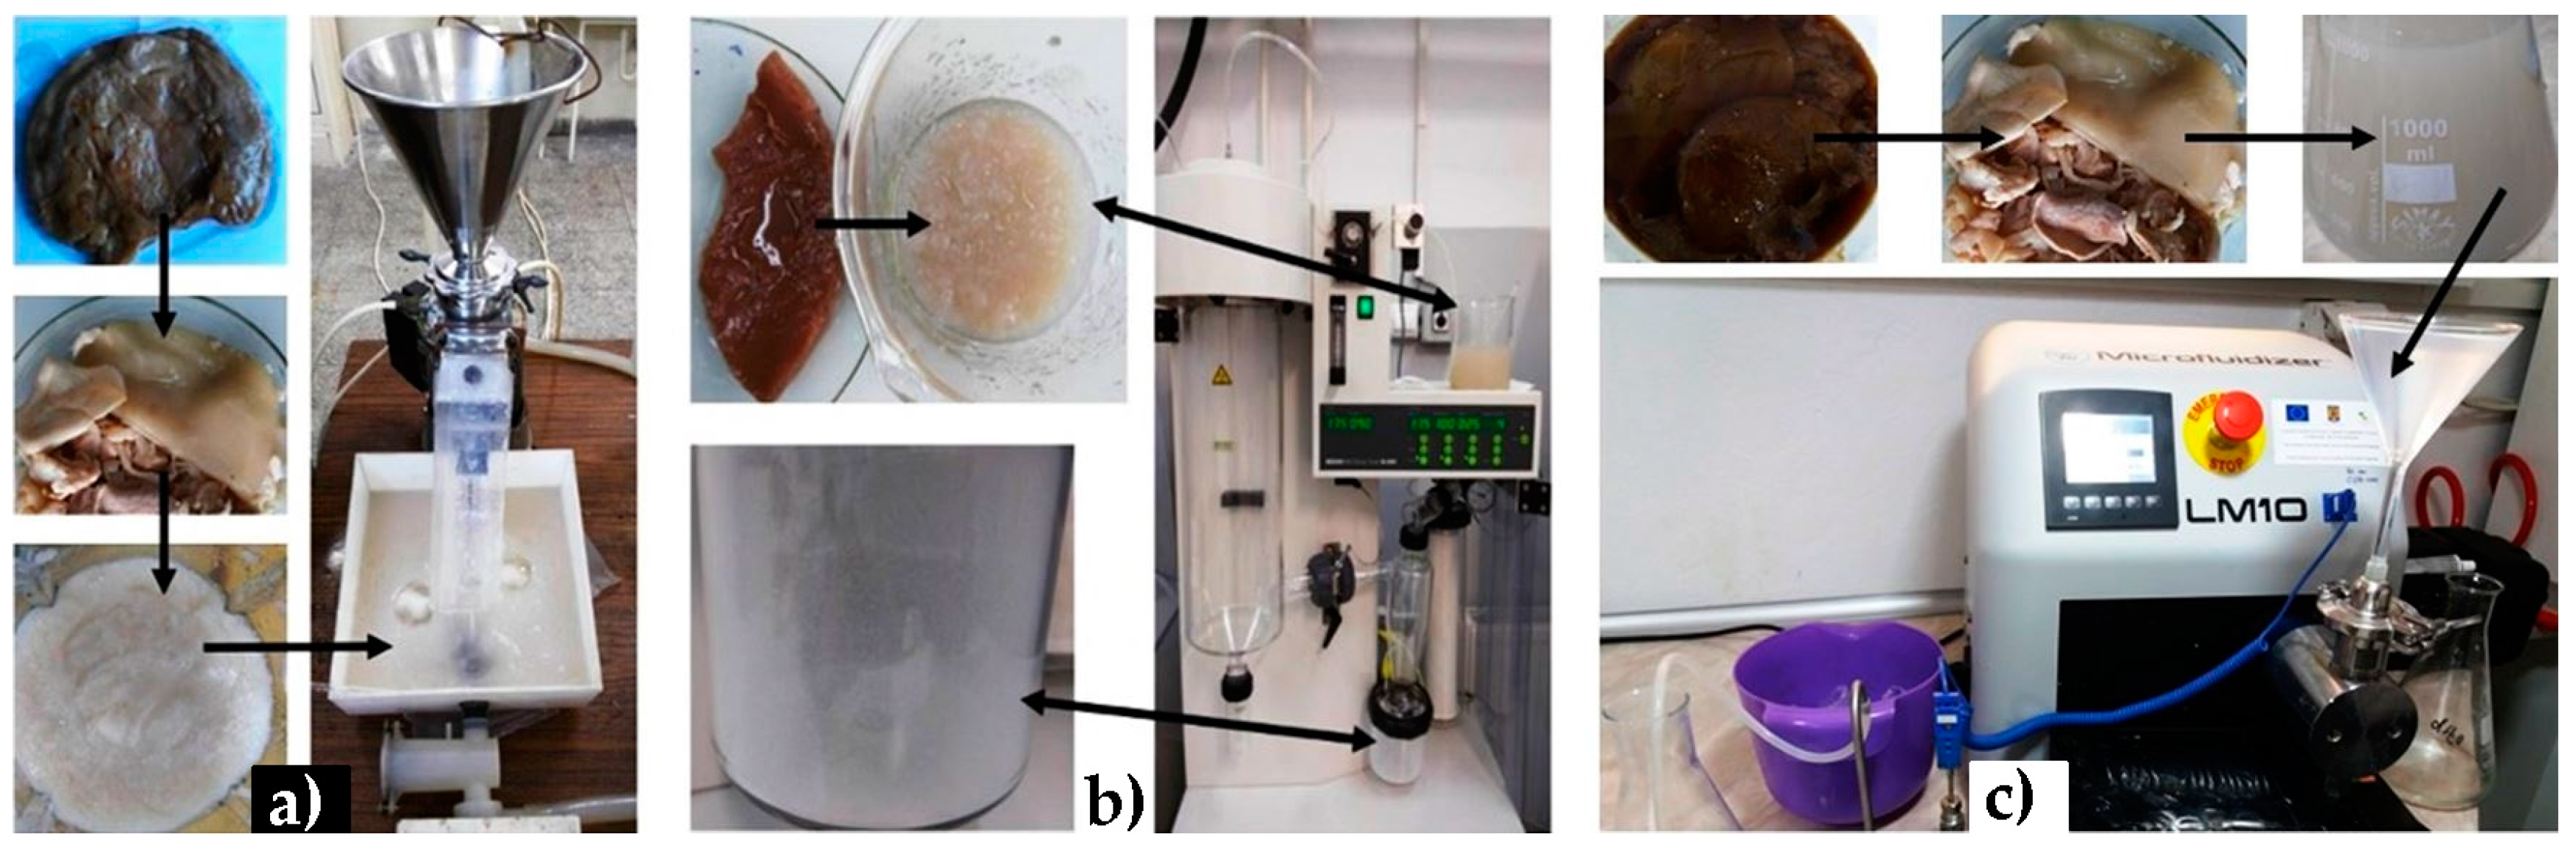
2. Materials and Methods
3. Results
3.1. Purification of Kombucha Membranes
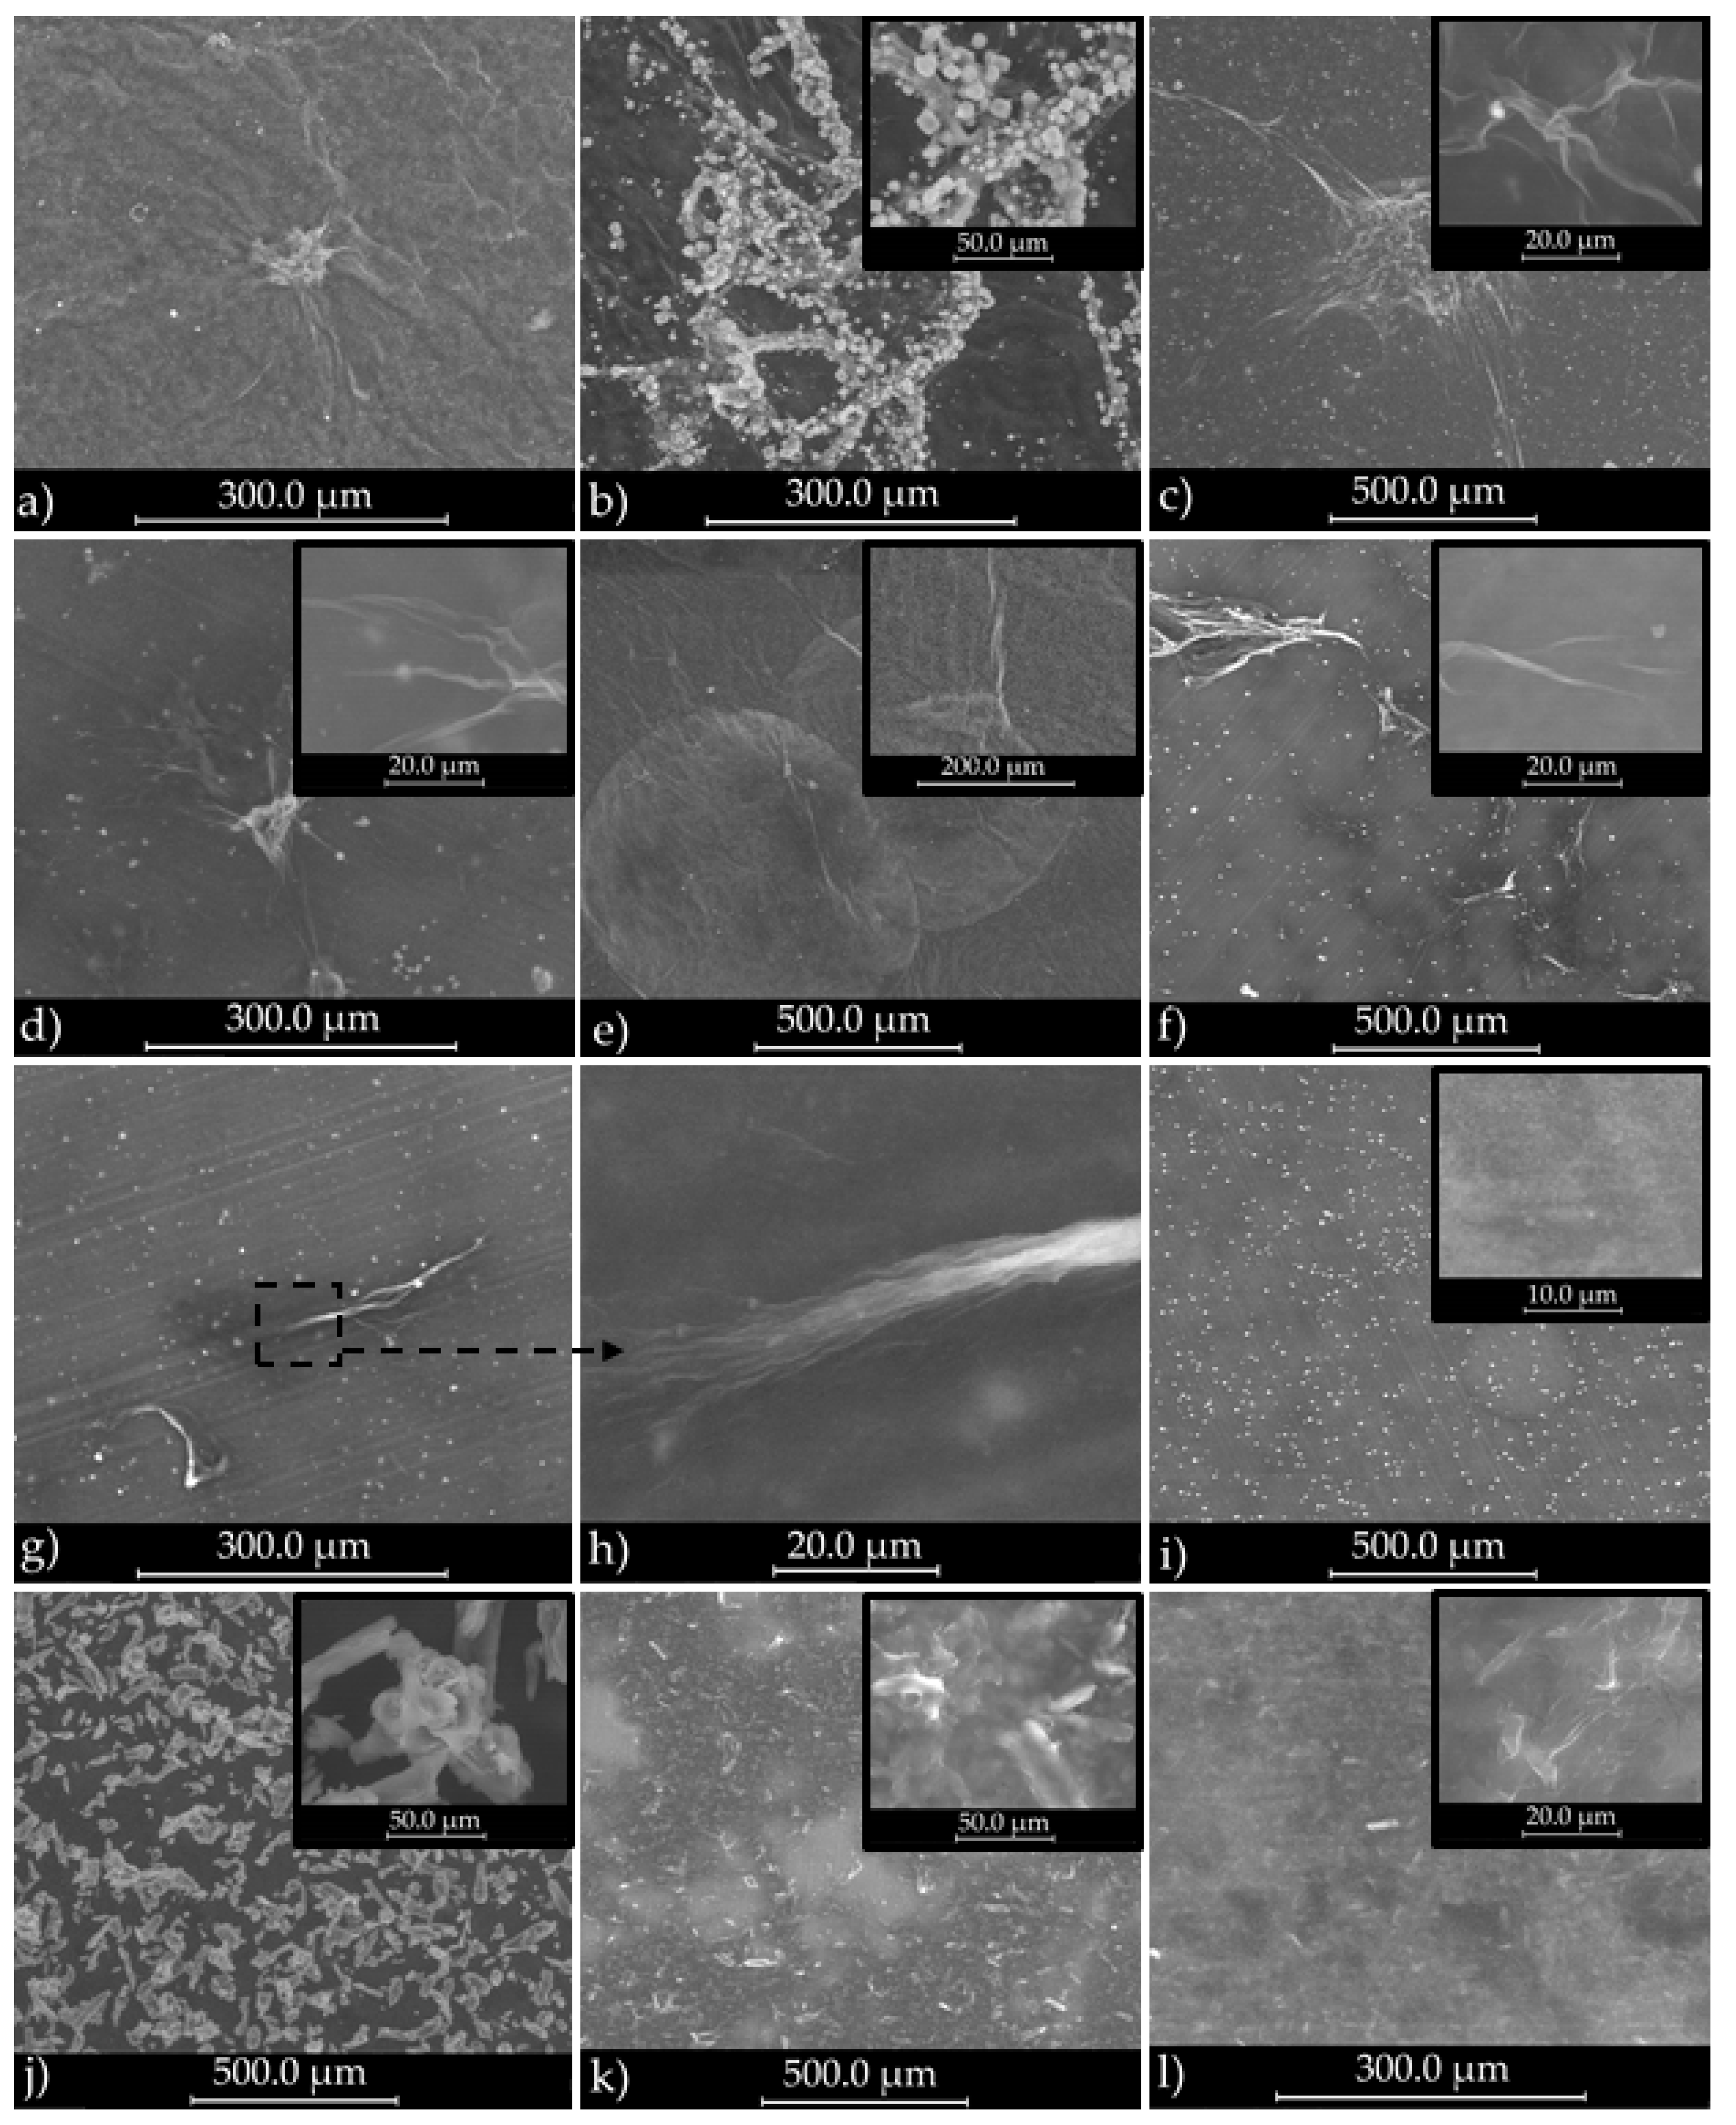
3.1.1. SEM Analysis
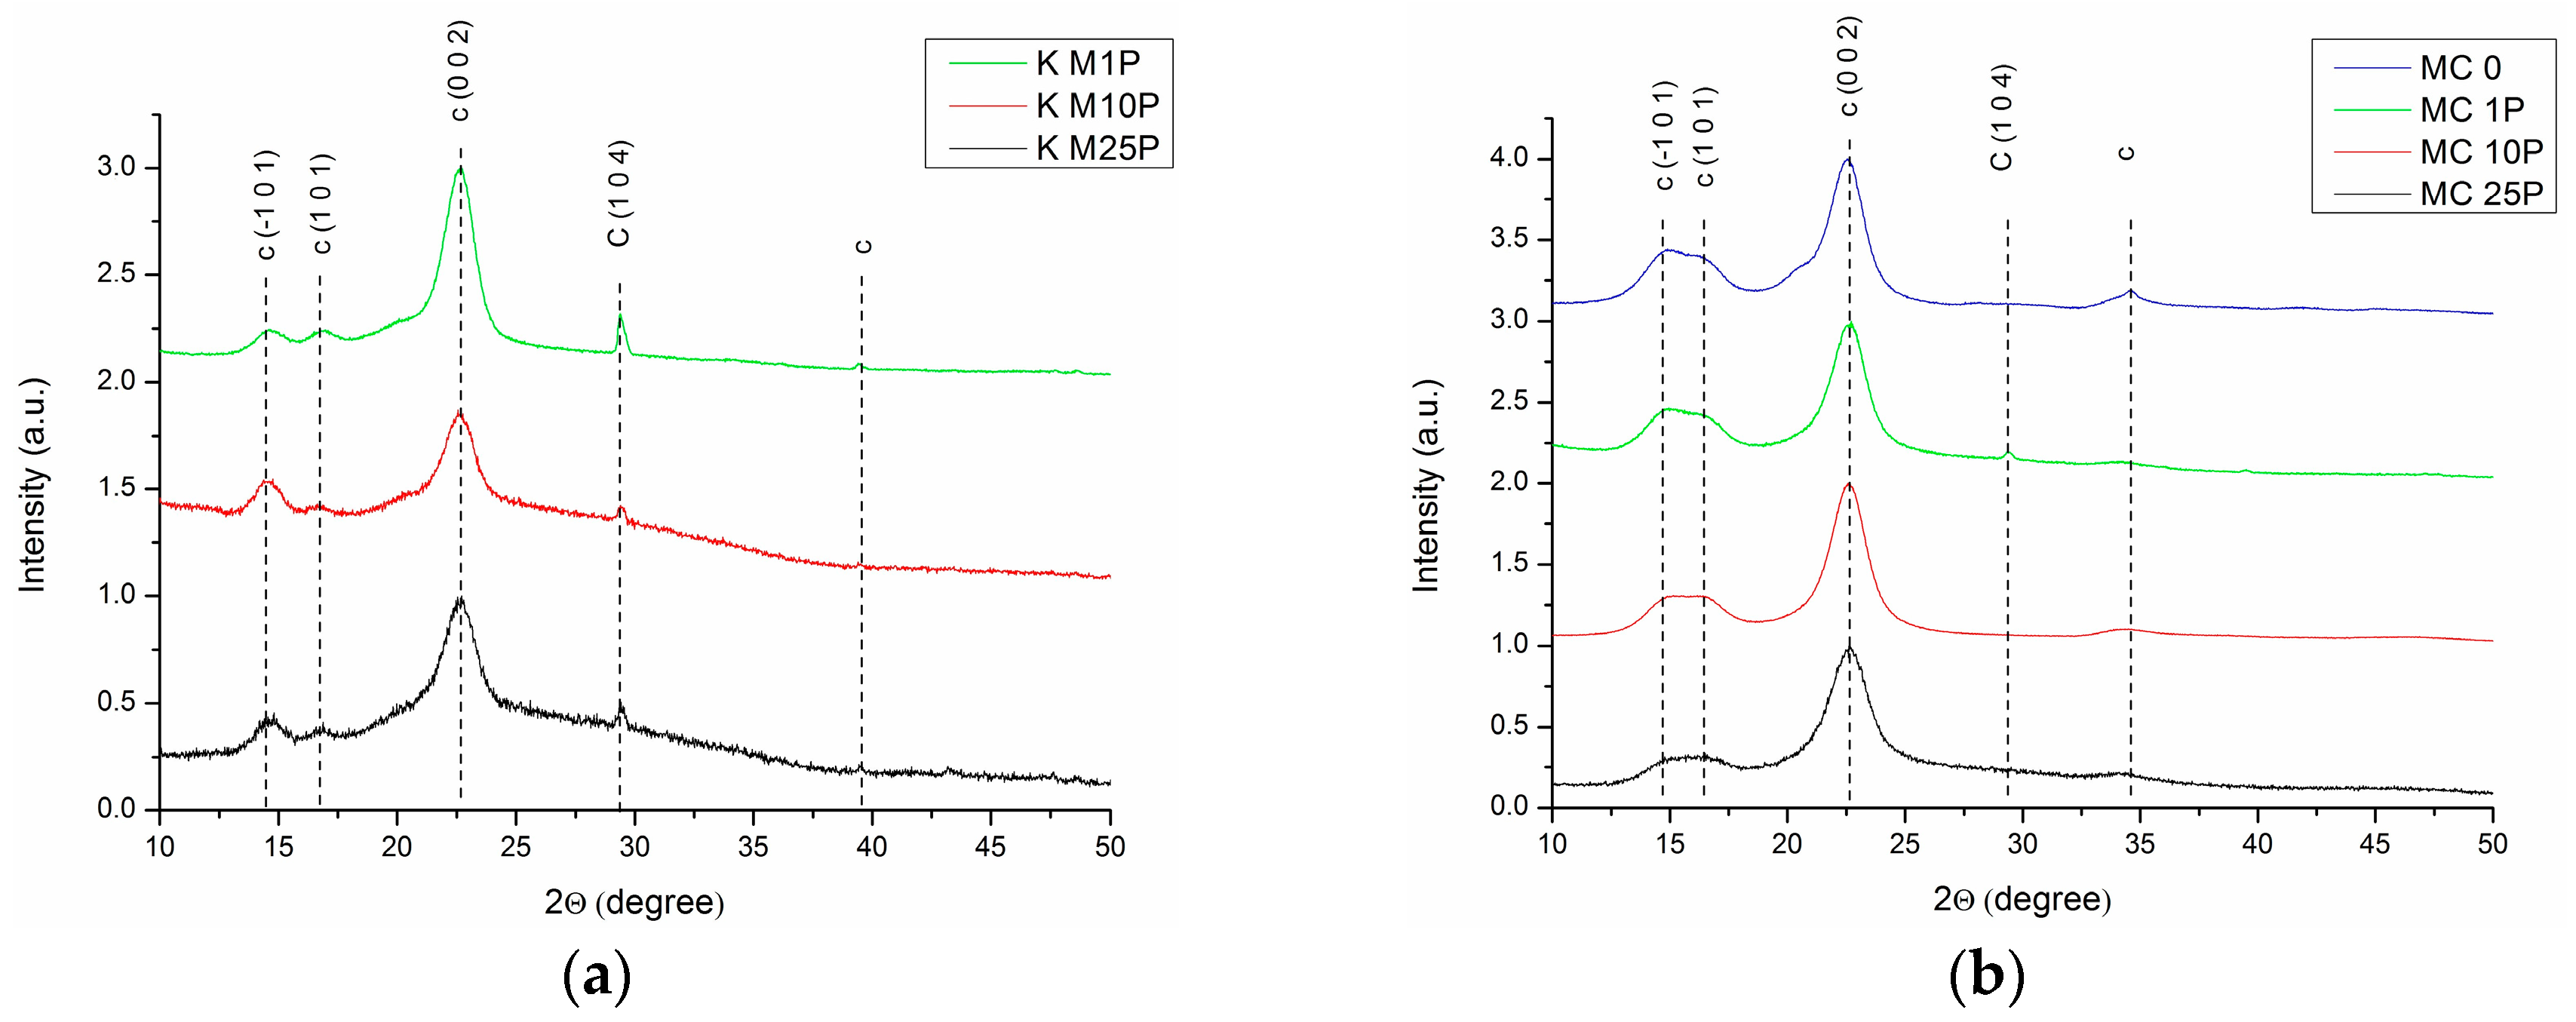
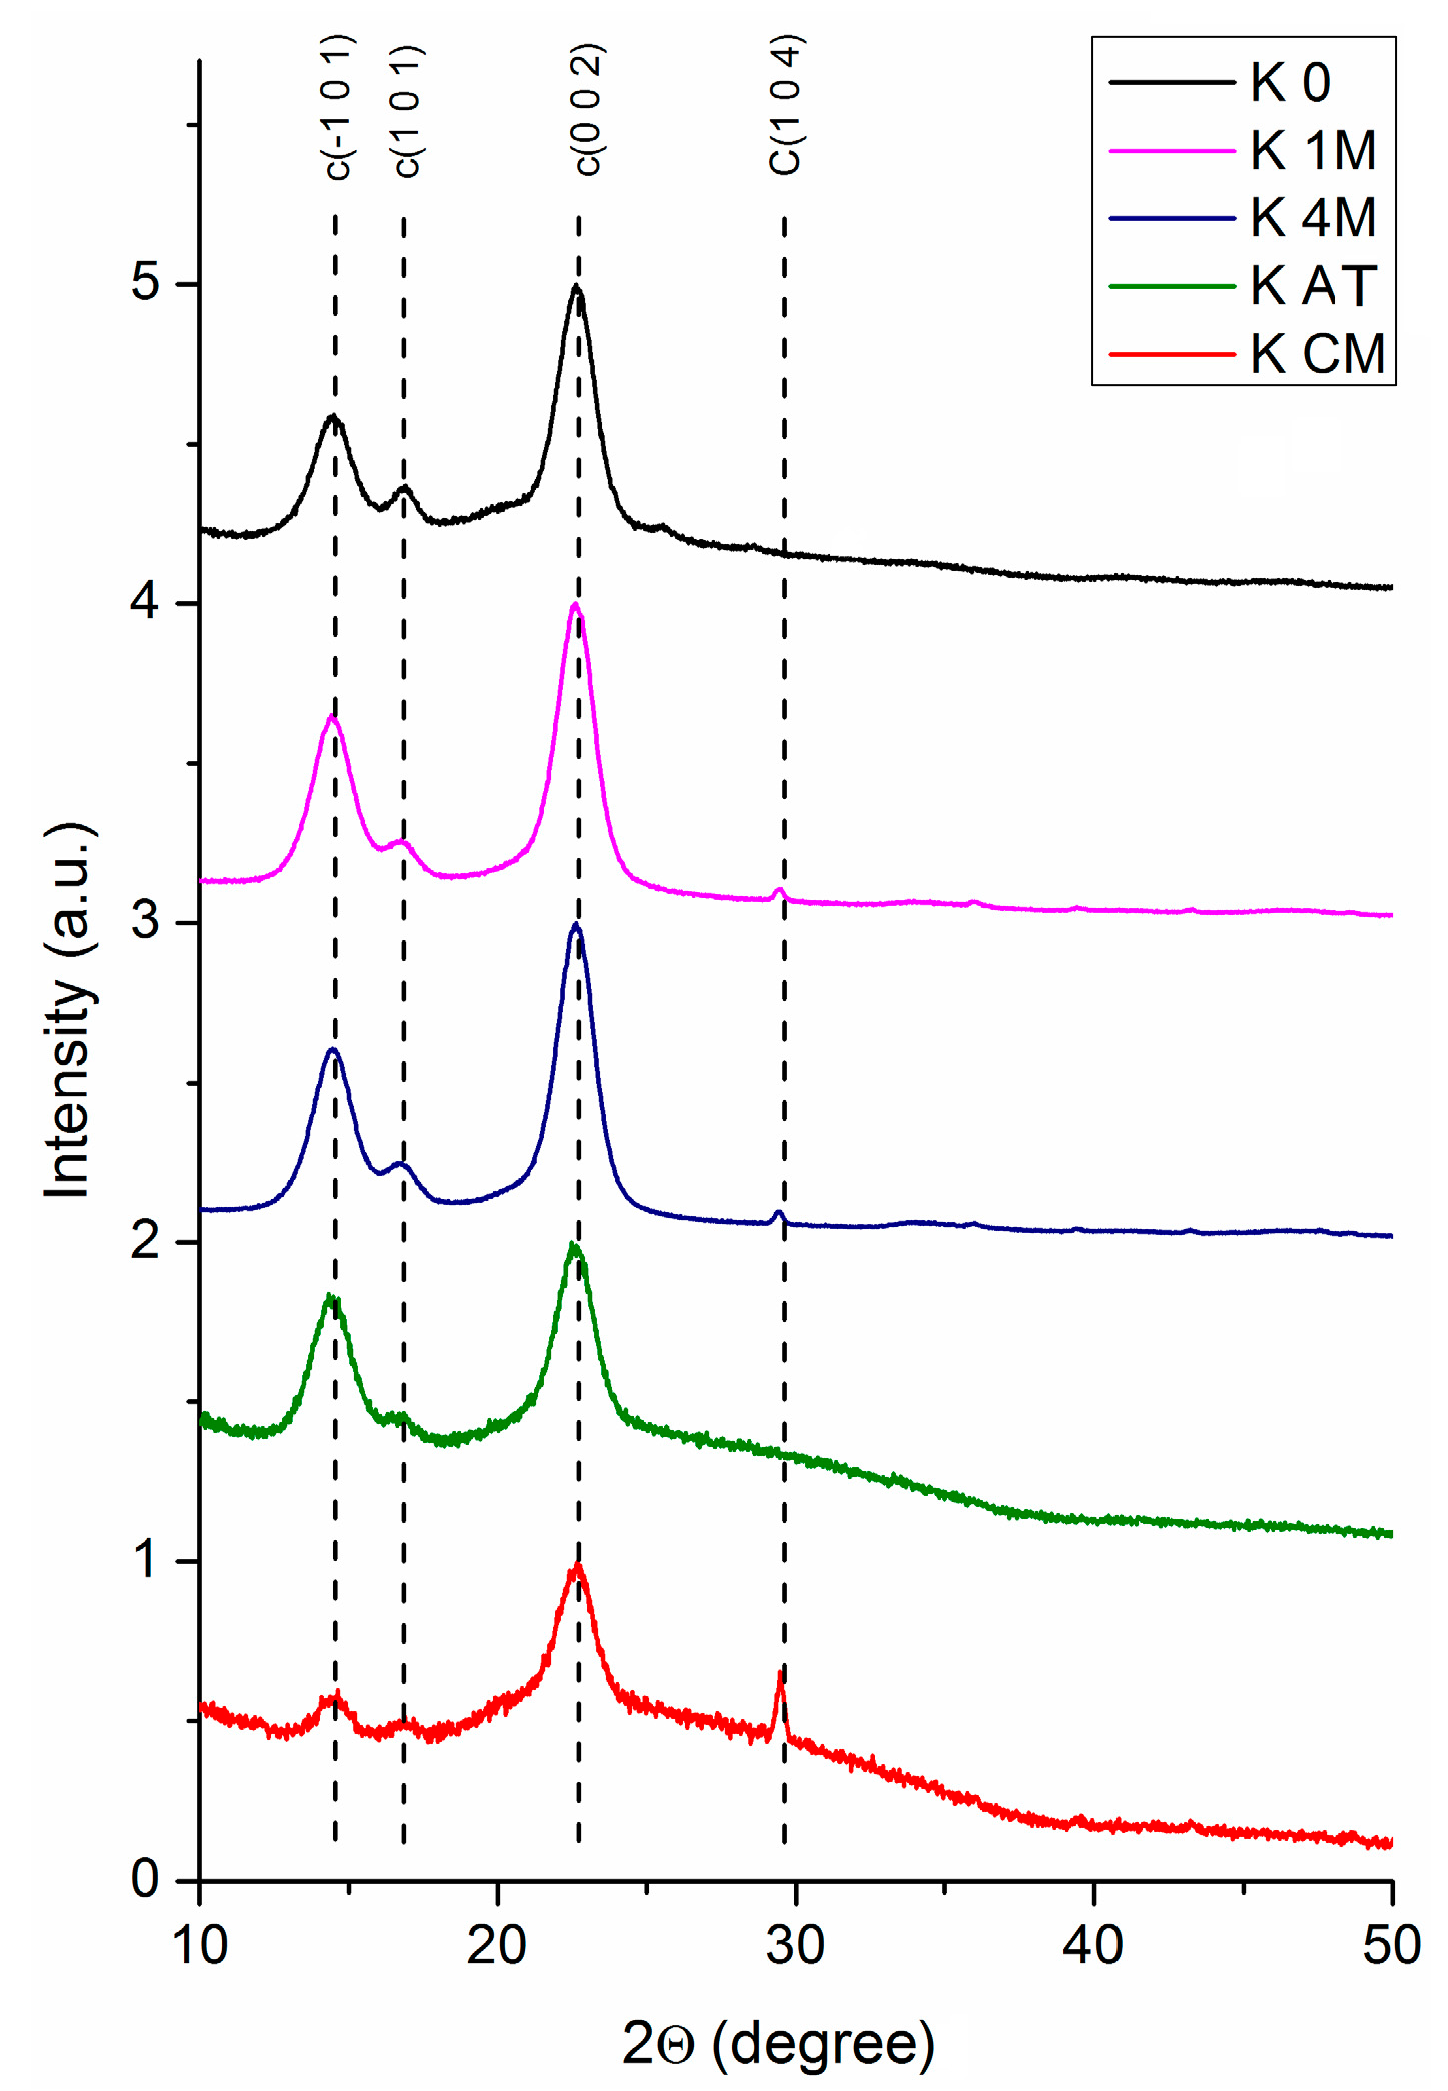
3.1.2. XRD Analysis
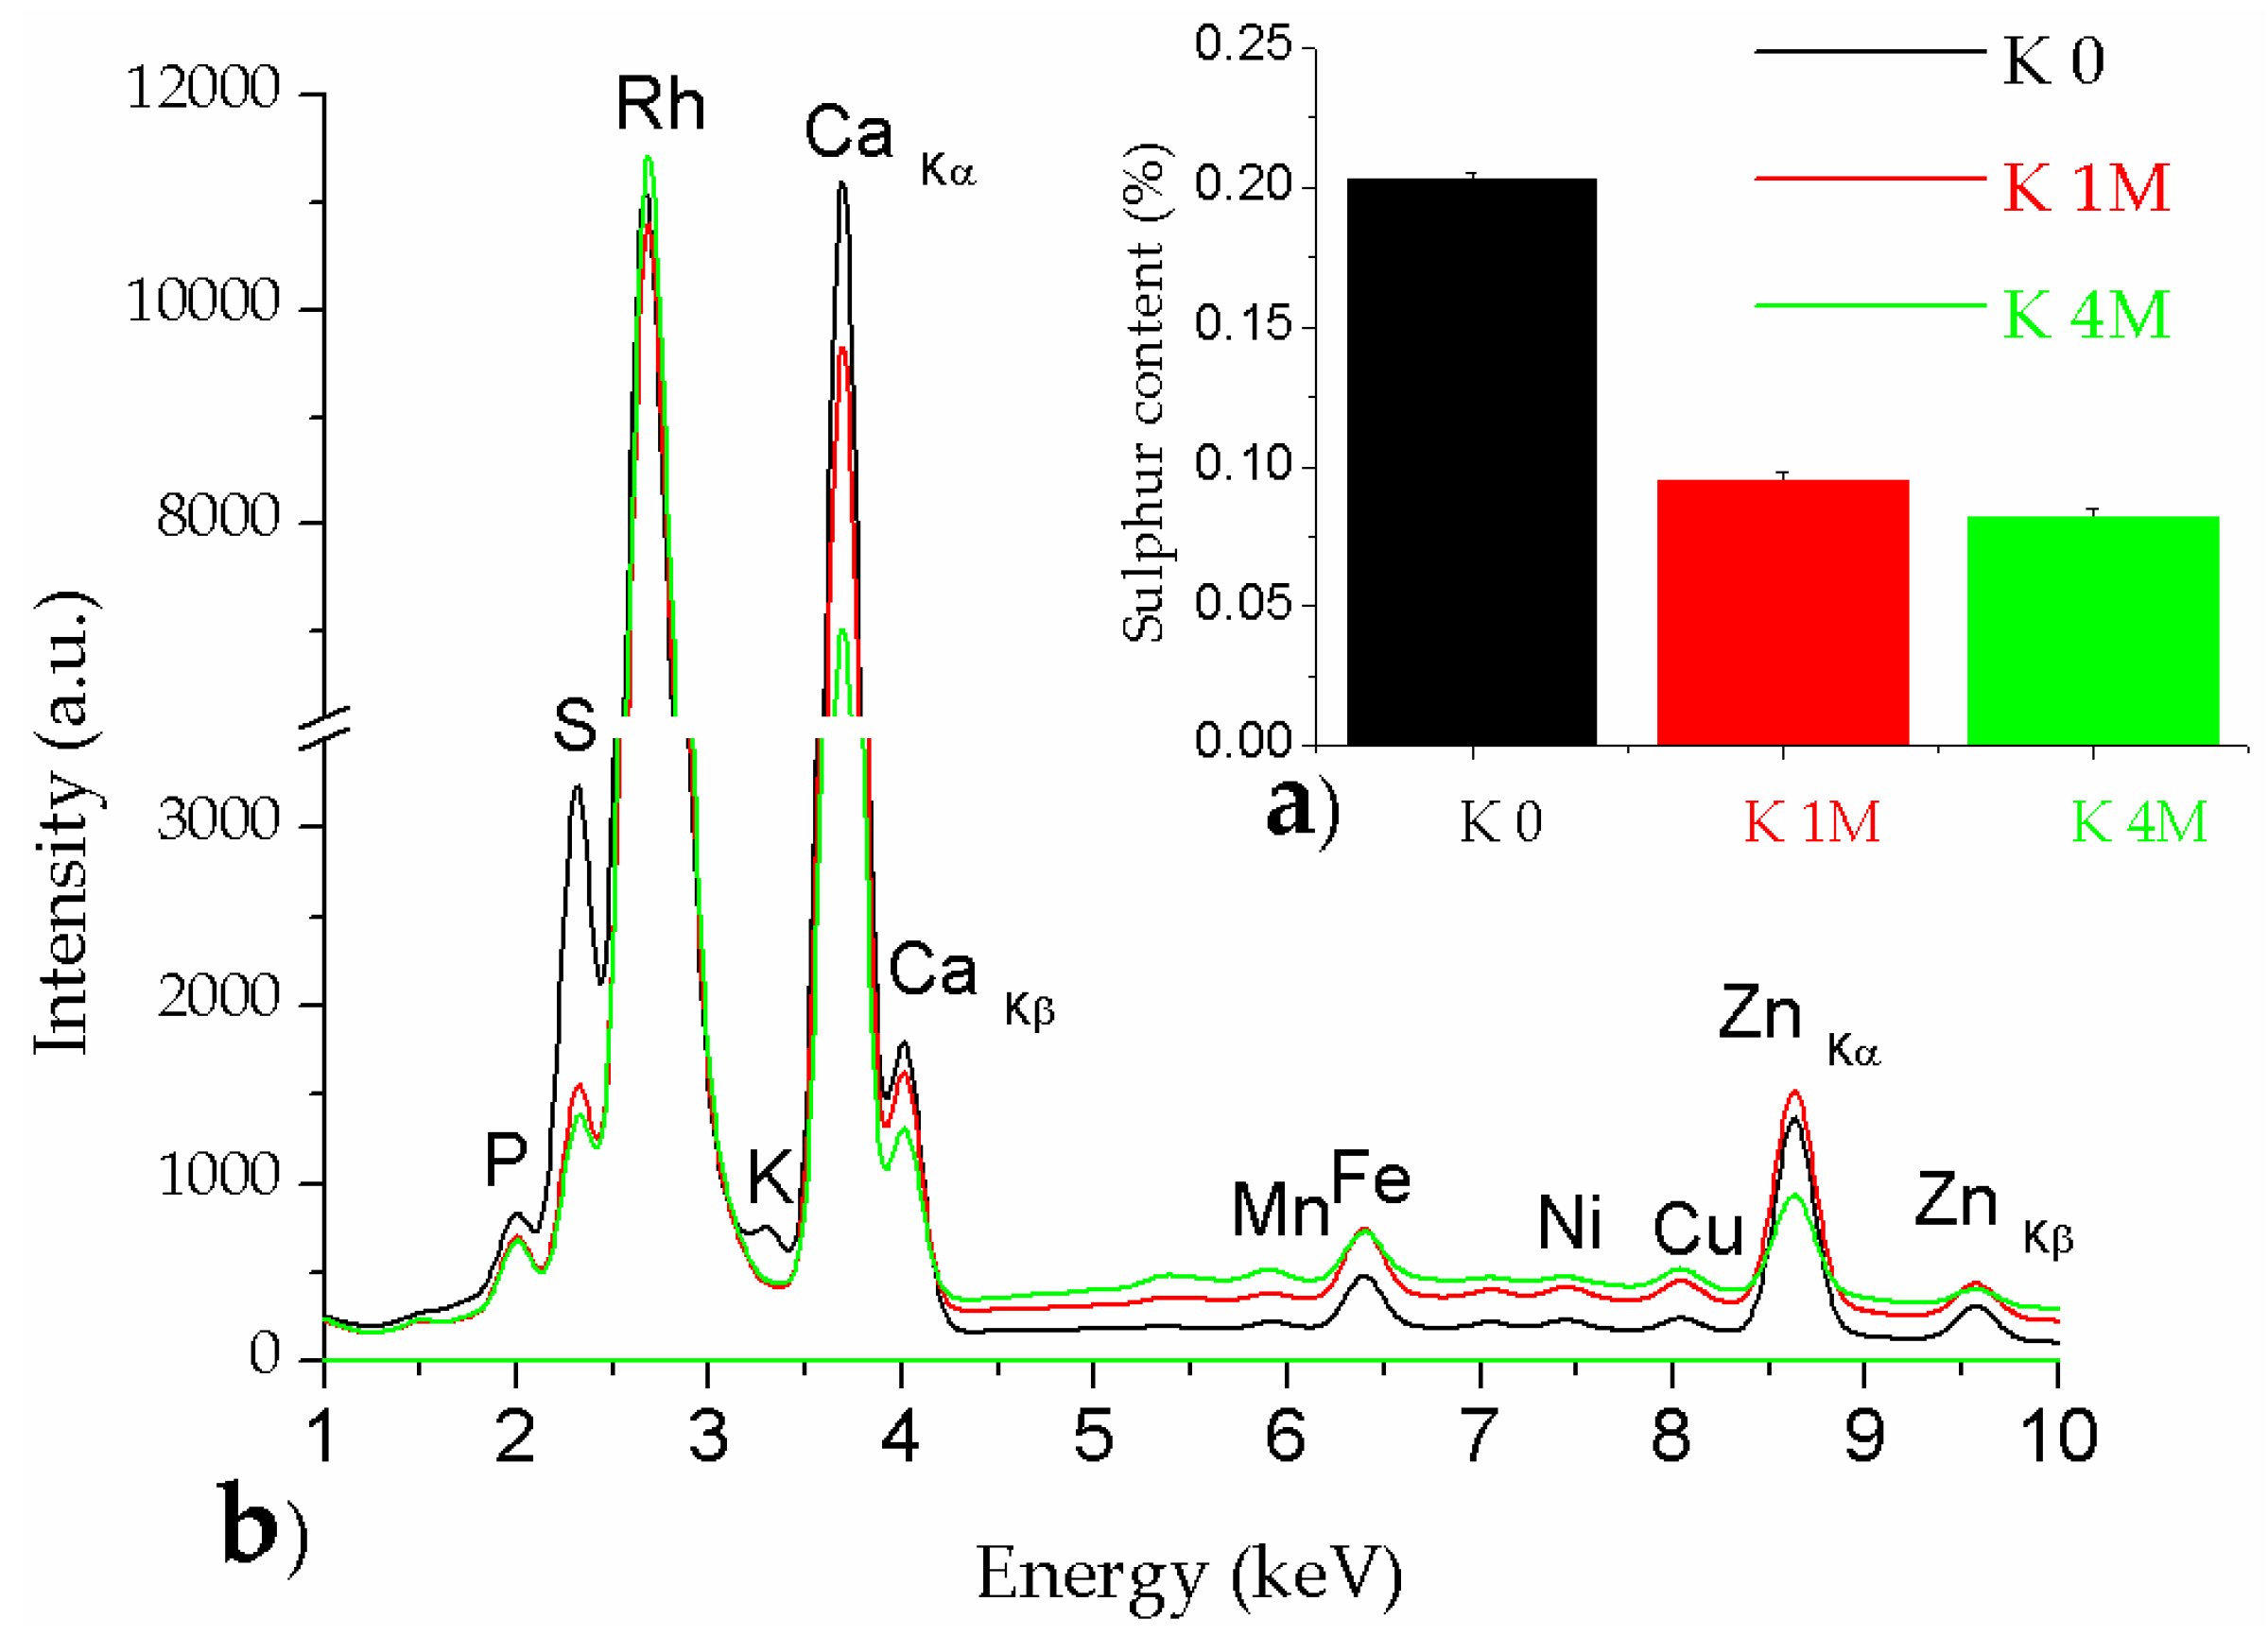
3.1.3. XRF Analysis
3.2. Size and Aspect of Bacterial Cellulose Fibrils
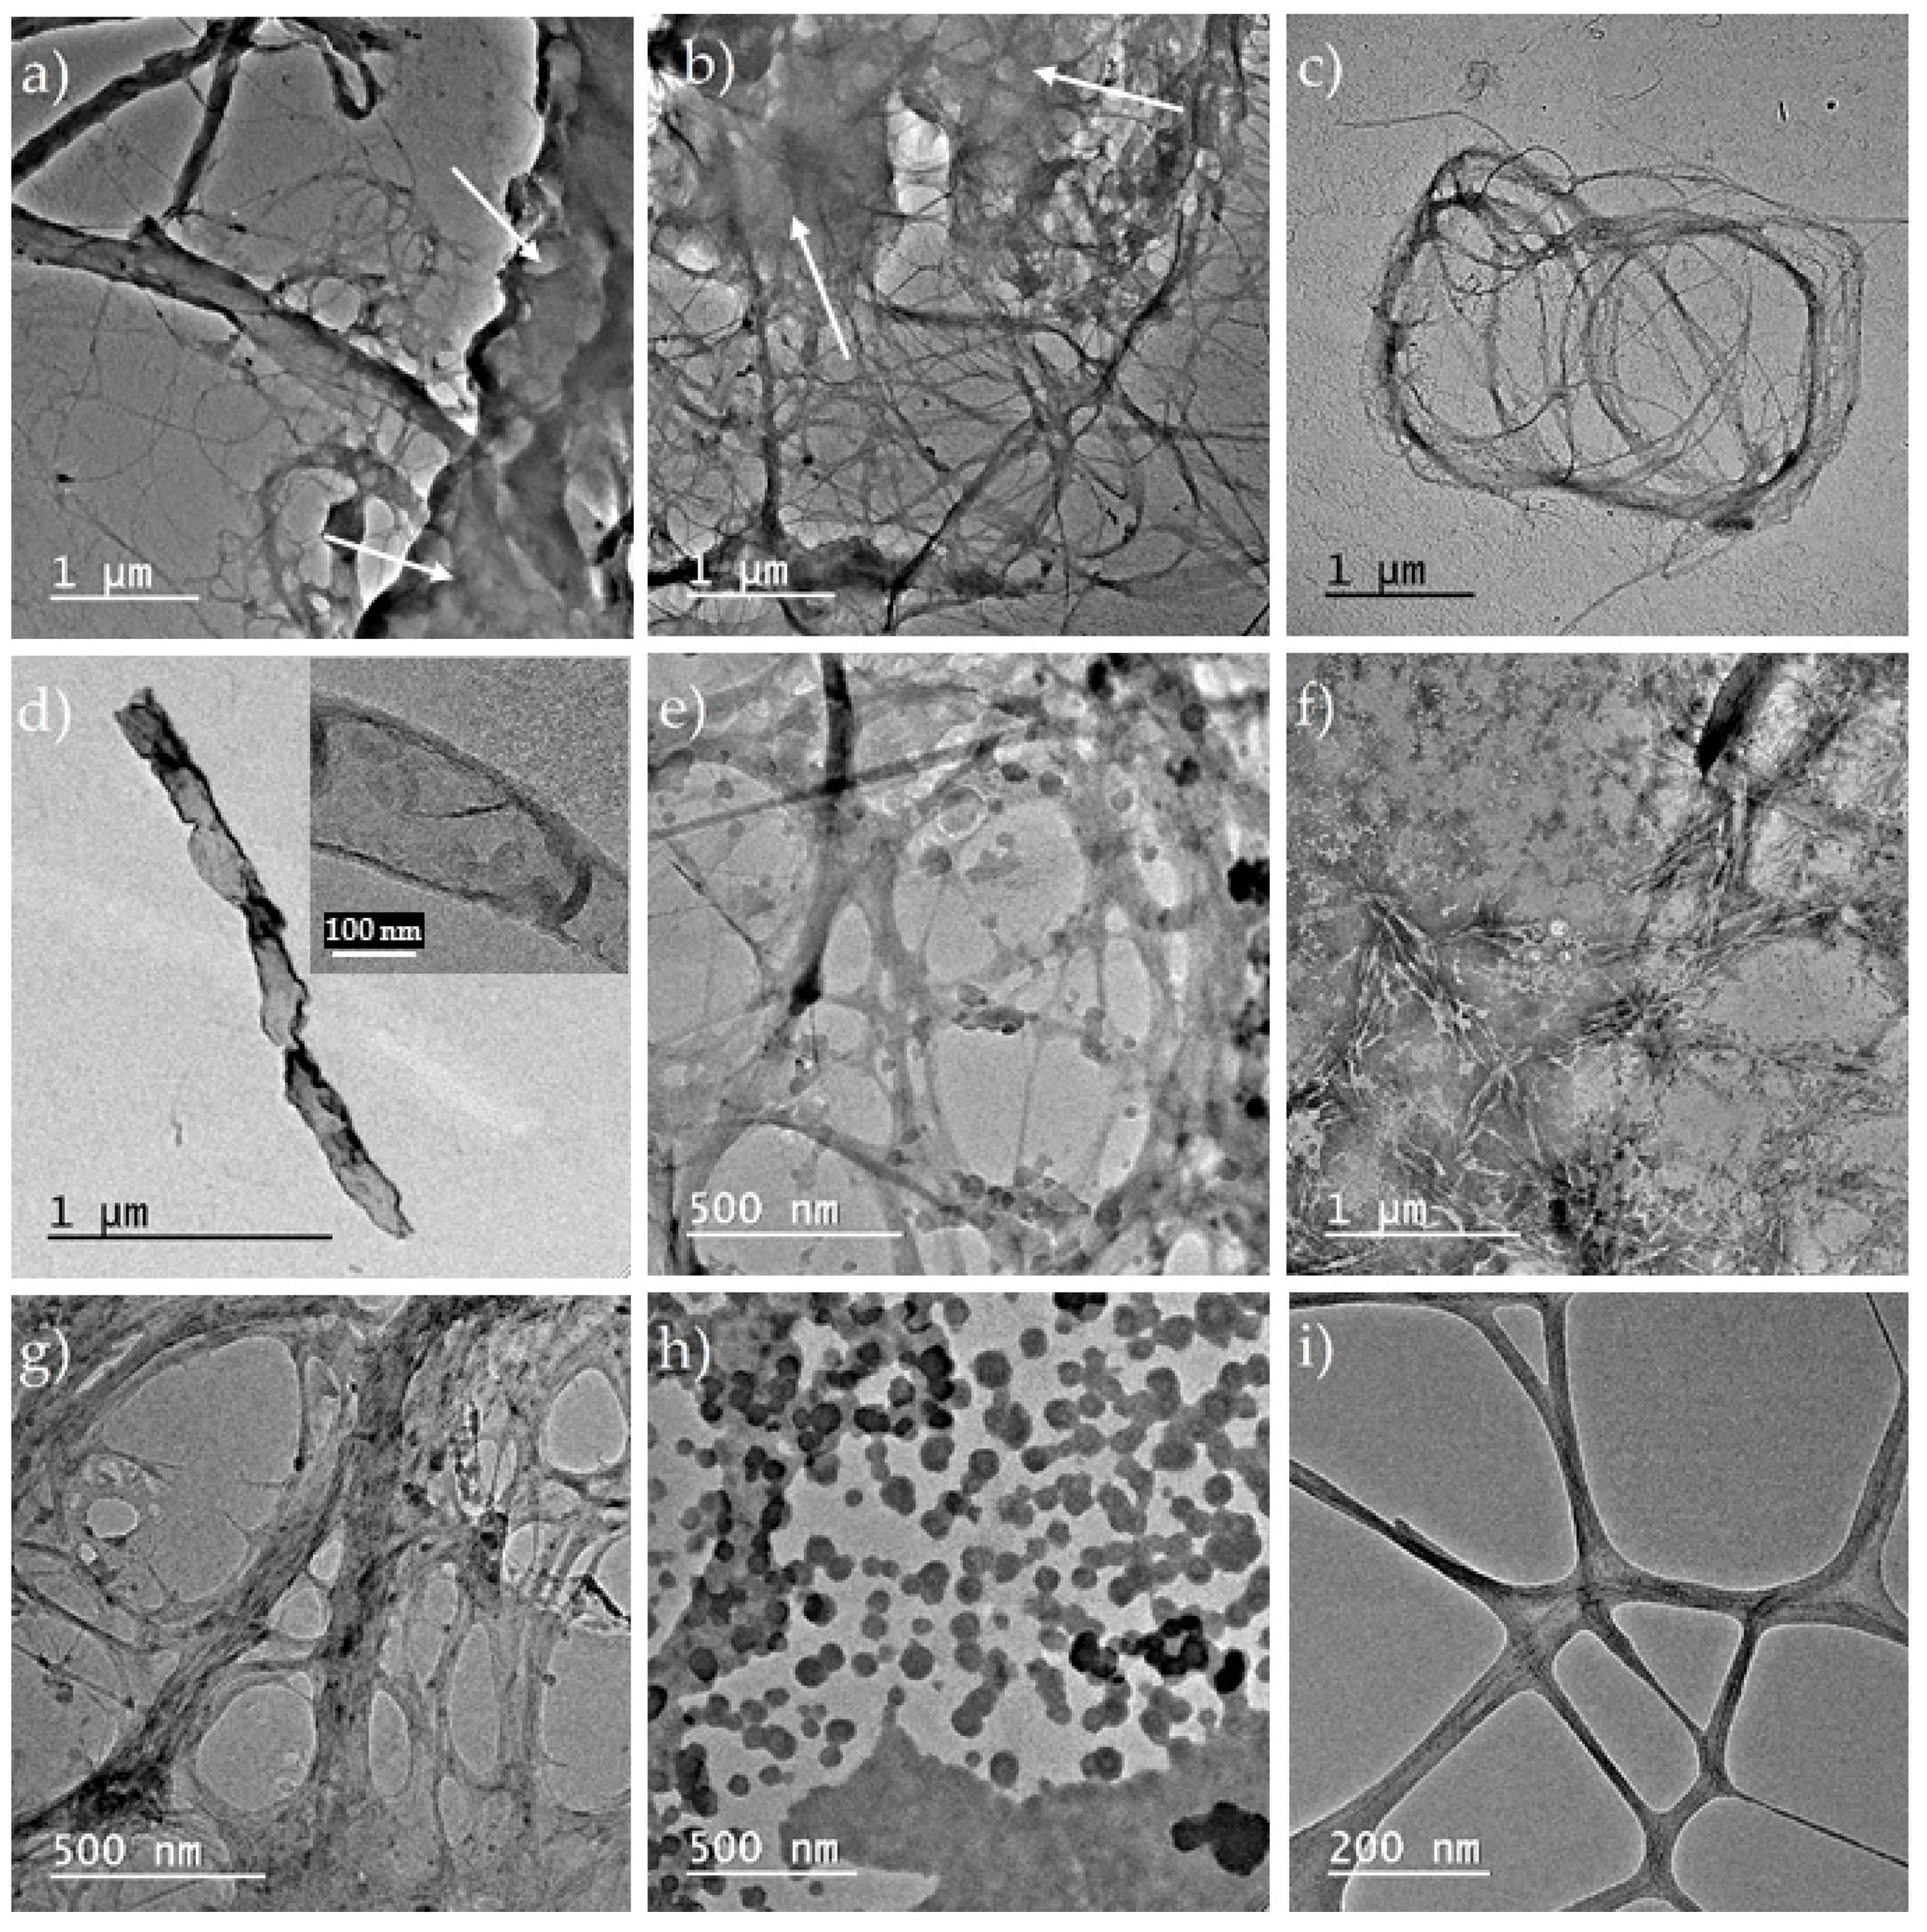
3.2.1. TEM Analysis
3.2.2. DLS Analysis
3.3. Physical-Chemical Properties of Bacterial Nano/Microcellulose from KM
3.3.1. TEM, XRD, and DLS Results on Physical-Chemical Properties
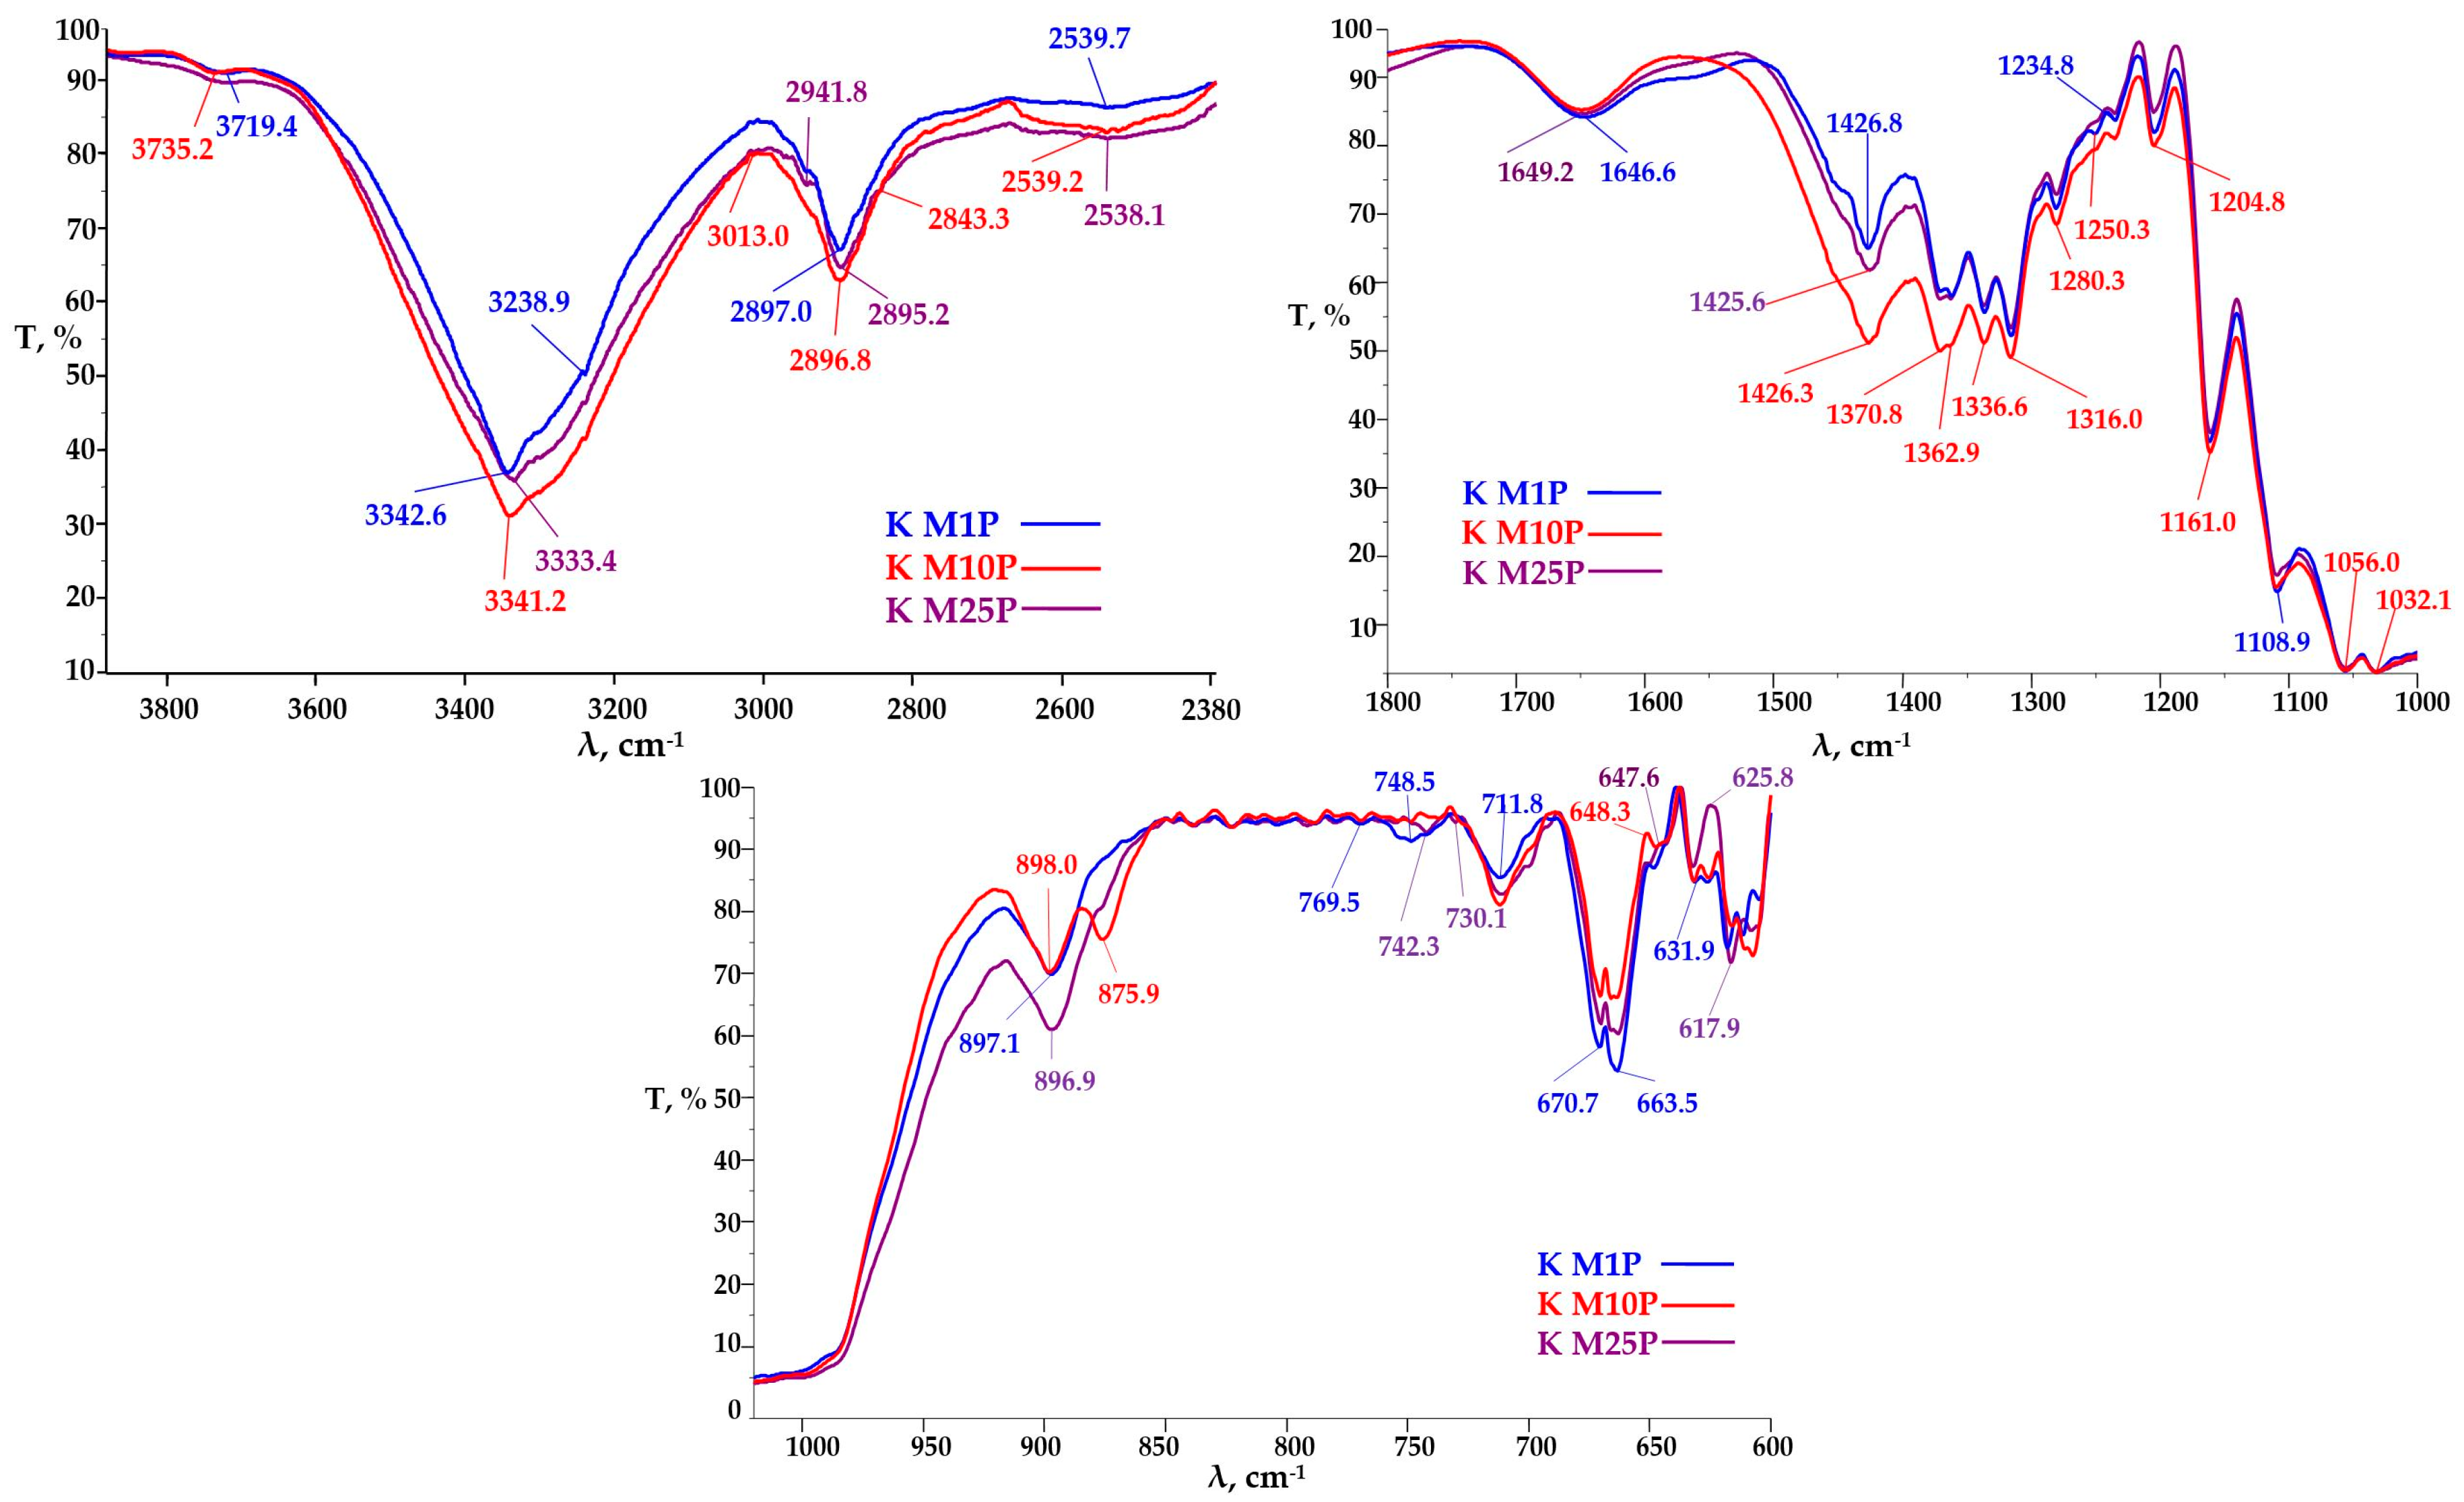
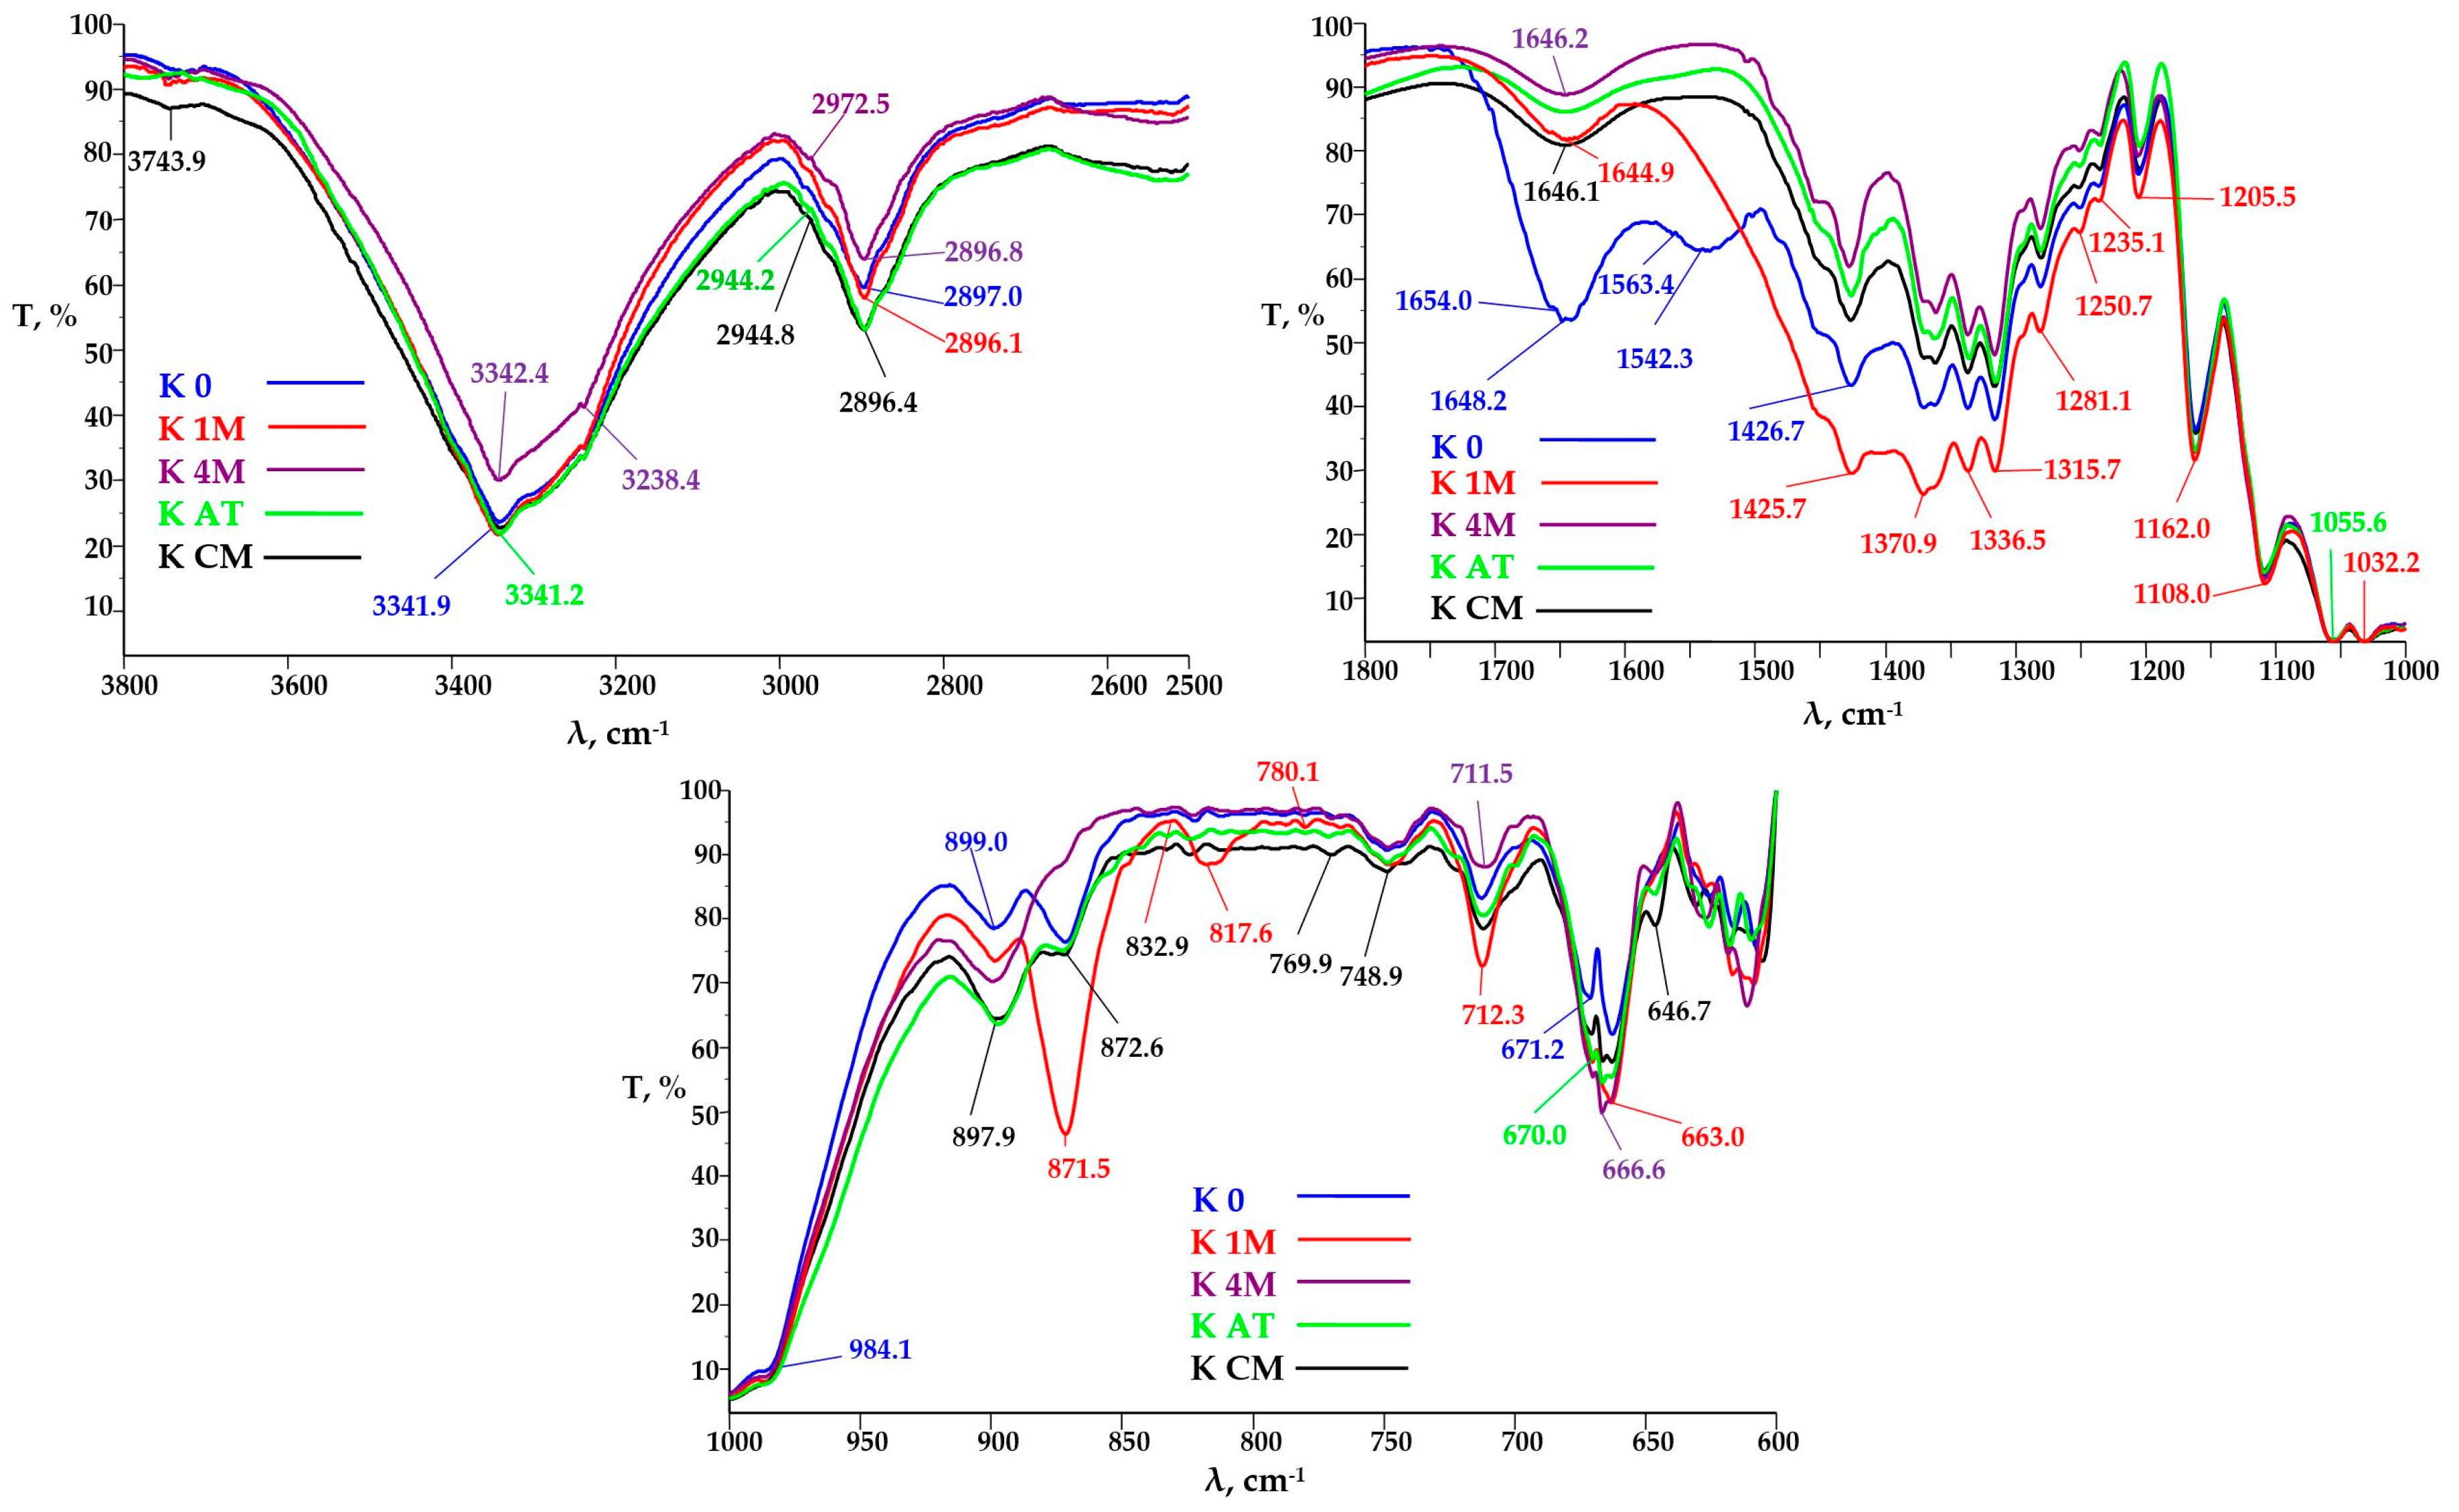
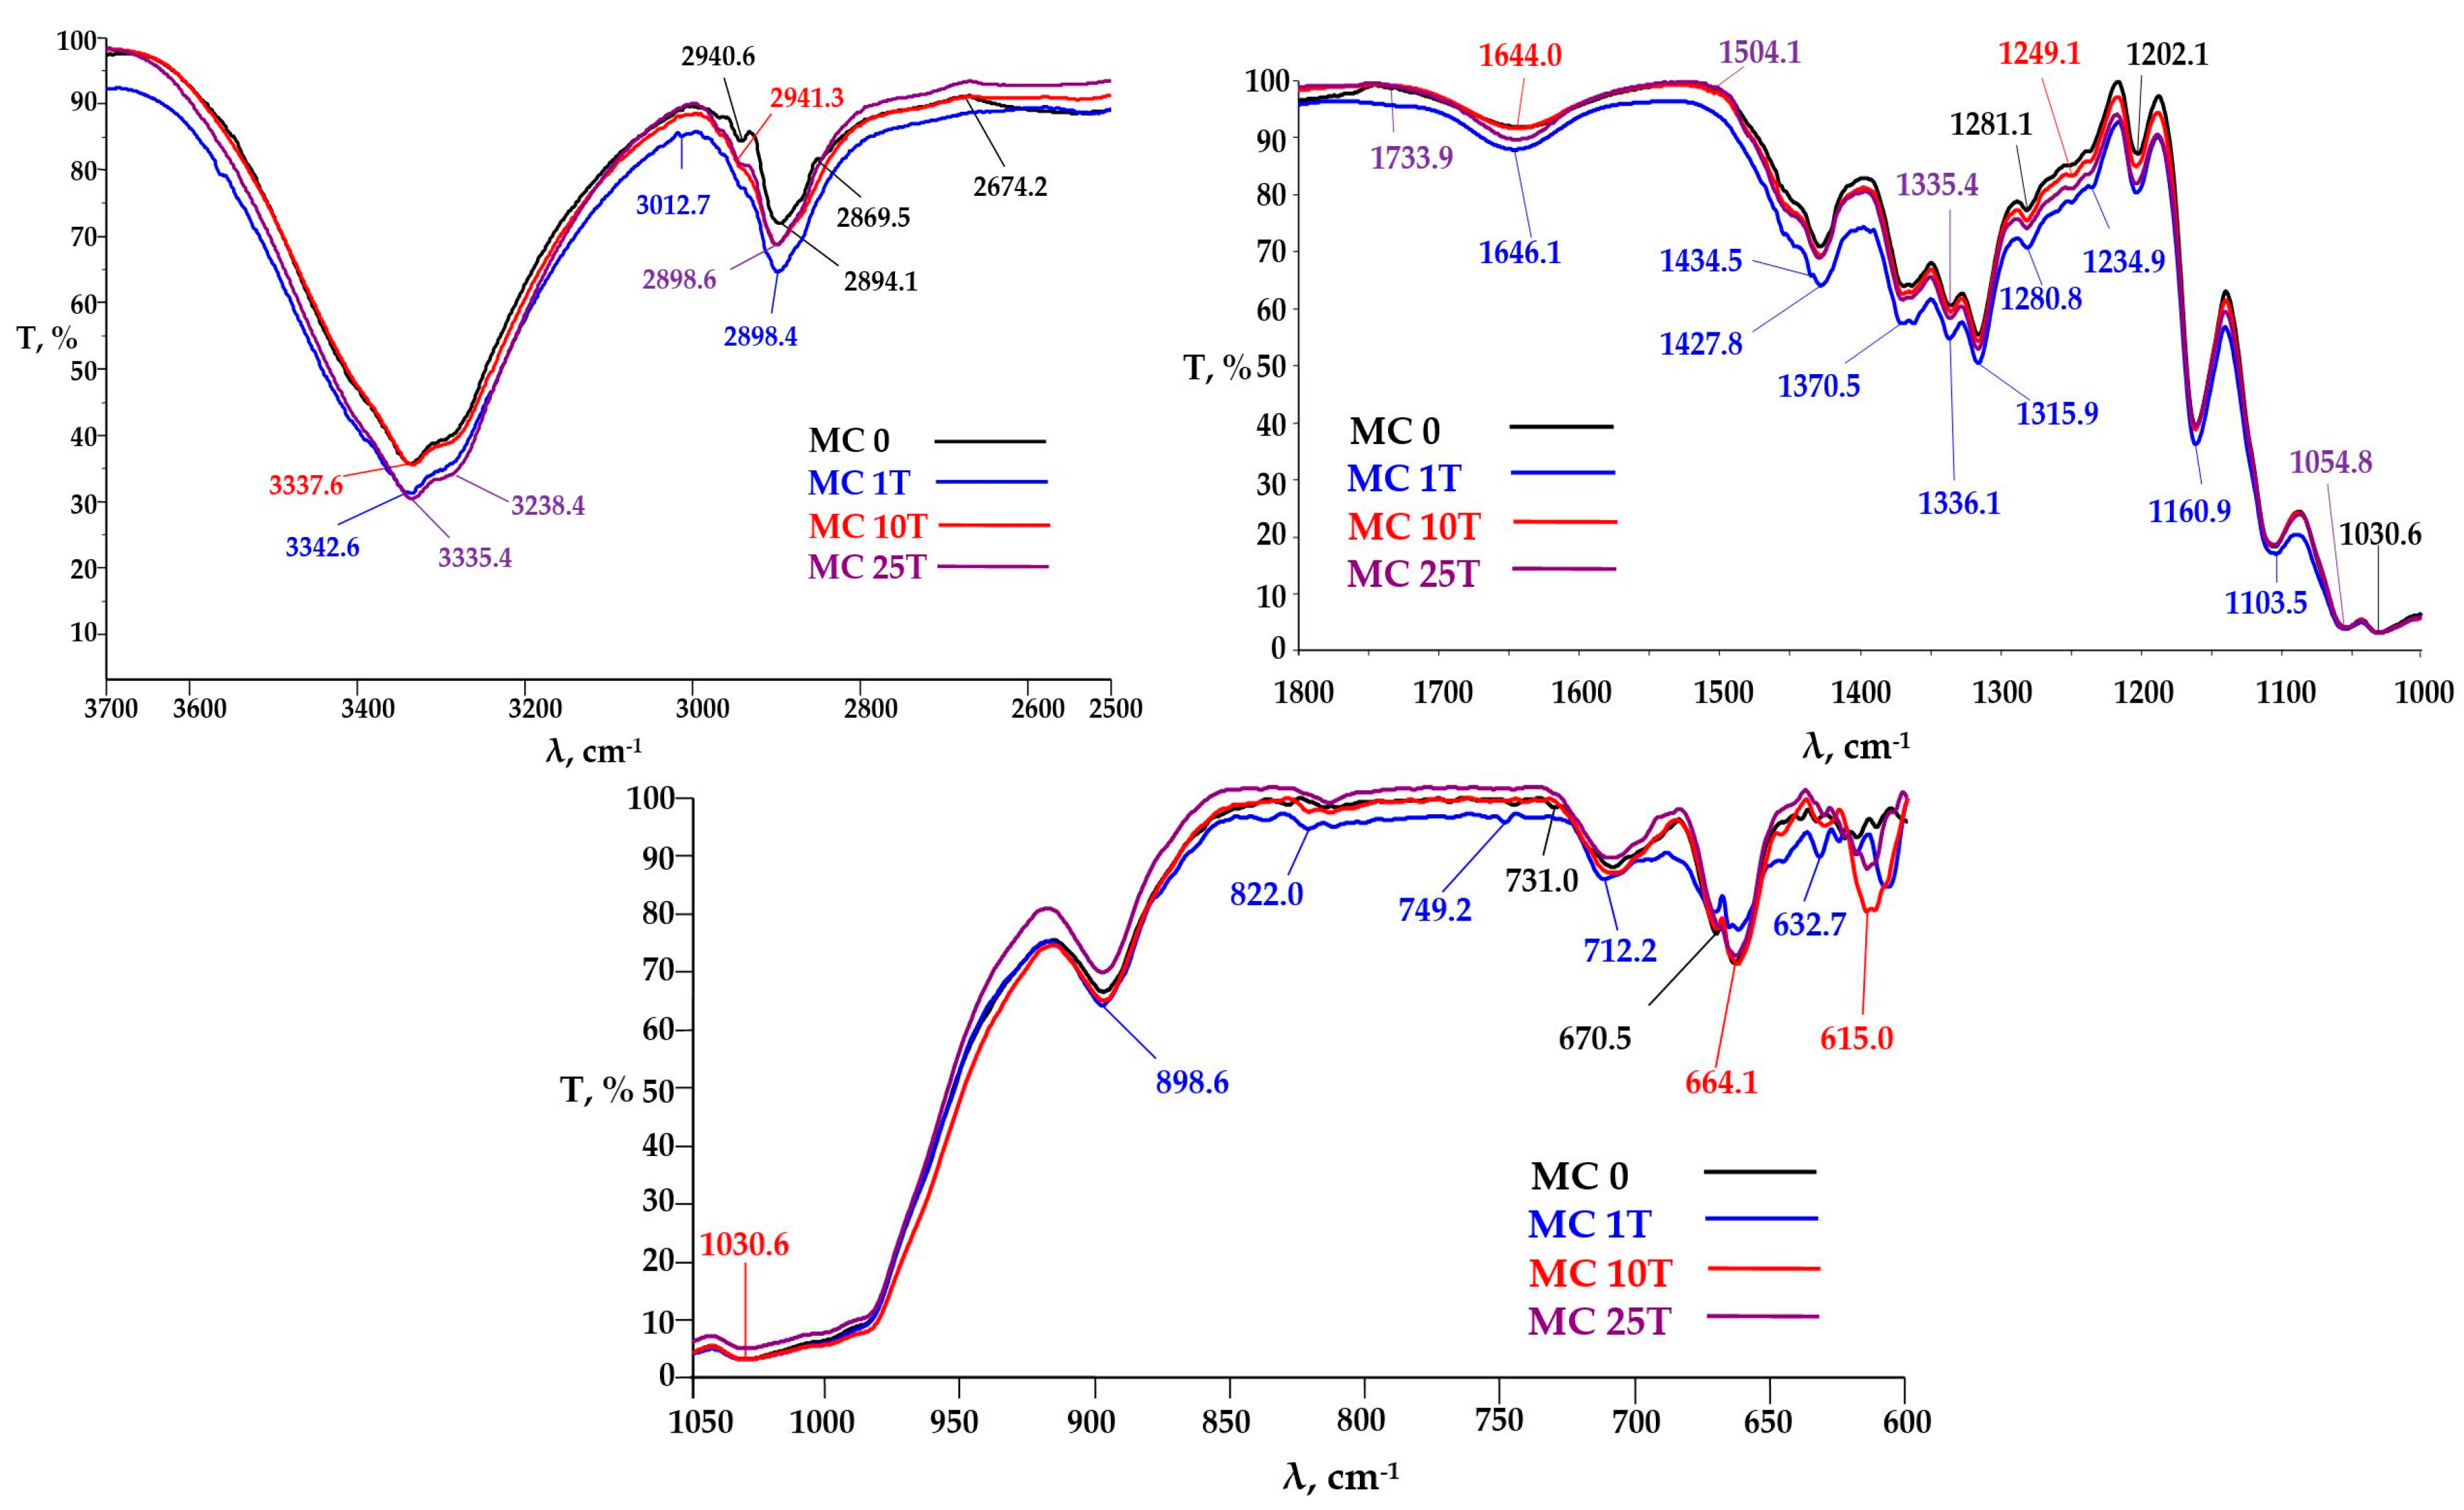
3.3.2. FTIR Analysis
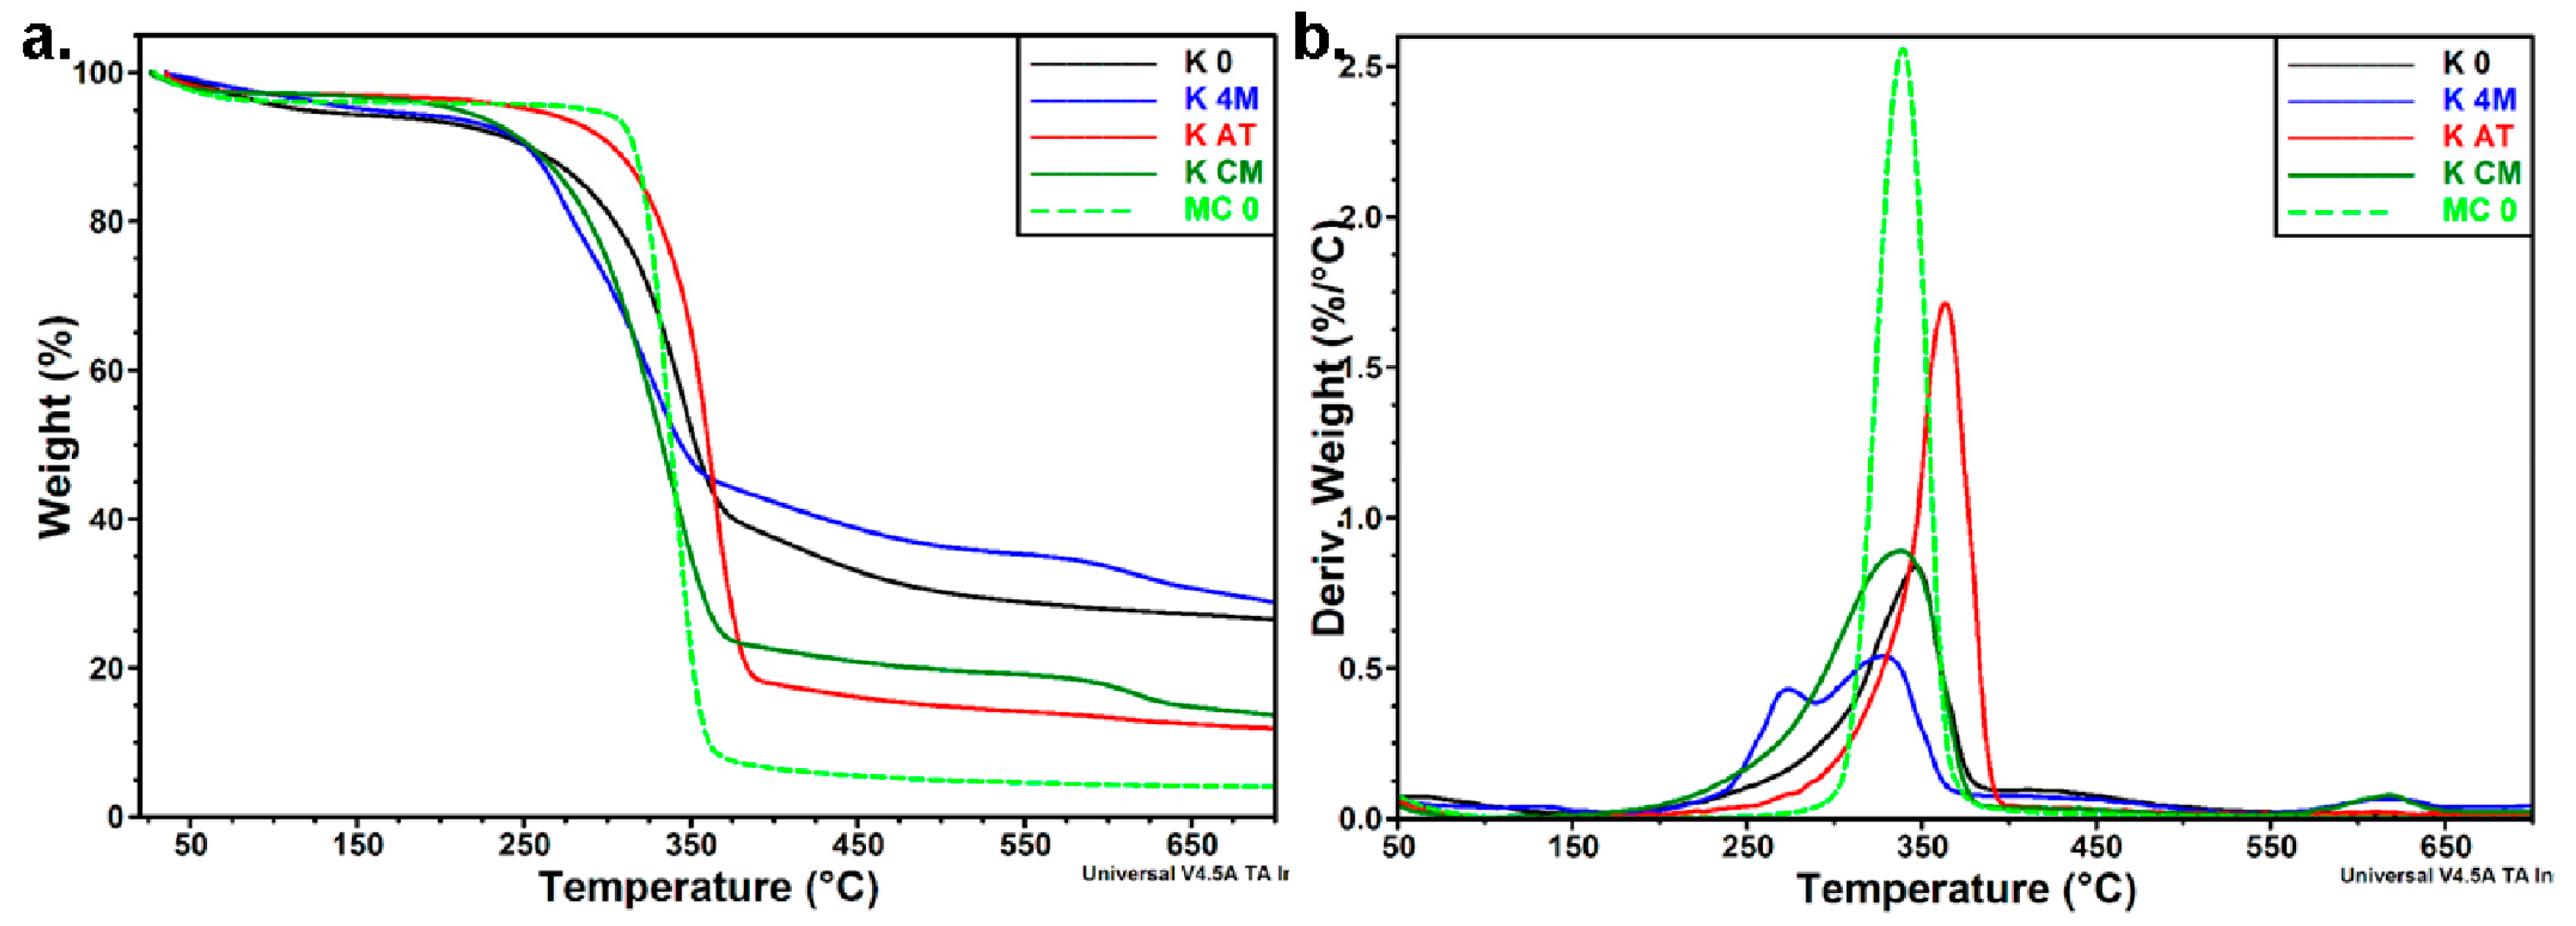
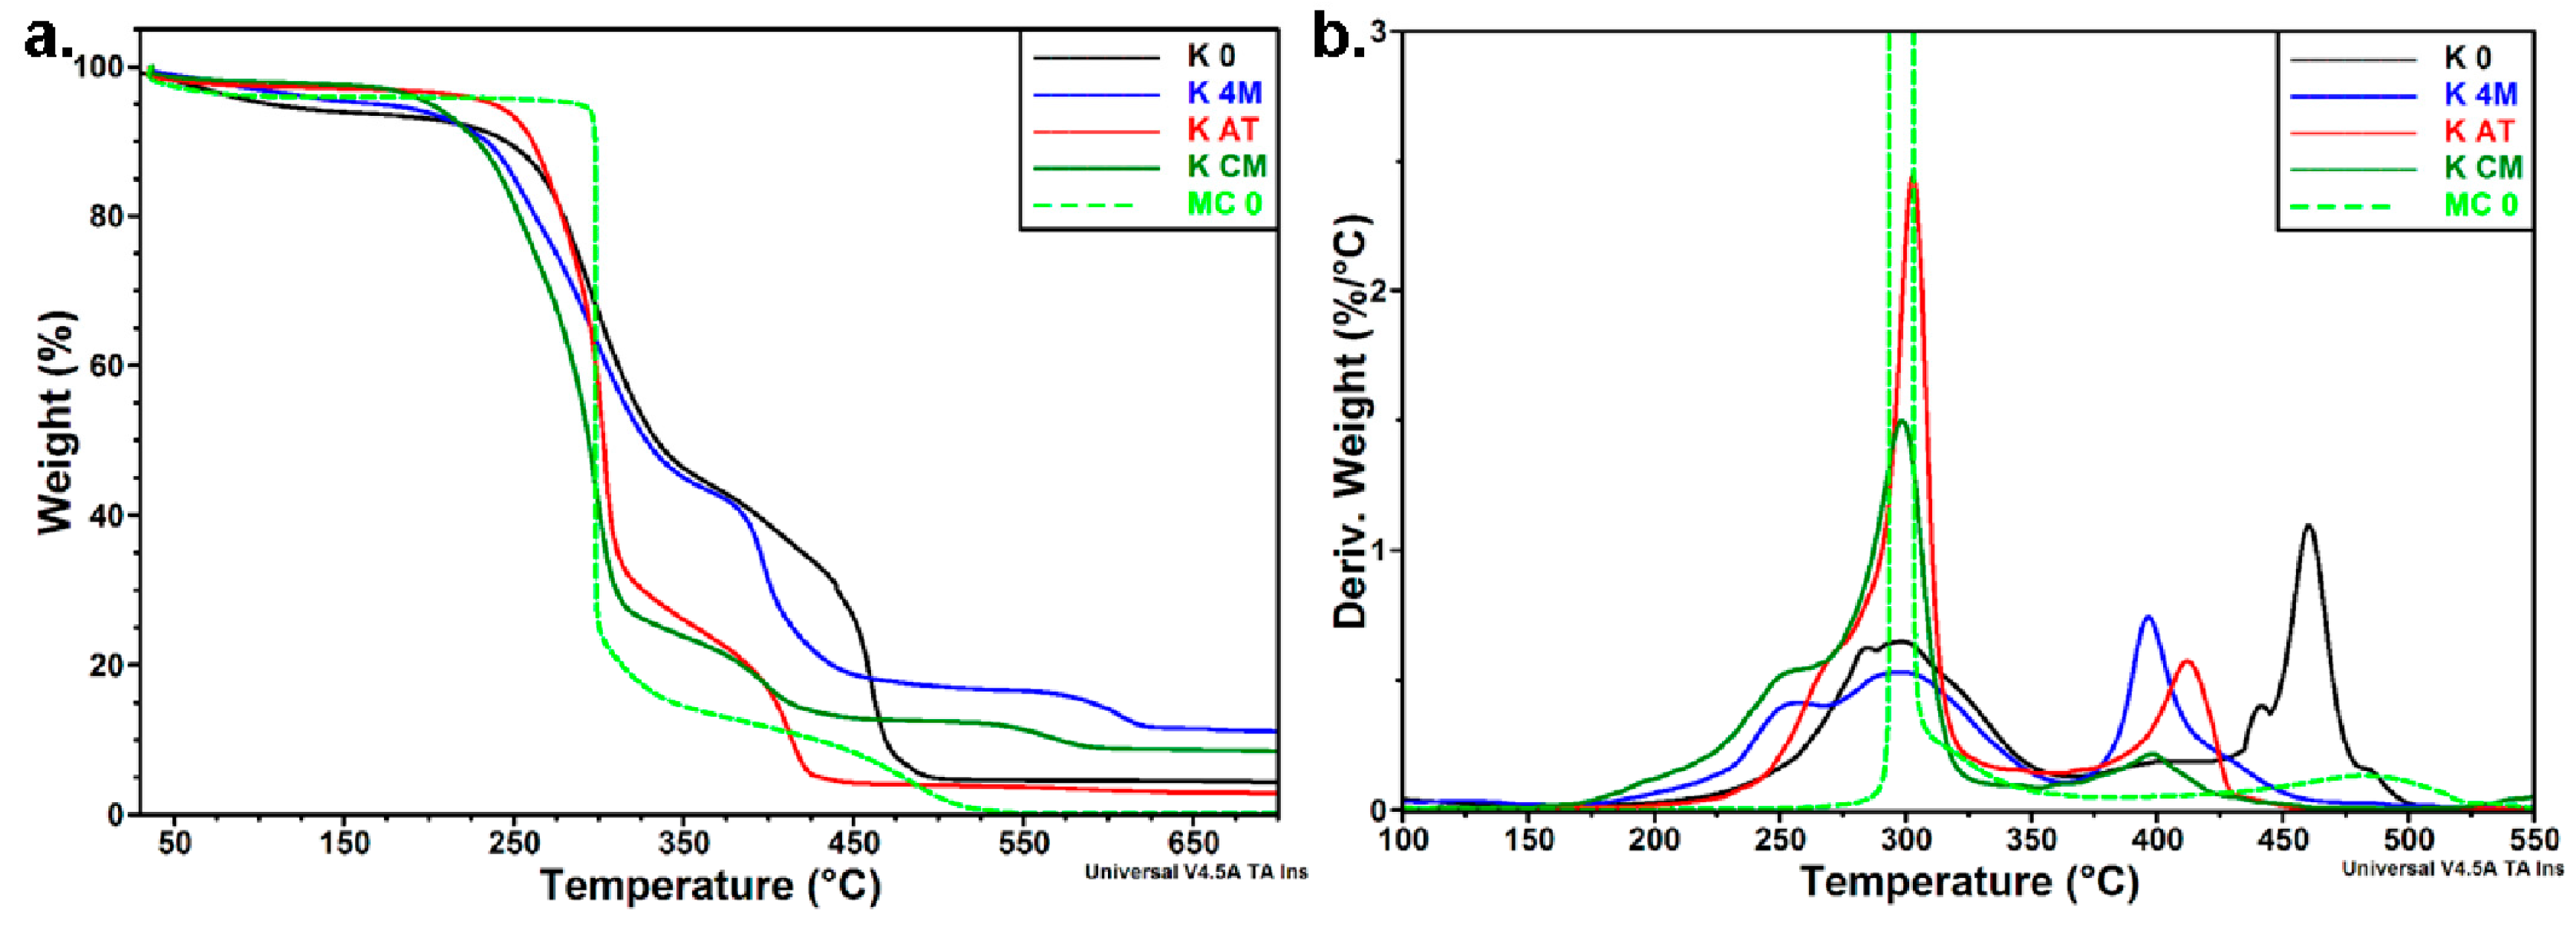
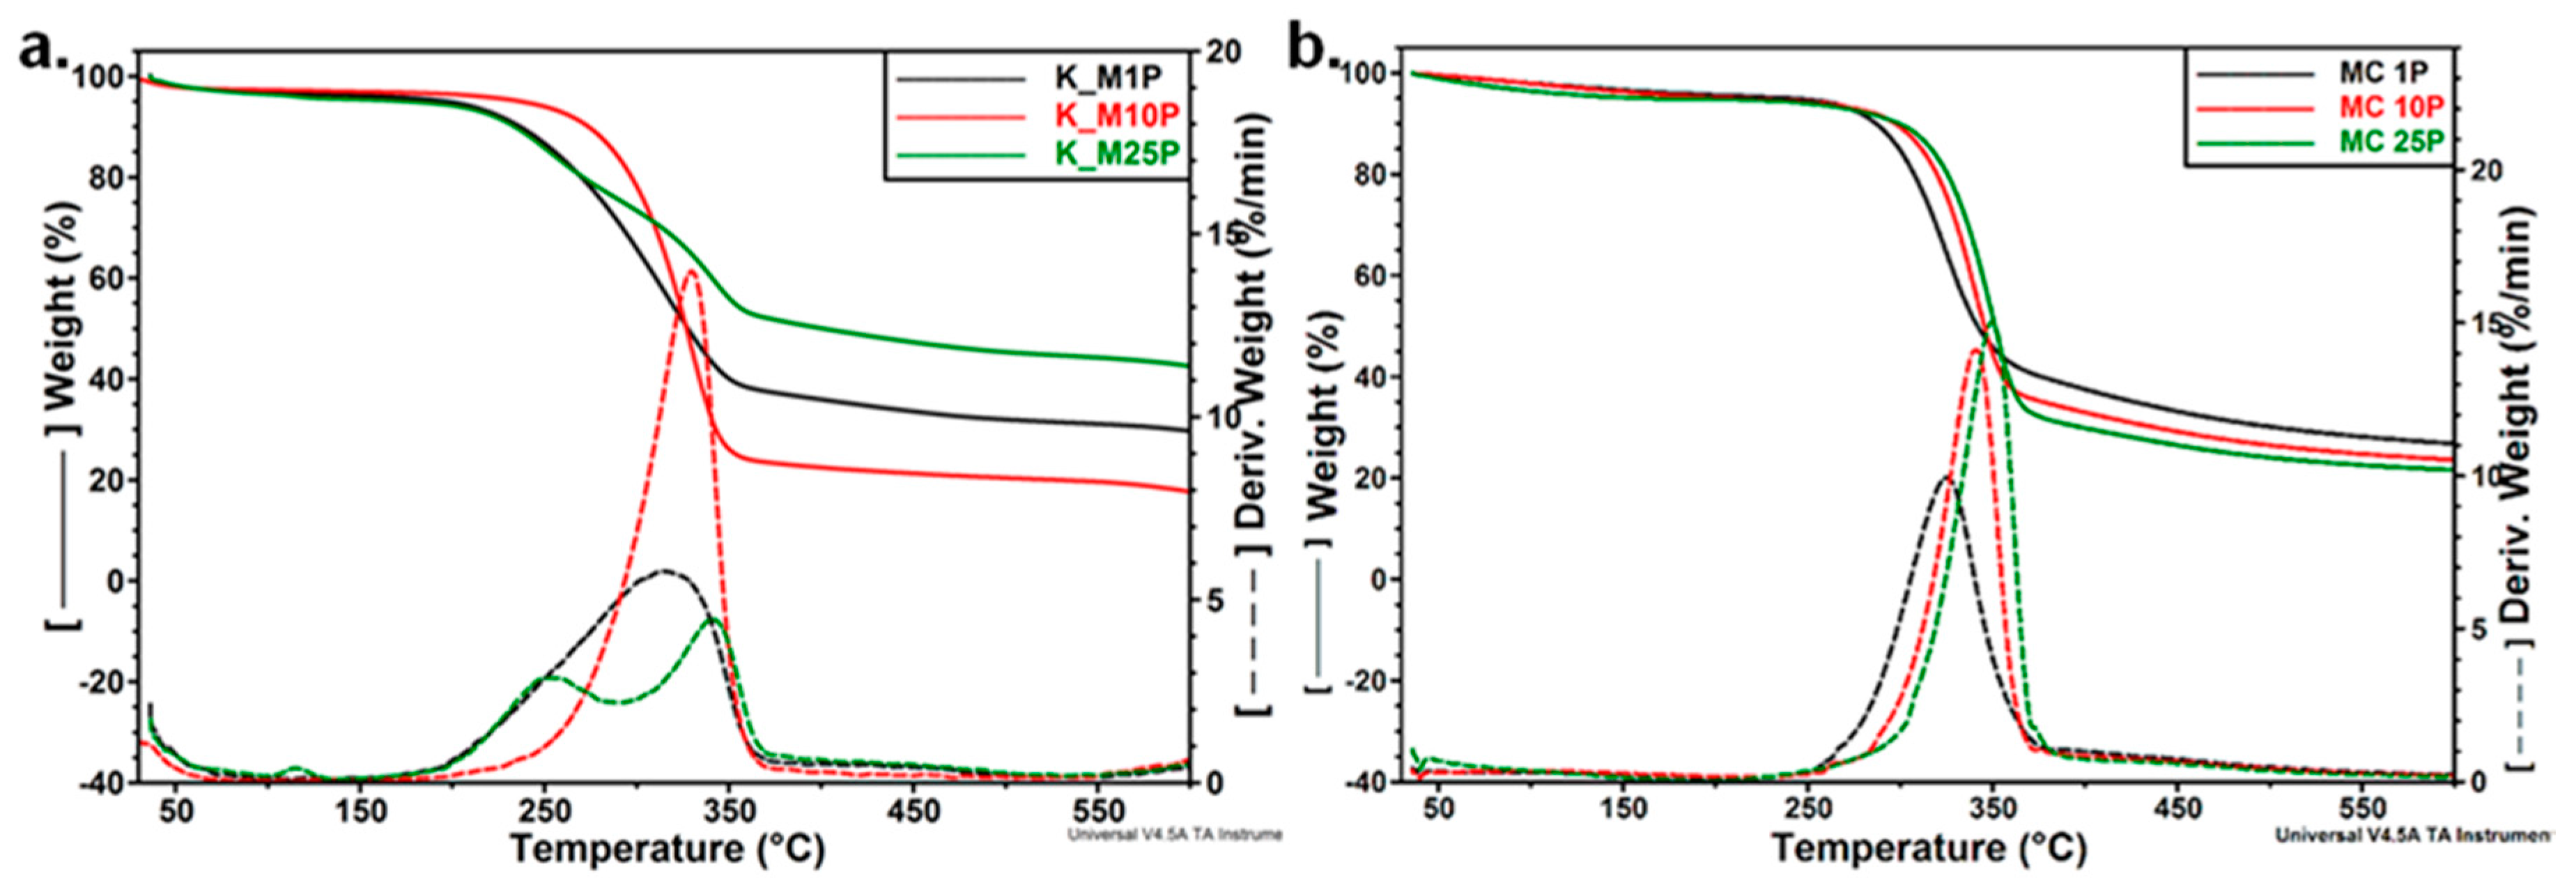
3.3.3. Thermal Analyses
4. Conclusions
Acknowledgments
Author Contributions
Conflicts of Interest
References
- Abitbol, T.; Rivkin, A.; Cao, Y.; Nevo, Y.; Abraham, E.; Ben-Shalom, T.; Lapidot, S.; Shoseyov, O. Nanocellulose, a tiny fiber with huge applications. Curr. Opin. Biotechnol. 2016, 39, 76–88. [Google Scholar] [CrossRef] [PubMed]
- Habibi, Y.; Lucia, L.A.; Rojas, O.J. Cellulose nanocrystals: Chemistry, self-assembly, and applications. Chem. Rev. 2010, 110, 3479–3500. [Google Scholar] [CrossRef] [PubMed]
- Du, X.; Zhang, Z.; Liu, W.; Deng, Y.L. Nanocellulose-based conductive materials and their emerging applications in energy devices—A review. Nano Energy 2017, 35, 299–320. [Google Scholar] [CrossRef]
- Bayer, T.; Cunning, B.V.; Selyanchyn, R.; Nishihara, M.; Fujikawa, S.; Sasaki, K.; Lyth, S.M. High temperature proton conduction in nanocellulose membranes: Paper fuel cells. Chem. Mater. 2016, 28, 4805–4814. [Google Scholar] [CrossRef]
- Dumanli, A.G. Nanocellulose and its composites for biomedical applications. Curr. Med. Chem. 2017, 24, 512–528. [Google Scholar] [CrossRef]
- Gustafsson, S.; Manukyan, L.; Mihranyan, A. Protein-nanocellulose interactions in paper filters for advanced separation applications. Langmuir 2017, 33, 4729–4736. [Google Scholar] [CrossRef] [PubMed]
- Wiggenhauser, P.S.; Schantz, J.T.; Rotter, N. Cartilage engineering in reconstructive surgery: Auricular, nasal and tracheal engineering from a surgical perspective. Regener. Med. 2017, 12, 303–314. [Google Scholar] [CrossRef] [PubMed]
- Zubik, K.; Singhsa, P.; Wang, Y.A.; Manuspiya, H.; Narain, R. Thermo-responsive poly(n-isopropylacrylamide)-cellulose nanocrystals hybrid hydrogels for wound dressing. Polymers 2017, 9, 119. [Google Scholar] [CrossRef]
- Markstedt, K.; Mantas, A.; Tournier, I.; Avila, H.; Hagg, D.; Gatenholm, P. 3d bioprinting human chondrocytes with nanocellulose-alginate bioink for cartilage tissue engineering applications. Biomacromolecules 2015, 16, 1489–1496. [Google Scholar] [CrossRef] [PubMed]
- Jozala, A.F.; de Lencastre-Novaes, L.C.; Lopes, A.M.; Santos-Ebinuma, V.D.; Mazzola, P.G.; Pessoa, A.; Grotto, D.; Gerenutti, M.; Chaud, M.V. Bacterial nanocellulose production and application: A 10-year overview. Appl. Microbiol. Biotechnol. 2016, 100, 2063–2072. [Google Scholar] [CrossRef] [PubMed]
- Bharimalla, A.K.; Deshmukh, S.P.; Vigneshwaran, N.; Patil, P.G.; Prasad, V. Nanocellulose-polymer composites for applications in food packaging: Current status, future prospects and challenges. Polym.-Plast. Technol. Eng. 2017, 56, 805–823. [Google Scholar] [CrossRef]
- Hubbe, M.A.; Ferrer, A.; Tyagi, P.; Yin, Y.Y.; Salas, C.; Pal, L.; Rojas, O.J. Nanocellulose in thin films, coatings, and plies for packaging applications: A review. Bioresources 2017, 12, 2143–2233. [Google Scholar] [CrossRef]
- Khorasani, A.; Shojaosadati, S. Bacterial nanocellulose-pectin bionanocomposites as prebiotics against drying and gastrointestinal condition. Int. J. Biol. Macromol. 2016, 83, 9–18. [Google Scholar] [CrossRef] [PubMed]
- Gomez, C.; Serpa, A.; Velasquez-Cock, J.; Ganan, P.; Castro, C.; Velez, L.; Zuluaga, R. Vegetable nanocellulose in food science: A review. Food Hydrocoll. 2016, 57, 178–186. [Google Scholar] [CrossRef]
- Liu, H.Z.; Geng, B.Y.; Chen, Y.F.; Wang, H.Y. Review on the aerogel-type oil sorbents derived from nanocellulose. ACS Sustain. Chem. Eng. 2017, 5, 49–66. [Google Scholar] [CrossRef]
- Mahfoudhi, N.; Boufi, S. Nanocellulose as a novel nanostructured adsorbent for environmental remediation: A review. Cellulose 2017, 24, 1171–1197. [Google Scholar] [CrossRef]
- Voisin, H.; Bergstrom, L.; Liu, P.; Mathew, A.P. Nanocellulose-based materials for water purification. Nanomaterials 2017, 7, 19. [Google Scholar] [CrossRef] [PubMed]
- De France, K.J.; Hoare, T.; Cranston, E.D. Review of hydrogels and aerogels containing nanocellulose. Chem. Mater. 2017, 29, 4609–4631. [Google Scholar] [CrossRef]
- Hokkanen, S.; Bhatnagar, A.; Sillanpaa, M. A review on modification methods to cellulose-based adsorbents to improve adsorption capacity. Water Res. 2016, 91, 156–173. [Google Scholar] [CrossRef] [PubMed]
- Yoshikawa, M.; Tharpa, K.; Dima, S.-O. Molecularly imprinted membranes: Past, present, and future. Chem. Rev. 2016, 116, 11500–11528. [Google Scholar] [CrossRef] [PubMed]
- Costa, S.; Pingel, P.; Janietz, S.; Nogueira, A. Inverted organic solar cells using nanocellulose as substrate. J. Appl. Polym. Sci. 2016, 133. [Google Scholar] [CrossRef]
- Kim, H.J.; Yim, E.C.; Kim, J.H.; Kim, S.J.; Park, J.Y.; Oh, I.K. Bacterial nano-cellulose triboelectric nanogenerator. Nano Energy 2017, 33, 130–137. [Google Scholar] [CrossRef]
- Hoeng, F.; Denneulin, A.; Bras, J. Use of nanocellulose in printed electronics: A review. Nanoscale 2016, 8, 13131–13154. [Google Scholar] [CrossRef] [PubMed]
- Sabo, R.; Yermakov, A.; Law, C.T.; Elhajjar, R. Nanocellulose-enabled electronics, energy harvesting devices, smart materials and sensors: A review. J. Renew. Mater. 2016, 4, 297–312. [Google Scholar] [CrossRef]
- Gaspar, D.; Fernandes, S.N.; de Oliveira, A.G.; Fernandes, J.G.; Grey, P.; Pontes, R.V.; Pereira, L.; Martins, R.; Godinho, M.H.; Fortunato, E. Nanocrystalline cellulose applied simultaneously as the gate dielectric and the substrate in flexible field effect transistors. Nanotechnology 2014, 25, 11. [Google Scholar] [CrossRef] [PubMed]
- Zhu, H.L.; Luo, W.; Ciesielski, P.N.; Fang, Z.Q.; Zhu, J.Y.; Henriksson, G.; Himmel, M.E.; Hu, L.B. Wood-derived materials for green electronics, biological devices, and energy applications. Chem. Rev. 2016, 116, 9305–9374. [Google Scholar] [CrossRef] [PubMed]
- Muller, A.; Ni, Z.; Hessler, N.; Wesarg, F.; Muller, F.; Kralisch, D.; Fischer, D. The biopolymer bacterial nanocellulose as drug delivery system: Investigation of drug loading and release using the model protein albumin. J. Pharm. Sci. 2013, 102, 579–592. [Google Scholar] [CrossRef] [PubMed]
- Semjonovs, P.; Ruklisha, M.; Paegle, L.; Saka, M.; Treimane, R.; Skute, M.; Rozenberga, L.; Vikele, L.; Sabovics, M.; Cleenwerck, I. Cellulose synthesis by komagataeibacter rhaeticus strain p 1463 isolated from kombucha. Appl. Microbiol. Biotechnol. 2017, 101, 1003–1012. [Google Scholar] [CrossRef] [PubMed]
- Jayabalan, R.; Malbasa, R.; Loncar, E.; Vitas, J.; Sathishkumar, M. A review on kombucha teamicrobiology, composition, fermentation, beneficial effects, toxicity, and tea fungus. Compr. Rev. Food Sci. Food Saf. 2014, 13, 538–550. [Google Scholar] [CrossRef]
- Nguyen, N.K.; Nguyen, P.B.; Nguyen, H.T.; Le, P.H. Screening the optimal ratio of symbiosis between isolated yeast and acetic acid bacteria strain from traditional kombucha for high-level production of glucuronic acid. Lwt-Food Sci. Technol. 2015, 64, 1149–1155. [Google Scholar] [CrossRef]
- Baschali, A.; Tsakalidou, E.; Kyriacou, A.; Karavasiloglou, N.; Matalas, A.L. Traditional low-alcoholic and non-alcoholic fermented beverages consumed in european countries: A neglected food group. Nutr. Res Rev. 2017, 30, 1–24. [Google Scholar] [CrossRef] [PubMed]
- Banerjee, D.; Hassarajani, S.A.; Maity, B.; Narayan, G.; Bandyopadhyay, S.K.; Chattopadhyay, S. Comparative healing property of kombucha tea and black tea against indomethacin-induced gastric ulceration in mice: Possible mechanism of action. Food Funct. 2010, 1, 284–293. [Google Scholar] [CrossRef] [PubMed]
- Aloulou, A.; Hamden, K.; Elloumi, D.; Ali, M.; Hargafi, K.; Jaouadi, B.; Ayadi, F.; Elfeki, A.; Ammar, E. Hypoglycemic and antilipidemic properties of kombucha tea in alloxan-induced diabetic rats. BMC Complement. Altern. Med. 2012, 12. [Google Scholar] [CrossRef] [PubMed]
- Dufresne, C.; Farnworth, E. Tea, kombucha, and health: A review. Food Res. Int. 2000, 33, 409–421. [Google Scholar] [CrossRef]
- Mullin, G.; Delzenne, N.; Cheskin, L.; Matarese, L. The human gut microbiome and its role in obesity and the metabolic syndrome. Integr. Weight Manag. Clin. 2014, 71–105. [Google Scholar]
- Podolich, O.; Zaets, I.; Kukharenko, O.; Orlovska, I.; Reva, O.; Khirunenko, L.; Sosnin, M.; Haidak, A.; Shpylova, S.; Rabbow, E.; et al. Kombucha multimicrobial community under simulated spaceflight and martian conditions. Astrobiology 2017, 17, 459–469. [Google Scholar] [CrossRef] [PubMed]
- Lee, K.; Buldum, G.; Mantalaris, A.; Bismarck, A. More than meets the eye in bacterial cellulose: Biosynthesis, bioprocessing, and applications in advanced fiber composites. Macromol. Biosci. 2014, 14, 10–32. [Google Scholar] [CrossRef] [PubMed]
- McNamara, J.T.; Morgan, J.L.W.; Zimmer, J. A molecular description of cellulose biosynthesis. In Annual Review of Biochemistry; Kornberg, R.D., Ed.; Annual Reviews: Palo Alto, CA, USA, 2015; Volume 84, pp. 895–921. [Google Scholar]
- Koyama, M.; Helbert, W.; Imai, T.; Sugiyama, J.; Henrissat, B. Parallel-up structure evidences the molecular directionality during biosynthesis of bacterial cellulose. Proc. Natl. Acad. Sci. USA 1997, 94, 9091–9095. [Google Scholar] [CrossRef] [PubMed]
- Sugiyama, J.; Vuong, R.; Chanzy, H. Electron-diffraction study on the 2 crystalline phases occurring in native cellulose from an algal cell-wall. Macromolecules 1991, 24, 4168–4175. [Google Scholar] [CrossRef]
- Fernandes, A.N.; Thomas, L.H.; Altaner, C.M.; Callow, P.; Forsyth, V.T.; Apperley, D.C.; Kennedy, C.J.; Jarvis, M.C. Nanostructure of cellulose microfibrils in spruce wood. Proc. Natl. Acad. Sci. USA 2011, 108, E1195–E1203. [Google Scholar] [CrossRef] [PubMed]
- Newman, R.H.; Hill, S.J.; Harris, P.J. Wide-angle x-ray scattering and solid-state nuclear magnetic resonance data combined to test models for cellulose microfibrils in mung bean cell walls. Plant Physiol. 2013, 163, 1558–1567. [Google Scholar] [CrossRef] [PubMed]
- Wang, H.Y.; Qian, H.; Yao, W.R. Melanoidins produced by the mail lard reaction: Structure and biological activity. Food Chem. 2011, 128, 573–584. [Google Scholar] [CrossRef]
- Langner, E.; Rzeski, W. Biological properties of melanoidins: A review. Int. J. Food Prop. 2014, 17, 344–353. [Google Scholar] [CrossRef]
- Nishiyama, Y.; Langan, P.; Wada, M.; Forsyth, V.T. Looking at hydrogen bonds in cellulose. Acta Crystallogr. Sect. D Biol. Crystallogr. 2010, 66, 1172–1177. [Google Scholar] [CrossRef] [PubMed]
- French, A.D.; Cintron, M.S. Cellulose polymorphy, crystallite size, and the segal crystallinity index. Cellulose 2013, 20, 583–588. [Google Scholar] [CrossRef]
- Park, S.; Baker, J.O.; Himmel, M.E.; Parilla, P.A.; Johnson, D.K. Cellulose crystallinity index: Measurement techniques and their impact on interpreting cellulase performance. Biotechnol. Biofuels 2010, 3, 10. [Google Scholar] [CrossRef] [PubMed]
- Xiang, C.H.; Acevedo, N.C. In situ self-assembled nanocomposites from bacterial cellulose reinforced with eletrospun poly(lactic acid)/lipids nanofibers. Polymers 2017, 9, 13. [Google Scholar] [CrossRef]
- Chen, Y.W.; Tan, T.H.; Lee, H.V.; Abd Hamid, S.B. Easy fabrication of highly thermal-stable cellulose nanocrystals using cr(no3)(3) catalytic hydrolysis system: A feasibility study from macro- to nano-dimensions. Materials 2017, 10, 24. [Google Scholar] [CrossRef] [PubMed]
- Panaitescu, D.M.; Frone, A.N.; Chiulan, I.; Casarica, A.; Nicolae, C.A.; Ghiurea, M.; Trusca, R.; Damian, C.M. Structural and morphological characterization of bacterial cellulose nano-reinforcements prepared by mechanical route. Mater. Des. 2016, 110, 790–801. [Google Scholar] [CrossRef]
- Salehi, N.; Mirjalili, B.B.F. Synthesis of highly substituted dihydro-2-oxopyrroles using fe3o4@nano-cellulose-opo3h as a novel bio-based magnetic nanocatalyst. RSC Adv. 2017, 7, 30303–30309. [Google Scholar] [CrossRef]
- Bratu, I.; Paduraru, M.; Marutoiu, C.; Pop, S.S.F.; Kacso, I.; Tanaselia, C.; Marutoiu, O.F.; Sandu, I.C.A. Multianalytical study on two wooden icons from the beginning of the eighteenth century evaluation of conservation state. Rev. Chim. 2016, 67, 2383–2388. [Google Scholar]
- Rufian-Henares, J.A.; de la Cueva, S.P. Antimicrobial activity of coffee melanoidins-a study of their metal-chelating properties. J. Agric. Food Chem. 2009, 57, 432–438. [Google Scholar] [CrossRef] [PubMed]
- Muller, C.; Hofmann, T. Quantitative studies on the formation of phenol/2-furfurylthiol conjugates in coffee beverages toward the understanding of the molecular mechanisms of coffee aroma staling. J. Agric. Food Chem. 2007, 55, 4095–4102. [Google Scholar] [CrossRef] [PubMed]
- Hofmann, T.; Schieberle, P. Chemical interactions between odor-active thiols and melanoidins involved in the aroma staling of coffee beverages. J. Agric. Food Chem. 2002, 50, 319–326. [Google Scholar] [CrossRef] [PubMed]
- Kluge, M.; Veigel, S.; Pinkl, S.; Henniges, U.; Zollfrank, C.; Rossler, A.; Gindl-Altmutter, W. Nanocellulosic fillers for waterborne wood coatings: Reinforcement effect on free-standing coating films. Wood Sci. Technol. 2017, 51, 601–613. [Google Scholar] [CrossRef]
- Panaitescu, D.M.; Frone, A.N.; Chiulan, I.; Gabor, R.A.; Spataru, I.C.; Casarica, A. Biocomposites from polylactic acid and bacterial cellulose nanofibers obtained by mechanical treatment. Bioresources 2017, 12, 662–672. [Google Scholar] [CrossRef]
- Colson, J.; Bauer, W.; Mayr, M.; Fischer, W.; Gindl-Altmutter, W. Morphology and rheology of cellulose nanofibrils derived from mixtures of pulp fibres and papermaking fines. Cellulose 2016, 23, 2439–2448. [Google Scholar] [CrossRef]
- Yue, Y.Y.; Han, J.Q.; Han, G.P.; Zhang, Q.G.; French, A.D.; Wu, Q.L. Characterization of cellulose i/ii hybrid fibers isolated from energycane bagasse during the delignification process: Morphology, crystallinity and percentage estimation. Carbohydr. Polym. 2015, 133, 438–447. [Google Scholar] [CrossRef] [PubMed]
- Pavaloiu, R.D.; Stoica-Guzun, A.; Stroescu, M.; Dobre, T. Use of bacterial cellulose as reinforcement agent and as coating agent in drug release applications. Rev. Chim. 2014, 65, 852–855. [Google Scholar]
- Cocinero, E.J.; Gamblin, D.P.; Davis, B.G.; Simons, J.P. The building blocks of cellulose: The intrinsic conformational structures of cellobiose, its epimer, lactose, and their singly hydrated complexes. J. Am. Chem. Soc. 2009, 131, 11117–11123. [Google Scholar] [CrossRef] [PubMed]
- Wang, J.P.; El-Sayed, M.A. Temperature jump-induced secondary structural change of the membrane protein bacteriorhodopsin in the premelting temperature region: A nanosecond time-resolved fourier transform infrared study. Biophys. J. 1999, 76, 2777–2783. [Google Scholar] [CrossRef]
- Klemm, D.; Heublein, B.; Fink, H.P.; Bohn, A. Cellulose: Fascinating biopolymer and sustainable raw material. Angew. Chem. Int. Ed. 2005, 44, 3358–3393. [Google Scholar] [CrossRef] [PubMed]
- Gwon, J.G.; Lee, S.Y.; Doh, G.H.; Kim, J.H. Characterization of chemically modified wood fibers using ftir spectroscopy for biocomposites. J. Appl. Polym. Sci. 2010, 116, 3212–3219. [Google Scholar] [CrossRef]
- Pandey, K.K. A study of chemical structure of soft and hardwood and wood polymers by ftir spectroscopy. J. Appl. Polym. Sci. 1999, 71, 1969–1975. [Google Scholar] [CrossRef]
- Stoica-Guzun, A.; Stroescu, M.; Jinga, S.I.; Mihalache, N.; Botez, A.; Matei, C.; Berger, D.; Damian, C.M.; Ionita, V. Box-behnken experimental design for chromium(vi) ions removal by bacterial cellulose-magnetite composites. Int. J. Biol. Macromol. 2016, 91, 1062–1072. [Google Scholar] [CrossRef] [PubMed]
- Rantanen, J.; Dimic-Misic, K.; Kuusisto, J.; Maloney, T. The effect of micro and nanofibrillated cellulose water uptake on high filler content composite paper properties and furnish dewatering. Cellulose 2015, 22, 4003–4015. [Google Scholar] [CrossRef]
- Chowdhury, Z.Z.; Abd Hamid, S.B. Preparation and characterization of nanocrystalline cellulose using ultrasonication combined with a microwave-assisted pretreatment process. Bioresources 2016, 11, 3397–3415. [Google Scholar] [CrossRef]
- Yildirim, N.; Shaler, S. A study on thermal and nanomechanical performance of cellulose nanomaterials (CNs). Materials 2017, 10, 718. [Google Scholar] [CrossRef] [PubMed]
- Tang, Y.J.; Shen, X.C.; Zhang, J.H.; Guo, D.L.; Kong, F.G.; Zhang, N. Extraction of cellulose nano-crystals from old corrugated container fiber using phosphoric acid and enzymatic hydrolysis followed by sonication. Carbohydr. Polym. 2015, 125, 360–366. [Google Scholar] [CrossRef] [PubMed]
- Amin, M.; Abadi, A.G.; Katas, H. Purification, characterization and comparative studies of spray-dried bacterial cellulose microparticles. Carbohydr. Polym. 2014, 99, 180–189. [Google Scholar] [CrossRef] [PubMed]


| Sample | Xc | 2θ1 (°) | d1 (Å) | 2θ2 (°) | d2 (Å) | 2θ3 (°) | d3 (Å) | D (nm) | Z |
|---|---|---|---|---|---|---|---|---|---|
| K 0 | 37% | 14.49 | 6.104 | 16.84 | 5.260 | 22.64 | 3.922 | 6.060 | +9.955 |
| K 1M | 80% | 14.47 | 6.115 | 16.74 | 5.289 | 22.58 | 3.933 | 5.672 | +9.202 |
| K 4M | 87% | 14.53 | 6.081 | 16.80 | 5.273 | 22.59 | 3.931 | 5.713 | +4.889 |
| K AT | 63% | 14.50 | 6.101 | 16.83 | 5.261 | 22.61 | 3.928 | 5.520 | +9.357 |
| K B | 42.5% | 14.05 | 6.296 | 16.86 | 5.253 | 22.61 | 3.929 | 5.981 | +43.092 |
| K CM | 21.5% | 14.55 | 6.082 | 16.85 | 5.256 | 22.66 | 3.920 | 5.664 | +6.591 |
| K M1P | 28% | 14.67 | 6.031 | 16.84 | 5.258 | 22.61 | 3.928 | 6.228 | −2.223 |
| K M10P | 42% | 14.56 | 6.076 | 16.67 | 5.311 | 22.59 | 3.932 | 6.030 | +0.615 |
| K M25P | 46% | 14.51 | 6.096 | 16.70 | 5.302 | 22.60 | 3.930 | 5.312 | +4.812 |
| MC 0 | 79% | 14.91 | 5.934 | 16.64 | 5.322 | 22.57 | 3.934 | 5.970 | −24.418 |
| MC 1P | 39% | 14.74 | 6.002 | 16.46 | 5.380 | 22.62 | 3.927 | 4.760 | −18.137 |
| MC 10P | 42% | 14.71 | 6.014 | 16.35 | 5.416 | 22.60 | 3.930 | 4.770 | −19.353 |
| MC 25P | 69% | 14.75 | 6 | 16.64 | 5.323 | 22.64 | 3.924 | 4.890 | −13.330 |
| Concentration | 5.7 × 10⁻⁴% w/v | 5.7 × 10⁻⁵% w/v | |||||
|---|---|---|---|---|---|---|---|
| Sample | Dm, nm | PdI | P1...n, nm | Dm, nm | PdI | P1...n, nm | Zeta, mV |
| K_M1P | 2199 | 1.000 | P1 = 276 | 568 | 0.453 | P1 = 436 | −10.4 |
| K_M10P | 1617 | 0.154 | P1 = 1873 | 632 | 0.480 | P1 = 558 P2 = 54 | −10.2 |
| K_M25P | 1117 | 0.551 | P1 = 677 | 1183 | 0.684 | P1 = 1366 P2 = 170 | −13.1 |
| MC_1P | 906 | 0.236 | P1 = 848 | 419 | 0.392 | P1 = 422 P2 = 74 | −28.6 |
| MC_10P | 830 | 0.530 | P1 = 644 P2 = 74 | 597 | 0.815 | P1 = 604 P2 = 95 | −32.5 |
| MC_25P | 643 | 0.406 | P1 = 477 | 674 | 0.419 | P1 = 621 P2 = 66 | −20.8 |
| Sample | Ton | Td | Residue at 700 °C |
|---|---|---|---|
| K 0 | 298.7 | 346.6 | 26.5 |
| K 4M | 253.9 | 273.9/328.3 | 28.8 |
| K AT | 329.4 | 363.5 | 11.9 |
| K CM | 282.5 | 338.0 | 13.7 |
| MC 0 | 320.6 | 339.3 | 4.0 |
© 2017 by the authors. Licensee MDPI, Basel, Switzerland. This article is an open access article distributed under the terms and conditions of the Creative Commons Attribution (CC BY) license (http://creativecommons.org/licenses/by/4.0/).
Share and Cite
Dima, S.-O.; Panaitescu, D.-M.; Orban, C.; Ghiurea, M.; Doncea, S.-M.; Fierascu, R.C.; Nistor, C.L.; Alexandrescu, E.; Nicolae, C.-A.; Trică, B.; et al. Bacterial Nanocellulose from Side-Streams of Kombucha Beverages Production: Preparation and Physical-Chemical Properties. Polymers 2017, 9, 374. https://doi.org/10.3390/polym9080374
Dima S-O, Panaitescu D-M, Orban C, Ghiurea M, Doncea S-M, Fierascu RC, Nistor CL, Alexandrescu E, Nicolae C-A, Trică B, et al. Bacterial Nanocellulose from Side-Streams of Kombucha Beverages Production: Preparation and Physical-Chemical Properties. Polymers. 2017; 9(8):374. https://doi.org/10.3390/polym9080374
Chicago/Turabian StyleDima, Stefan-Ovidiu, Denis-Mihaela Panaitescu, Csongor Orban, Marius Ghiurea, Sanda-Maria Doncea, Radu Claudiu Fierascu, Cristina Lavinia Nistor, Elvira Alexandrescu, Cristian-Andi Nicolae, Bogdan Trică, and et al. 2017. "Bacterial Nanocellulose from Side-Streams of Kombucha Beverages Production: Preparation and Physical-Chemical Properties" Polymers 9, no. 8: 374. https://doi.org/10.3390/polym9080374