1. Introduction
Coatings of particle–polymer composites are ubiquitous in a myriad of applications, including lithium-ion and other advanced battery technologies that are predicted to play substantial roles in growing concerns over the energy and environmental landscape [
1]. Both material- and device-level limitations play a role in determining battery performance, lifetime, and cost. One of the greatest of these limitations is charge transport. Electrodes must have sufficiently fast electron and ion transport to utilize the electrochemically active material and prevent resistive losses. The rate of transport is determined not only by material properties, but also by the electrode microstructure [
2,
3]. Recent studies suggest that the final “dry” microstructure is determined by the initial “wet” microstructure of the colloidal slurries formed during electrode processing [
4,
5,
6,
7,
8,
9,
10,
11,
12,
13,
14,
15,
16,
17].
Considerable effort has been dedicated to the effects of electrode slurry composition and formulation on battery performance. In order to eliminate transport effects when developing new materials, academic battery formulations can include up to 20 wt % conductive additive [
18]. Industrial formulations have much lower additive concentrations, typically less than 5 wt %, to minimize the mass and volume of electrochemically inert components. For these conductive additive-starved systems, achieving the optimal electrode microstructure is much more critical. Research has shown that, when colloidal electrode slurries form gel-like microstructures, the resulting batteries perform superior to those formed from fluid-like microstructures [
4,
5,
9]. In gel-like slurries, the formation of a percolating network of conductive additive provides pathways for rapid electronic transport and prevents polymer migration during drying [
19,
20,
21]. Inducing gelation in electrode slurries is therefore paramount in manufacturing high-performing batteries.
Wet battery slurries are known to form colloidal gels induced by polymer depletion interactions. Electrode slurries include polymer binder to improve the mechanical strength of the electrode and the adhesion between dried electrode and current collector (e.g., aluminum foil) [
22]. This polymer has the added effect of inducing an interparticle attraction potential,
Udep, which promotes particle aggregation [
23,
24,
25,
26,
27,
28,
29,
30,
31,
32,
33]. The strength of the interparticle interaction scales strongly with polymer concentration. In the limit of a high polymer concentration,
Udep >>
kBT and the particles form permanent linkages. Battery slurries are expected to be in this limit. Typical polymer concentrations in battery slurries reach up to 1–2 wt % in industrial formulations and up to 15 wt % in academic formulations [
18].
For the case of high polymer concentration,
Udep >>
kBT, Poon et al. derived an analytical expression for the critical gelation volume fraction,
, taking into account gravity and is given by
where
a is the particle radius,
is the fractal dimension, and
is the difference between solvent and particle density [
30,
32]. Equation (1) is derived by relating the gravitational Peclet number,
Pe
g, to the critical gelation cluster radius,
. In other words, Equation (1) determines the minimum volume fraction at which volume spanning aggregation occurs before particles settle due to gravity. In the case of battery slurries, nanometer-scale particles of conductive carbon black (CB, ρ = 1.9 g/cm
3) are mixed with micrometer-scale particles of mixed-metal oxides such as Ni
0.33Mn
0.33Co
0.33O
2 (NMC, ρ = 5.18 g/cm
3). Due to the high densities of CB and NMC, we expect a competition between aggregation kinetics and gravitational settling of particles. Active material particles typically range from 1 to 50 µm in diameter and by definition are non-Brownian due to size and density, i.e.,
Pe
g > 10. Note that Equation (1) predicts that there is no critical gel concentration for active material due to the dominant gravitational force. Conductive additive particles rarely exceed 100 nm in diameter and are typically considered colloidal. The smaller CB particles could form a gel depending on their size and aggregation kinetics. It is not clear from current colloidal theory whether the mixture of CB and NMC particles should form a volume spanning gel, but experimental evidence suggests they do [
4,
9]. We hypothesize that, when such a particle mixture forms a gel, it must be primarily due to a critical volume fraction of small conductive additive particles.
Currently, colloidal gel theory does not have a prediction for the critical volume fraction of a binary population of particle sizes. Experimental work has focused on the study of bimodal particle size distributions and their effect on aggregation behavior. Reported findings include a measure of dynamic viscosity as a function of particle size distribution [
33,
34,
35,
36]. There is little experimental work on the effects of particle size distributions on the fundamental microstructure of the underlying mixture. Additionally, these previous studies have considered only neutrally buoyant particles of the same chemistry, while many applications, including battery slurries, contain dissimilar non-buoyant particles. The lack of knowledge predicting fluid microstructure for colloidal slurries with multiple particle populations limits the ability of designing optimal processes for electrode manufacturing. In this work, we present a fundamental study of gelation in polydisperse systems. We determine
experimentally for a system of nanometer-scale colloidal carbon black (CB), a common conductive additive in lithium-ion batteries, and for a mixed system of CB and micrometer-scale non-Brownian Ni
0.33Mn
0.33Co
0.33O
2 (NMC), a state-of-the-art battery material. We find that non-Brownian particles do not participate in the percolating network and therefore leave the value of
relatively unchanged.
2. Materials and Methods
Materials and Sample Preparation: Nano-sized carbon black, CB, was used as received (Super C65, Timcal, Bodio, Switzerland). The reported particle size was 100 nm [
37]. Lithium Nickel Manganese Cobalt Oxide (Ni
0.33Mn
0.33Co
0.33O
2), NMC, was used as received (NM-3100, Toda America, Battle Creek, MI, USA). The reported average particle size was 10 microns. Polyvinylidene difluoride, PVDF,
Mw = 380,000 (Arkema, Kynar 301F, King of Prussia, PA, USA) was used as received. 1-Methyl-2-pyrrolidinone, NMP, was used as the solvent (Sigma Aldrich, purity ≥99.0%, St. Louis, MO, USA). Sodium dodecyl sulfate, SDS, was used as received (Alfa Aesar, Tewksbury, MA, USA). The polymer concentration,
cp = 48 mg/mL for all experiments and the volume fraction of carbon black varied with respect to solvent. In the mixed particle case, the volume fraction of NMC was maintained at 0.26 with respect to solvent only.
represents a tradeoff between an appropriate viscosity for coating electrodes and limited solvent for faster electrode drying [
18,
38]. Samples were mixed in a planetary mixer (Thinky Corporation, ARE-250, Laguna Hills, CA, USA). The mixing protocol is as follows: (1) The binder and solvent were mixed at 1800 rpm for 10 min and (2) CB and NMC were added separately to the polymer solution and mixed at 1800 rpm for 7.5 min.
Rheological Characterization: Oscillatory rheometry is performed on an AR-2000 rheometer (TA Instruments, Newcastle, DE, USA) using the Peltier plate setup and a 40 mm parallel plate geometry at T = 25 °C. Samples were loaded onto the parallel plate either by pouring or gently with a spatula. The geometry was lowered slowly to ensure no entrainment of air bubbles. The parallel plate geometry was chosen to minimize confinement effects. The linear viscoelastic measurements were measured, as were various gap heights ranging from h = 300 μm to 1 mm in order to determine gap effects. The results show that, at h ≤ 500 μm, gap effects are absent. All reported measurements were independently confirmed using the ARES G2 rheometer (TA Instruments, Newcastle, DE, USA) with a 25 mm parallel plate geometry. The data reported only reflect measurements made with the AR-2000, (TA Instruments, Newcastle, DE, USA). Oscillatory strain sweep (fixed angular frequency, ω = 1 rad/s) and frequency sweep (fixed strain amplitude, γ = 0.003) measurements were performed after a waiting time of 5–10 min to ensure sample equilibration or longer to ensure the normal force returned to zero.
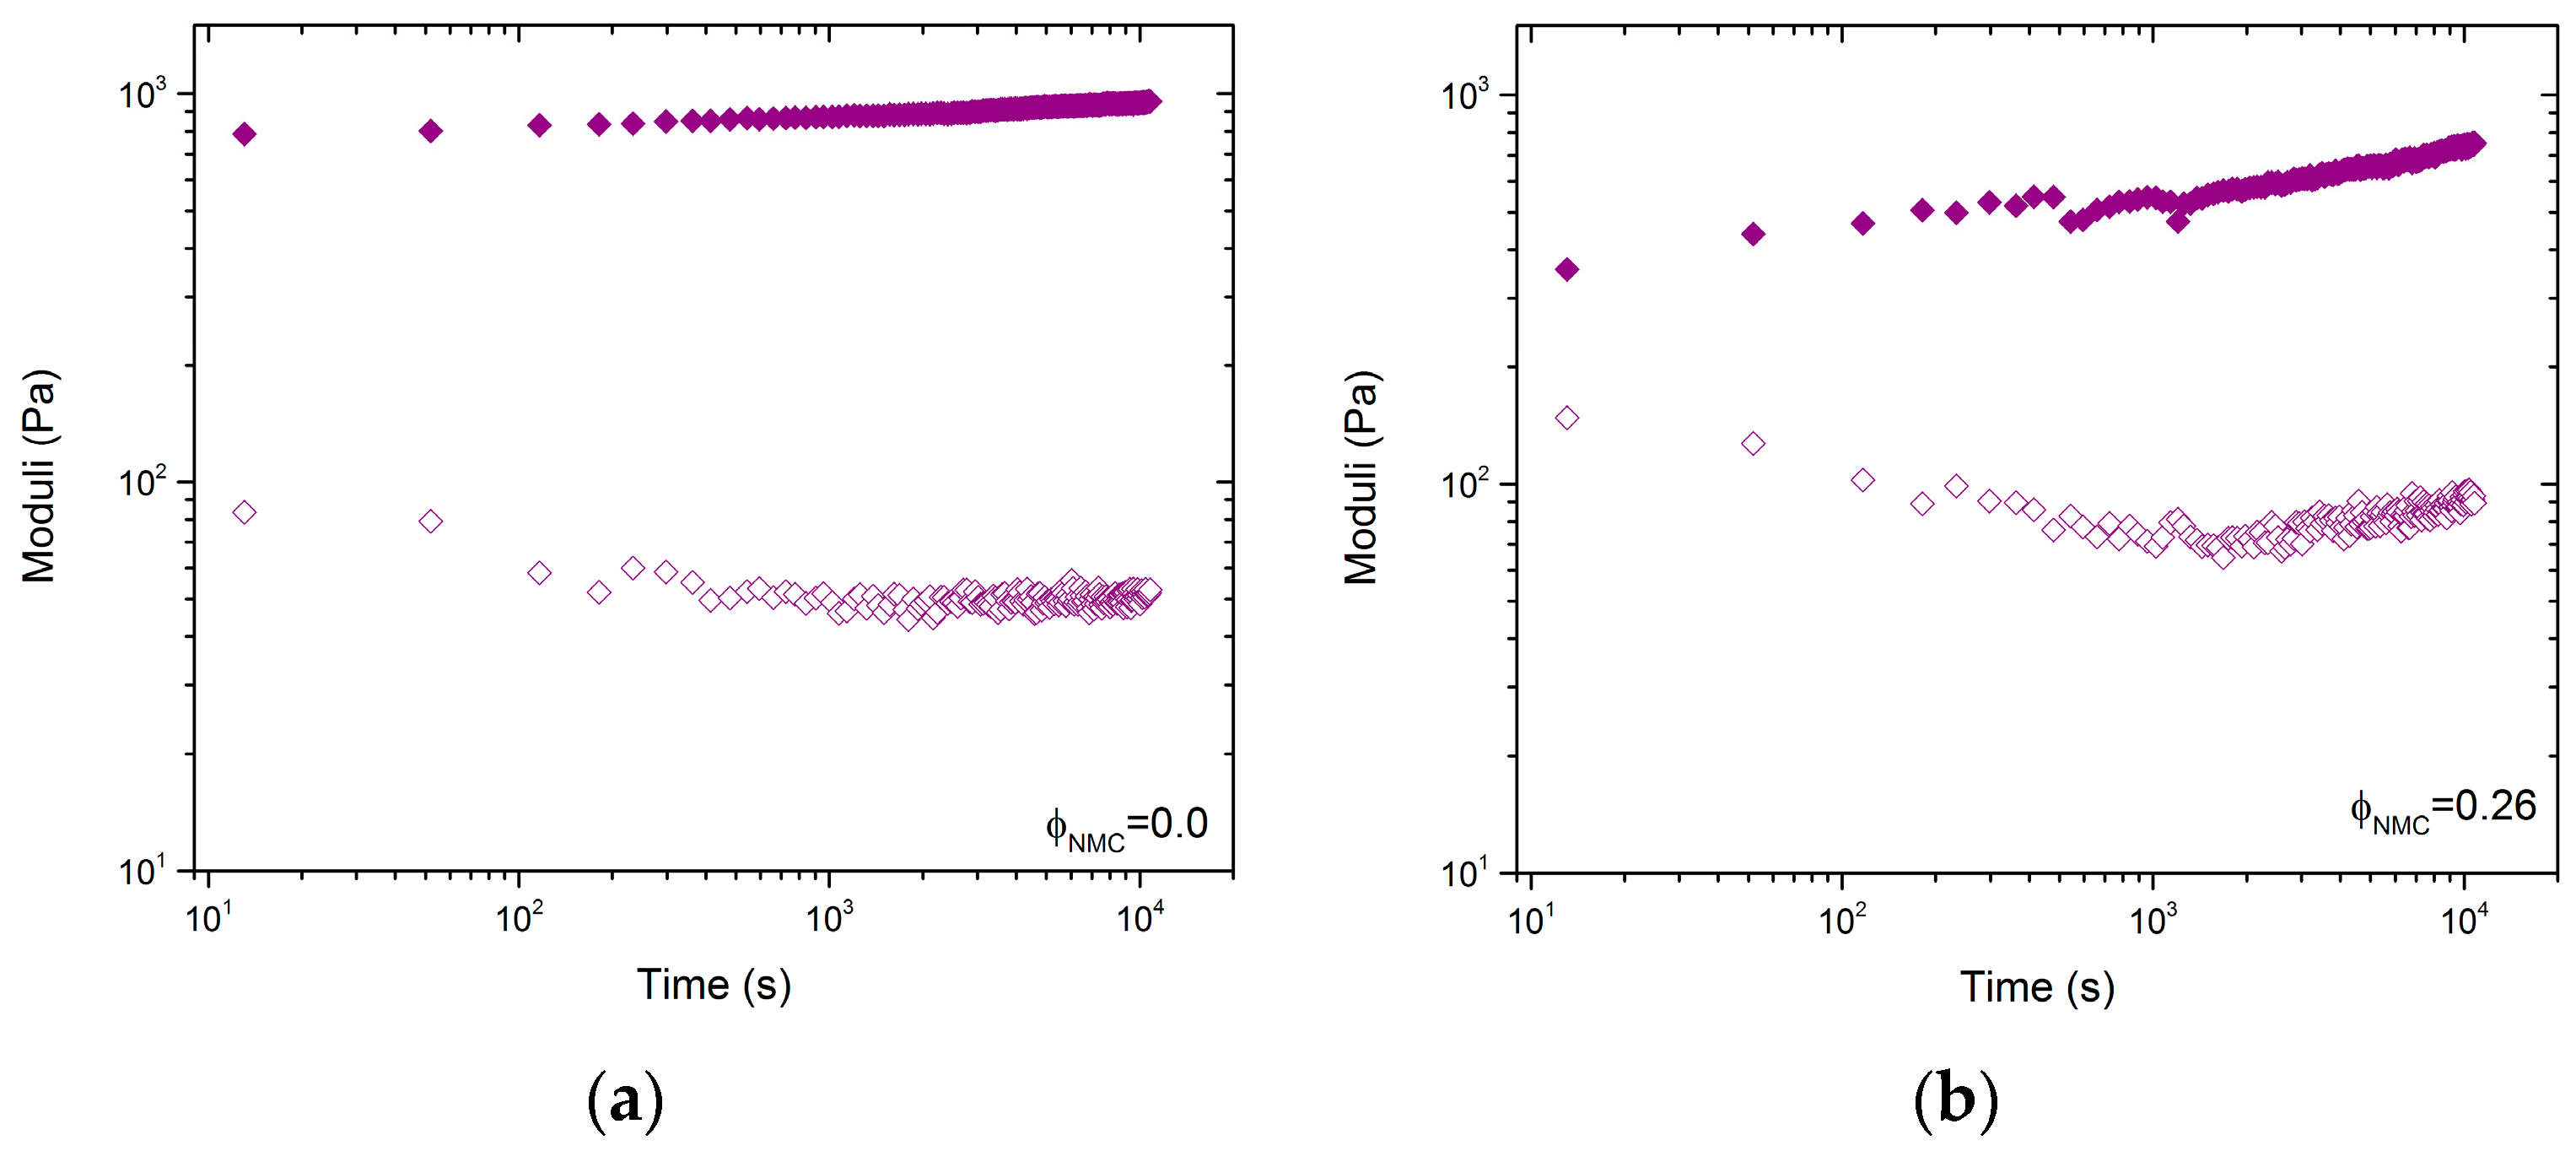
Although the time scale of gelation was not the main focus of this paper, time sweeps were performed on samples with ϕCB = 0.025, ϕNMC = 0, and ϕCB = 0.025, ϕNMC = 0.26. Samples were loaded onto the AR-2000 (TA Instruments, Newcastle, DE, USA) gently with a spatula and placed on a Peltier plate (TA Instruments, Newcastle, DE, USA). Samples were tested at 25 °C with a 40 mm diameter parallel plate geometry at a gap height of 500 μm. The samples were pre-sheared at a rate of 100 rad/s for 5 min prior to measuring the time sweep recovery. Due to the length of the experiments a silicone oil bath was used to prevent solvent evaporation. G’ and G” were reported at 1 rad/s and 0.3% strain over a 3 h period, after the samples were sheared at 100 1/s for 5 min.
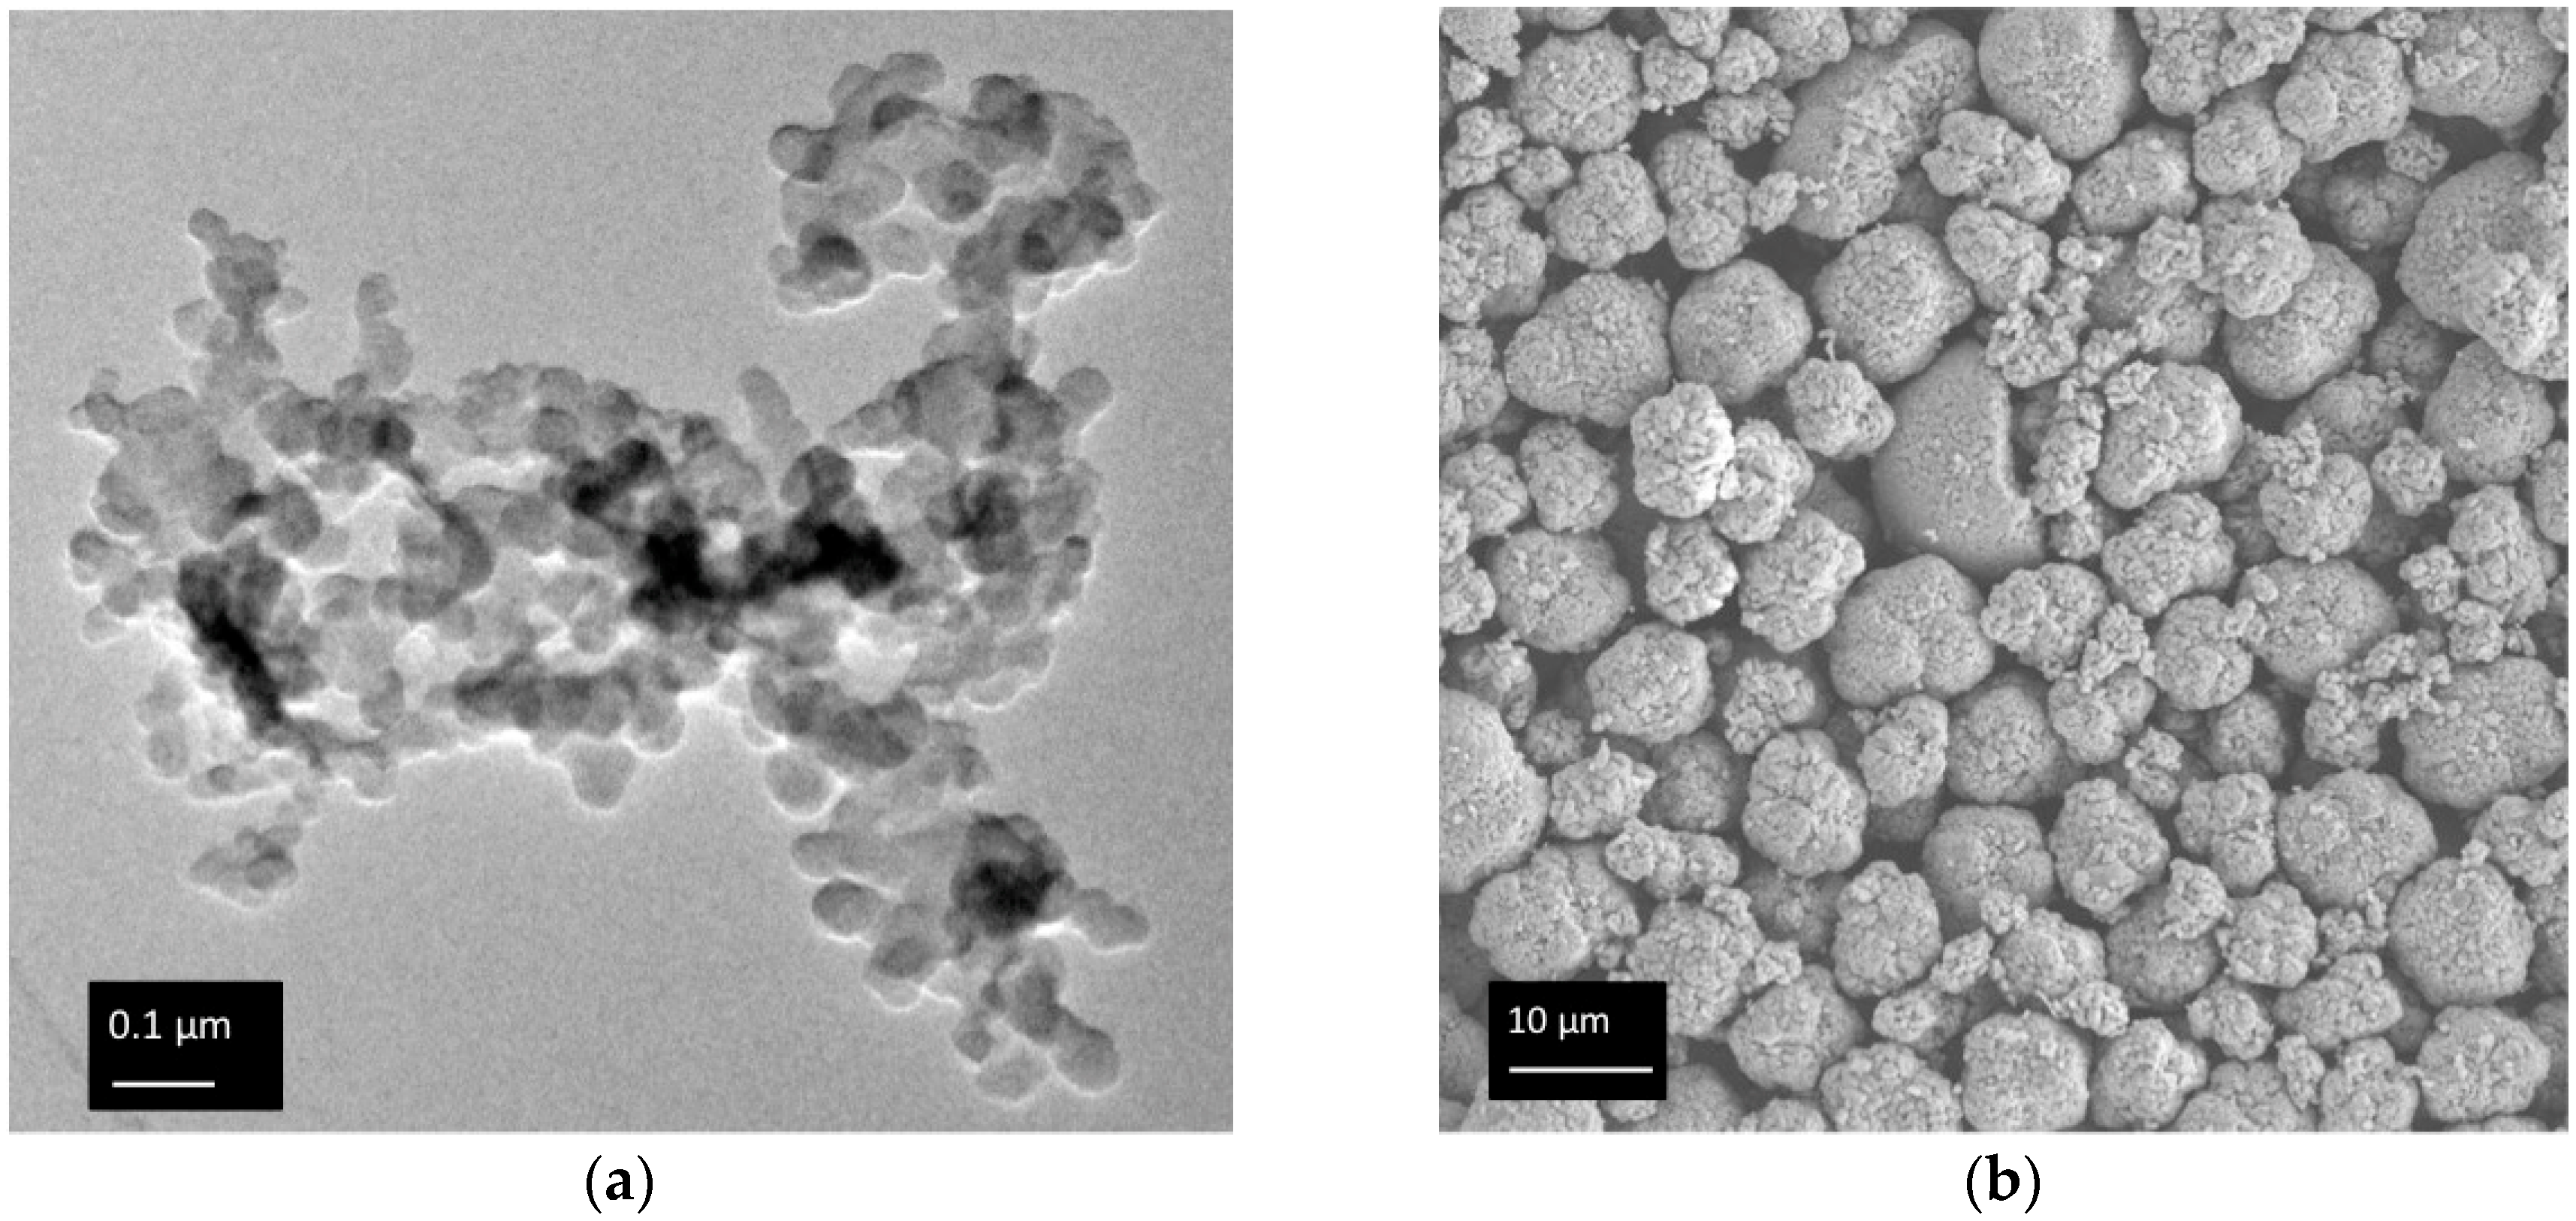
Particle Size Characterization: DLS and TEM samples of CB in water were prepared by mixing 0.04 mg of CB in 20 mL of a 0.17 mM SDS solution. Measurements were made below the critical micelle concentration of SDS (CMC = 8.2 mM). The SDS was used to stabilize the CB suspension; the particles aggregate and settle out otherwise. DLS measurements were made on a Brookhaven D90, (Brookhaven Instruments, Holtsville, NY, USA) using a 90° scattering angle. Samples were sonicated for 5 min before DLS measurements were taken in an attempt to break up secondary aggregates. The number average particle diameter was determined as the mean of the best fit distribution, dCB = 100 nm. TEM pictures were carried out on a JEOL JEM2100 (Peabody, MA, USA). Samples were prepared by dip drying of CB SDS solutions onto a TEM grid (Pacific Grid Tech, 400-mesh, San Francisco, CA, USA). The NMC particles were imaged using a Zeiss Supra 50 VP Scanning Electron Microscope (Zeiss Group, Pleasonton, CA, USA) (SEM).
Microstructure Characterization: Samples were deposited on a glass slide and gently sandwiched with another glass slide for optical imaging. Images were collected using a stereo microscope with digital camera, model MU130 (AMSCOPE, Irvine, CA, USA) with 1× and 4× magnification in transmission mode. The images were analyzed using Matlab® (Mathworks, Natick, MA, USA) and the “boxcount” package to determine the fractal dimension.
4. Discussion
Zaccone et al. suggest that the mechanism of aggregation can be readily determined via analysis of the relaxation spectrum
H(τ) as a function of time [
39]. There are three unique aggregation mechanisms: irreversible, reversible, and chemical aggregation. The slope of
H(τ) at low frequency determines which mechanism is dominating. A slope
n < 0 indicates reversible aggregation,
n = 0 indicates irreversible aggregation, and
n > 0 indicates chemical aggregation. To turn
G’ and
G’’ data into
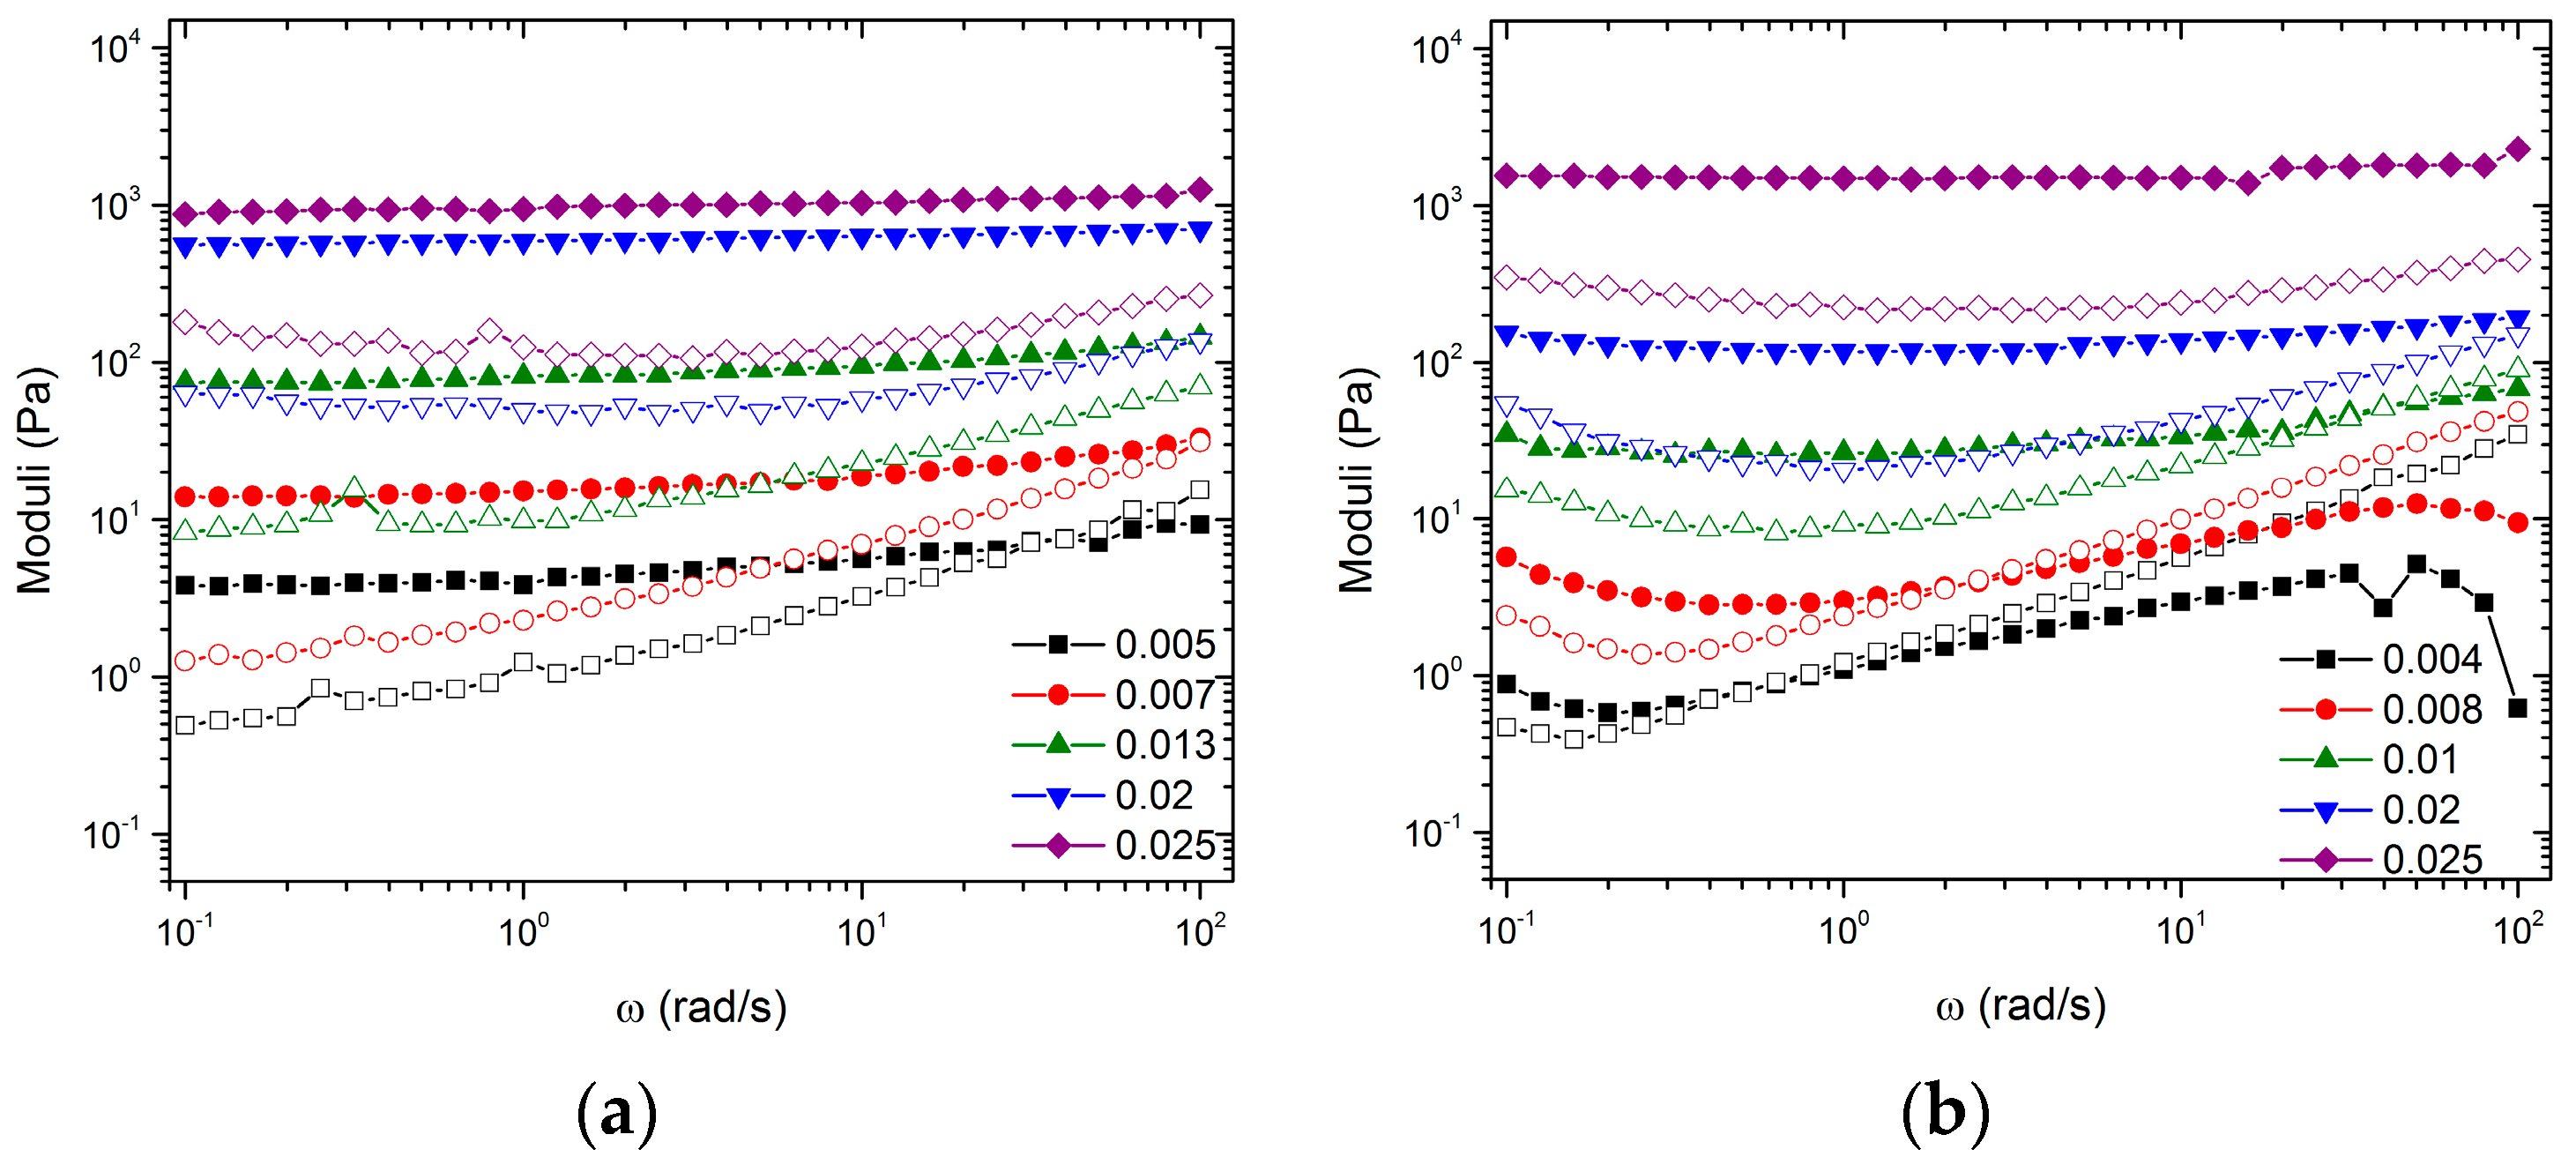
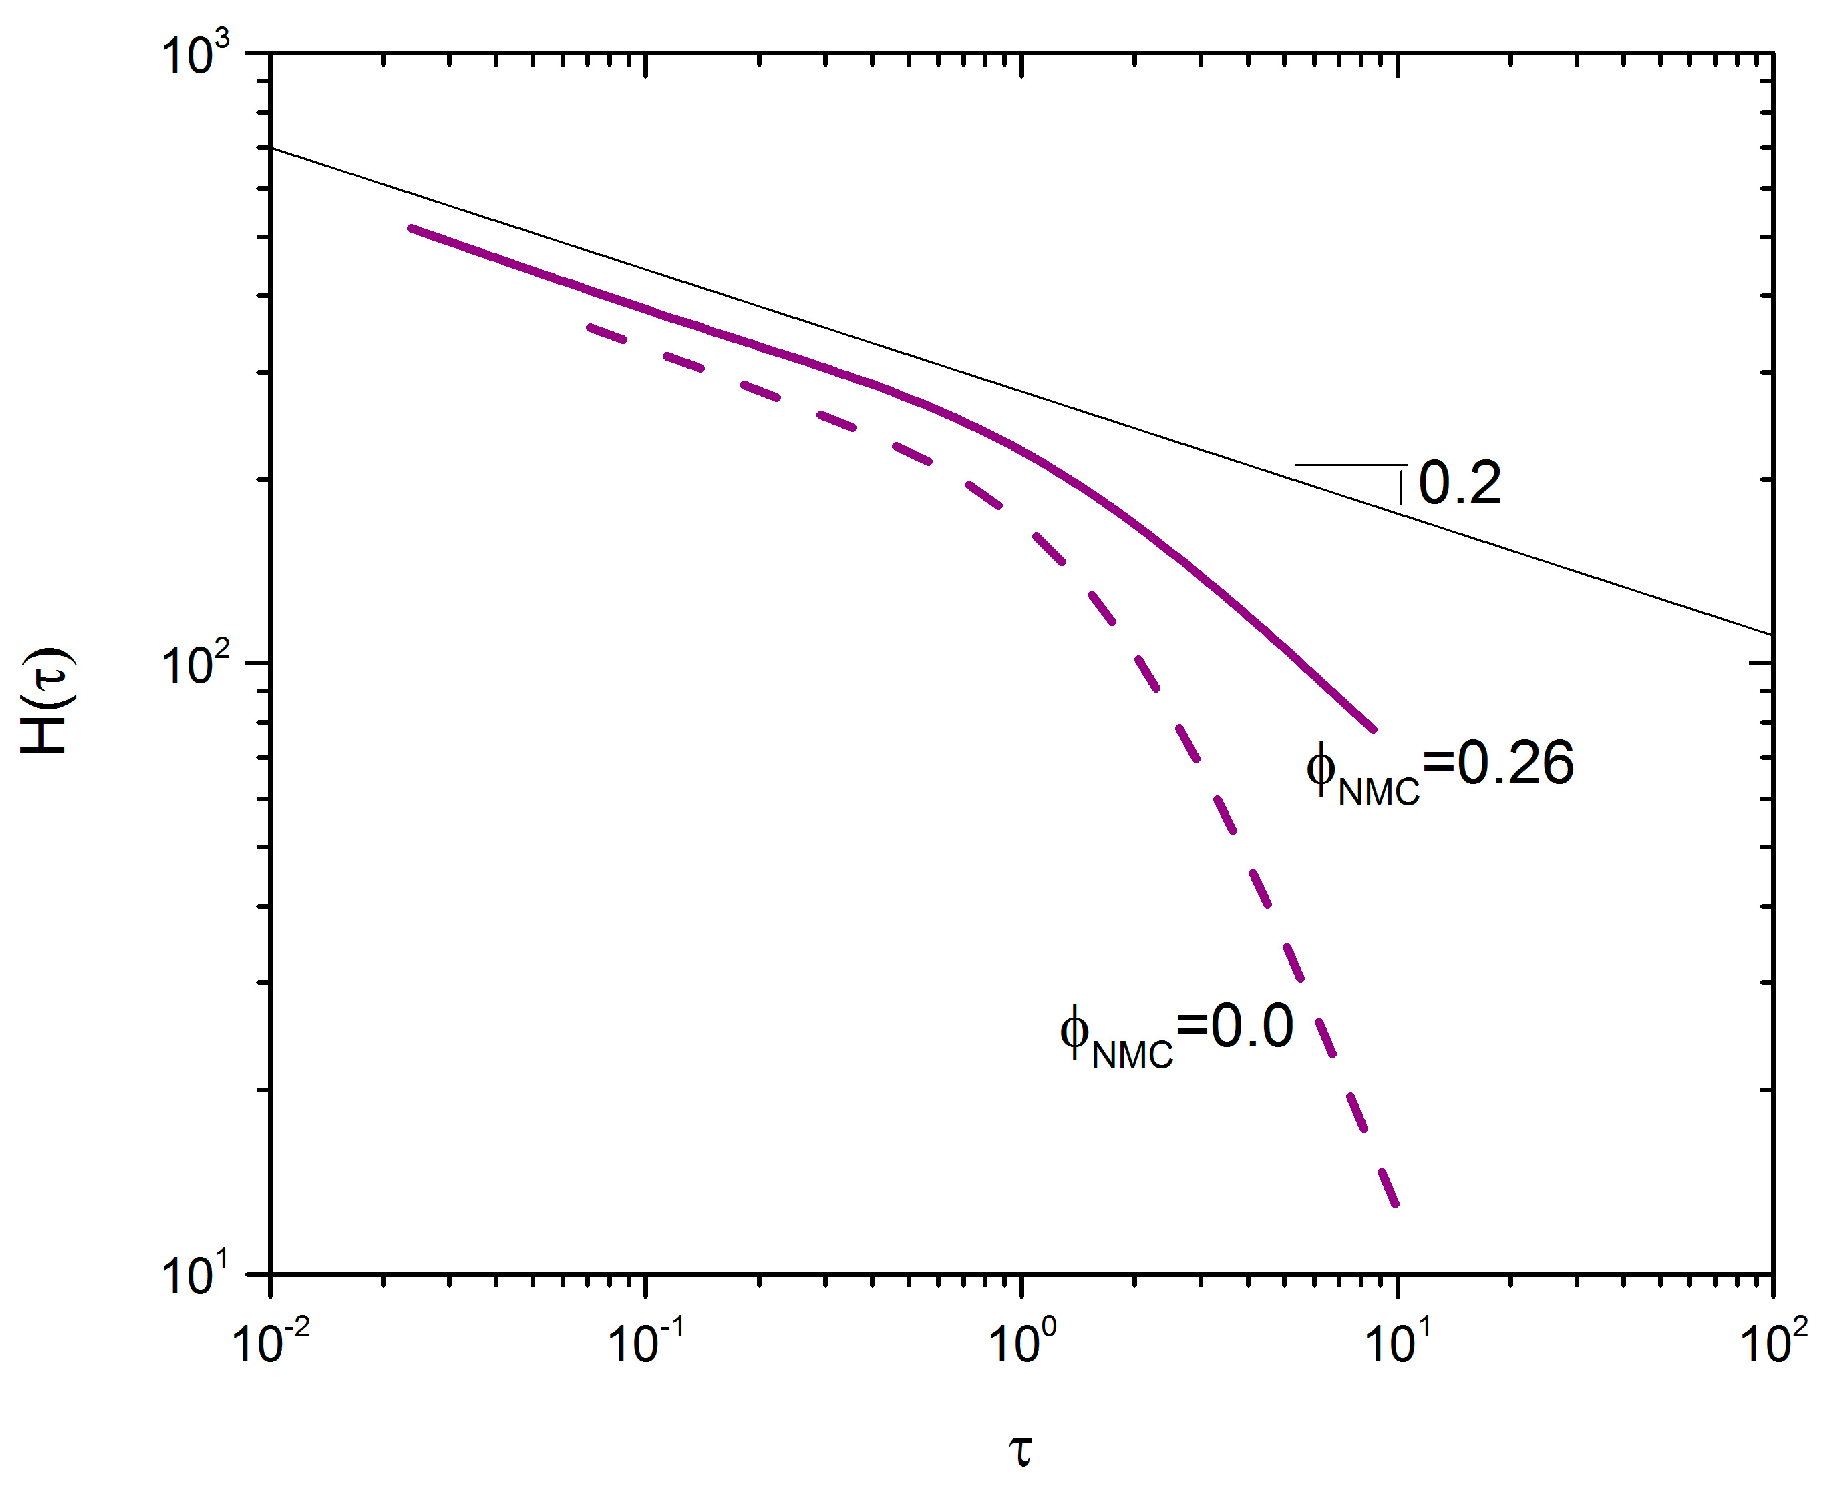
H(τ), a discrete relaxation spectrum,
G(τ), was fit to the frequency sweep data reported in
Figure 2. The Maxwell modes were then used to determine
H(τ) [
40]:
Figure 5 shows
H(τ) for samples with
. The two curves with and without NMC particles have very similar negative slopes at low frequency,
n = –0.2, which suggests a mixed aggregation mechanism that is closer to irreversible aggregation [
39]. This is in-line with the time sweep data in
Figure 4, which shows very fast recovery of the modulus—typical of irreversible DLCA [
39]. Furthermore, the inflection point, which indicates the maximum relaxation time scale,
, is of the same order of magnitude in both cases. This suggests that the inclusion of non-Brownian NMC particles does not significantly change the relaxation time of the aggregates. This is arguably supported by
Figure 4, where both samples exhibit similar relaxation times.
In the reversible aggregation limit,
n = 0.5, Zaccone et al. determined an equation for the critical attraction energy,
, between two colloidal particles required to have gelation at steady state. While the analysis above clearly indicates that the CB system is not within this limit, it is interesting to calculate a critical potential assuming the reversible aggregation limit is valid.
is given by
where
is the correlation length between voids normalized by the particle radius, and
is the solid volume fraction. For CB and PVDF, we have estimated
, from
,
nm and
nm, and
[
28]. This result insinuates that the minimum interaction energy between particles is close to the diffusion energy, consistent with the observed flocculation and subsequent settling of CB in the absence of polymer. However, our experimental data suggests that we are between the two limits of reversible and irreversible aggregation, whereby the above equation for
is not expected to hold.
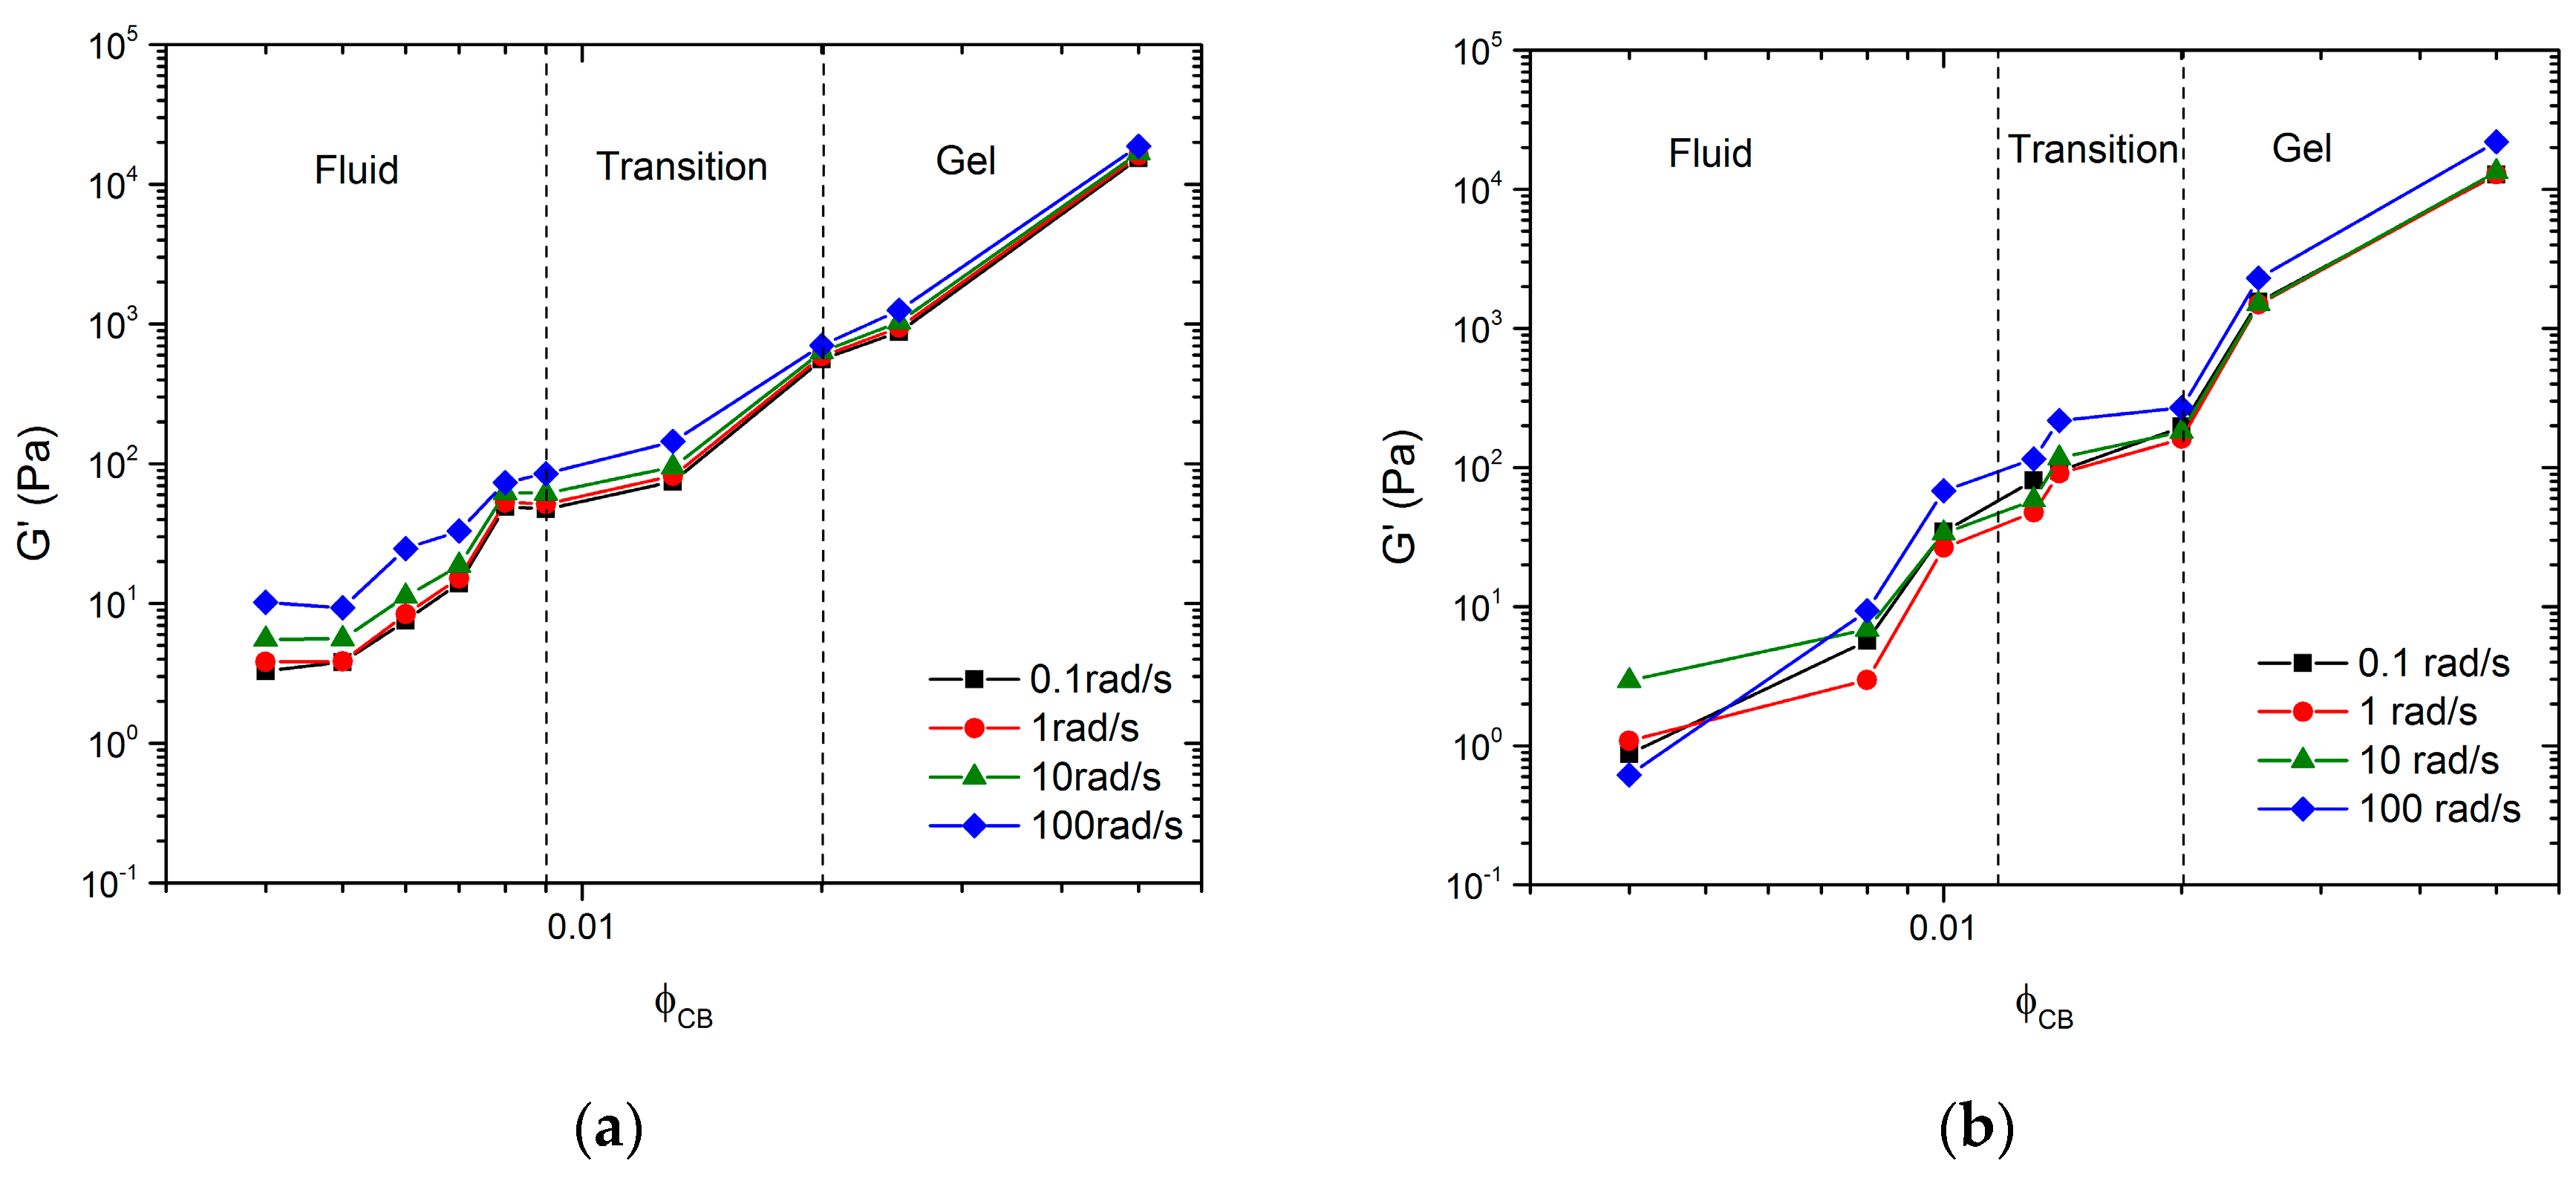
Data from the frequency sweeps shown in
Figure 2a,b can be plotted as the magnitude of
G’ versus
for specific frequencies. These representations for
and
are shown in
Figure 6a,b, respectively. The figures identify three regimes: a fluid regime, a transition regime, and a strong gel regime. These regimes were identified using both frequency sweep data from
Figure 2 and direct observations (see
Section 3.1), similar to work done by Laurati et al. [
24]. In
Figure 6a, the fluid regime is defined as
since these samples exhibit fluid-like behavior, denoted by the observation of particle sedimentation over time, by viscosity similar to the pure solvent, and low
G’ and
G” magnitudes. The transition regime is defined for
, similar to the observations of Laurati et al., since such samples showed a seemingly high viscosity compared to the pure solvent, but flowed when the vial was inverted [
24]. The gel regime was defined for
, since these samples exhibit characteristics of a strong gel; i.e., they do not flow when the sample vial is inverted and must be scooped instead of poured. Furthermore,
G’ and
G” are relatively flat and weak functions of ω, which is a typical indication of a network. In
Figure 6b, for the mixed particle system, the fluid regime is defined as
since all samples in this concentration regime showed fluid-like properties, i.e., a very little qualitative change in sample viscosity from the pure solvent. The transition regime is defined as
, since such samples exhibit much higher viscosities than expected for the given particle concentrations, but still flow when the vial is inverted. For
, the samples again exhibit characteristics of a strong gel; i.e., they do not flow when inverted and show no signs of sedimentation. In both systems, we define
as the critical gelation limit. We used bright field microscopy images to better understand the microstructure of these regimes.
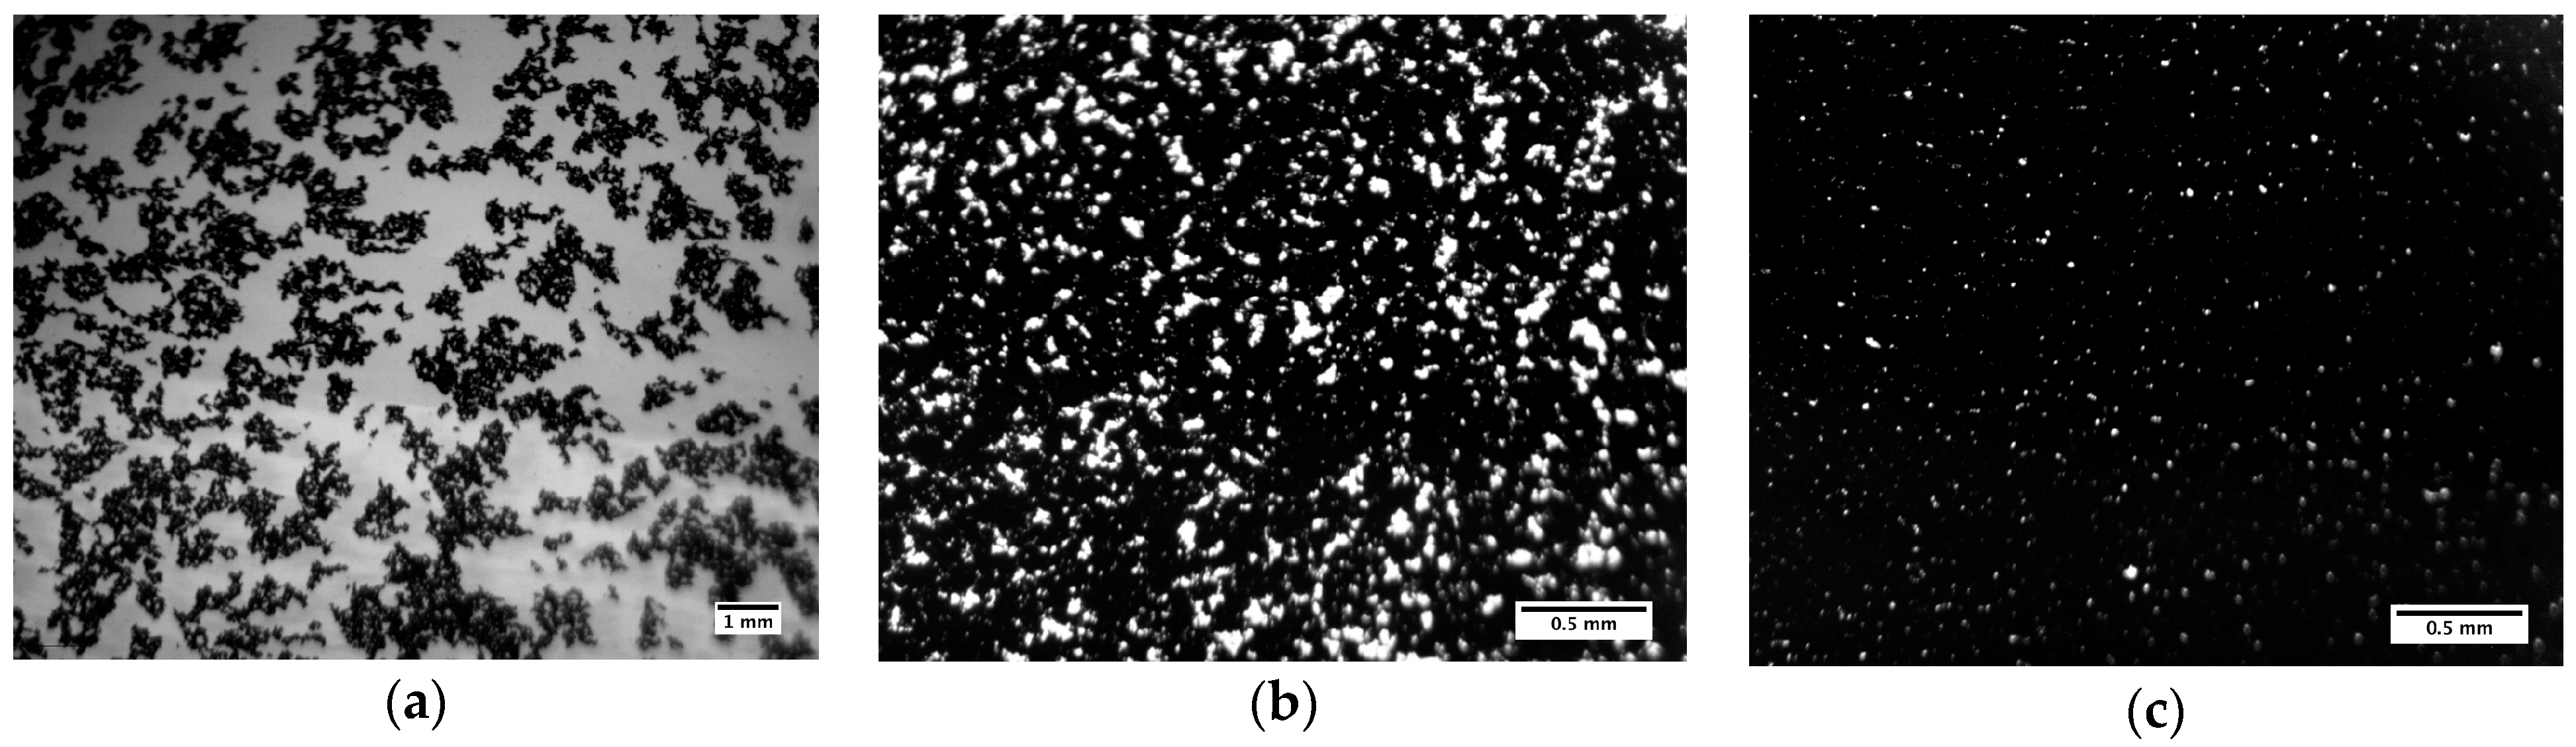
Figure 7 shows three bright field microscopy images for
0.005, 0.013, and 0.02, representing the three regimes identified in rheology for the pure CB solutions. Attempts were made to take similar images of the mixed system; however, due to high NMC loading, little to no transmission of light was observed for all samples. It is evident from
Figure 7a that
0.005 does not show connectivity between carbon aggregates, while
0.013 (
Figure 7b) shows aggregate interconnectivity that appears to span the sample volume.
Figure 7c shows a representative image of
0.02, whereby it becomes very difficult to see any light penetrating the sample. At this volume fraction, the network is both volume spanning and dense. These qualitative observations confirm the different regimes depicted in
Figure 6.
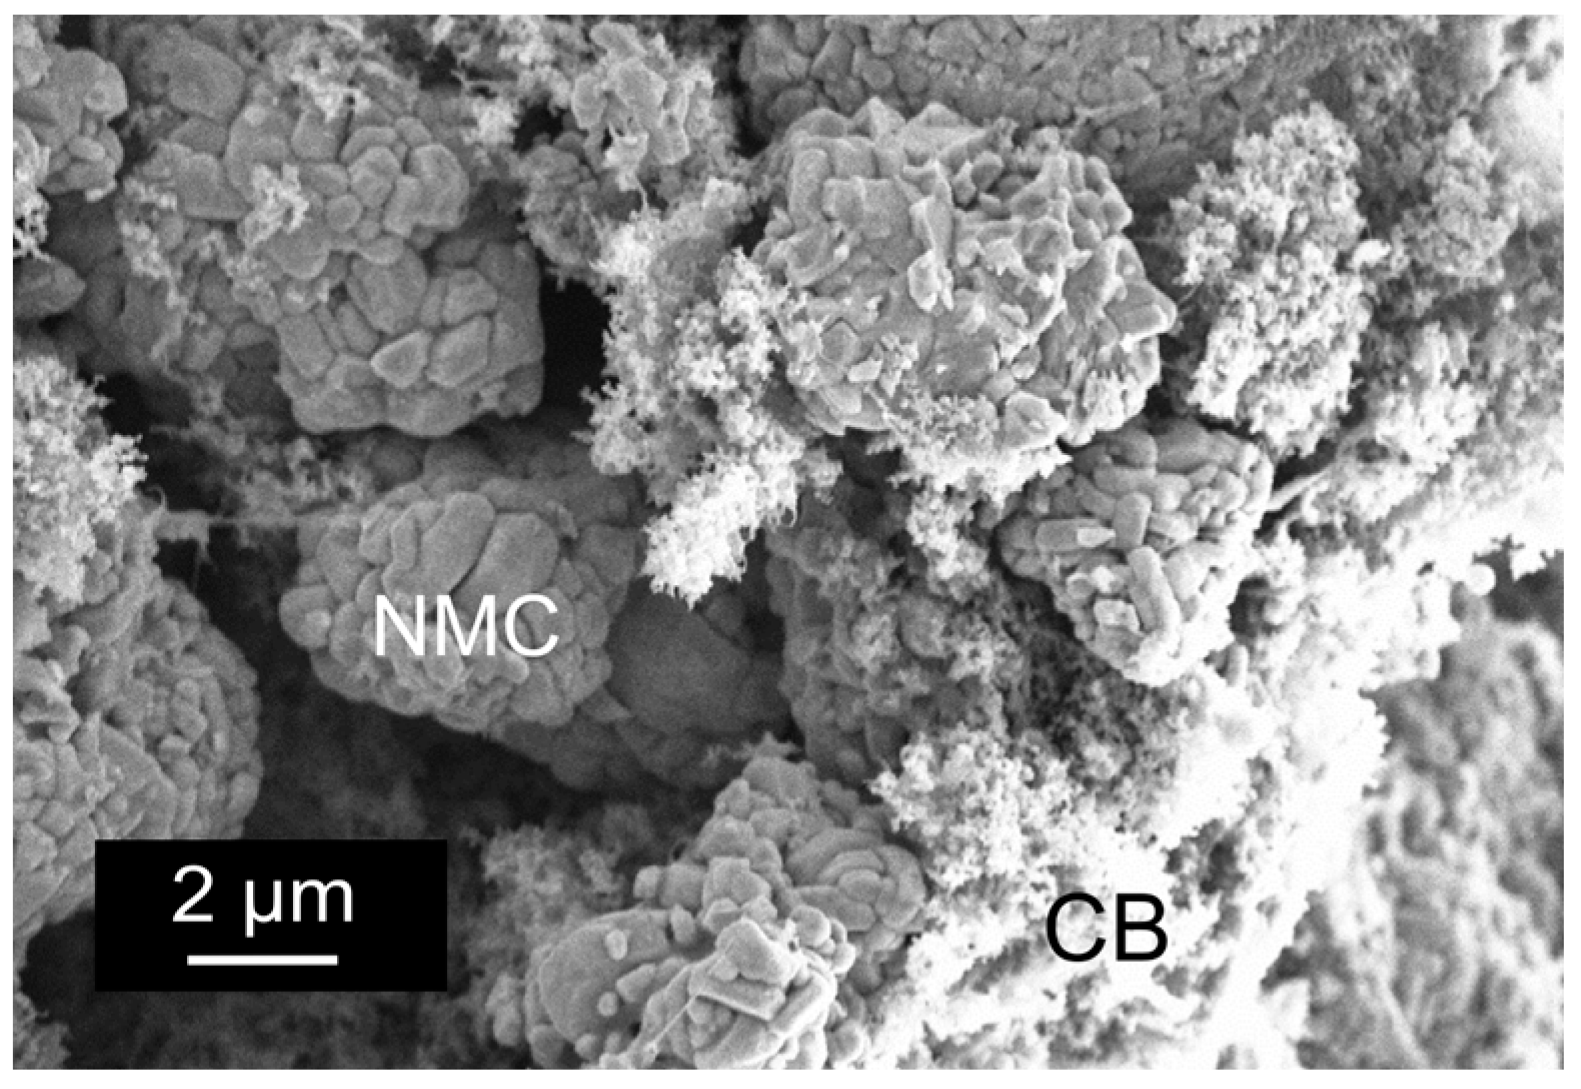
The data clearly show that the inclusion of large non-Brownian particles at significantly high
causes little to no change in the three microstructure regimes. Furthermore, the inclusion of NMC has little to no effect on the mechanism of aggregation nor the critical time scale. The only noticeable change appears to be the lengthening of the fluid regime to higher
and a compaction of the transition regime. Overall, the dependence of
G’ on
and the qualitative behavior of the samples appear the same. At first, this behavior seems counter-intuitive because it was hypothesized that the NMC particles would play an active role in the network formation. As a result, the carbon aggregates would only need to span the distance between particles of NMC instead of the entire solution volume, thus requiring fewer carbon particles to form a network and reducing
. Contrary to this hypothesis,
Figure 8 shows a SEM image of a dried slurry with
. It is evident that the surface of the active material is clear of any noticeable aggregates of carbon black and that the carbon forms an independent network around the NMC particles. SEM therefore supports the rheology data that show that carbon particle network formation is unchanged with the inclusion of NMC particles.
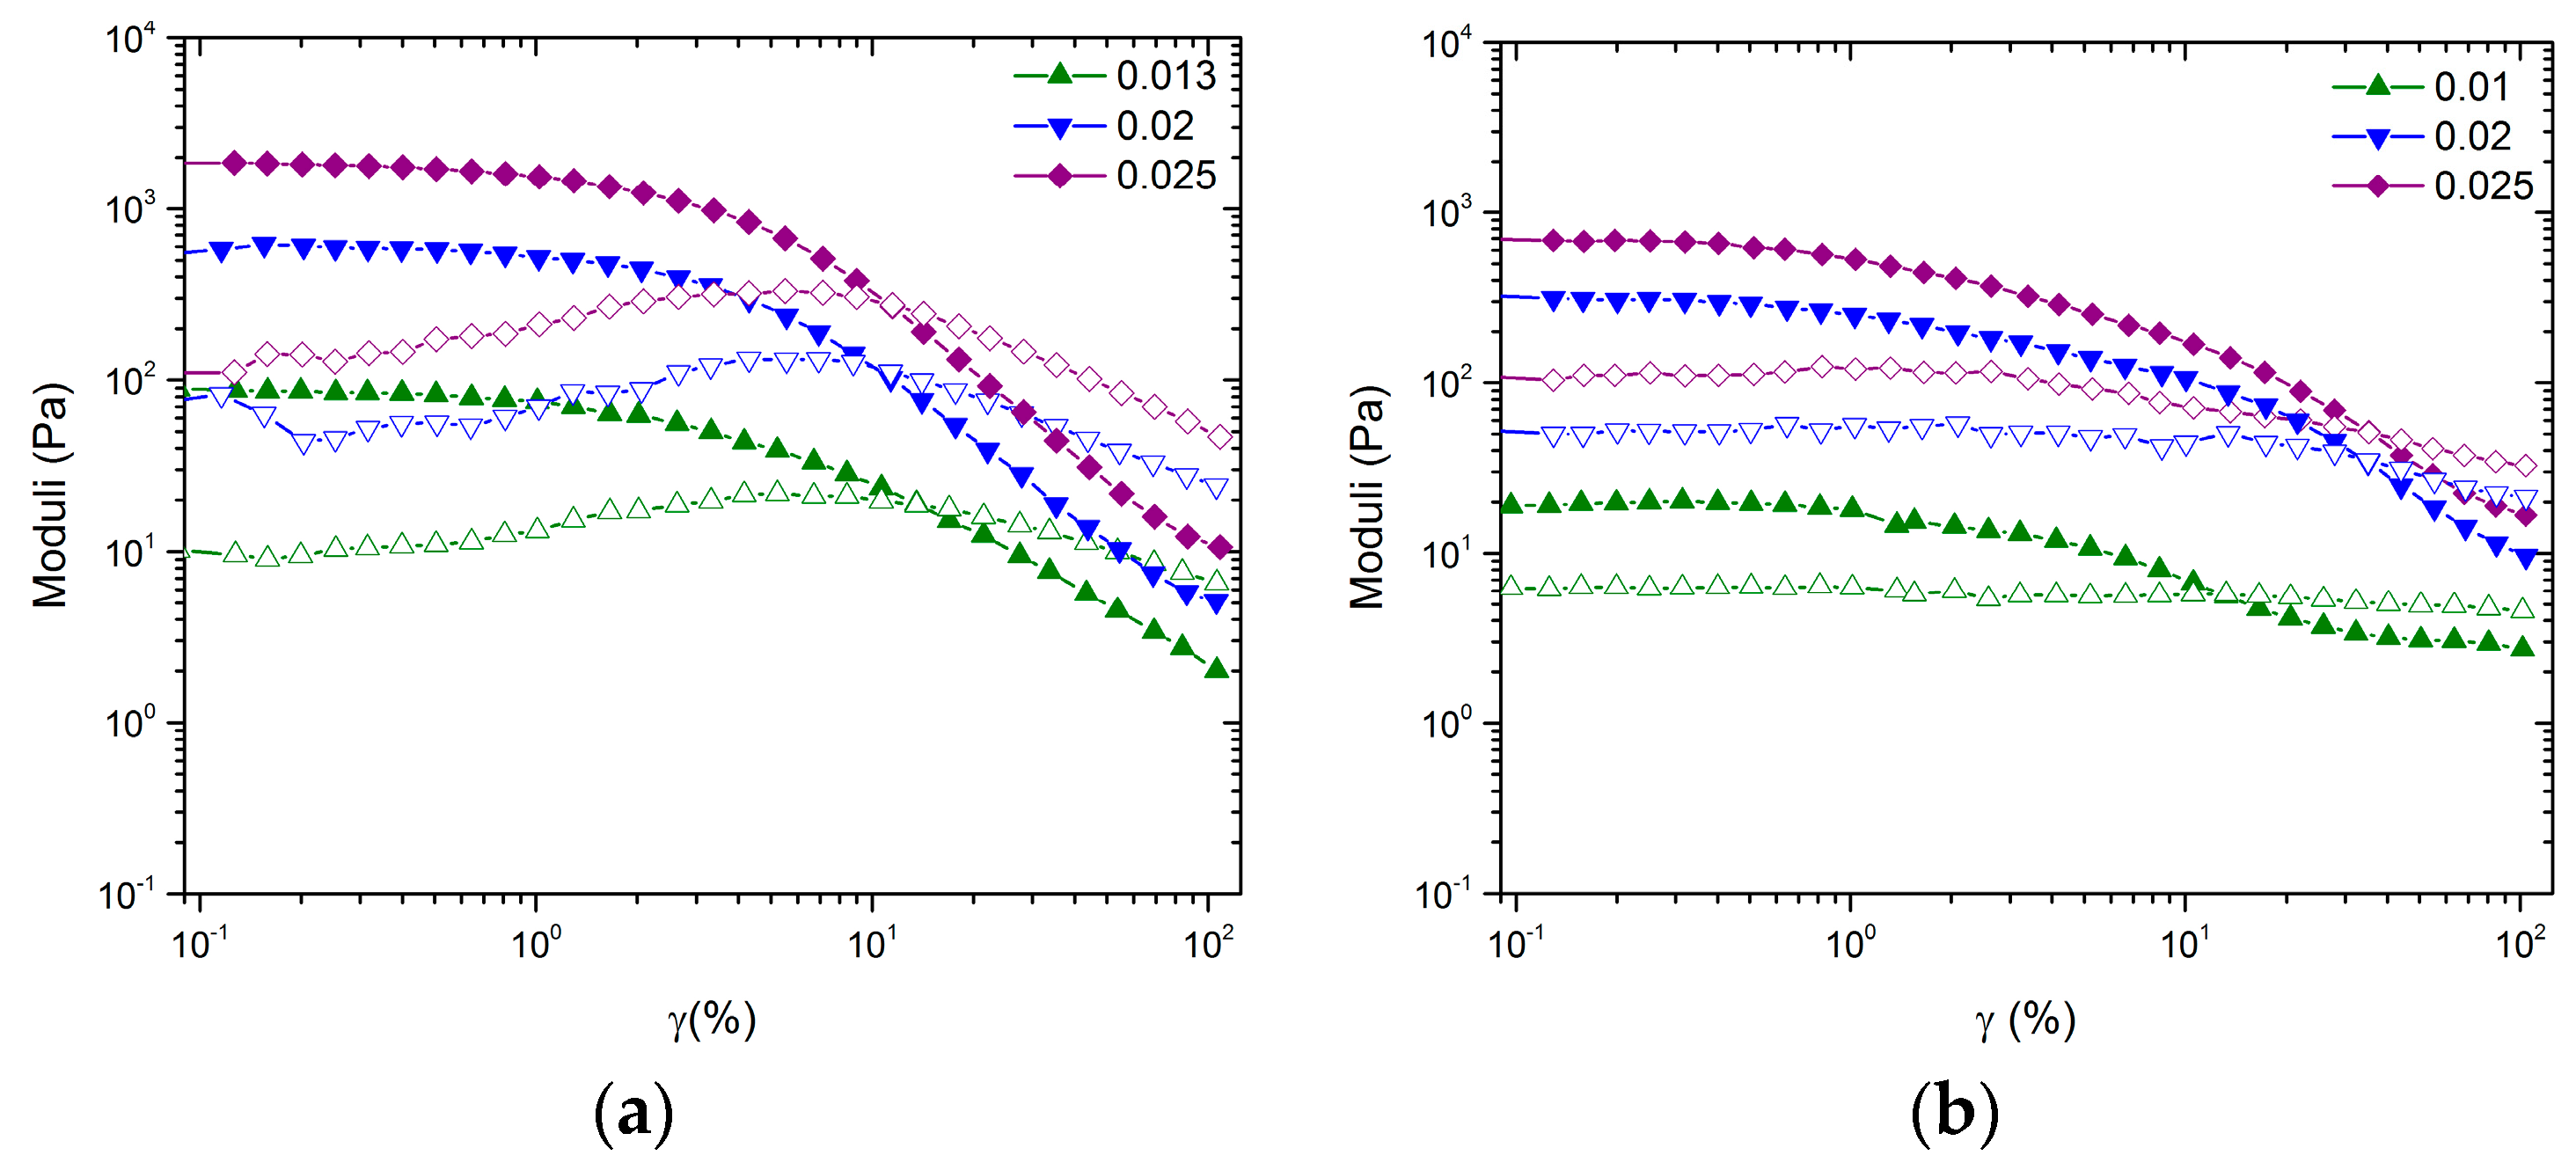
Although no change in
is observed, the inclusion of large NMC particles influences the shape of the LVE response and the amplitude sweep as seen in
Figure 2 and
Figure 3, respectively. The most drastic effect is seen in the stark differences between amplitude sweeps. Although the volume fractions are significantly below the glass transition, the gels formed by CB have tendencies that are similar to those of measurements performed on hard sphere glasses. In the case of
, the shape of the amplitude sweep is like that of hard sphere glasses. In the case of
, the shape of the amplitude sweep is like that of an attractive driven glass [
25]. We hypothesize, similar to the arguments in Pham et al., that the low amplitude decrease of
G’ for the mixed system at approximately
is caused by a rearrangement of the large NMC particles and that the high amplitude decrease is the rearrangement of the topology of nearest neighbors for CB [
25]. Thus, the mixed colloidal systems allow for two-stage yielding, one for larger particles trapped in a network of smaller particles and the second for the smaller particle network.
An important problem in controlling suspension microstructure is predicting
, the particle volume fraction required to induce a phase change. In the work of Poon et al.,
can be predicted from Equation (1) assuming a strong interparticle attraction, which is supported by the analysis of
Figure 5 [
33]. Note that
calculated from Equation (1) is essentially the crossover frequency when aggregation of particles occurs on a similar timescale to settling due to gravity (a necessary constraint if a volume spanning network is to form). We therefore expect
to be closer to our transition regime than to our gelation regime. In all samples,
cp = 48 mg/mL, while
cp*, the overlap concentration, was calculated to be 0.8 mg/mL [
23,
28]. Thus, for all samples studied here, Equation (1) is expected to be applicable. Equation (1) shows that
is extremely sensitive to particle size
a, but industrial battery materials such as CB are polydisperse and nonideal. Based on the TEM in
Figure 1a, small (
a < 20 nm) primary particles of CB form secondary particles of 40 <
a < 200 nm. Some of these secondary particles may consist of primary particles that are chemically fused during synthesis [
41]. The secondary particles form the larger aggregates pictured in
Figure 1a. These larger aggregates are expected to break up when sonicated, resulting in the DLS-measured diameter of 100 nm. The particle radius that governs the rheological response of the slurry is therefore not immediately apparent.
Predicting
also requires knowledge of the fractal dimension
Df. In the case of diffusion-limited cluster aggregation (irreversible aggregation mechanism
n = 0),
Df is expected to be between 1.7 and 1.9 [
33].
Df is typically determined from X-ray, neutron, or light scattering data using
, where
I is the measured intensity, and
q is the scattering vector [
27]. Unfortunately, the CB particle size is too big to measure on our current SAXS setup, as the available
q range only probes the particle diameter dimensions (~100 nm). Light scattering is a possibility, but light transmission through the sample requires a special sample holder with a smaller path length (and is currently under investigation). An alternative method of obtaining
Df is optical microscopy image analysis [
27]. Box-counting analysis [
42] of
Figure 7a yields 1.7 <
Df < 1.8. If
Df < 2, a two-dimensional projection should yield the same
Df as the three-dimensional structure [
27].
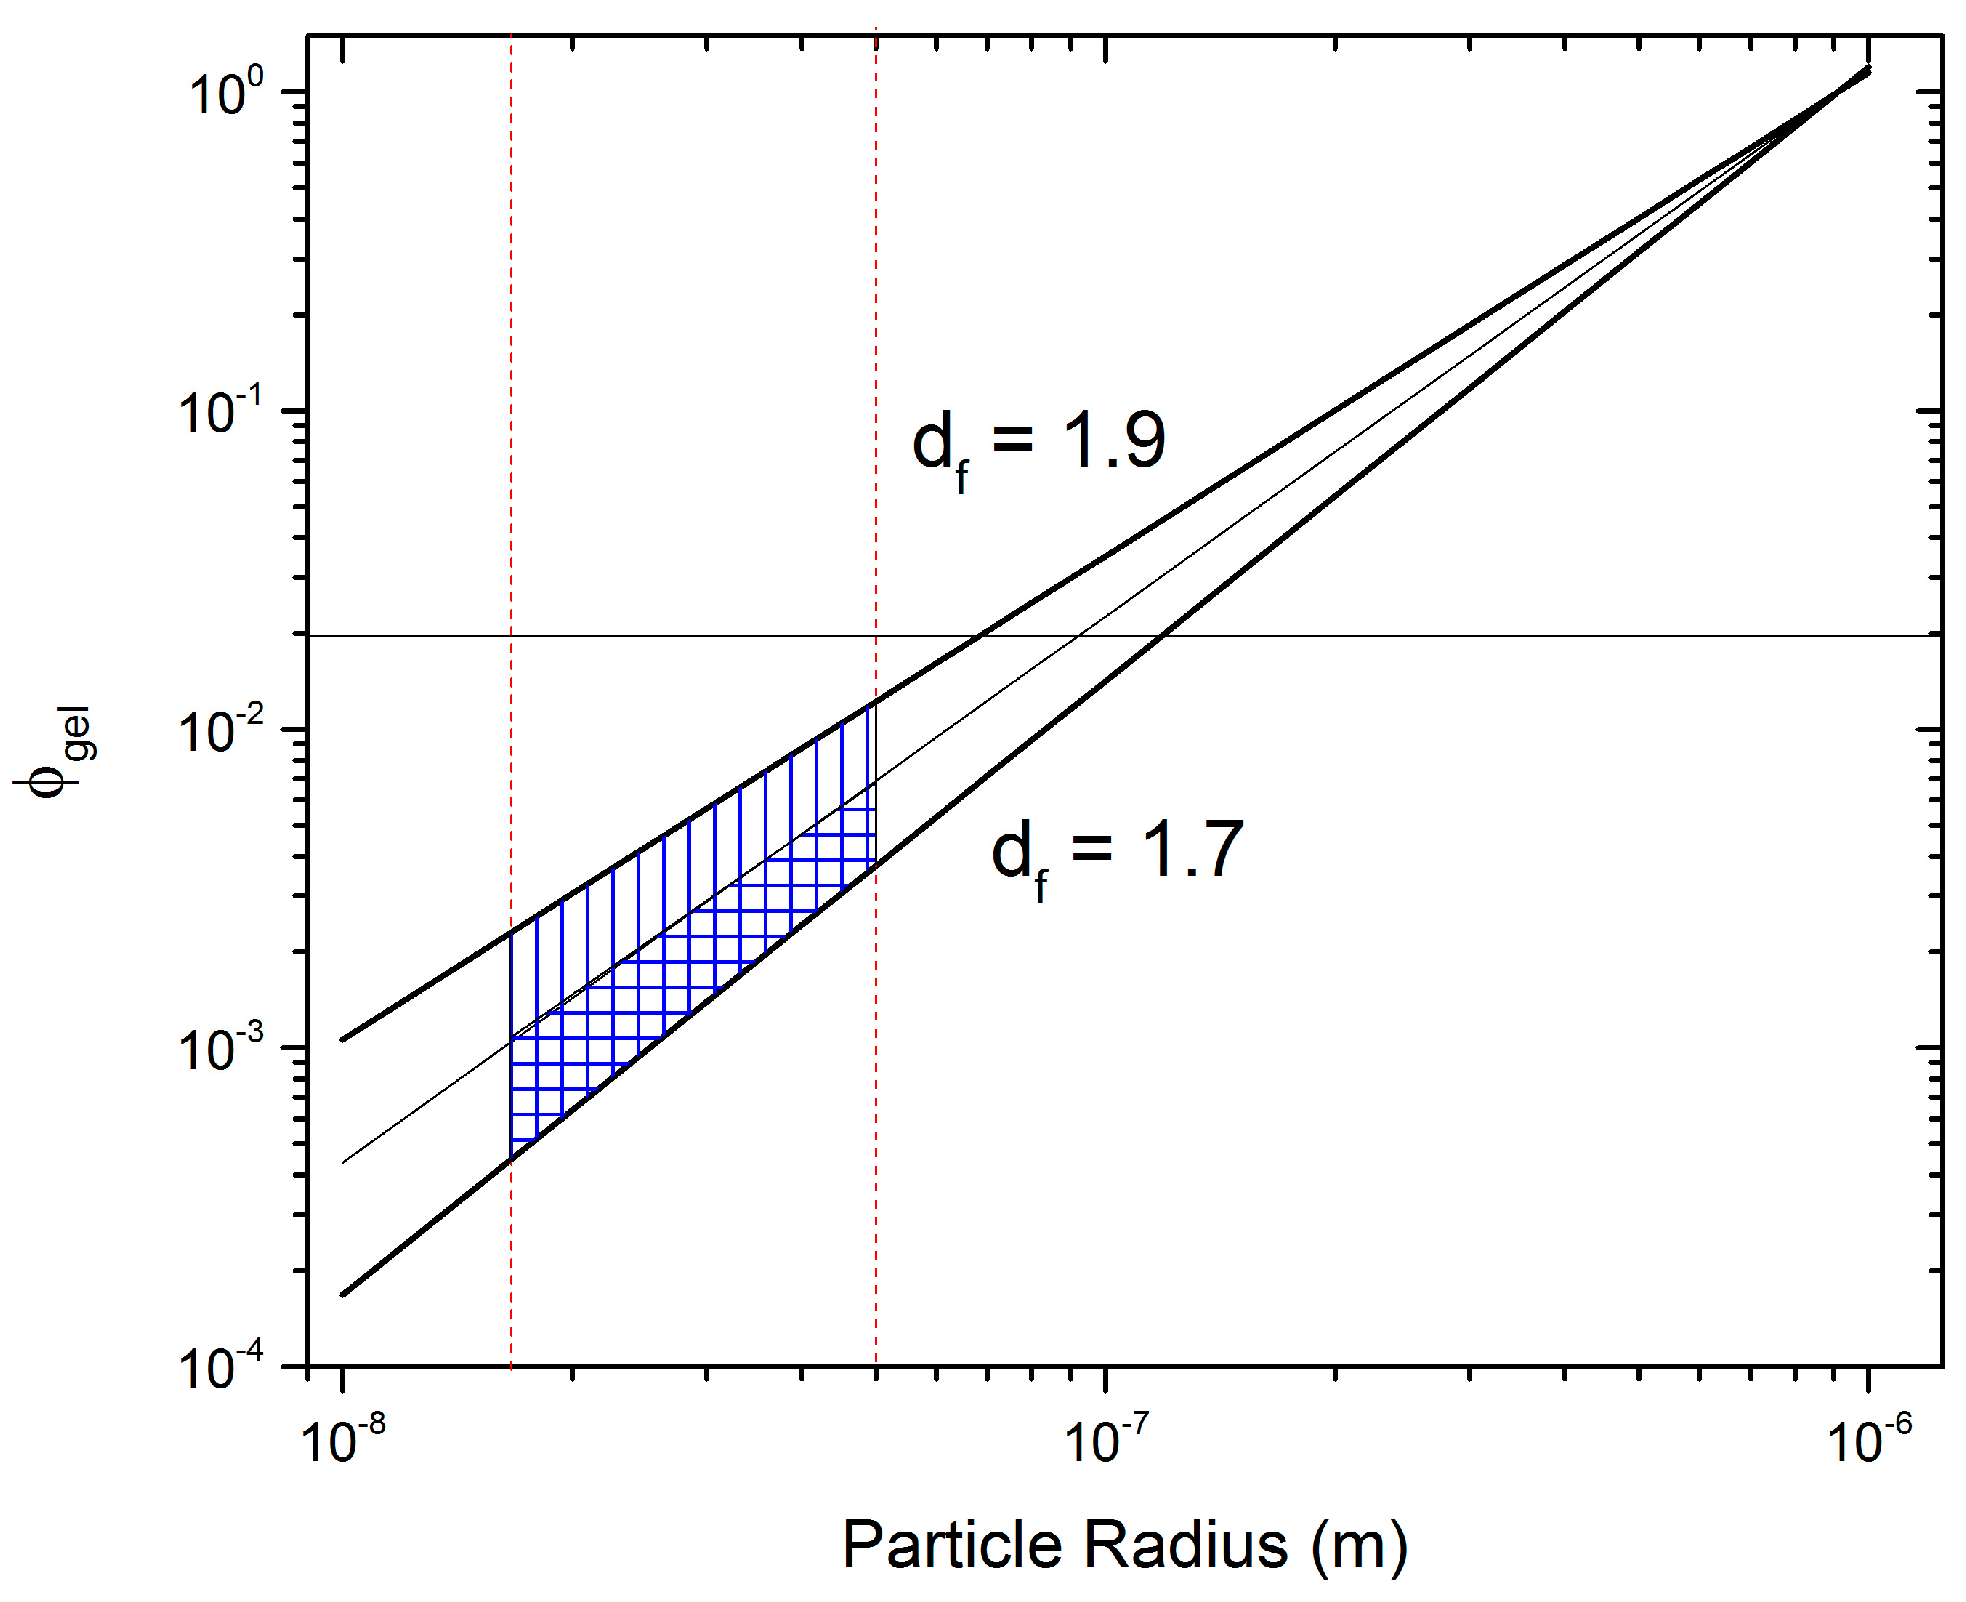
To account for uncertainties in
a and
Df,
was predicted using Equation (1) for 15 nm <
a < 150 nm (vertical red lines in
Figure 9) and 1.7 <
Df < 1.9 (sloped black lines in
Figure 9).
Figure 9 clearly shows a shaded region that depicts the range of predictions for Equation (1) for the specified parameters. Using the DLCA range for
Df and an intermediate
a = 50 nm, a range for the potential
of CV can be predicted to lie between 0.0004 and 0.01. The upper limit is surprisingly close to the result obtained from rheology, showing a transition regime at
, where essentially aggregation is very close to the settling time of particles due to gravity, but not yet enough to create a volume spanning network. Note that the agreement between Equation (1) and the experimentally observed transition regime is only similar when the upper limit is considered. We hypothesize that while the primary CB particle size is on average less than 50 nm in radius, the secondary particles are in fact the dominant species forming aggregates and are much larger than 50 nm, which could explain the agreement with the upper limit.
In conclusion, our rheological measurements and analysis show that the aggregation mechanism, critical volume fraction, and aggregate relaxation time of CB in NMP are not strongly influenced by the presence of high volume fractions of non-Brownian NMC particles. SEM indicates that this is because the large particles do not participate in the percolating network. The presence of NMC particles influences the shape of both the linear viscoelastic and nonlinear response of the materials. Comparison of our data with the theoretical prediction of Poon et al. show excellent agreement for the CB-only case. Our finding has beneficial implications for battery formulation, among other fields, because it suggests that the microstructure of the electrode slurry can be controlled by the CB concentration, independent of the active material. Efforts in our lab to tune slurry and electrode microstructures by manipulating and their relation to battery performance are ongoing.

