Article

Interactive Effects of the CO2 Enrichment and Nitrogen Supply on the Biomass Accumulation, Gas Exchange Properties, and Mineral Elements Concentrations in Cucumber Plants at Different Growth Stages

1
State Key Laboratory of Soil and Sustainable Agriculture, Institute of Soil Science, Chinese Academy of Sciences, Nanjing 210008, China
2
Department of Horticultural Sciences, Institute of Crop Science and Resource Conservation, University of Bonn, 53121 Bonn, Germany
3
Department of Chemistry and Biochemistry, Old Dominion University, Norfolk, VA 23529, USA
*
Author to whom correspondence should be addressed.
Agronomy 2020, 10(1), 139; https://doi.org/10.3390/agronomy10010139
Submission received: 24 December 2019 / Revised: 11 January 2020 / Accepted: 15 January 2020 / Published: 17 January 2020
(This article belongs to the Special Issue Soilless Culture, Growing Media and Horticultural Plants)

Abstract

:
The concentration changes of mineral elements in plants at different CO2 concentrations ([CO2]) and nitrogen (N) supplies and the mechanisms which control such changes are not clear. Hydroponic trials on cucumber plants with three [CO2] (400, 625, and 1200 μmol mol−1) and five N supply levels (2, 4, 7, 14, and 21 mmol L−1) were conducted. When plants were in high N supply, the increase in total biomass by elevated [CO2] was 51.7% and 70.1% at the seedling and initial fruiting stages, respectively. An increase in net photosynthetic rate (Pn) by more than 60%, a decrease in stomatal conductance (Gs) by 21.2–27.7%, and a decrease in transpiration rate (Tr) by 22.9–31.9% under elevated [CO2] were also observed. High N supplies could further improve the Pn and offset the decrease of Gs and Tr by elevated [CO2]. According to the mineral concentrations and the correlation results, we concluded the main factors affecting these changes. The dilution effect was the main factor driving the reduction of all mineral elements, whereas Tr also had a great impact on the decrease of [N], [K], [Ca], and [Mg] except [P]. In addition, the demand changes of N, Ca, and Mg influenced the corresponding element concentrations in cucumber plants.

1. Introduction

In the cold of winter, most greenhouses in China are not opened or ventilated in order to keep a warmer air temperature for vegetable growth. Therefore, carbon dioxide (CO2) is often depleted rapidly in these closed greenhouses, and this lack becomes one of the biggest adverse factors that depress the photosynthesis and growth of vegetables [1]. CO2 enrichment has been widely implemented in greenhouses in Europe, North America, and Japan since the 1950s, and was introduced and used in greenhouses in China in the late 1980s [2,3,4]. CO2 enrichment has been found to have a dramatic effect on faster growth, greater biomass, and higher yield [5,6] due to the increased photosynthesis and carbohydrate accumulation, particularly in C3 plants [7,8]. Nevertheless, the longer and further researches reported some drawbacks of CO2 enrichment. These drawbacks included the decline of mineral concentrations in plant tissues [7,8], worsened taste due to the increased cellulose content [9,10], as well as the photosynthetic acclimation and the weak sustainability of its fertilization effects on yield improvement [11,12,13]. The main reason was the increased photosynthates and accumulated carbohydrates in plant tissues under elevated CO2 concentrations ([CO2]), which decreased the nitrogen to carbon ratio (N/C) and caused the imbalance between source and sink [7,13,14]. To deal with this problem, many researchers recommended higher N fertilization to minimize the reduction in N/C associated with high [CO2] conditions [15,16,17]. However, when the dry matter accumulation outpaces N uptake, enriched CO2 will still reduce N concentrations ([N]) in plants even if N uptake is enhanced by higher N supply [18].
A reduction in mineral concentrations has been frequently demonstrated in crops grown under elevated [CO2] conditions [7,8,9,18]. Among these mineral elements, the possible mechanisms of the reduction of [N] in plants under high [CO2] conditions have been extensively studied [9,10,19,20]. Four hypotheses are well-documented: (1) Dilution effect due to accumulation of non-structural carbohydrates [10,12]; (2) reduced mass flow and transpiration due to decreased stomatal conductance [21,22]; (3) decreased Rubisco protein concentrations and N demands due to increased plant N use efficiency [10,23,24]; (4) inhibited photorespiration-dependent nitrate assimilation under high [CO2] [25,26]. However, the effects of elevated [CO2] on other mineral elements in plants have received far less attention. In plants, N, phosphorus (P), and sulfur (S) are mainly bounded to C to form organic molecules, whereas potassium (K), calcium (Ca), and magnesium (Mg) tend to remain in ionic forms or be chelated with enzymes in plant tissues. Considering their different uptake pathways, existence forms, and physiological functions, concentration changes of different mineral elements in plants at different [CO2] and N supply levels are possible with different mechanisms potentially contributing to each.
Cucumber (Cucumis sativus L.) is globally one of the most important vegetables that prefers to be cultivated in greenhouses with CO2 enrichment [27]. While the growth, photosynthesis [28], nitrogen metabolism [29], yield [1], fruit quality [30], root morphology [31], root exudate [32], and water use efficiency [33] of cucumber grown in elevated [CO2] conditions have been studied, the effects of different [CO2] and N supply levels on mineral element concentrations in cucumber and the key factor leading to these changes have received far less attention. Moreover, the available information about the optimum N supply under different elevated [CO2] is extremely limited. A better understanding of the concentration changes of mineral elements in cucumber plant responding to elevated [CO2] and N supplies is necessary for optimizing [CO2] and N fertilization in order to obtain high quality greenhouse products with higher C and N use efficiency [34,35] and to deal with future climate change scenarios with less CO2 emission and fertilizer input [36,37].
In previous studies, we have found the optimum N supply was 7 and 14 mmol L−1 for the seeding and mature plants of cucumber, respectively, and the saturated and semi-saturated [CO2] of cucumber plants under natural solar radiation (about 600 mol m−2 s−1) was 1200 and 625 μmol mol−1, respectively [28,30,31,32]. Therefore, in this study, we carried out the hydroponic trials on cucumber plants with three [CO2] (400, 625, and 1200 μmol mol−1) combined with five N supply levels (2, 4, 7, 14, and 21 mmol L−1) during seedling and initial flowering stages. Then, we investigated the effects of [CO2], N supply levels, and growth stages on cucumber growth, gas exchange, and macro-nutrient elements concentrations in different tissues. Pearson correlation coefficient is commonly used to quantify the degree of linear relationship between two factors and has been used to evaluate the relationships between root exudates and root morphological traits in our previous work [31]. In this study, we also used the Pearson correlation analysis to evaluate what were the key factors affecting the concentration changes of each mineral element in cucumber plants under different [CO2] and N supply conditions.

2. Materials and Methods

2.1. Plant Culture and Growth Conditions

Three open-top chambers (OTCs) (2.3 m length × 0.8 m width × 1.4 m height) made of poly (methyl methacrylate) were established in the glasshouse at Institute of Soil Science, Chinese Academy of Sciences, Nanjing, P.R. China (32.0596° N, 118.8050° E). The OTCs were transparent for minimizing the shading effect and received solar radiation with natural day length. The OTCs also have a pair of opposite side doors, which can be opened like wings for inside operation and cooling. The experiments were carried out as a split-plot design where [CO2] was the main treatment, and N supplies were considered as the sub-plot treatment. Five N treatments were set at 2 (N1), 4 (N2), 7 (N3), 14 (N4), and 21 (N5) mmol L−1, which were repeated six times in each chamber, and the thirty pots in each chamber were rotated within and among chambers every two weeks to minimize chamber effects. The [CO2] in three identical OTCs was set at 400 (ambient: C1), 625 (elevated: C2), and 1200 (super-elevated: C3) μmol mol−1 respectively and was reset to the corresponding treatment condition following plant rotation. The [CO2] in OTCs was controlled and monitored continuously through an infrared gas analyzer (Ultramat 6, Siemens, Munich, Germany) started on the day after transplanting (DAT). The [CO2] in OTCs was elevated from 0800 to 1700 h every sunny and cloudy day. The temperature and relative humidity within the OTCs were recorded by a L95-83 data logger (Hangzhou loggertech Co., Ltd., Hangzhou, China) every 15 min. The chambers were opened for cooling and CO2 was not supplied when the temperature inside was above 35 °C. The accumulated CO2 treating time was 338 h within the whole experiment period of 62 days. The average temperature in OTCs was 22.9–23.5 °C, and the average humidity was 61.2–63.2%, respectively.
Cucumber (Cucumis sativus L.) seeds of ‘Jinyou 38′ (Tianjin Lvfeng Co., Ltd., Tianjin, China) were germinated on moist filter paper in constant-temperature incubator at 28 °C and relative humidity of 70% for 48 h, and then seeds with radicles were sown into trays containing peat-vermiculite (2:1, v/v) substrate. When the third true leaf emerged, healthy seedlings were selected and transplanted to 5 L polyvinyl chloride polymer (PVC) pots with two plants per pot. Each pot was filled with 4 L modified Yamazaki nutrient solutions for cucumbers [38] with five nitrogen levels. To keep the same P, K, Ca, and Mg concentrations ([P], [K], [Ca], and [Mg]) in nutrient solutions with five N levels, anions or cations were balanced with SO42−, NO3, or NH4+ respectively (Table 1). All the nutrient solutions contained the same concentration of micro-nutrients composed of (mg L−1): Na2Fe-EDTA (29.27), H3BO3 (2.86), MnSO4·4H2O (2.03), ZnSO4·7H2O (0.22), CuSO4·5H2O (0.08), and (NH4)6Mo7O24·4H2O (0.02). The pH of the nutrient solution was adjusted to 6.5 with dilute NaOH. All pots were aerated intermittently for 30 min in every hour and renewed every four days.

2.2. Sampling and Measurements

2.2.1. Gas-Exchange Rate Measurements

The gas exchange properties of cucumber plants, including net photosynthetic rate (Pn), transpiration rate (Tr), and stomatal conductance (Gs) were measured using a portable photosynthesis system (Li-6400, Li-Cor Inc., Lincoln, OR, USA) with a standard leaf chamber (2 cm × 3 cm) (6400-02B) with a LED light source. The photosynthetic photon flux density, temperature, relative air humidity, and the air flow rate inside the leaf chamber were set at 1500 mol m−2 s−1, 25 °C, 50%, and 500 μmol s−1, respectively. The [CO2] of the flow-in air was set the same as that in the corresponding OTC where the plant was grown. The measurements were conducted on 13, 38, and 60 DAT and six replicates of the third leaves from the top of cucumber plants in each treatment were used for measuring.

2.2.2. Plant Harvest and Biomass Determination

One plant in each pot was harvested at the seedling stage (T1) when the seedling had five to six true leaves (18 DAT) and the other was harvested at the initial fruiting stage (T2) when small fruits of 5–8 cm of length formed (62 DAT). After harvest, plants were separated to root, stem, and leaf samples and washed with tap water followed by distilled water. Dry weight (DW) of each tissue was determined by drying the fresh tissues at 105 °C for 30 min and then at 75 °C to a constant weight in an electro-thermostatic blast oven.

2.2.3. Mineral Element Concentration Determination

The dry samples were ground to pass through a 0.5-mm screen. Next, 0.2 g dry samples were soaked in 5 mL concentrated H2SO4 for 24 h then digested at 180 °C for 5 h, followed by intermittent addition of 0.5 mL H2O2 for 2 or 3 times. The extracted solution was diluted to 500 mL with deionized water and the [N] was analyzed using a discrete auto-analyzer (Smartchem200, Alliance, France) [28]. Another portion of 0.2 g dry samples was digested with 5 mL HNO3-HClO4 (85:15 v/v) at 190 °C, and [P], [K], [Ca], and [Mg] were determined by an inductively coupled plasma atomic emission spectrometer (IRIS Advantage, Thermo Elemental, Franklin, MA, USA) [39].

2.3. Statistical Analysis

Statistical analysis was performed using SPSS software (Version 22.0; IBM Corp., Armonk, NY, USA). All data were shown as mean ± standard error. The means of DW, gas exchange properties, and mineral concentrations with six replicates in each treatment were compared using Duncan’s multiple range test at a significance level of p = 0.05 in one-way analysis of variance (ANOVA). The effects of N supply, [CO2], growth stage, and their interaction on DW, gas exchange properties, and mineral concentrations were quantified using a general linear model. Correlation and significance tests between each mineral concentration in different tissues of cucumber and [CO2], N supply, transpiration rate were calculated using the Pearson correlation coefficient with two-tailed test. All figures were generated by OriginPro (Version 8.0; OriginLab Corp., Northampton, MA, USA).

3. Results

3.1. Dry Weight and Root to Shoot Ratio

The effects of [CO2] levels, N levels, growth stages, and their interactions on root, stem, leaf, and total DW as well as root to shoot ratios (R/S) of cucumber plants are shown in Table 2. The growth stage significantly affected the DW of roots, stems, leaves, and total biomass of cucumber plants. The average DW of total plants was increased from 1.01 g plant−1 at T1 stage to 6.14 g plant−1 at T2 stage. As the aerial parts of cucumbers grew faster than root, the R/S significantly decreased from 0.107 to 0.093 during a growth period of 44 days.
N supply levels also significantly affected the biomass accumulation of cucumber plants, especially at T2 stage. At T1 stage, the DW of stems, leaves as well as total biomass of cucumber plants was significantly increased with the increase of N supply, especially at higher [CO2] treatments (C3), whereas the DW of roots was not influenced by N levels at all [CO2] levels. Specifically, the increase of total biomass from N1 to N5 was 28.0%, 37.0%, and 68.5% in treatments C1, C2, and C3, respectively. At T2 stage, the positive effects of N supplies were more obvious than that at T1 stage, and the DW of all parts of cucumber plants were much greater in N5 treatment than those in N1 treatment. The total biomass was increased by 1.57, 2.85, and 4.70 folds from N1 to N5 in treatments C1, C2, and C3, respectively. Since the improvement of DW in the aerial parts was more noticeable than that in roots, the R/S at each [CO2] treatment was significantly decreased with the increase of N supply at both growth stages.
With respect of [CO2] levels, the increase of DW by super-elevated [CO2] (C3) were more dramatic in moderate (N3) and high N supplies (N4 and N5), whereas there was little increase or even a decrease in low N supplies (N1 and N2). Generally, the increase of total biomass from C1 to C3 was 29.4%, 58.4%, and 51.7% at T1 stage, and was 68.9%, 69.2%, and 70.1% at T2 stage, in N3, N4, and N5 treatments, respectively. The R/S was not significantly affected by [CO2] levels, irrespective of the N supply and growth stage.
The interactions of [CO2] × N and [CO2] × N × growth stage had significant effects on the DW of stems, leaves, and total cucumber plants but it was not significant on root DW. The interactions of [CO2] × growth stage and N × growth stage had significant effects on the DW of all parts of and total cucumber plants. The interaction of neither two nor three of these factors had significant effects on R/S.

3.2. Gas Exchange

Generally, [CO2] levels, N levels, growth stages and their interactions all had significant effects on the Pn of cucumber plants (Figure 1). On 13 DAT, super-elevated [CO2] (C3) significantly increased the Pn in N3 and N4 treatments. On 38 DAT, the Pn under super-elevated [CO2] was the highest in all N levels. On 60 DAT, the Pn under super-elevated [CO2] was also the highest in all N levels except for N2. Compared with ambient [CO2] (C1), the increase of the Pn by super-elevated [CO2] (C3) was 60.1%, 115.5%, and 77.7% in N3, N4, and N5 treatment, respectively. However, elevated [CO2] (C2) did not significantly increase the Pn compared with C1 in all N levels at three growth stages. The Pn was usually increased with the N supply increasing at the same [CO2] and growth stage. The increase of the Pn from N1 to N5 in C3 treatment was 2.35, 0.89, and 2.24 folds on 13, 38, and 60 DAT, respectively. As the plant grew, the Pn was gradually increased in high N supplies (N4 and N5) under super-elevated [CO2]. Whereas in low N supplies (N1 and N2), the Pn reached its highest value earlier on 38 DAT.
The Gs of cucumber plants was significantly influenced by [CO2] levels, N levels, growth stages, and the interactions of [CO2] × growth stage and N × growth stage (Figure 1). The Gs was much lower in N1 treatment on 13 DAT and in N1 and N2 treatments on 60 DAT than that in other higher N levels in the same [CO2] level. The Gs was also depressed by higher [CO2] (C2 and C3) in N5 treatment on 13 DAT and in N1, N2, and N5 treatments on 60 DAT. In other N treatments and growth stages, there was only a decreasing trend not a significant decrease in the Gs by higher [CO2] treatments. Averaged across all N treatments, the decrease of Gs from C1 to C3 was 27.4%, 27.7%, and 21.2%, on 13, 38, and 60 DAT, respectively.
The changes of Tr of cucumbers grown under different N and [CO2] levels at three growth stages were similar to those of Gs (Figure 1). [CO2] levels, N levels, growth stages, and the interactions of [CO2] × growth stage and N × growth stage had significant effects on the Tr of cucumber plants. The Tr was inhibited by super-elevated [CO2] (C3) in N2, N4, and N5 treatments on 13 DAT, in N4 on 38 DAT, and in N1, N2, and N3 on 60 DAT. In other treatments, a decreasing trend in C3 was usually observed compared with C1. The average decrease of Tr from C1 to C3 among all N treatments was 31.9%, 26.4%, and 22.3%, on 13, 38, and 60 DAT, respectively. Increasing N supply improved the Tr in C2 and C3 treatments on 60 DAT, and the increase from N1 to N5 was 72.6% and 130.2% in C2 and C3 treatment, respectively. The Tr differences among the three growth stages were not significant.

3.3. Mineral Nutrient Concentration

As shown in Figure 2, [CO2] levels, N levels, growth stages, and the interaction of [CO2] × N had significant effects on the [N] in all three parts of cucumber plants, and the interaction of [CO2] × growth stage, N × growth stage, and [CO2] × N × growth stage also had significant effects on the [N] in leaves of cucumbers. [N] in roots, stems, and leaves of cucumbers was significantly increased with the increasing N supply. At T1 stage (18 DAT), the average increase of [N] from N1 to N5 among all [CO2] treatments was 71.4%, 85.9%, and 61.2% in roots, stems, and leaves respectively, whereas the value was 50.0%, 71.7%, and 27.7% at T2 stage (62 DAT). [N] in leaves was significantly decreased by super-elevated [CO2] (C3) compared with ambient [CO2] (C1) in all N treatments at both growth stages except for N1 and N2 at T2 stage. Averaged across all N treatments, the decrease of [N] in leaves from C1 to C3 was 6.1% and 9.3%, at T1 and T2 stage, respectively. However, [CO2] levels did not affect the [N] in roots and stems in most treatments. As the plants grew, the [N] in stems in N2, N3, and N4 treatments in all [CO2] levels, in leaves in N1, N4, and N5 treatments in higher [CO2] levels (C2 and C3) were decreased.
The [P] in different tissues of cucumber plants grown under different N and [CO2] levels at two growth stages was shown in Figure 3. [CO2] levels, N levels, growth stages, and the interaction of N × growth stage had significant effects on the [P] in all three parts of cucumber plants. At T1 stage, [P] in stems was gradually decreased with the N supply increased, and the average decrease from N1 to N5 among all [CO2] treatments was 17.3%. At T2 stage, [P] in roots and stems was significantly decreased as the N supply increasing, and the corresponding average decrease from N1 to N5 was 44.2% and 38.3%, respectively. At T1 stage, [P] in moderate (N3) and high (N4 and N5) N supplies were usually lower in C3 than that in C1 treatment, specifically in roots of the N3 and N4 treatments, stems of the N4 and N5 treatments, and leaves of N3 and N5 treatments. At T2 stage, the differences of [P] between C1 and C3 were not significant except for N1 and N4 in stems and N2 and N4 in leaves.
Figure 4 showed the [K] in different tissues of cucumber plants grown under different treatments. Similar to the [P], [CO2] levels, N levels, growth stages, and the interaction of N × growth stage had significant effects on the [K] in all three parts of cucumber plants. At T1 stage, [K] in roots was gradually decreased as the N level elevating, and the average decrease from N1 to N5 among all [CO2] treatments was 40.5%, whereas they were gradually increased in leaves as the N level elevated, and the average increase from N1 to N5 was 13.8%. Compared with ambient [CO2] (C1), [K] was significantly decreased by super-elevated [CO2] (C3) in N3 and N4 in roots, N3, N4, and N5 in stems and N2, N4, and N5 in leaves. At T2 stage, a decrease of [K] by elevated [CO2] was observed in N4 and N5 in roots and N4 in leaves. In terms of growth stages, [K] was decreased from T1 stage to T2 stage in stems of cucumbers in all treatments.
[CO2] levels, N levels, growth stages, and the interaction of [CO2] × growth stages had significant effects on the [Ca] in all three parts of cucumber plants (Figure 5). [Ca] was always the lowest in highest N treatment (N5) at two growth stages in all three parts of cucumbers except for that in roots at T1 stage. The average decrease from N1 to N5 among all [CO2] treatments was 16.9% and 15.6% in stems and leaves respectively at T1 stage, and was 32.4%, 33.9%, and 15.3% in roots, stems, and leaves respectively at T2 stage. [Ca] was also decreased by elevated [CO2] in all three tissues regardless of N supply at T1 stage. The average decrease from C1 to C3 among all N treatments was 16.4%, 14.3%, and 10.4% in roots, stems, and leaves, respectively. Growing caused a significant decrease of [Ca] in 10 of 15 treatments in root and 11 of 15 treatments in leaves.
The [Mg] in different tissues of cucumber plants growing under different N and [CO2] levels at two growth stages was shown in Figure 6. Generally, [CO2] levels, N levels, and growth stages had significant effects on the [Mg] in all three parts of cucumber plants. [Mg] was almost the highest in lowest N treatments (N1) and the lowest in highest N treatment (N5) in stems and leaves at T1 stage and in roots and leaves at T2 stage. The corresponding average decrease from N1 to N5 among all [CO2] treatments was 19.1%, 27.1%, 24.5%, and 24.8%. At T1 stage, [Mg] was significantly decreased by higher [CO2] (C2 and C3) compared with ambient [CO2] (C1) at all N levels in roots except for N1, and in leaves except for N2. The average decrease among all N treatments was 26.4%, 0.2% (not significant), and 6.6% in roots, stems, and leaves respectively from C1 to C2, and the decrease from C1 to C3 was 16.9%, 10.0%, and 7.8%. Similar to [Ca], growing also caused a significant decrease of [Mg] in 10 of 15 treatments in root and 11 of 15 treatments in leaves.

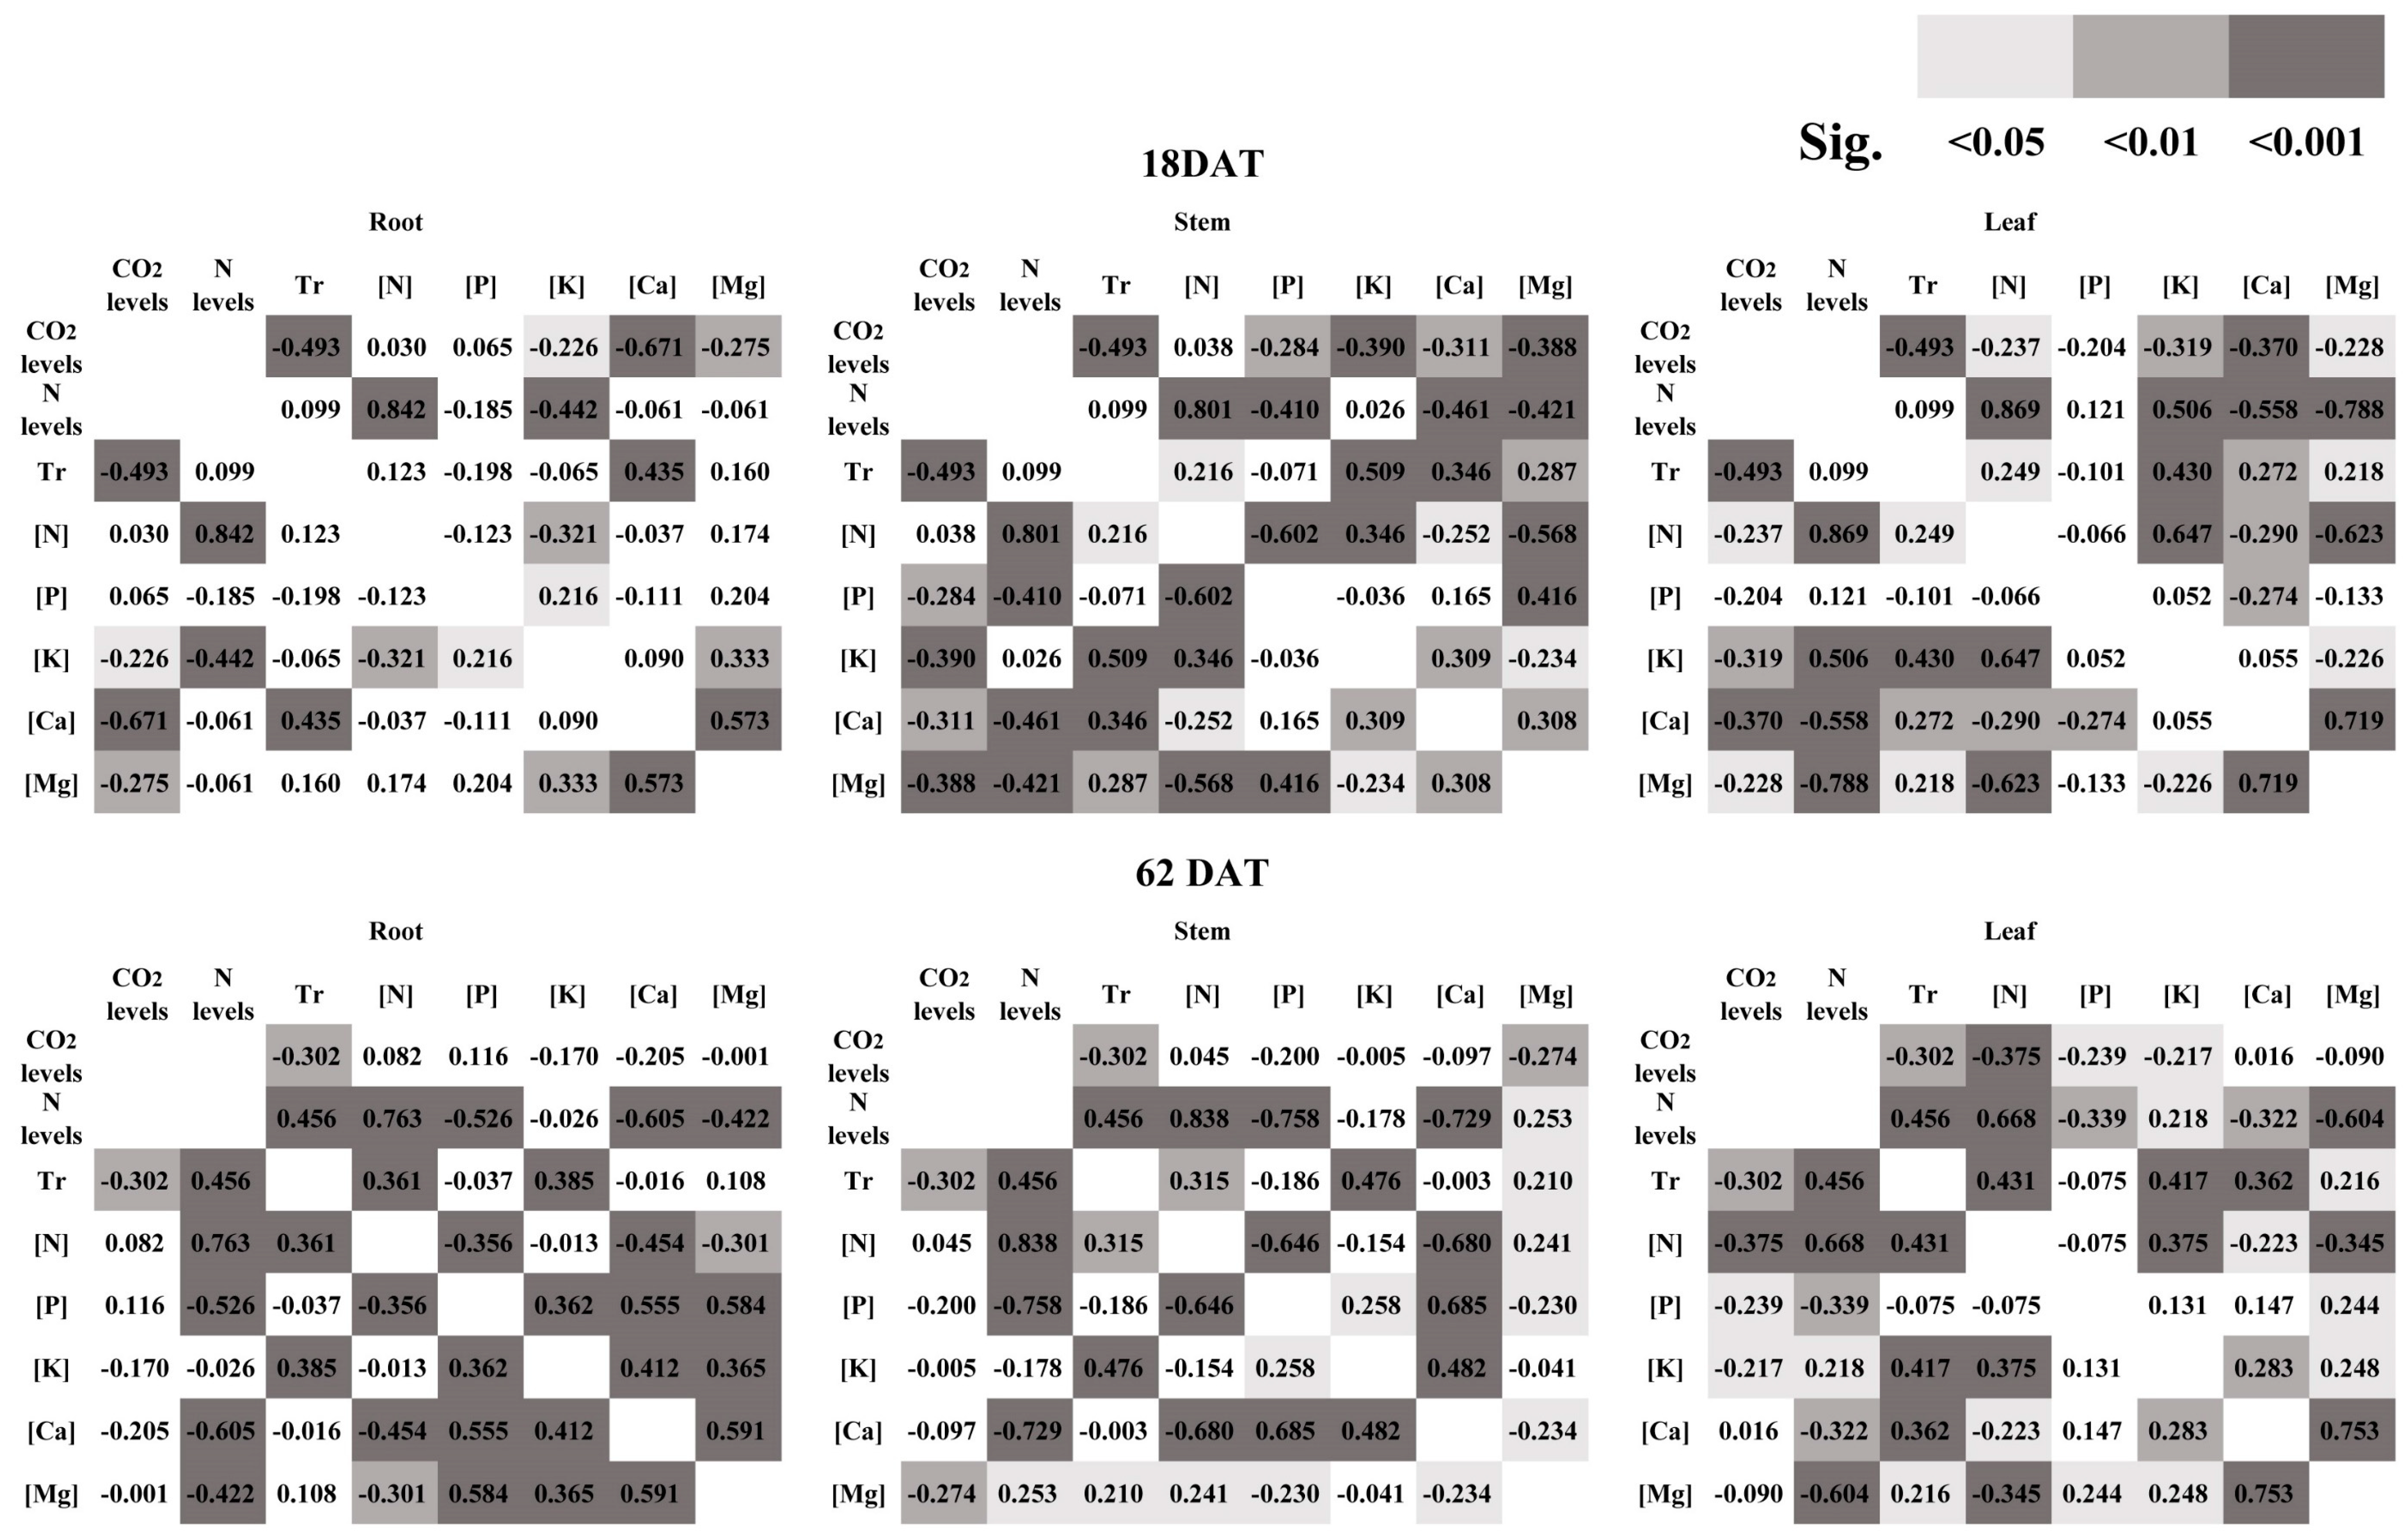
3.4. Correlations between [CO2], N Supply, Transpiration Rate, and Mineral Nutrient Concentration

To further evaluate the relationship between mineral nutrient concentration, [CO2], N supply levels, and Tr, the Pearson correlation coefficient was calculated (Figure 7). Tr was negatively correlated to [CO2] at both growth stages and was positively correlated to N supply levels at T2 stage. [N] in all parts of cucumber plants was significantly positively correlated to N supply levels and Tr at both growth stages except for the insignificant positive correlation between [N] in root and Tr at T1 stage. [N] was negatively correlated to [CO2] only in leaves at both growth stages. [P] in all parts of cucumber plants was significantly negatively correlated to N supply except for levels at T2 stage. [P] was only negatively correlated to [CO2] in stems at T1 stage and in leaves at T2 stage, and was not significantly correlated to Tr. [K] in all parts of cucumber plants was significantly negatively correlated to [CO2] at T1 stage and in leaves at T2 stage. [K] in all parts of cucumber plants was also significantly positively correlated to Tr at both growth stages except for that in roots at T1 stage. [K] in leaves was also significantly positively correlated to N levels, whereas it was negatively correlated to N levels in root at T1 stage. [Ca] in all parts of cucumber plants was significantly negatively correlated to [CO2] at T1 stage, whereas this correlation was not significant at T2 stage. [Ca] was also significantly negatively correlated to N levels in all parts of cucumber plants at both growth stages except for that in roots at T1 stage. [Ca] in all parts of plants at T1 stage and in leaves at T2 stage also had a strong positive correlation to Tr. [Mg] in all parts of cucumber plants at T1 stage and in stems at T2 stage was significantly negatively correlated to [CO2]. [Mg] in stems and leaves at T1 stage and in roots and leaves at T2 stage was also significantly negatively correlated to N levels. [Mg] in aerial parts of cucumber was all significantly positively correlated to Tr at both growth stages.

4. Discussion

4.1. Impacts of [CO2] and N Supply on the Growth of Cucumbers

The beneficial effects of CO2 enrichment on stimulating plant growth and biomass accumulation of crops have been extensively reported [2,5,6,40]. An increase in the DW ranging from 13.5% to 34.4% has been reported for cucumbers, when [CO2] was elevated to 500–760 μmol mol−1 [1,31,33,41,42], and ranged from 43.9% to 128.0% when [CO2] was elevated to 1000–1200 μmol mol−1 [28,29,30,31,43]. In the present work, in moderate N (N3), the increase in the DW was 30.5% and not significant when [CO2] was elevated to 625 μmol mol−1, and 29.4% and 68.9% when [CO2] was elevated to 1200 μmol mol−1, at T1 and T2 stage, respectively (Table 2). This increased DW caused by more fixation of CO2 and accumulation of biomass under elevated [CO2] combined with moderate and high N supplies [5,6]. Our results showed that the increase in Pn was greater than 60% by super-elevated [CO2] compared with ambient [CO2] in moderate and high N supplies (Figure 1), which were in close conformity with this explanation.
Moreover, the present work also clearly demonstrated that the DW accumulation by CO2 enrichment depended on the N supply, in which there was significant increase in DW in moderate and high N supplies but no change or decrease in low N supplies (Table 2). This is consistent with the previous findings that limited N will inhibit the synthesis of photosynthetic related proteins, lower the photosynthetic capacity, and reduce the photo-assimilate accumulation [12,15,44,45]. The significant decrease of [N] in leaves at T1 stage, as well as no change or decrease in Pn by elevated [CO2] observed in low N supply treatments in this work, also gave a clear indication that the stimulation of Pn at high [CO2] was only partial or counteracted when N supply was limited (Figure 1 and Figure 2). It is worth mentioning that the improvement in Pn by CO2 enrichment maintained at 60 DAT even when the [N] in leaves was also deceased in high N supplies (Figure 1 and Figure 2). A possible reason is that the [N] in leaves treated with high N supplies was still enough for guaranteeing the RuBP regeneration and Rubisco activity to match the increased C-fixation [10,46]. These results also confirmed that increasing N supply could alleviate or prevent the photosynthetic acclimation under elevated [CO2] condition and ensure the sustainability of the [CO2] enrichment fertilization effects on crop growth [15,16,17,33].
Decreased Gs and Tr are the most obvious and universal changes observed in C3 plants including cucumbers grown in elevated [CO2] condition [41,47,48,49]. Elevated [CO2] causes partial stomatal closure and decreases the Gs by 8–44% for C3 plants, consequently with a reduction of Tr by 20–40% [2,50]. In the present work, the decrease in Gs and Tr of cucumbers in super-elevated [CO2] compared with the ambient [CO2] was 12.2–27.7% and 22.9–31.9%, respectively (Figure 1), which was in good agreement with previous reports. Additionally, we found a greater reduction in Gs and Tr in low N supply treatments (Figure 1). Low N causes reductions in Rubisco concentration and activity hereby forces the reduction in Gs and Tr in order to maintain a constant ratio of internal leaf [CO2] to that of outside air [50]. The improvement in Gs and Tr under higher N treatments might also result from the synthesis of more photosynthates and increased cell wall rigidity [51].
[CO2] and N Supplies also affect the biomass allocation of the plants. In the present work, the R/S was significantly decreased with N supplies increasing, but was not affected by [CO2] levels (Table 2). A similar phenomenon was observed in other reports and our previous works [23,28,30,31,52]. Incorporated with current views in the literature, two possible reasons were usually proposed. Firstly, the accumulation of nitrate in shoots under high N supply down-regulates the growth of roots relative to shoots, resulting in lower R/S [53]. Secondly, plants always allocate more biomass to the apparatus in nutrient-limiting conditions, so more photosynthates will be invested in roots for exploring and acquiring more nutrients in N-deficient conditions [54].

4.2. Key Factors Affecting the Mineral Nutrient Concentrations

The changes of [N] under different [CO2] and N supply conditions have been extensively studied. The results that [N] was decreased as [CO2] increasing and increased as N supply increasing have been frequently observed for crops and vegetables [8,9,19]. The reasons for the increase in [N] with increasing N supply are transparent, whereas the reasons for the decrease in [N] with increasing [CO2] are more complicated. The most common reason is that the [N] is diluted by more accumulated carbohydrates in high [CO2] conditions [9,10,12]. However, tissues respond differently to elevated [CO2] conditions, and it has been reviewed that the average decrease in [N] in leaves was 16%, which was larger than that in stems (9%) and roots (9%) [7,9]. In the present work, only the [N] in leaves was significantly decreased by 6.1–9.3% in super-elevated [CO2] treatment, whereas [N] in stems and roots were not influenced by [CO2] levels (Figure 2 and Figure 7). Therefore, the dilution effect is not the only cause of [N] decrease in elevated [CO2]. Previous elevated [CO2] studies have found that the NO3 assimilation was enhanced in roots by increased photosynthate translocation to roots, whereas it was inhibited in leaves caused by the competition for reductants between the carbon fixation and NO3 reduction [17,25,26]. Hence, the dilution effect on [N] could be counteracted by the enhanced NO3 assimilation in roots while aggravated by the inhibited NO3 assimilation in leaves. Additionally, the decrease in Tr caused by the closed stomata could result in a reduced flow of NO3 from roots to leaves, which also leads to more decrease in [N] in leaves than that in roots [17,19,21,22,55]. In the present work, a significant positive correlation between [N] and Tr, especially in leaves, also gave convincing evidence for this reason (Figure 7).
In this study, [P] in moderate and high N supplies was decreased in higher [CO2] levels at T1 stage, and was significantly decreased in roots and stems with the increasing N supply (Figure 3). The similar results were also found in tomatoes [17], beans [56], and soybeans [57]. This decrease of [P] in elevated [CO2] especially associated with higher N supplies has been considered as the result of the dilution effect [10,17]. When the larger biomass was accumulated in higher N supplies and elevated [CO2] conditions, [P] in plants will decease if the P supply was not changed [20]. Besides, we also found there was little correlation between [P] and Tr (Figure 7). This lack of response of [P] to Tr may be explained by the free transportation pathway of phosphate in the xylem [58,59]. When phosphate is delivered from root to shoot in xylem sap, it can also be redistributed between different tissues according to their own demands, and excess phosphate will be stored in the vacuoles to maintain the cellular phosphate homeostasis, which is less affected by Tr.
In moderate and high N supplies, a decrease of [K] by elevated [CO2] was found in the whole plant at T1 stage, and in roots and leaves at T2 stage (Figure 4). There was also a significant negative correlation between [K] and [CO2] level in the whole plant at T1 stage, and in leaves at T2 stage (Figure 7). These results are consistent with the average decrease of 10% [K] in plants by elevated [CO2] in previous reviews [7,22]. The dilution effect and reducing Tr are considered as two key factors driving this decrease [17,22,56,60,61]. The significant positive correlation between [K] and Tr at both growth stages also confirmed the importance of Tr on the transportation of K in cucumber plants (Figure 7). Interestingly, at T1 stage, [K] in leaves was significantly increased with the increasing N supply, whereas [K] in roots was decreased. A possible reason is that K+ is always transported accompanied with NO3 from roots to shoots to maintain the balance between K+ and NO3 in xylem sap [62,63]. So, transportation of more NO3 in high N supply will cause a synchronous increase of K+ in xylem sap, and result in an increase in [K] in leaves and a decrease in [K] in roots in higher N treatments.
Although an average decrease of 8% in leaf [Ca] has been reviewed [7,22], the change of [Ca] in different tissues and species under elevated [CO2] were different [60,61,64]. On one hand, being different from N, P, and K, the largest [Ca] are always found in cell walls in plants, where Ca2+ are stably fixed not only by electrostatic interactions with carboxylic groups of pectin, but also by coordination linkage with hydroxylic groups of polysaccharides [65]. So, when plant growth is improved under elevated [CO2], the demands of Ca2+ are also increased, which could partially offset the dilution effect [64]. On the other hand, Ca in xylem sap is mainly in the form of ions or chelate, so its transportation from roots to the aerial parts largely depends on the Tr [22]. However, due to the inhibited transportation of Ca in the phloem, Ca could hardly move and be reused from old tissues to young tissues [65]. Therefore, the accumulation of Ca could happen in old tissues and counterbalance the negativity of the dilution effect and reduced Tr on [Ca]. In the present work, an average decrease of [Ca] by 16.4%, 14.3%, and 10.4% in roots, stems, and leaves was observed under [CO2] enrichment at T1 stage, respectively (Figure 5). The significant negative correlation between [Ca] and [CO2], and the positive correlation between [Ca] and Tr, implied that the dilution effect and reducing Tr were two key factors driving [Ca] decrease in young plants (Figure 7) [7,63]. At T2 stage, elevated [CO2] had little effects on [Ca], and this might be due to the accumulation of Ca in older tissues that offsets the dilution effect and reduced Tr (Figure 5). Since the leaves we analyzed did not include the old leaves that had fallen, the [Ca] in leaves was still influenced by Tr, and the positive correlation between [Ca] and Tr was observed only in leaves. Besides, the decrease of [Ca] with the increasing N supply may also be the result of the dilution effect by the increased biomass accumulation in higher N levels [18].
A decrease in [Mg] in elevated [CO2] conditions has been frequently reported, and the average decrease value was 10% in leaves [7,18,60,64]. McGrath and Lobell found a 20% decrease in [Mg] but only a 10% decrease of other mineral elements in leaves of wheat [22]. Based on the chlorophyll concentration analysis and mass flow experiment, they calculated that the dilution effect accounted for a 10% reduction of [Mg], reduced Tr accounted for 3–10%, and reduced chlorophyll content accounted for 1–5% (represents the reduced demands). In the present work, we found an average decrease in [Mg] by 16.9%, 10.0%, and 7.8% in roots, stems, and leaves in elevated [CO2] conditions, respectively, and an average decrease of [Mg] by 19.1–27.1% under higher N supply (Figure 5). The significant negative correlation between [Mg] and [CO2] as well as [Mg] and N supply indicated the dilution effect had a strong impact on [Mg] (Figure 7). Meanwhile, the significant positive correlation between [Mg] in the aerial parts and Tr implied that reduced Tr also had detrimental effects on [Mg] (Figure 7).

5. Conclusions

According to our results, the cucumber biomass accumulation could be significantly increased by elevated [CO2] accompanied by high N supplies. High N supplies could further improve the Pn and offset the decrease of the Gs and Tr by elevated [CO2]. Thus, increasing N supply could alleviate or prevent the photosynthetic acclimation under elevated [CO2] conditions. Based on the mineral nutrient concentrations in different [CO2] and N supply treatments and the correlation analysis, we proposed the key factors affecting the concentration changes of each mineral element. The dilution effect was the main factor that reduced all mineral elements, whereas Tr had a large impact on the decrease of [N], [K], [Ca], and [Mg] except [P]. The decreased demands of N and Mg and the increased demands of Ca also influenced the concentrations of the corresponding elements in cucumber plants. However, this study was just a qualitative analysis. A quantitative analysis of the effect of each factor on the concentration changes is urgently needed. When we have better understanding of the mechanisms controlling the mineral concentration changes in cucumber plant responding to elevated [CO2], we could optimize the mineral fertilization in order to improve the growth of cucumber plant under elevated [CO2] conditions. Thus, a sustainable vegetable production with higher C and N use efficiency and less CO2 emission and fertilizer input will be achieved.

Author Contributions

Conceptualization, X.L., J.D., W.C., and Z.D.; methodology, X.L., J.D., and W.C.; investigation, X.L., J.D., and W.C.; data curation, X.L. and W.C.; writing—original draft preparation, X.L. and W.C.; writing—review and editing, J.D. and N.S.G.; funding acquisition, W.C., X.L., and Z.D. All authors have read and agreed to the published version of the manuscript.

Funding

This research was funded by the National Natural Science Foundation of China (41877103), the Strategic Priority Research Program of the Chinese Academy of Science (XDA23020401), and the Frontier Project of Knowledge Innovation Program of Institute of Soil Science, Chinese Academy of Sciences (ISSASIP1635).

Acknowledgments

The authors are grateful to Hua Gong for assistance with the ICP analyses and to two anonymous reviewers for their constructive comments and suggestions.

Conflicts of Interest

The authors declare no conflict of interest.

References

  1. Kläring, H.P.; Hauschild, C.; Heißner, A.; Bar-Yosef, B. Model-based control of CO2 concentration in greenhouses at ambient levels increases cucumber yield. Agric. For. Meteorol. 2007, 143, 208–216. [Google Scholar] [CrossRef]
  2. Mortensen, L.M. Review: CO2 enrichment in greenhouses crop responses. Sci. Hortic. 1987, 33, 1–25. [Google Scholar] [CrossRef]
  3. Gruda, N. Impact of Environmental Variables on Product Quality of Greenhouse Vegetables for Fresh Consumption. Crit. Rev. Plant Sci. 2005, 24, 227–247. [Google Scholar] [CrossRef]
  4. Gruda, N.; Tanny, J. Protected crops. In Horticulture: Plants for People and Places; Dixon, G.R., Aldous, D.E., Eds.; Springer: Dordrecht, The Netherlands, 2014; Volume 1, pp. 327–405. [Google Scholar]
  5. Kimball, B.A. Carbon Dioxide and Agricultural Yield: An Assemblage and Analysis of 430 Prior Observations. Agron. J. 1983, 75, 779–788. [Google Scholar] [CrossRef]
  6. Van Der Kooi, C.J.; Reich, M.; Löw, M.; De Kok, L.J.; Tausz, M. Growth and yield stimulation under elevated CO2 and drought: A meta-analysis on crops. Environ. Exp. Bot. 2016, 122, 150–157. [Google Scholar] [CrossRef]
  7. Loladze, I. Rising atmospheric CO2 and human nutrition: Toward globally imbalanced plant stoichiometry? Trends Ecol. Evol. 2002, 17, 457–461. [Google Scholar] [CrossRef]
  8. Dong, J.L.; Gruda, N.; Lam, S.K.; Li, X.; Duan, Z.Q. Effects of Elevated CO2 on Nutritional Quality of Vegetables: A Review. Front. Plant Sci. 2018, 9, 924. [Google Scholar] [CrossRef]
  9. Cotrufo, M.F.; Ineson, P.; Scott, A. Elevated CO2 reduces the nitrogen concentration of plant tissues. Glob. Chang. Biol. 1998, 4, 43–54. [Google Scholar] [CrossRef]
  10. Gifford, R.M.; Barrett, D.J.; Lutze, J.L. The effects of elevated [CO2] on the C:N and C:P mass ratios of plant tissues. Plant Soil 2000, 224, 1–14. [Google Scholar] [CrossRef]
  11. LaNoue, J.; Leonardos, E.D.; Khosla, S.; Hao, X.; Grodzinski, B. Effect of elevated CO2 and spectral quality on whole plant gas exchange patterns in tomatoes. PLoS ONE 2018, 13, e0205861. [Google Scholar] [CrossRef]
  12. Reich, P.B.; Hobbie, S.E.; Lee, T.; Ellsworth, D.S.; West, J.B.; Tilman, D.; Knops, J.M.H.; Naeem, S.; Trost, J. Nitrogen limitation constrains sustainability of ecosystem response to CO2. Nature 2006, 440, 922–925. [Google Scholar] [CrossRef] [PubMed]
  13. Arp, W.J. Effects of source-sink relations on photosynthetic acclimation to elevated CO2. Plant Cell Environ. 1991, 14, 869–875. [Google Scholar] [CrossRef]
  14. Niinemets, Ü.; Tenhunen, J.D.; Canta, N.R.; Chaves, M.M.; Faria, T.; Pereira, J.S.; Reynolds, J.F. Interactive effects of nitrogen and phosphorus on the acclimation potential of foliage photosynthetic properties of cork oak, Quercus suber, to elevated atmospheric CO2 concentrations. Glob. Chang. Biol. 1999, 5, 455–470. [Google Scholar] [CrossRef]
  15. Reich, P.B.; Hungate, B.A.; Luo, Y. Carbon-Nitrogen Interactions in Terrestrial Ecosystems in Response to Rising Atmospheric Carbon Dioxide. Annu. Rev. Ecol. Evol. Syst. 2006, 37, 611–636. [Google Scholar] [CrossRef] [Green Version]
  16. Sanz-Sáez, Á.; Erice, G.; Aranjuelo, I.; Nogués, S.; Irigoyen, J.J.; Sánchez-Díaz, M. Photosynthetic down-regulation under elevated CO2 exposure can be prevented by nitrogen supply in nodulated alfalfa. J. Plant Physiol. 2010, 167, 1558–1565. [Google Scholar] [CrossRef] [PubMed] [Green Version]
  17. Halpern, M.; Bar-Tal, A.; Lugassi, N.; Egbaria, A.; Granot, D.; Yermiyahu, U. The Role of Nitrogen in Photosynthetic Acclimation to Elevated [CO2] in Tomatoes. Plant Soil 2019, 434, 397–411. [Google Scholar] [CrossRef]
  18. Duval, B.D.; Blankinship, J.C.; Dijkstra, P.; Hungate, B.A. CO2 Effects on Plant Nutrient Concentration Depend on Plant Functional Group and Available Nitrogen: A Meta-analysis. Plant Ecol. 2012, 213, 505–521. [Google Scholar] [CrossRef]
  19. Taub, D.R.; Wang, X. Why are Nitrogen Concentrations in Plant Tissues Lower under Elevated CO2? A Critical Examination of the Hypotheses. J. Integr. Plant Biol. 2008, 50, 1365–1374. [Google Scholar] [CrossRef]
  20. Sardans, J.; Grau, O.; Chen, H.Y.H.; Janssens, I.A.; Ciais, P.; Piao, S.; Peñuelas, J. Changes in nutrient concentrations of leaves and roots in response to global change factors. Glob. Chang. Biol. 2017, 23, 3849–3856. [Google Scholar] [CrossRef]
  21. McDonald, E.P.; Erickson, J.E.; Kruger, E.L. Can Decreased Transpiration Limit Plant Nitrogen Acquisition in Elevated CO2? Funct. Plant Biol. 2002, 29, 1115–1120. [Google Scholar] [CrossRef]
  22. Mcgrath, J.M.; Lobell, D.B. Reduction of Transpiration and Altered Nutrient Allocation Contribute to the Nutrient Decline of Crops Grown in Elevated CO2 Concentrations. Plant Cell Environ. 2013, 36, 697–705. [Google Scholar] [CrossRef] [PubMed]
  23. Stitt, M.; Krapp, A. The interaction between elevated carbon dioxide and nitrogen nutrition: The physiological and molecular background. Plant Cell Environ. 1999, 22, 583–621. [Google Scholar] [CrossRef]
  24. Davey, P.A.; Wadge, K.; Parsons, A.; Atkinson, L.; Long, S.P. Does photosynthetic acclimation to elevated CO2 increase photosynthetic nitrogen-use efficiency? A study of three native UK grassland species in open-top chambers. Funct. Ecol. 1999, 13, 21–28. [Google Scholar] [CrossRef] [Green Version]
  25. Bloom, A.J.; Burger, M.; Asensio, J.S.R.; Cousins, A.B. Carbon Dioxide Enrichment Inhibits Nitrate Assimilation in Wheat and Arabidopsis. Science 2010, 328, 899–903. [Google Scholar] [CrossRef] [PubMed] [Green Version]
  26. Bloom, A.J.; Burger, M.; Kimball, B.A.; Pinter, J.P.J. Nitrate assimilation is inhibited by elevated CO2 in field-grown wheat. Nat. Clim. Chang. 2014, 4, 477–480. [Google Scholar] [CrossRef]
  27. Gruda, N.; Balliu, A.; Sallaku, G. Crop Technologies: Cucumber. In Good Agricultural Practices for Greenhouse Vegetable Production in the South East European Countries—Principles for Sustainable Intensification of Smallholder Farms; Baudoin, W., Nersisyan, A., Shamilov, A., Hodder, A., Gutierrez, D., de Pascale, S., Nicola, S., Gruda, N., Urban, L., Tanny, J., Eds.; Food and Agriculture Organization of the United Nations: Roma, Italy, 2017; Chapter 2 of Part III; pp. 287–300. [Google Scholar]
  28. Dong, J.; Li, X.; Chu, W.; Duan, Z. High nitrate supply promotes nitrate assimilation and alleviates photosynthetic acclimation of cucumber plants under elevated CO2. Sci. Hortic. 2017, 218, 275–283. [Google Scholar] [CrossRef]
  29. Agüera, E.; Ruano, D.; Cabello, P.; De La Haba, P. Impact of atmospheric CO2 on growth, photosynthesis and nitrogen metabolism in cucumber (Cucumis sativus L.) plants. J. Plant Physiol. 2006, 163, 809–817. [Google Scholar] [CrossRef]
  30. Dong, J.L.; Xu, Q.; Gruda, N.; Chu, W.Y.; Li, X.; Duan, Z.Q. Elevated and Super-elevated CO2 Differ in Their Interactive Effect with Nitrogen Availability on Fruit Yield and Quality of Cucumber. J. Sci. Food Agric. 2018, 98, 4509–4516. [Google Scholar] [CrossRef]
  31. Li, X.; Dong, J.L.; Chu, W.Y.; Chen, Y.J.; Duan, Z.Q. The relationship between root exudation properties and root morphological traits of cucumber grown under different nitrogen supplies and atmospheric CO2 concentrations. Plant Soil 2018, 425, 415–432. [Google Scholar] [CrossRef]
  32. Li, X.; Chu, W.Y.; Dong, J.L.; Duan, Z.Q. An Improved High-performance Liquid Chromatographic Method for the Determination of Soluble Sugars in Root Exudates of Greenhouse Cucumber Grown under CO2 Enrichment. J. Am. Soc. Hortic. Sci. 2014, 139, 356–363. [Google Scholar] [CrossRef]
  33. Sánchez-Guerrero, M.; Lorenzo, P.; Medrano, E.; Baille, A.; Castilla, N. Effects of EC-based irrigation scheduling and CO2 enrichment on water use efficiency of a greenhouse cucumber crop. Agric. Water Manag. 2009, 96, 429–436. [Google Scholar] [CrossRef]
  34. Gruda, N.; Bisbis, M.; Tanny, J. Impacts of protected vegetable cultivation on climate change and adaptation strategies for cleaner production—A review. J. Clean. Prod. 2019, 225, 324–339. [Google Scholar] [CrossRef]
  35. Gruda, N.; Bisbis, M.; Tanny, J. Influence of climate change on protected cultivation: Impacts and sustainable adaptation strategies—A review. J. Clean. Prod. 2019, 225, 481–495. [Google Scholar] [CrossRef]
  36. Bisbis, M.B.; Gruda, N.S.; Blanke, M.M. Securing Horticulture in a Changing Climate—A Mini Review. Horticulturae 2019, 5, 56. [Google Scholar] [CrossRef] [Green Version]
  37. Gruda, N.S. Increasing Sustainability of Growing Media Constituents and Stand-Alone Substrates in Soilless Culture Systems. Agronomy 2019, 9, 298. [Google Scholar] [CrossRef] [Green Version]
  38. Yamazaki, K. Nutrient Solution Culture; Pak-Kyo Co.: Tokyo, Japan, 1982; p. 251. [Google Scholar]
  39. Zhao, F.; McGrath, S.P.; Crosland, A.R. Comparison of three wet digestion methods for the determination of plant sulphur by inductively coupled plasma atomic emission spectroscopy (ICP-AES). Commun. Soil Sci. Plant Anal. 1994, 25, 407–418. [Google Scholar] [CrossRef]
  40. Broberg, M.C.; Högy, P.; Feng, Z.; Pleijel, H. Effects of Elevated CO2 on Wheat Yield: Non-Linear Response and Relation to Site Productivity. Agronomy 2019, 9, 243. [Google Scholar] [CrossRef] [Green Version]
  41. Jiang, Y.P.; Cheng, F.; Zhou, Y.H.; Xia, X.J.; Shi, K.; Yu, J.Q. Interactive effects of CO2 enrichment and brassinosteroid on CO2 assimilation and photosynthetic electron transport in Cucumis sativus. Environ. Exp. Bot. 2012, 75, 98–106. [Google Scholar] [CrossRef]
  42. Hartz, T.; Baameur, A.; Holt, D. Carbon Dioxide Enrichment of High-value Crops under Tunnel Culture. J. Am. Soc. Hortic. Sci. 1991, 116, 970–973. [Google Scholar] [CrossRef] [Green Version]
  43. Slack, G.; Hand, D.W. The effect of winter and summer CO2 enrichment on the growth and fruit yield of glasshouse cucumber. J. Hortic. Sci. 1985, 60, 507–516. [Google Scholar] [CrossRef]
  44. Peterson, A.G.; Ball, J.T.; Luo, Y.; Field, C.B.; Reich, P.B.; Curtis, P.S.; Griffin, K.L.; Gunderson, C.A.; Norby, R.J.; Tissue, D.T.; et al. The photosynthesis—Leaf nitrogen relationship at ambient and elevated atmospheric carbon dioxide: A meta-analysis. Glob. Chang. Biol. 1999, 5, 331–346. [Google Scholar] [CrossRef]
  45. Lee, T.D.; Tjoelker, M.G.; Ellsworth, D.S.; Reich, P.B. Leaf Gas Exchange Responses of 13 Prairie Grassland Species in the Field Under Elevated Carbon Dioxide and Increased Nitrogen Supply. New Phytol. 2001, 150, 405–418. [Google Scholar] [CrossRef] [Green Version]
  46. Sage, R.F.; Sharkey, T.D.; Seemann, J.R. Acclimation of Photosynthesis to Elevated CO2 in Five C3 Species. Plant Physiol. 1989, 89, 590–596. [Google Scholar] [CrossRef] [PubMed] [Green Version]
  47. Cure, J.D.; Acock, B. Crop responses to carbon dioxide doubling: A literature survey. Agric. For. Meteorol. 1986, 38, 127–145. [Google Scholar] [CrossRef]
  48. Saralabai, V.; Vivekanandan, M.; Babu, R.S. Plant Responses to High CO2 Concentration in the Atmosphere. Photosynthetica 1997, 33, 7–37. [Google Scholar] [CrossRef]
  49. Nederhoff, E.M.; De Graaf, R. Effects of CO2 on leaf conductance and canopy transpiration of greenhouse grown cucumber and tomato. J. Hortic. Sci. 1993, 68, 925–937. [Google Scholar] [CrossRef]
  50. Kimball, B.; Kobayashi, K.; Bindi, M. Responses of Agricultural Crops to Free-Air CO2 Enrichment. Adv. Agron. 2002, 77, 293–368. [Google Scholar]
  51. Song, X.D.; Zhou, G.S.; Ma, B.L.; Wu, W.; Ahmad, I.; Zhu, G.L.; Yan, W.K.; Jiao, X.R. Nitrogen Application Improved Photosynthetic Productivity, Chlorophyll Fluorescence, Yield and Yield Components of Two Oat Genotypes under Saline Conditions. Agronomy 2019, 9, 115. [Google Scholar] [CrossRef] [Green Version]
  52. Rogers, H.H.; Runion, G.; Krupa, S.V. Plant responses to atmospheric CO2 enrichment with emphasis on roots and the rhizosphere. Environ. Pollut. 1994, 83, 155–189. [Google Scholar] [CrossRef]
  53. Stitt, M. Nitrate Regulation of Metabolism and Growth. Curr. Opin. Plant Biol. 1999, 2, 178–186. [Google Scholar] [CrossRef]
  54. Stulen, I.; den Hertog, J. Root Growth and Functioning under Atmospheric CO2 Enrichment. Vegetatio 1993, 104, 99–115. [Google Scholar] [CrossRef]
  55. Lotfiomran, N.; Köhl, M.; Fromm, J. Interaction Effect between Elevated CO2 and Fertilization on Biomass, Gas Exchange and C/N Ratio of European Beech (Fagus sylvatica L.). Plants 2016, 5, 38. [Google Scholar] [CrossRef] [PubMed] [Green Version]
  56. Soares, J.; Deuchande, T.; Valente, L.M.; Pintado, M.; Vasconcelos, M.W. Growth and Nutritional Responses of Bean and Soybean Genotypes to Elevated CO2 in a Controlled Environment. Plants 2019, 8, 465. [Google Scholar] [CrossRef] [PubMed] [Green Version]
  57. Lenka, N.K.; Lenka, S.; Singh, K.K.; Kumar, A.; Aher, S.B.; Yashona, D.S.; Dey, P.; Agrawal, P.K.; Biswas, A.K.; Patra, A.K. Effect of elevated carbon dioxide on growth, nutrient partitioning, and uptake of major nutrients by soybean under varied nitrogen application levels. J. Plant Nutr. Soil Sci. 2019, 182, 509–514. [Google Scholar] [CrossRef]
  58. Bieleski, R.L. Phosphate Pools, Phosphate Transport, and Phosphate Availability. Annu. Rev. Plant Physiol. 1973, 24, 225–252. [Google Scholar] [CrossRef]
  59. Hamburger, D.; Rezzonico, E.; Petétot, J.M.C.; Somerville, C.; Poirier, Y. Identification and Characterization of the Arabidopsis PHO1 Gene Involved in Phosphate Loading to the Xylem. Plant Cell 2002, 14, 889–902. [Google Scholar] [CrossRef] [Green Version]
  60. Peet, M.M.; Huber, S.C.; Patterson, D.T. Acclimation to High CO2 in Monoecious Cucumbers: II. Carbon Exchange Rates, Enzyme Activities, and Starch and Nutrient Concentrations. Plant Physiol. 1986, 80, 63–67. [Google Scholar] [CrossRef] [Green Version]
  61. Jauregui, I.; Aparicio-Tejo, P.M.; Avila, C.; Cañas, R.; Sakalauskiene, S.; Aranjuelo, I. Root-shoot Interactions Explain the Reduction of Leaf Mineral Content in Arabidopsis Plants Grown under Elevated [CO2] Conditions. Physiol. Plant 2016, 158, 65–79. [Google Scholar] [CrossRef]
  62. Blevins, D.G.; Barnett, N.M.; Frost, W.B. Role of Potassium and Malate in Nitrate Uptake and Translocation by Wheat Seedlings. Plant Physiol. 1978, 62, 784–788. [Google Scholar] [CrossRef] [Green Version]
  63. Triplett, E.W.; Barnett, N.M.; Blevins, D.G.; Reed, A.J.; Below, F.E.; Hageman, R.H. Organic Acids and Ionic Balance in Xylem Exudate of Wheat during Nitrate or Sulfate Absorption. Plant Physiol. 1980, 65, 610–613. [Google Scholar] [CrossRef] [Green Version]
  64. Jauhiainen, J.; Vasander, H.; Silvola, J. Nutrient concentration in shape Sphagna at increased N-deposition rates and raised atmospheric CO2 concentrations. Plant Ecol. 1998, 138, 149–160. [Google Scholar] [CrossRef]
  65. Demarty, M.; Morvan, C.; Thellier, M. Calcium and the cell wall. Plant Cell Environ. 1984, 7, 441–448. [Google Scholar] [CrossRef]
Figure 1. Net photosynthesis rate, stomatal conductance, and transpiration rate of cucumbers grown under different N and [CO2] levels at three growth stages (n = 6). Bars represent standard errors. CO2 levels: C1, C2, and C3: 400, 625, and 1200 μmol mol−1. N levels: N1, N2, N3, N4, and N5: 2, 4, 7, 14, and 21 mmol L−1. Means not followed by the same lower case letters are significantly different among different N levels in the same CO2 level and growth stage, and not followed by the same upper case letters are significantly different among different CO2 levels in the same N level and growth stage, and not followed by the same Greek letters are significantly different among different growth stages in the same CO2 and N level, according to Duncan’s test at p < 0.05. In the internal table, C: [CO2] level; N: N level; T: growth stage. Asterisks (*) indicate significant differences (* p < 0.05; ** p < 0.01; *** p < 0.001); - indicates non-significant differences (p ≥ 0.05).
Agronomy 10 00139 g001
Figure 2. Nitrogen concentrations in different tissues of cucumber plants grown under different N and [CO2] levels at two growth stages (n = 6). Bars represent standard errors. CO2 levels: C1, C2, and C3: 400, 625, and 1200 μmol mol−1. N levels: N1, N2, N3, N4, and N5: 2, 4, 7, 14, and 21 mmol L−1. Means not followed by the same lower case letters are significantly different among different N levels in the same CO2 level and growth stage, and not followed by the same upper case letters are significantly different among different CO2 levels in the same N level and growth stage, according to Duncan’s test at p < 0.05. Means with asterisks are significantly different between two growth stages in the same CO2 and N level (*p < 0.05; ** p < 0.01; *** p < 0.001). In the internal table, C: [CO2] level; N: N level; T: growth stage. Asterisks (*) indicate significant differences (* p < 0.05; ** p < 0.01; *** p < 0.001); - indicates non-significant differences (p ≥ 0.05).
Agronomy 10 00139 g002
Figure 3. Phosphorus concentrations in different tissues of cucumber plants grown under different N and [CO2] levels at two growth stages (n = 6). Bars represent standard errors. CO2 levels: C1, C2, and C3: 400, 625, and 1200 μmol mol−1. N levels: N1, N2, N3, N4, and N5: 2, 4, 7, 14, and 21 mmol L−1. Means not followed by the same lower case letters are significantly different among different N levels in the same CO2 level and growth stage, and not followed by the same upper case letters are significantly different among different CO2 levels in the same N level and growth stage, according to Duncan’s test at p < 0.05. Means with asterisks are significantly different between two growth stages in the same CO2 and N level (* p < 0.05; ** p < 0.01; *** p < 0.001). In the internal table, C: [CO2] level; N: N level; T: growth stage. Asterisks (*) indicate significant differences (* p < 0.05; ** p < 0.01; *** p < 0.001); - indicates non-significant differences (p ≥ 0.05).
Agronomy 10 00139 g003
Figure 4. Potassium concentrations in different tissues of cucumber plants grown under different N and [CO2] levels at two growth stages (n = 6). Bars represent standard errors. CO2 levels: C1, C2, and C3: 400, 625, and 1200 μmol mol−1. N levels: N1, N2, N3, N4, and N5: 2, 4, 7, 14, and 21 mmol L−1. Means not followed by the same lower case letters are significantly different among different N levels in the same CO2 level and growth stage, and not followed by the same upper case letters are significantly different among different CO2 levels in the same N level and growth stage, according to Duncan’s test at p < 0.05. Means with asterisks are significantly different between two growth stages in the same CO2 and N level (* p < 0.05; ** p < 0.01; *** p < 0.001). In the internal table, C: [CO2] level; N: N level; T: growth stage. Asterisks (*) indicate significant differences (* p < 0.05; ** p < 0.01; *** p < 0.001); - indicates non-significant differences (p ≥ 0.05).
Agronomy 10 00139 g004
Figure 5. Calcium concentrations in different tissues of cucumber plants grown under different N and [CO2] levels at two growth stages (n = 6). Bars represent standard errors. CO2 levels: C1, C2, and C3: 400, 625, and 1200 μmol mol−1. N levels: N1, N2, N3, N4, and N5: 2, 4, 7, 14, and 21 mmol L−1. Means not followed by the same lower case letters are significantly different among different N levels in the same CO2 level and growth stage, and not followed by the same upper case letters are significantly different among different CO2 levels in the same N level and growth stage, according to Duncan’s test at p < 0.05. Means with asterisks are significantly different between two growth stages in the same CO2 and N level (* p < 0.05; ** p < 0.01; *** p < 0.001). In the internal table, C: [CO2] level; N: N level; T: growth stage. Asterisks (*) indicate significant differences (* p < 0.05; ** p < 0.01; *** p < 0.001); - indicates non-significant differences (p ≥ 0.05).
Agronomy 10 00139 g005
Figure 6. Magnesium concentrations in different tissues of cucumber plants grown under different N and [CO2] levels at two growth stages (n = 6). Bars represent standard errors. CO2 levels: C1, C2, and C3: 400, 625, and 1200 μmol mol−1. N levels: N1, N2, N3, N4, and N5: 2, 4, 7, 14, and 21 mmol L−1. Means not followed by the same lower case letters are significantly different among different N levels in the same CO2 level and growth stage, and not followed by the same upper case letters are significantly different among different CO2 levels in the same N level and growth stage, according to Duncan’s test at p < 0.05. Means with asterisks are significantly different between two growth stages in the same CO2 and N level (* p < 0.05; ** p < 0.01; *** p < 0.001). In the internal table, C: [CO2] level; N: N level; T: growth stage. Asterisks (*) indicate significant differences (* p < 0.05; ** p < 0.01; *** p < 0.001); - indicates non-significant differences (p ≥ 0.05).
Agronomy 10 00139 g006
Figure 7. Pearson correlations between [CO2], N supply, transpiration rate and mineral nutrient concentration of cucumber grown under different N and [CO2] levels at two growth stages. Tr: transpiration rate.
Agronomy 10 00139 g007
Table 1. Components of macro-nutrient solutions in different N levels.
N 1
Levels
Compounds (mmol L−1)Elements (mmol L−1)
Ca(NO3)2
∙4H2O
KNO3NH4H2PO4MgSO4
∙7H2O
NH4NO3KH2PO4K2SO4Ca(H2PO4)2
∙H2O
CaSO4
∙2H2O
NPKCaMgS
Total-NNH4+-NNO3-N
N11- 2-2--30.52202163.527
N22--2--30.51404163.526
N33.5--2-12.5--707163.524.5
N43.5612-----14113163.522
N53.56123.5----214.516.5163.522
1 N level: N1, 2 mmol L−1; N2, 4 mmol L−1; N3, 7 mmol L−1; N4, 14 mmol L−1; N5, 21 mmol L−1; 2 -, no chemicals.
Table 2. The dry weight of roots, stems, leaves, whole plants and root/shoot ratios of cucumber grown under different [CO2] and N levels at the seedling and initial fruiting stages (n = 6).
Stage 1CO2 2 LevelN 3 LevelDry Weight (g plant−1)
RootsStemsLeavesTotalRoot/Shoot
T1C1N10.081 ± 0.005 Aa 40.140 ± 0.012 Ab0.505 ± 0.020 Ab0.726 ± 0.022 Ab0.127 ± 0.010 Aa
N20.080 ± 0.008 Ba0.162 ± 0.014 Bab0.618 ± 0.045 Ba0.860 ± 0.066 Bab0.102 ± 0.005 Bab
N30.076 ± 0.006 Aa0.144 ± 0.009 Bb0.589 ± 0.026 Bab0.809 ± 0.036 Bab0.104 ± 0.007 Aab
N40.070 ± 0.005 Ba0.158 ± 0.010 Bab0.639 ± 0.027 Ba0.867 ± 0.037 Ba0.089 ± 0.007 Ab
N50.070 ± 0.008 Ba0.185 ± 0.013 Ba0.674 ± 0.035 Ba0.930 ± 0.045 Ba0.083 ± 0.011 Ab
C2N10.104 ± 0.023 Aa0.174 ± 0.014 Ab0.550 ± 0.085 Ab0.828 ± 0.119 Ab0.138 ± 0.010 Aa
N20.112 ± 0.012 Aa0.209 ± 0.015 Aab0.726 ± 0.050 ABa1.047 ± 0.073 Aab0.118 ± 0.007 Aab
N30.091 ± 0.007 Aa0.221 ± 0.017 Aab0.744 ± 0.048 Aa1.056 ± 0.069 Aab0.095 ± 0.004 Ac
N40.088 ± 0.005 Ba0.227 ± 0.023 Aa0.749 ± 0.033 Ba1.064 ± 0.060 Bab0.091 ± 0.003 Ac
N50.104 ± 0.008 Aa0.234 ± 0.012 ABa0.797 ± 0.059 Ba1.135 ± 0.070 Ba0.102 ± 0.010 Abc
C3N10.111 ± 0.015 Aa0.166 ± 0.009 Ab0.560 ± 0.022 Ac0.837 ± 0.044 Ac0.151 ± 0.015 Aa
N20.108 ± 0.006 Aa0.218 ± 0.011 Ab0.772 ± 0.021 Ab1.098 ± 0.031 Ab0.108 ± 0.005 Ab
N30.089 ± 0.017 Aa0.195 ± 0.020 Ab0.763 ± 0.070 Ab1.047 ± 0.102 Abc0.091 ± 0.011 Ab
N40.122 ± 0.015 Aa0.281 ± 0.024 Aa0.970 ± 0.058 Aa1.373 ± 0.094 Aa0.096 ± 0.006 Ab
N50.134 ± 0.015 Aa0.280 ± 0.028 Aa0.995 ± 0.078 Aa1.410 ± 0.112 Aa0.105 ± 0.007 Ab
T2C1N10.298 ± 0.018 Ac0.982 ± 0.058 Ad1.546 ± 0.110 Ac2.826 ± 0.157 Ac0.119 ± 0.008 Aa
N20.347 ± 0.031 Ac1.294 ± 0.068 Acd2.640 ± 0.175 Abc4.281 ± 0.268 Abc0.088 ± 0.004 Ac
N30.401 ± 0.075 Bbc1.684 ± 0.194 Abc3.260 ± 0.507 Bab5.345 ± 0.770 Bab0.079 ± 0.004 Ac
N40.551 ± 0.041 Aab2.101 ± 0.138 Aab4.076 ± 0.327 Ba6.728 ± 0.483 Ba0.091 ± 0.006 Abc
N50.699 ± 0.102 Aa2.375 ± 0.334 Ba4.188 ± 0.611 Ba7.262 ± 1.034 Ba0.106 ± 0.006 Aab
C2N10.222 ± 0.028 Bc0.700 ± 0.079 Bc1.157 ± 0.166 Ac2.079 ± 0.261 Bc0.120 ± 0.005 Aa
N20.310 ± 0.066 Abc1.264 ± 0.235 Abc2.256 ± 0.424 Abc3.830 ± 0.719 Abc0.087 ± 0.005 Ab
N30.356 ± 0.059 Babc1.532 ± 0.259 Aabc3.405 ± 0.401 Bb5.294 ± 0.614 Bb0.073 ± 0.009 Ab
N40.567 ± 0.151 Aab2.097 ± 0.442 Aab5.012 ± 0.730 Ba7.677 ± 1.274 Ba0.074 ± 0.011 Ab
N50.635 ± 0.103 Aa2.254 ± 0.367 Ba5.117 ± 0.277 Ba8.006 ± 0.674 Ba0.084 ± 0.010 Ab
C3N10.223 ± 0.020 Bb0.751 ± 0.068 Bc1.194 ± 0.143 Ab2.168 ± 0.220 Bc0.116 ± 0.007 Aa
N20.341 ± 0.038 Ab1.287 ± 0.149 Ac2.160 ± 0.265 Ab3.789 ± 0.436 Ac0.101 ± 0.007 Aab
N30.729 ± 0.144 Aa2.571 ± 0.471 Ab5.728 ± 0.492 Aa9.028 ± 0.965 Ab0.084 ± 0.012 Ab
N40.983 ± 0.195 Aa3.370 ± 0.687 Aab7.030 ± 0.729 Aa11.38 ± 1.52 Aab0.091 ± 0.011 Aab
N50.902 ± 0.080 Aa4.199 ± 0.404 Aa7.248 ± 0.703 Aa12.35 ± 1.00 Aa0.082 ± 0.011 Ab
C*** 6*********NS
N***************
T***************
C × NNS*******NS
C × T***********NS
N × T************NS
C × N × T5NS*****NS
1 Growth stage: T1, seedling stage (18 DAT); T2, initial fruiting stage (62 DAT); 2 CO2 level: C1, C2, and C3: 400, 625, and 1200 μmol mol−1; 3 N level: N1, N2, N3, N4, and N5: 2, 4, 7, 14, and 21 mmol L−1; 4 Means within rows at the same stage not followed by the same lower case letters are significantly different among different N levels in the same CO2 level, and not followed by the same upper case letters are significantly different among different CO2 levels in the same N level, according to Duncan’s test at p < 0.05; 5 C: [CO2] level; N: N level; T: growth stage; 6 Asterisks (*) indicate significant differences (* p < 0.05; ** p < 0.01; *** p < 0.001). NS indicates non-significant differences (p ≥ 0.05).

