Article

Natural Variation in Fatty Acid Composition of Diverse World Soybean Germplasms Grown in China

1
The National Engineering Laboratory for Crop Molecular Breeding, MARA Key Laboratory of Soybean Biology (Beijing), Institute of Crop Sciences, Chinese Academy of Agricultural Sciences, 12 Zhongguancun South Street, Beijing 100081, China
2
Crop Science Department, Faculty of Agriculture, Damanhour University, Damanhour 22516, Egypt
*
Authors to whom correspondence should be addressed.
These authors contributed equally to this work.
Agronomy 2020, 10(1), 24; https://doi.org/10.3390/agronomy10010024
Submission received: 16 November 2019 / Revised: 17 December 2019 / Accepted: 19 December 2019 / Published: 23 December 2019
(This article belongs to the Special Issue Genetics, Genomics, and Breeding of Legume Crops)

Abstract

:
Soybean (Glycine max L. Merr.) is one of the most important crops in the world. Its major content of vegetable oil made it widely used for human consumption and several food industries. To investigate the variation in seed fatty acid composition of soybeans from different origins, a set of 633 soybean accessions originated from four diverse germplasm collections—including China, United States of America (USA), Japan, and Russia—were grown in three locations, Beijing, Anhui, and Hainan for two years. The results showed significant differences (P < 0.001) among the four germplasm origins for all fatty acid contents investigated. Higher levels, on average, of palmitic acid (PA) and linolenic acid (LNA) were observed in Russian germplasm (12.31% and 8.15%, respectively), whereas higher levels of stearic acid (SA) and oleic acid (OA) were observed in Chinese germplasm (3.95% and 21.95%, respectively). The highest level of linoleic acid (LA) was noticed in the USA germplasm accessions (56.34%). The largest variation in fatty acid composition was found in LNA, while a large variation was observed between Chinese and USA germplasms for LA level. Maturity group (MG) significantly (P < 0.0001) affected all fatty acids and higher levels of PA, SA, and OA were observed in early maturing accessions, while higher levels of LA and LNA were observed in late maturing accessions. The trends of fatty acids concentrations with different MG in this study further provide an evidence of the importance of MG in breeding for such soybean seed components. Collectively, the unique accessions identified in this study can be used to strengthen the soybean breeding programs for meeting various human nutrition patterns around the globe.

1. Introduction

Soybean (Glycine max L. Merr.) is a leading important oil crop grown worldwide due to its diverse uses of oil and protein for human and livestock. Soybean oil accounts for 60.85% of the world’s oil seed production [1]; therefore, it has become the most dominant vegetable oil by far. During 2016 to 2017, the United States of America (USA) and Brazil together accounted for 83% of total world soybean exports [2]. However, China’s soybean imports from USA and Brazil accounted for 61% and 77% of their soybean exports, respectively. China accounted for 65% of total world soybean trade value [2]. Soybean is becoming one of the most important oil crops in both China and USA.
Mainly, soybean oil contains saturated fatty acids such as palmitic (16:0) and stearic (18:0) acids. In addition, it contains unsaturated fatty acids such as oleic (18:1), linoleic (18:2), and linolenic (18:3) acids. Fatty acid composition studies are important for improving quality and stability of soybean oil. Typically, soybean has low levels of saturated fatty acids. It was reported that diets rich in saturated fatty acids are associated with an elevated risk of cardiovascular diseases, leading to increased blood serum cholesterol [3,4]. On the other hand, high levels of saturated fatty acids were found to improve the oxidation stability of soybean oil [5]. Particularly, oils with higher stearic acid (SA) levels result in higher melting temperatures, making it suitable for processing of soft margarines with better sensory characteristics, as well as other various baking applications. Higher levels of unsaturated fatty acids improve the quality of the oil for human health [6]. Intrinsically, an oil profile with very high oleic acid (OA) content is influential for enhancing the functionality of soybean oil for food uses free of trans-fatty acids [7]. Linolenic acid (LNA) inhibits triglyceride synthesis and low-density lipoproteins (LDL) in the liver, playing a role in decreasing triglyceride levels in the blood [8]. Some studies pointed out that LNA is involved in maintaining brain nerve functions [9]. Despite these benefits of LNA, polyunsaturated fatty acids, linoleic acid (LA), and LNA, adversely affect the oxidative stability of soybean oil, causing off-flavor problems [10]. Soybean oils with high OA (more than 80%) and low LNA (less than 1%) have been reported in several studies [11,12,13], and the monounsaturated fatty acid, OA, not only increases oil oxidative stability, but also reduces the production of trans-fat during food processing, making it more desirable.
It is worth noting that wide variations in levels of saturated and unsaturated fatty acids have been detected in several studies on crop germplasm collections [14,15,16]. Such variations could offer possibilities of developing superior accessions with high quality edible and specialized industrial oils. The variability in fatty acid composition is undoubtedly due to both genetic and weather factors [17,18], which affect their nutritional value and processing property. Basically, much more changes are observed in the preferences for soybean oil owing to the noticeable awareness towards human health care. Consequently, breeding programs designed for altering the soybean oil profile have become a priority for improving both food and industrial uses of soybean oil [19]. Therefore, many studies on soybean seed fatty acid composition have been conducted by soybean breeders in order to develop modified oils that will match the increasing needs of consumers [7,12,14,20,21,22]. Those several needs of particular uses are divided into nutritional, industrial, or pharmaceutical aspects which generally depend on the vegetable oil quality and its fatty acid composition.
It is generally accepted that introducing new germplasms is indispensable in order to achieve wider genetic diversity and strengthen breeding stock resources. Traditional approaches of breeding methods have been using different sets of germplasm to develop new soybean lines with modified fatty acid composition [10]. Such success in breeding strategies depends largely on available germplasm collections. Germplasm collections largely vary in their origins and may elucidate elite accessions that can be exploited for multiple crop breeding programs. Previous studies on seed fatty acid composition of several germplasm collections from different oil crops—such as sesame [23], Brassica species [24,25], and safflower [15,16,26]—have showed a wide variation for fatty acid composition. Likewise, many studies have been conducted on soybean seed fatty acid composition collected from various sources [20,21,27,28,29,30]. These studies suggested that soybeans collected from various sources demonstrated key differences in their nutritional composition [31]. Furthermore, classification of soybean accessions into different maturity groups facilitates judgment about the prospects of introducing new varieties, and such an important role in soybean breeding cannot be overemphasized [32].
Despite the extensive research work conducted on variability in soybean seed fatty acids profile, very little is known, to our knowledge, about exploring the variation among diverse germplasms evaluated under same environmental conditions. In an attempt to address this gap, this study exploited four diverse soybean collections which originates from China, USA, Russia, and Japan with varying maturity groups to provide maximal sample heterogeneity. It is expected that these soybean germplasms would have varying nutrient composition and quality profiles. The aims of this study were to comprehensively investigate the variation in seed fatty acid composition among different world soybean germplasms, evaluate the effect of maturity group on seed fatty acid composition, and determine the adaptability of these germplasms in China.

2. Materials and Methods

2.1. Plant Materials

A total of 633 soybean accessions collected from four different regions worldwide—China (451 accessions), USA (138 accessions), Japan (27 accessions), and Russia (17 accessions)—were used in this study. Among the whole collection, 11 maturity groups (MG000-VIII) were identified for only 432 accessions and classified as MG000 (5 accessions), MG00 (8 accessions), MG0 (40 accessions), MGI (63 accessions), MGII (49 accessions), MGIII (104 accessions), MGIV (59 accessions), MGV (44 accessions), MGVI (32 accessions), MGVII (24 accessions), and MGVIII (4 accessions). Accessions with MG000, MG00, and MGVIII were not used in analyzing the effect of MG on seed fatty acid composition due to low number of these accessions, so a total of 415 accessions of MG0–VII were finally used. This panel of soybean germplasm was provided by the germplasm research group of the Institute of Crop Sciences, Chinese Academy of Agricultural Sciences (CAAS). Information of these four germplasm collections is shown in Table S1. Basically, the whole set of accessions in this study is conserved in the Chinese National Soybean Gene Bank (CNSGB).
The Chinese accessions used in this study were collected from the entire Chinese collection of 23,587 soybean accessions conserved in the CNSGB [33,34]. This collection was used to establish a core collection of 2,794 accessions, which represents 11.8% of the entire collection and gains genetic diversity of 73.6% [34]. The 451 Chinese accessions investigated in our recent study account for nearly 1.9% of the total entire Chinese germplasm collection and approximately 16% of the mentioned Chinese core collection. Furthermore, this Chinese collection was originally collected from three major soybean growing regions in China, namely Northern region, Huanghuaihai region, and Southern region, covering an area from 23° N to 51° N [35,36]. The ranges of maturity groups for the Northern, Huanghuaihai, and Southern regions are MG000–II, II–V, and IV–VIII, respectively [37]. With respect to the USA collection, 138 soybean accessions were selected covering various maturity groups from MG000 to VIII, and included many standard varities for maturity group in North America. It is worth noting that information on fatty acid composition of some of these accessions has been reported by the United States Department of Agriculture (USDA) [38] that could have been a basis of systematic selection of soybean accessions. In addition, Russian and Japanese accessions investigated here were selected as representative varieties for their countries of origin and also to provide more diverse panel of accessions along with Chinese and USA accessions.

2.2. Field Experiments

Field trials were conducted at Changping (40°13′ N, 116°12′ E), Beijing, and Sanya (18°24′ N, 109°5′ E), Hainan province, in 2017 and 2018, and at Hefei (33°61′ N 117°0′ E), Anhui province, in 2017. All accessions were planted at Changping, Beijing, on 12 June 2017 and 14 June 2018, respectively; at Sanya, Hainan, on 14 November 2017 and 16 November 2018, respectively; and at Hefei, Anhui, on 5 June 2017.The soil pH, total nitrogen, phosphorus, and potassium levels were 8.22, 80.5 mg kg−1, 68.7 mg kg−1, and 12.31 g kg−1 at Changping [39], respectively; 6.6, 35.91 mg kg−1, 56 mg kg−1, and 134.40 g kg−1 at Hefei, respectively; and 5.27, 98.59 mg kg−1, 39.68 mg kg−1, and 80.78 g kg−1 at Sanya, respectively. The average monthly temperature and rainfall of the three experimental sites are shown in Table S2. In each location, all the soybean accessions were planted following standard local practices. The field experiments were laid out in a randomized incomplete block design, as the different planting locations were used as replications. For each location, soybean seeds of each accession were planted in a 3-m row, spaced 0.5 m apart between rows and 0.1 m between plants within each row. After emergence, the plants were thinned to maintain a uniform and healthy population as well as providing better representative sampling. Plots were fertilized with 15 t ha−1 organic fertilizer, 30 kg N ha−1, 40 kg P ha−1, and 60 kg K ha−1 during field preparation before sowing. Weeds were controlled by post-emergence application of 2.55 L ha−1 of acetochlor (Acetochlor®, 50% EC, Rainbow Chemical, Shandong, China), as well as hand weeding during the growing season. When the plants reached physiological maturity, plots were harvested manually. As the accessions of different maturity groups were grown at different locations and growing times, the harvest dates varied across the three locations. In Changping, the accessions from Northern China were harvested at the same time with the USA, Japanese and Russian accessions in the same maturity groups during the last week of September, while the other Chinese accessions from Huanghuaihai and Southern regions were harvested during the first and second week of October, respectively. At Hefei, all the plant materials were harvested in three batches similar to Changping, but with one week earlier than Changping, while all the plant materials were harvested at the same time at Sanya in mid-February. The total growing durations for the three locations were 102 to 120 days at Changping, 101 to 119 days in Hefei, and 94 to 96 days at Sanya. Some accessions matured very late and could not get mature seeds, therefore they were discarded at the last harvest time. All the plants in each plot were harvested, after which 100 seeds were selected randomly for each accession for fatty acid determination.

2.3. Fatty Acid Extraction and Determination

The five essential fatty acids (palmitic, stearic, oleic, linoleic, and linolenic) were derivatized into their methyl esters and their abundances determined using gas chromatography [40]. In brief, fine powder was obtained from soybean seeds by grinding 20 g of seeds from each accession with a sample preparation mill (Retsch ZM100, Φ = 1.0 mm, Rheinische, Germany). Then, 300 mg of powder from each sample was weighed out using an analytic balance (Sartorius BS124S, Gottingen, Germany) and transferred to a 2 mL centrifuge tube preloaded with 1.0 mL n-hexane. This mixture was kept for 20 min at 65 °C and shaken for 10 sec every 5 min. Next, 1.0 mL sodium methoxide solution was added to the mixture, and the mixture was shaken for 10 min on a twist mixer (TM-300, ASONE, Japan) at 65 °C to allow full methyl esterification of the fatty acids, and centrifuged at 12,000× g for 2 min. The final supernatant was assayed to determine the concentrations of the methyl esters of the five fatty acids using a GC-2010 gas chromatograph (SHIMADZU Inc., Kyoto, Japan) with flame ionization detector. The chromatographic separation was carried out using an RTX-WAX column (30 m length× 0.25 mm internal diameter × 0.25 mm thickness, Germany) with the following temperature gradient: initially, the temperature was set at 180 °C for 1.5 min, then increased to 210 °C at a rate of 10 °C min−1, kept at 210 °C for 2 min, increased to 220 °C at a rate of 5 °C min−1, and kept at 220 °C for 5 min. The carrier gas was nitrogen, at a flow rate of 54 mL min−1, and 1 μL of each sample was injected. Area was normalized (relative concentrations by mass) to quantify the five fatty acid concentrations using a GC2010 workstation [40]. The content of each fatty acid was expressed as a percentage of total fatty acid content.

2.4. Data Analysis

The analysis of variance (ANOVA) for seed fatty acid composition was conducted using the general linear model (GLM) procedure with a random statement in SAS 9.2 software for Windows [41]. The different planting locations were used as replications and together with year they were considered as random effect. The origin of accessions, accessions and MG were considered as fixed effect. Multiple comparisons among origins of accessions were conducted using Fisher’s least significant difference (LSD) test. Boxplots were drawn to show the variation in seed fatty acid composition among the four origins. Scatter plots were used to display the relationship between different MGs and each fatty acid, and also the relationship between mean of each fatty acid with its CV. Pearson’s correlation was used to access the associations among the five fatty acids. In R project (version 3.4.5), ggplot2 package was used to draw boxplot and scatter plot, while the corrplot package was used to graphically display correlation matrix.

3. Results and Discussion

3.1. Variation in Seed Fatty Acid Composition in Soybean Accessions

The average fatty acid contents of 633 soybean accessions across three environments for two years are presented in Table 1. Linoleic acid showed predominant average content (54.41%) among all the fatty acids, whereas stearic acid showed the lowest average content (3.92%). The widest range was noticed in oleic acid (13.55–31.88%), followed by linoleic acid (45.64–63.93%), while stearic acid showed the narrowest range (8.23–17.2%). Generally, the lower levels of saturated than unsaturated fatty acids in the current study was in agreement with those reported previously [7,10]. The observed SA level in this study was low in comparison with previous studies [42,43], while levels of palmitic acid (12.12%) and OA (21.63%) in this study were higher than that previously reported by [21,42,43]. The current study also showed a wider range of LNA content when compared with previous studies [42,43]. Such variability between our study and previous works may most likely be due to large collections from various regions exploited in our study. Moreover, LNA content exhibited the highest CV (15.34%) among the five fatty acids, revealing that LNA content had the highest abundant variation which underlies the effects of both diverse germplasms and environments on LNA content. LA content, contrary to LNA, exhibited the lowest CV (5.07%) among all the fatty acids which indicates that growing those accessions with higher LA levels and less changeable effect across different locations is profitable. Theoretically, LA, (omega-6) and LNA (omega-3) are absolutely essential fatty acids which should be obtained from rich diet. Elevated levels of both LA and LNA in soybean oil are necessarily needed for healthier human nutrition [8,9]. Furthermore, serious problems—such as heart diseases, asthma, and other syndromes—could influence human health due to the lack of LA and LNA in diets [44,45]. On the contrary, soybean accessions with high LNA content are not favorable for producing stable oil, as oil with raised concentrations of LNA oxidizes rapidly, inducing off-flavors compounds in cooked foods [10]. Recently, demands for soybean oil as a raw material for producing biodiesel have raised, thus soybean oil higher in OA and lower in LA contents are also preferred for meeting these needs [46].
Breeding soybean for altered seed fatty acid composition has been extensively studied [7,12,14,20,21,22] in order to develop modified oils ready for meeting the increasing needs of consumption. Rebetzke et al. [14], used 22 low and 22 normal PA lines derived from two crosses of N87-2122-4 × ‘Kenwood’ and N87-2122-4 × ‘P9273′, and reported that OA and LNA contents in those reduced PA lines were significantly higher than that of normal PA lines, while LA content showed no significant changes. They concluded that using soybeans with reduced PA content could improve soybean quality. As mutagenesis is also one of the conventional breeding methods followed to change the oil and its fatty acid composition, Pham et al. [12] studied the incorporation of mutant FAD3 genes into high OA background to lower the LNA content. Results of their investigation identified lines with less than 2% LNA content. Furthermore, the study of La et al. [21] which aimed to characterize seed composition traits, including fatty acids, in 80 wild soybean plant introductions (PIs) from the USDA soybean collection, observed a lower OA content (122.1 g kg−1) while LNA content was high (163.8 g kg−1). They suggested the possibility of exploiting this collection of wild soybean in improving oil profile constituents in cultivated soybean for human health benefits. genome-wide association studies (GWAS) were recently conducted and resulted in identification of beneficial alleles and candidate genes which are expected to be valuable for generally improving seed quality [47] and particularly improving unsaturated fatty acid of soybean [11].
In the current study, the highest accession in PA content was T309 (17.20%) from USA, while YZY2004-15-W90, from China, had the lowest content of PA (8.23%) (Table 2). For SA, ZDD00294 from China had the highest level (5.19%), whereas WDD00405, from USA, had the lowest level (2.71%) (Table 2). This shows the existence of a wider variability between the Chinese and USA germplasms for PA and SA. The Chinese accession ZDD02925 showed the highest OA content (31.88%), whereas ZDD09581 contained the lowest level of OA (13.55%) (Table 2). The observed result showed a large variation among the Chinese accessions for OA content. The highest level of LA was yielded by accession S01-9391 from USA (63.93%), whereas the Chinese accession ZDD02925, in contrast to its OA content, recorded the lowest LA content (45.64%) (Table 2).
For LNA, the Chinese accession ZDD03739 had the highest content (12.76%), while C1640 from USA had the lowest LNA content (3.43%) (Table 2). The variability among USA accessions in LA and LNA contents in this study can explicitly provide insights into achieving a goal of dual purpose soybean accessions; accessions with higher LA to produce healthier soybean oil and lower LNA to achieve oil stability. USA accessions with lower level of LNA, such as accession C1640, offers vital source for more advanced research on low-LNA soybean studies with the aim of improving oil stability. Genetically, Fehr et al. [48] reported that the expression of low LNA content is governed by, at least, two recessive alleles and a combination of these alleles will decrease LNA level to less than 3%.

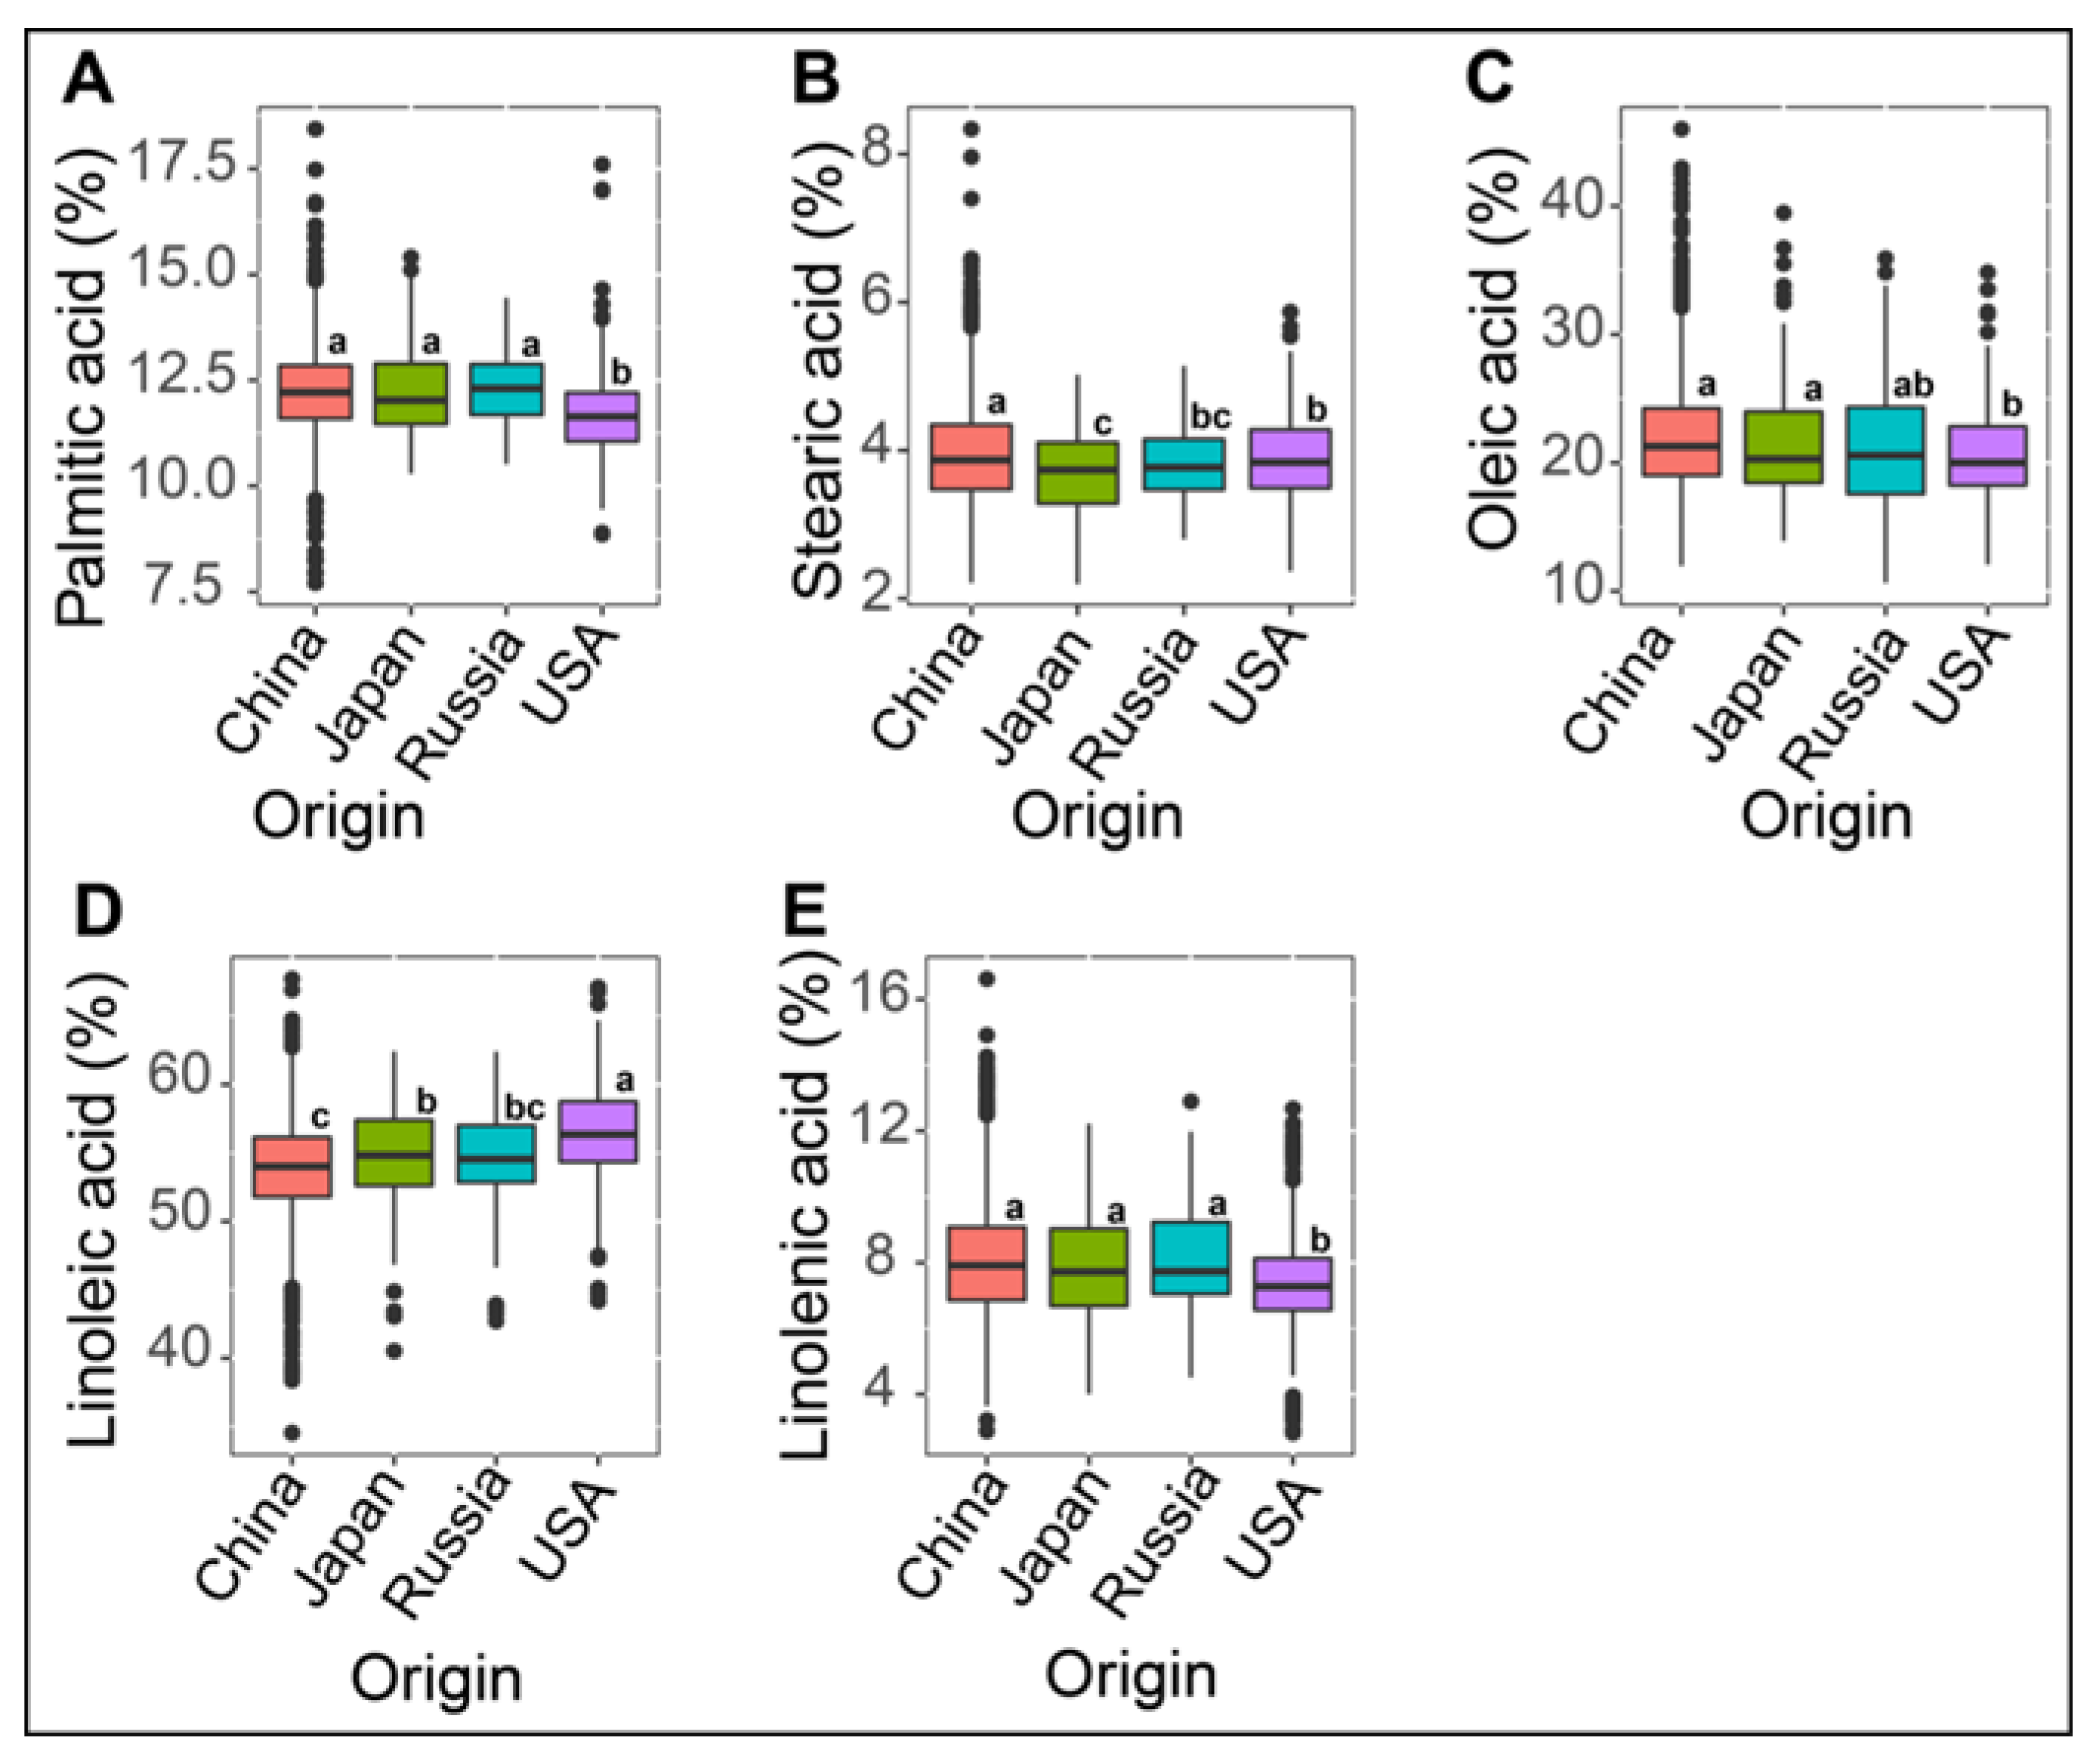
3.2. Effect of Germplasm Origins on Variation in Seed Fatty Acid Composition

We observed highly significant differences (P < 0.001) among the germplasm origins for all fatty acids (Table S3a). The significant variation of fatty acids among different germplasm origins was consistent with previous studies [20,21,28]. Grieshop and Fahey [31] reported that soybeans collected from various sources elucidated major differences in their nutritional composition of fatty acids. The contents of SA, LA, and LNA showed highly significant differences (P < 0.001) between the two years, whereas PA and OA levels showed no significant differences (Table S3a). A previous study revealed that cultivation year had a significant effect on some soybean seed quality traits, while others were not significantly affected [49]. In addition, the interaction of cultivation year × origin had a highly significant effect (P < 0.01) only on LNA content, while no significant effects were observed for the other fatty acid contents (Table S3a). The significant effect of year × origin interaction on LNA, coupled with the highest CV of 15.34% (Table 1), underline the high sensitivity across various environmental conditions. In contrast, the other fatty acids were not affected by such interaction which was in accordance with the study of Graef et al. [50]. The results also showed that there were highly significant differences (P < 0.0001) among accessions for all fatty acids contents (Table S3b). Table S3b further showed that cultivation year × accession interaction did not significantly affect all the fatty acid contents, indicating that genetic factor plays a key role on fatty acid composition between various cultivation years.
The variation in fatty acid composition among the four germplasm origins are shown in Figure 1A–E. Russian accessions had the highest average level of PA (12.31%), followed by Japan (12.26%) and China (12.22%), while USA accessions had the lowest level of PA (11.68%) which significantly differed from the other three germplasms origins (Figure 1A). Chinese accessions had higher content of SA (3.95%), followed by USA (3.89%), then Russian accessions (3.79%), while Japanese germplasm revealed the lowest SA content (3.76%) (Figure 1B). The Chinese germplasm can be used as good parents for the development of soybean varieties with high saturated oils, which could increase the oil shelf life. In respect to unsaturated fatty acids, the Chinese accessions contained the highest OA level (21.95%), followed by Japan (21.54%) and Russian germplasms (21.45 %), while USA germplasm recorded the lowest OA content (20.66%) (Figure 1C). Russian accessions did not differ significantly from USA accessions in OA content, while USA accessions differed significantly from Chinese and Japanese accessions. In contrast with OA content, the USA germplasm had the highest average of LA content (56.34%), while the other germplasms of Japan and Russia recorded 54.55% and 54.30%, respectively (Figure 1D). The Chinese accessions, in contrast with SA level, contained the lowest level of LA (53.81%) (Figure 1D). One important finding in the current study is that the four germplasm sources used varied greatly in LA content, suggesting that LA can be used as a discriminative factor for geographical classification of soybean.
The largest difference in LA was found between Chinese and USA accessions which was in accordance with Song et al. [30], as they reported that USA accessions had higher LA content than Chinese accessions (48.5% and 44.7%, respectively). This result demonstrates that different genetic background between both origins greatly influenced LA content. Russian accessions had the highest LNA content (8.15%), followed by Chinese accessions (8.06%), and Japanese accessions (7.90%), whereas USA accessions had the lowest LNA content and differed significantly from the other origins (7.40%, Figure 1E). The highest LA and lowest LNA levels in observed in USA accessions shows the possibility of decreasing LNA level with an increase in LA level, which suggests that higher content of LA could be acting at the expense of LNA content.
As a result, improving genotypes or/and developing new cultivars with special nutrition pattern largely rely on the noted variations in seed fatty acids. Japanese and Chinese accessions showed no significant differences in PA, OA, and LNA contents, which was also in agreement with Song et al. [29], indicating that the closeness of these two origins may have resulted in the lack of significant effect on the soybean quality components. Generally, the observed variation in saturated and unsaturated fatty acids among different origins could be attributed to environmental and genetic factors, which further confirms the results of Song et al. [29], as the germplasm origins exhibited various oil profiles.

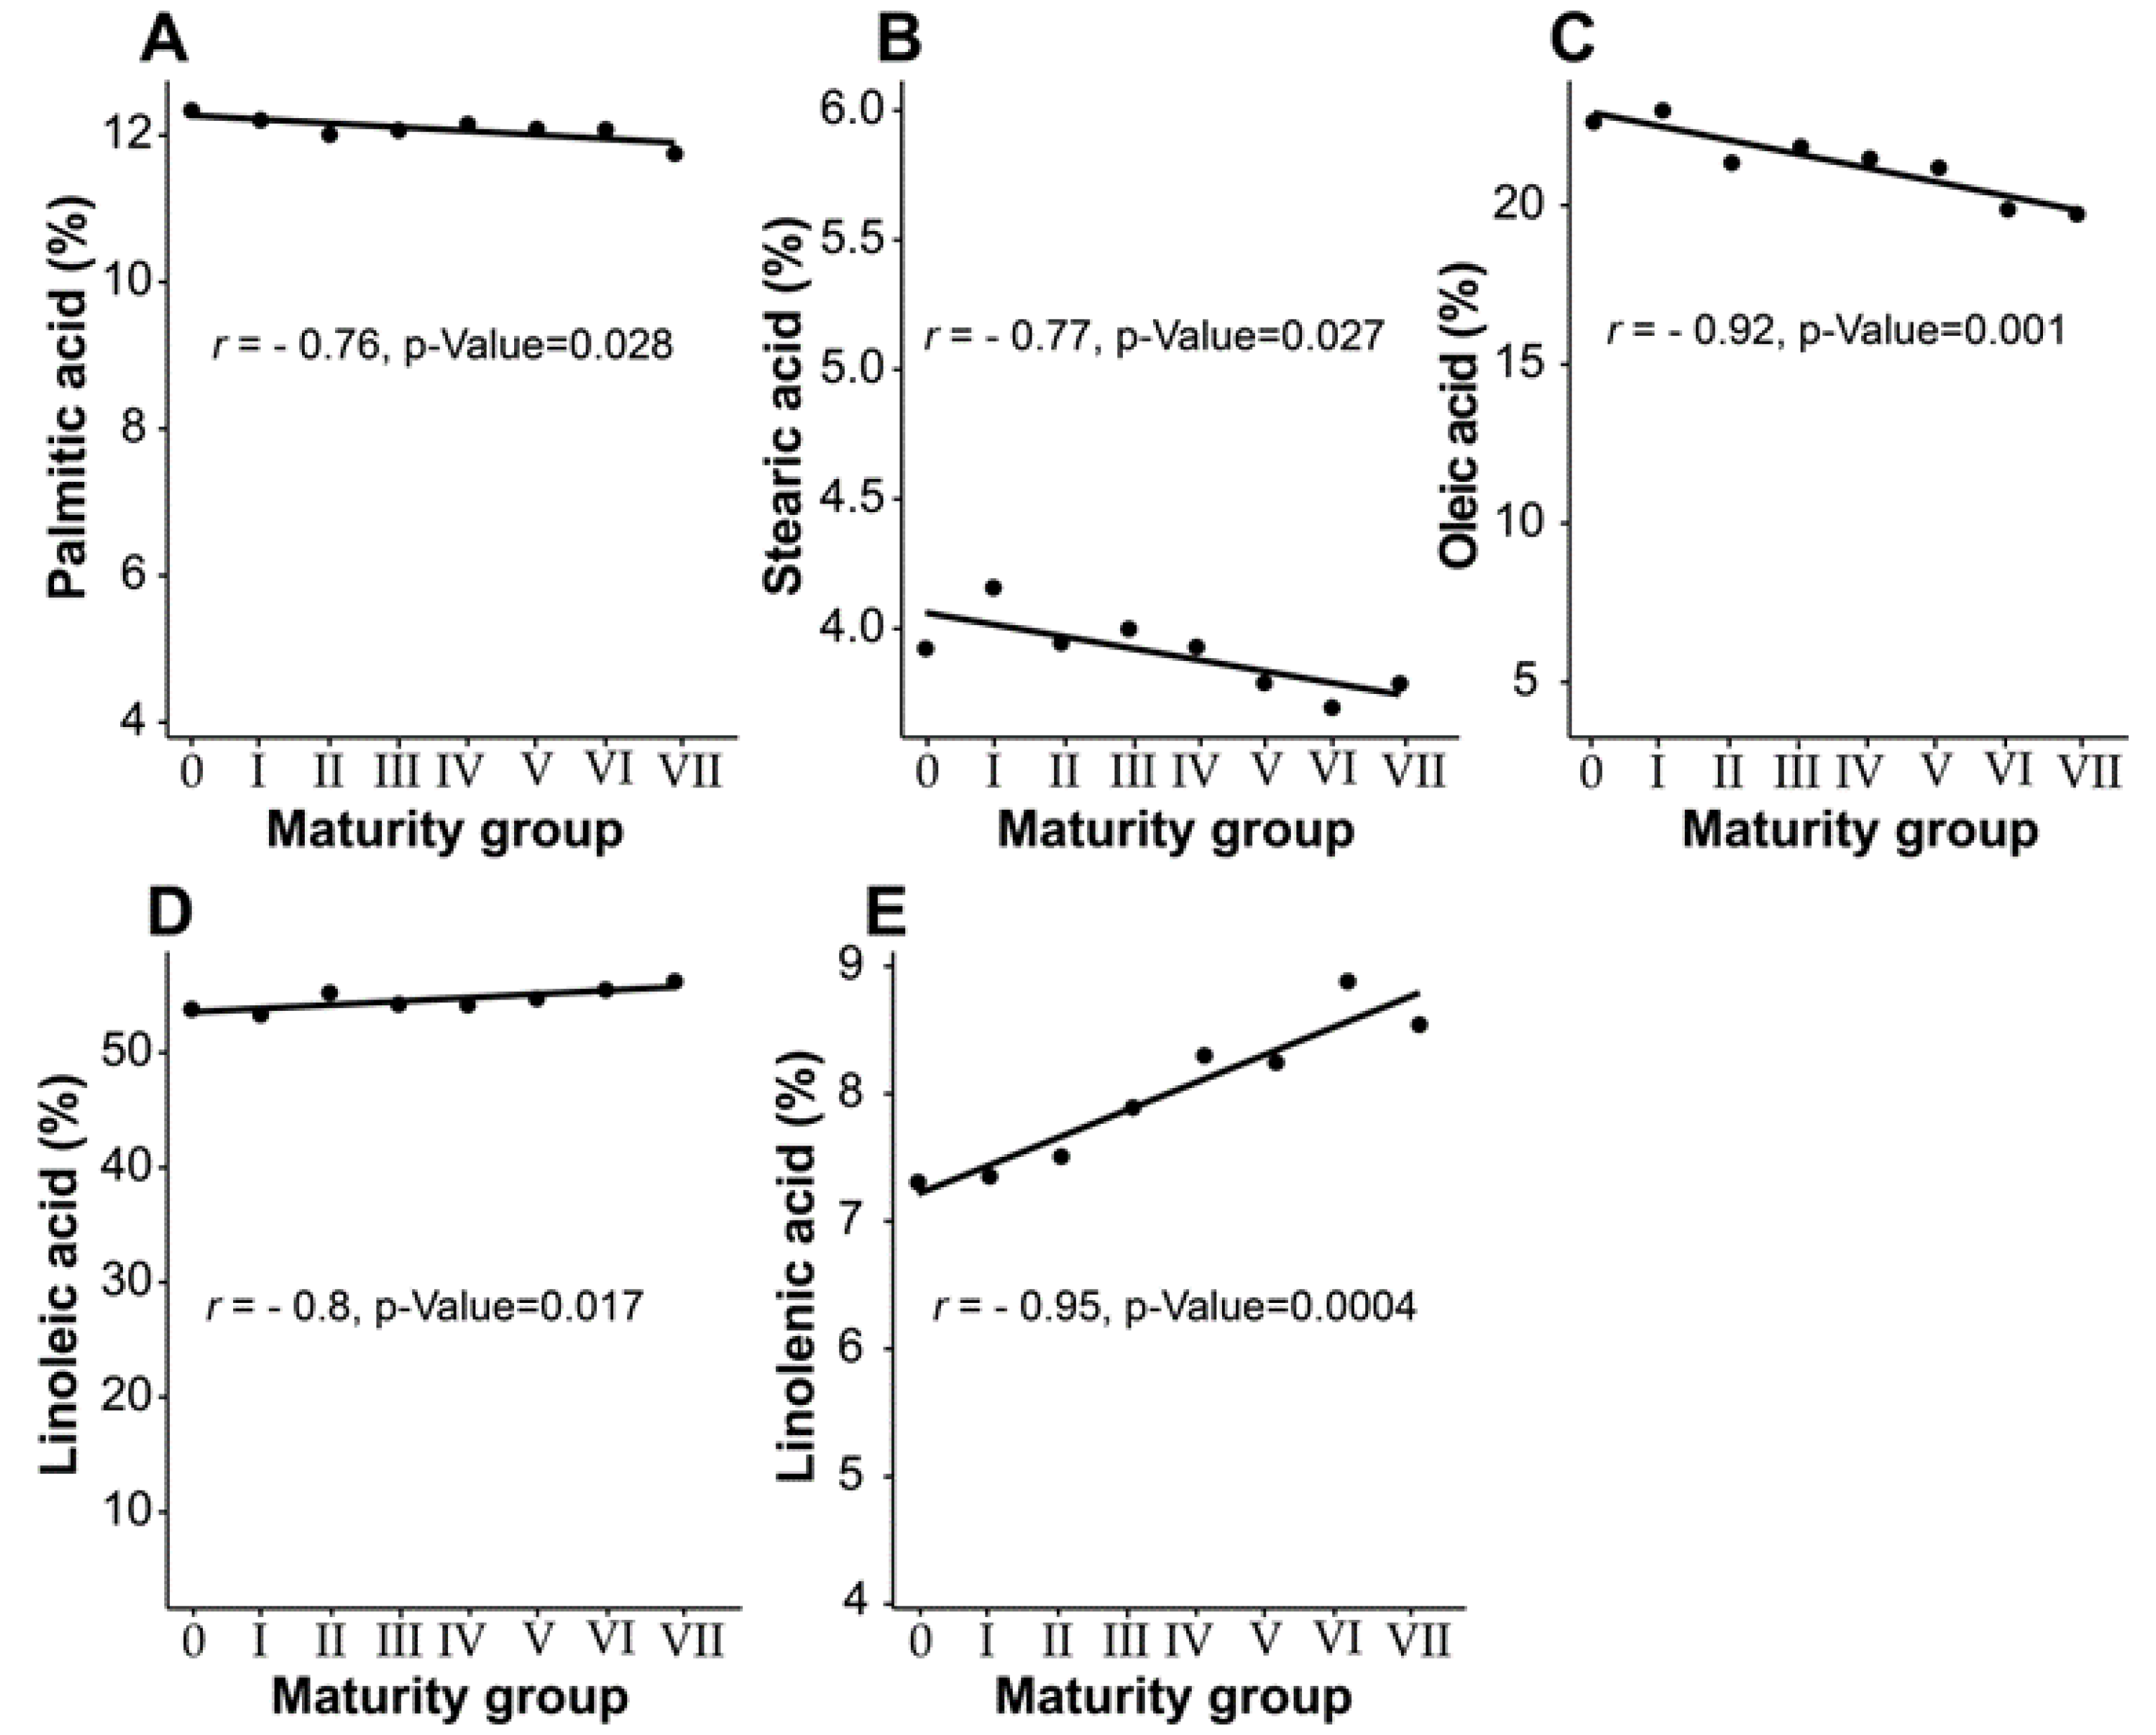
3.3. Effect of Maturity Group on Seed Fatty Acid Composition

Highly significant differences (P < 0.0001) in fatty acid composition were also observed among different maturity groups (MGs) for all fatty acids (Table S3c). Previous studies have reported that MG significantly affects soybean seed quality [39,51,52,53]. These findings document the variation among maturity groups in different fatty acids, confirming the fact that MG should be considered as an important factor [39]. Furthermore, the results demonstrated that in the same planting site or even planting date, early MGs could affect soybean seed fatty acid composition in a way that differs from late MGs, which could be attributed to the difference in growth durations of both early and late maturing cultivars [24]. In other words, effects of MG in this study underline that accessions from some MGs had higher content of specific fatty acid than other accessions belonging to other MGs, regardless of the environments. The MG x year interaction had no significant effect on all fatty acids (Table S3c), which indicates the consistency of the MGs in both years of experimentation.
In this study, PA and SA levels ranged from 11.75% to 12.33% in MG0–VII and from 3.69% to 4.16% in MGI–VI, respectively (Table 3). MG0 had significantly higher PA level (12.33%) when compared to MGI-VII which had a decreasing PA level, with the lowest PA level observed in MGVII (11.75%). For SA, MGI yielded the highest level (4.16%) which was significantly higher than all the other maturity groups. Also, MGII-VII had a decreasing SA level which ranged from 3.94% in MGII to the lowest SA level of 3.69% in MGVI (Table 3). Level of OA ranged from 19.73% in MGVII to 22.99% in MGI (Table 3), showing a similar trend to that observed in PA and SA levels as higher contents of PA, SA and OA were presented in early MGs, while lower contents were yielded in late MGs. Level of LA ranged from 53.30% in MGI to 56.20% in MGVII, while LNA level ranged from 7.31% in MG0 to 8.88% in MGVI (Table 3). These findings reflect contrasting trends of fatty acids with different MGs, where higher PA, SA, and OA levels were observed in early, rather than late, maturing soybean accessions, while the higher levels of LA and LNA were observed in late maturing soybean accessions. The MG can be used as an influential factor on soybean seed fatty acids and early maturing soybean accessions had higher levels of PA, SA, and OA components, while late maturing accessions had higher levels of LA and LNA components. Despite the solid knowledge that environment is a major player influencing soybean seed composition since it drives to an influential change in climatic factors [54], the current study further points out the remarkable effect of MG on seed fatty acid composition. In other words, the trend of fatty acid across different MGs observed in this study further highlights that genetic factors play a key role in variation of seed fatty acid constituents among different accessions corresponding to different backgrounds. This assertion that genetic variability is present in soybean seed composition and yield has also been reported by other studies [51,55,56].
The relationship between fatty acid composition and MG is shown in Figure 2A–E. All the fatty acids showed a significant relationship with maturity groups. Levels of PA, SA and OA showed negative and significant linear relationship with MG (r = −0.76, P < 0.028, r = −0.77, P < 0.027 and r = −0.92, P < 0.001, respectively) (Figure 2A–C). In contrast, levels of both LA and LNA revealed a positive and significant relationship with MG (r = −0.8, P < 0.017 and r = −0.95, P < 0.0004, respectively) (Figure 2D,E). These findings further confirm that there is a decreasing trend in PA, SA, and OA levels from early to late maturity groups, with much stronger relationship in OA level. For LA and LNA levels, there is an increasing trend from early to late maturity groups, with much stronger relationship in LNA level. This relationship pattern was not in agreement with that reported by Bellaloui et al. [57], as they concluded that MG showed no consistent effect on fatty acid composition, except stearic acid which was minimally affected.
Despite this conclusion of Bellaloui et al. [57], their study was conducted based on two sets of near-isogenic soybean lines derived from two cultivars Clark and Harosoy with a common genotypic background, which did not enable them to generalize their conclusions. In contrast, the soybean accessions utilized in the current study included diverse soybean accessions in different genetic background. We believe that this contradictory pattern of relationship between fatty acid and MG could be exploited to adopt best management combinations depending on selection purpose and other practices aiming at maximizing specific end use targets.

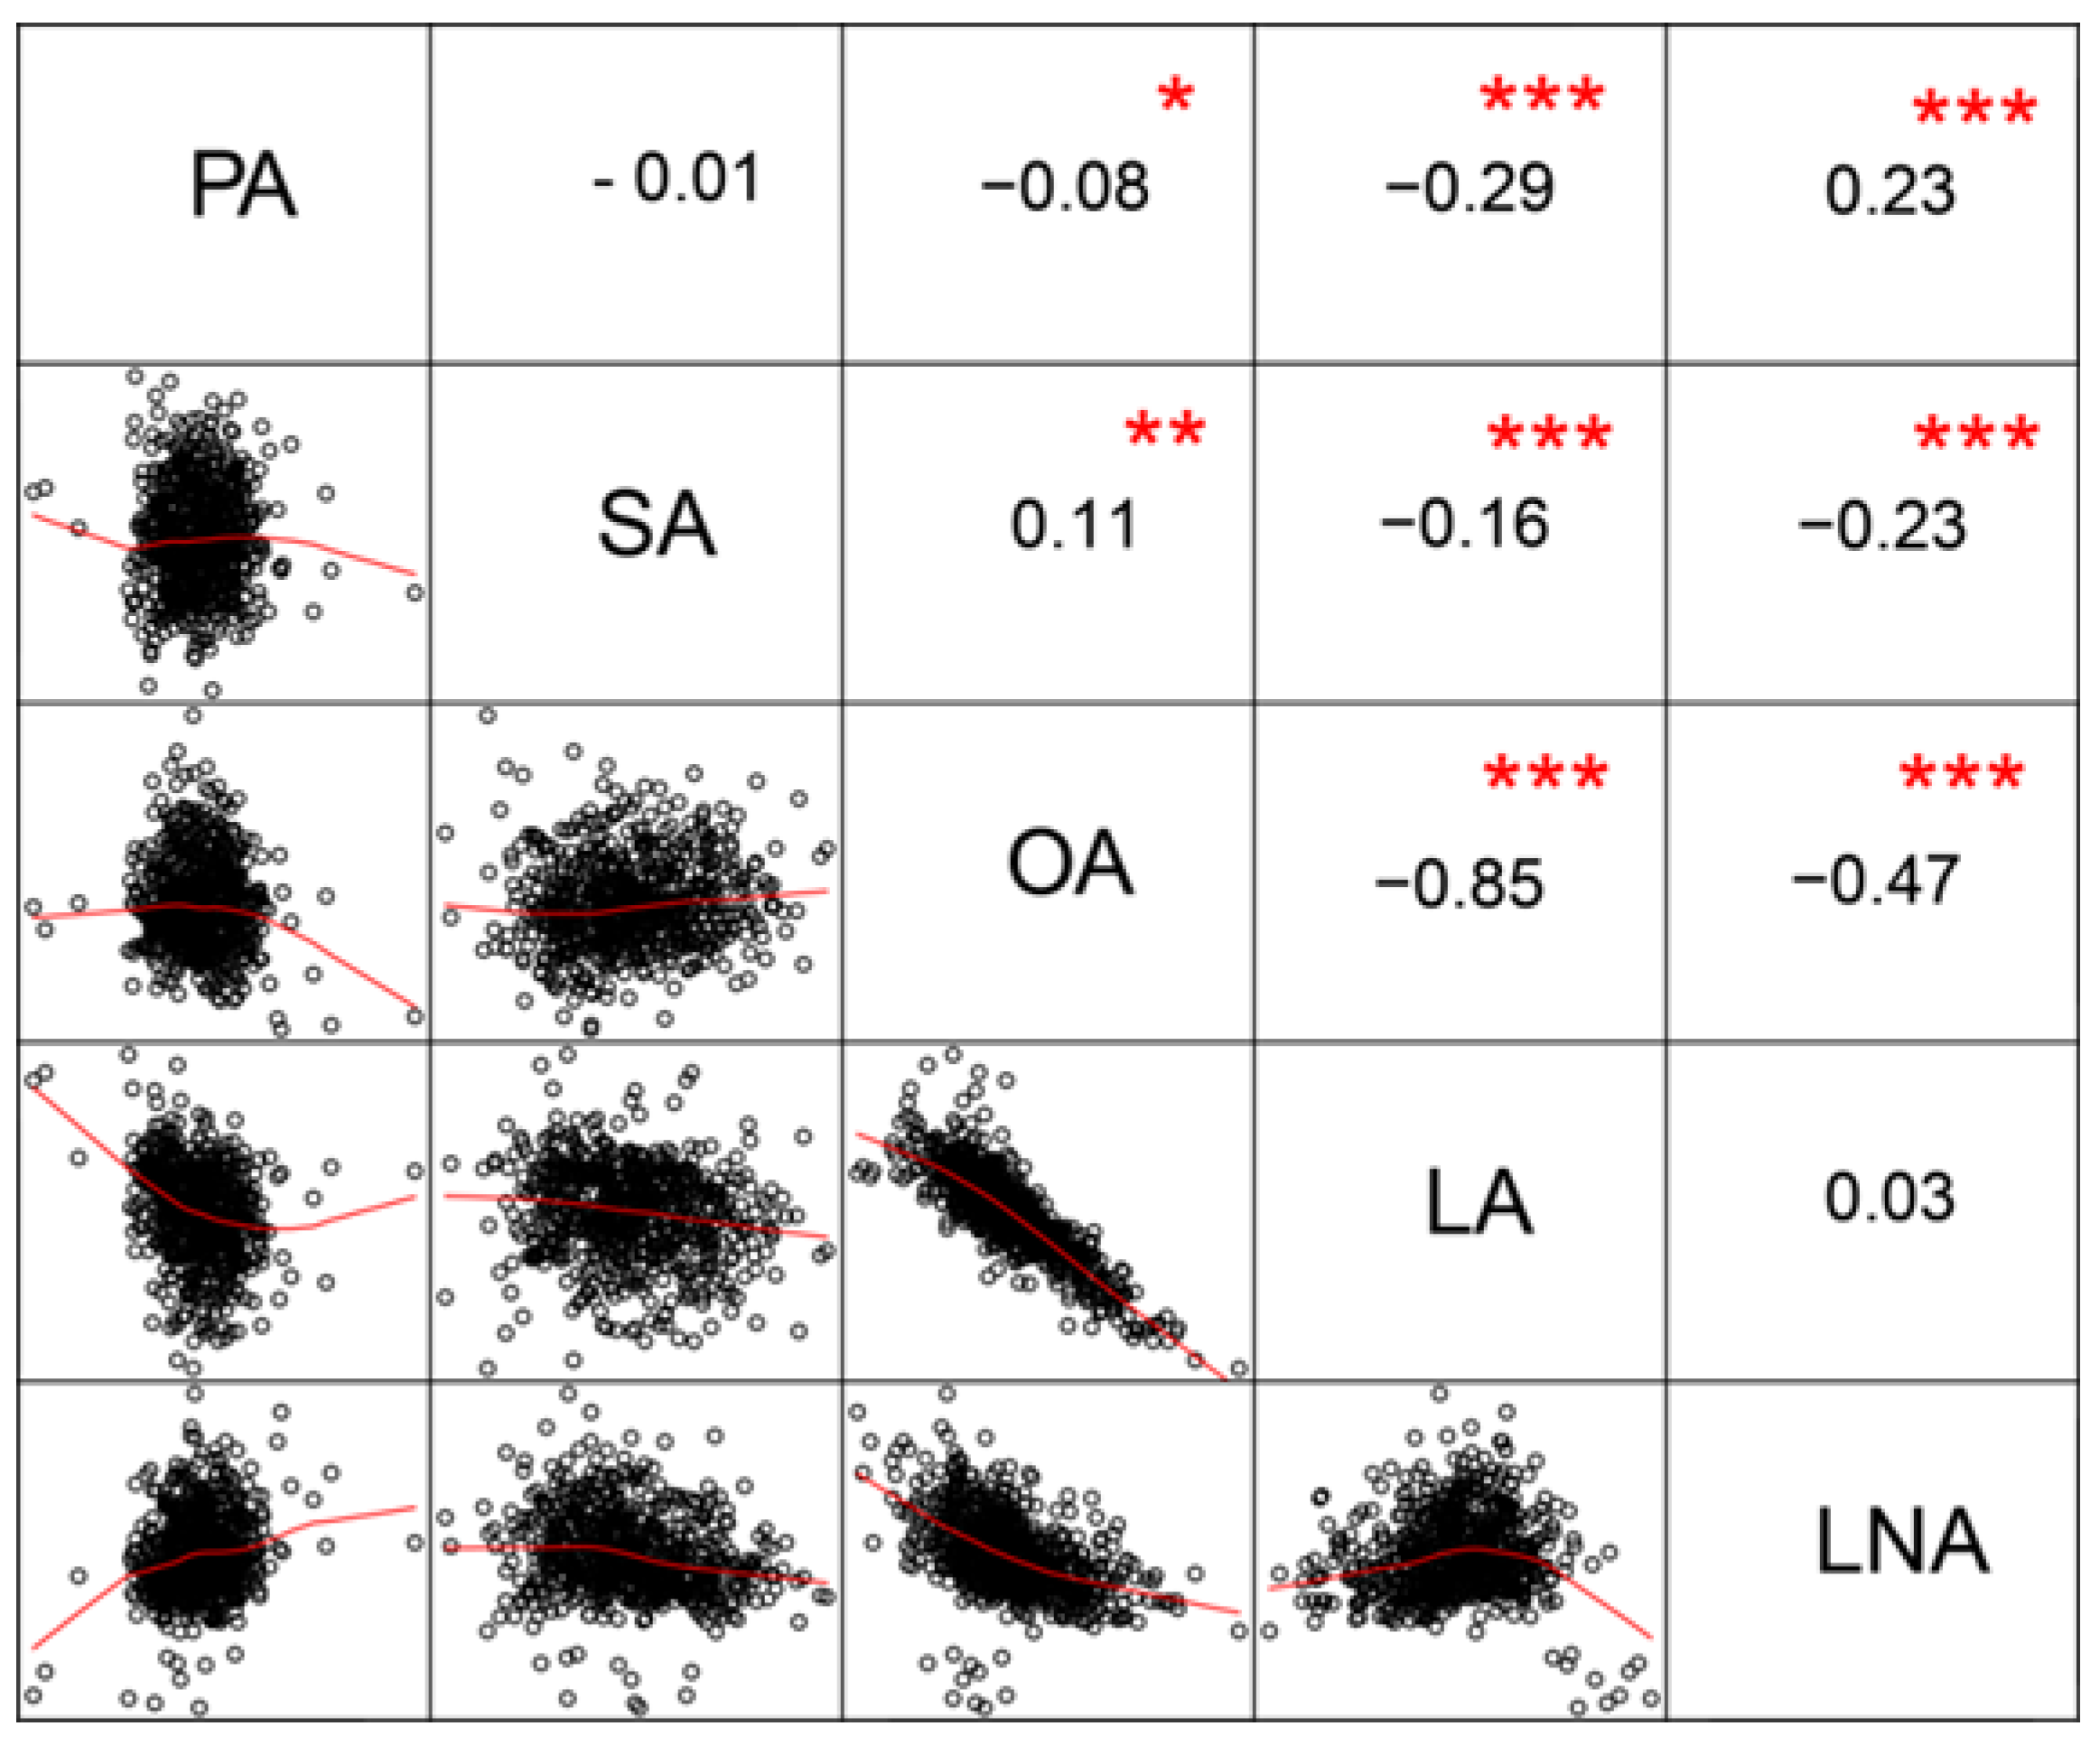
3.4. Correlation Analysis of Seed Fatty Acids

Pearson’s correlation coefficients among the five fatty acids are shown in Figure 3. The highest significant negative correlation was observed between OA and LA contents (r = −0.85***), followed by OA with LNA contents (r = −0.47, P < 0.001, denoted ***). Similar results were previously reported [21,58]. These findings showed that a consistent decrease in LA and LNA contents is linked with a corresponding increase in OA content. This negative correlation may be attributed to the different biochemical pathways of the noted fatty acid biosynthesis [59]. Interestingly, this negative association provides more increasing interest for food industries and consumers to produce oil with high OA and low LA and LNA contents [60]. Non-significant correlation was observed between LA and LNA. The PA content was significantly and negatively correlated with OA and LA (r = −0.08* and −0.29***, respectively), but positively correlated with LNA (r = 0.23***). The SA content had highly significant negative correlations with LA and LNA (r = −0.16*** and −0.23***, respectively), but positive correlation with OA. Previous study of La et al. [21] demonstrated that there is a significant negative association between PA and LA, as well as between SA and LNA. These negative correlations of both PA and SA with unsaturated fatty acid contents could be related to the different pathways in their biosynthesis. Our result is in opposite to other studies [42,61], as they found positive and significant correlations between PA with LA, and SA with both LA and LNA. Such a contradiction between our study with other studies could be due to the difference in materials exploited in both studies.

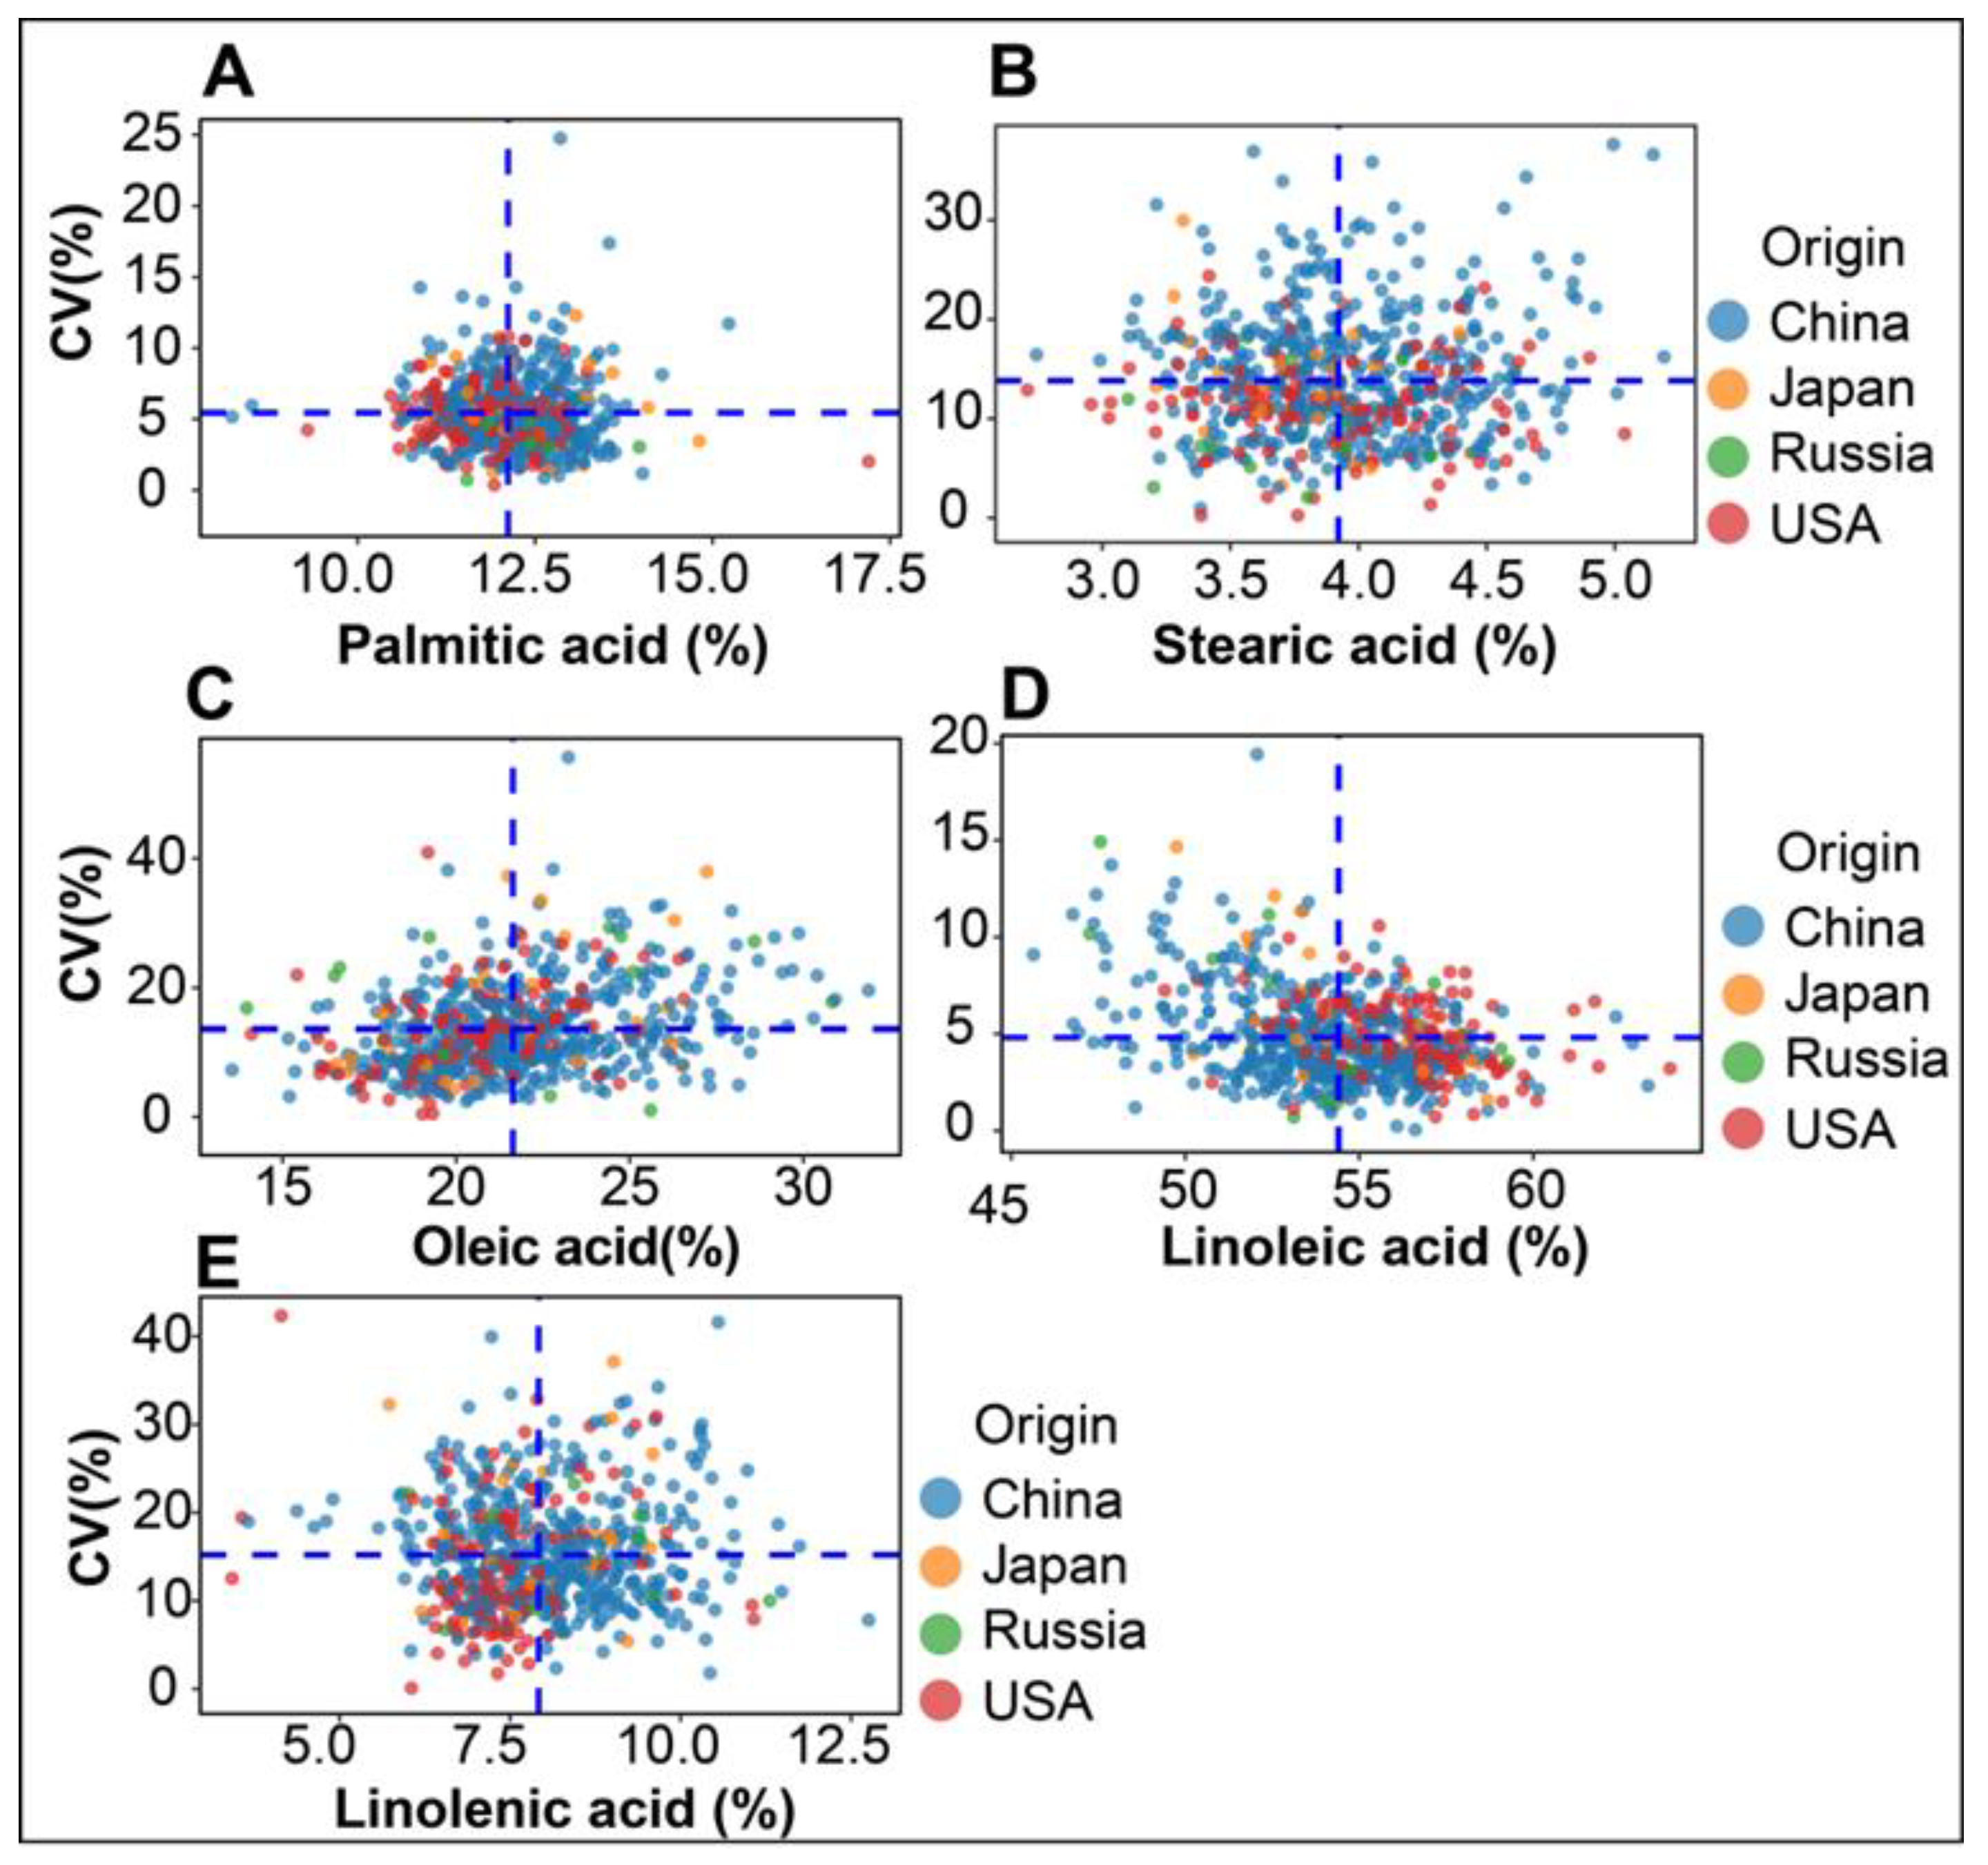
3.5. Stability of Soybean Fatty Acids across Different Environments

The stability of soybean accessions varies greatly under different environmental conditions [62]. The coefficient of variation (CV) of each seed fatty acid was used to reflect the stability of the fatty acid levels, as a lower CV represents higher stability for a cultivar in different environments [63,64,65]. The means of the five seed fatty acids were plotted against their CVs to show how much the desirable level of each fatty acid was stable within each germplasm origin (Figure 4A–E). These results indicated that diverse germplasm accessions showed discrepant performance against different environments. The different CV values of accessions from the four origins elucidated the effect of different genetic background for each collection and their performances under unusual climatic conditions [29]. These findings suggest that introducing new germplasms to China will offer promising germplasm resources with specific oil profile depending on their stability across contrasting environments [66]. Importantly, the germplasm accessions which are adapted to local agro-environmental conditions may have beneficial alleles and could be incorporated in soybean breeding for desired fatty acid profiles.
Accessions with higher level of PA and lower CV values are more preferred form of saturated fatty acids because they showed higher oil stability (Figure 4A). Among these accessions, T309 from USA had higher PA content (17.20%) with lower CV (2.03%), followed by the Japanese accession Saikai 20, as its PA content was 14.81% with lower CV of 3.45%. Other accessions with higher PA showing higher stability are shown in Table 4. A collection of USA and Chinese germplasms with high SA content showed more stability (Figure 4B). The USA accession L72-920 showed higher SA content (5.04%) and lower CV (8.48%), followed by the Chinese accession Laidou24, which had higher SA content of 5.01% and low CV of 12.57% (Table 4). Other stable accessions with higher SA level were shown in Table 4. Figure 4C shows that higher means of OA content were reasonably associated with higher CV values, indicating that majority of the higher OA accessions were not very stable across different environments. Despite that, two Chinese accessions ZDD11235 and ZDD06021 with OA content of 28.47% and 28.14%, respectively, exhibited high stability as their CVs were 9.98 and 4.93%, respectively, in addition to other Chinese accessions with lower CV and higher OA content which are shown in Table 4. In contrast to other fatty acids, higher LA levels showed lower CV values (Figure 4D), revealing that a greater number of accessions with higher LA content were relatively stable across different environments. The current study showed that many stable and favorable LA levels were abundantly found in USA germplasms, whereas few accessions from other origins exhibited such a desired LA scenario (Figure 4D and Table 4). The USA accession S01-9391 had the highest LA content of 63.93% with CV of 3.20%, followed by the Chinese accession ZDD03222 with LA content of 63.30% and CV of 2.32%. Stable accessions with low LA levels were also observed, including ZDD04382 with LA level of 47.36% and CV of 4.55% (Table 4). These results indicate that higher LA levels tend to be less affected by environments compared with other fatty acids. In respect to LNA, the Chinese accession, ZDD03739, had a higher LNA level of 12.76% and maintained relatively higher stability (CV: 7.82%) (Table 4). As Lower LNA levels is required for maintaining higher oil stability, the accession C1640 from USA had a higher stability, CV of 6.8%, in addition to its lowest LNA content (3.43%) (Table 4) which highlights the importance of exploiting some USA soybean accessions for providing oils with higher stability.
Basically, one of the aims of soybean breeding is to improve oil stability through developing genotypes with reduced LNA and elevated OA levels [21,67,68]. Therefore, taking into consideration these germplasms resources and their adaptability as determined in this study, our findings are expected to contribute greatly in selection of accessions with desirable levels of certain fatty acids which are less affected by contrasting environmental conditions. Furthermore, soybean oil content and fatty acid composition significantly affect soybean flavor attributes [69], that is why great efforts were made to select soybean cultivars with a desired oil profile to improve such flavor attributes [70]. In our study, the accessions which revealed higher stability and higher OA and LNA contents are beneficial for producing soymilk with preferable levels of smoothness and sweetness attributes, achieving the most important quality and preferable soymilk parameters for Chinese consumers [71]. In contrast, the accessions with higher PA and LNA contents are mostly preferable for western consumers due to the significant positive correlation of these two fatty acid levels with color and appearance of soymilk [71]. As a result, these unique accessions reported in this study constitute promising endeavors to improve soybean products with higher quality to meet various consumers’ preferences.

4. Conclusions

To conclude, significant variations in seed fatty acid composition were noticed among four diverse soybean collections in this study. Particularly, accessions form USA and China showed significant differences in all the fatty acids and the largest difference between both origins was found in LA. Higher negative correlation observed between OA and LA levels offers a valuable chance for improvement of specific oil patterns with dual purposes. This variability observed in seed fatty acid traits among four worldwide germplasm accessions can provide valuable genetic resources for soybean breeding. In general, contrasting trends of fatty acids with different MGs further emphasized the importance of MG as an influential factor on soybean seed fatty acid composition. Different adaptability patterns of introduced germplasms encourage exploiting diverse genotypic backgrounds in breeding for high quality soybeans. Furthermore, the variation observed in fatty acid composition among different soybean germplasms due to the effect of diverse origins or MGs is of high importance for identification of accessions with desired lower or higher fatty acid contents. These high stable accessions with interested fatty acid profiles identified in this study can be used for enhanced studies and industries, aiming to achieve desired soybean oils to meet various consumption preferences.

Supplementary Materials

The following are available online at https://www.mdpi.com/2073-4395/10/1/24/s1, Table S1: Information of the 633 soybean accessions used in this study, Table S2: The monthly average of temperature (°C) and precipitation (mm) for the experimental sites of Hainan, and Beijing in 2017 and 2018, and Anhui in 2017, Table S3; Table S3a. Analysis of variance for seed fatty acid composition affected by different origins at three locations for two years, Table S3b. Analysis of variance for seed fatty acid composition affected by 633 soybean accessions at three locations for two years, Table S3c. Analysis of variance for seed fatty acid composition affected by different maturity groups (MGs) at three locations for two years.

Author Contributions

Conceptualization, A.M.A. and J.S.; Formal analysis, A.M.A.; Funding acquisition, B.L. and J.S.; Investigation, J.Q.; Methodology, A.M.A., M.A., S.Z., A.S.S., Y.F., Y.L., Y.T., and H.H.; Project administration, B.L., and J.S.; Resources, S.Z., M.A., and A.S.S.; Supervision, J.S.; Visualization, B.L.; Writing—original draft, A.M.A.; Writing—review and editing, A.M.A., B.L., and J.S. All authors have read and agreed to the published version of the manuscript.

Funding

This study was supported by Ministry of Science and Technology (2017YFD0101401, 2016YFD0100201, and 2016YFD0100504), National Major Science and Technology Project (2016ZX08004-003), National Natural Science Foundation of China (31671716), Beijing Science and Technology Project (Z16110000916005), and the Chinese Academy of Agricultural Sciences (CAAS) Agricultural Science and Technology Innovation Project.

Acknowledgments

We would like to thank Lijuan Qiu from Institute of Crop Sciences, CAAS, for providing the soybean accessions utilized in this study and her helpful suggestions regarding the manuscript. We also would like to thank Xiaobo Wang from Anhui Agricultural University for helping in growing soybean accessions in Anhui province of China.

Conflicts of Interest

The authors declare no competing financial interest in regard to this manuscript.

Abbreviations

PApalmitic acid
SAstearic acid
OAoleic acid
LAlinoleic acid
LNAlinolenic acid
CNSGBChinese National Soybean Gene Bank
MGmaturity group
GCgas chromatography

References

  1. SoyStats a Reference Guide to Important Soybean Facts and Figures. American Soybean Association. 2018. Available online: http://soystats.com/ (accessed on 22 August 2019).
  2. Gale, F.; Valdes, C.; Ash, M. Interdependence of China, United States, and Brazil in Soybean Trade. In New York: U.S. Department of Agriculture’s Economic Research Service (ERS) Report; USDA, Southwest: Washington, DC, USA, 2019; pp. 1–48. [Google Scholar]
  3. Mensink, R.P.; Zock, P.L.; Kester, A.D.M.; Katan, M.B. Effects of dietary fatty acids and carbohydrates on the ratio of serum total to HDL cholesterol and on serum lipids and apolipoproteins: A meta-analysis of 60 controlled trials. Am. J. Clin. Nutr. 2003, 77, 1146–1155. [Google Scholar] [CrossRef] [PubMed]
  4. Siri-Tarino, P.W.; Sun, Q.; Hu, F.B.; Krauss, R.M. Saturated fat, carbohydrate, and cardiovascular disease. Am. J. Clin. Nutr. 2010, 91, 502–509. [Google Scholar] [CrossRef] [PubMed] [Green Version]
  5. Neff, W.E.; List, G.R. Oxidative stability of natural and randomized high-palmitic-and high-stearic-acid oils from genetically modified soybean varieties. J. Am. Oil Chem. Soc. 1999, 76, 825–831. [Google Scholar] [CrossRef]
  6. Sacks, F.M.; Lichtenstein, A.H.; Wu, J.H.Y.; Appel, L.J.; Creager, M.A.; Kris-Etherton, P.M.; Miller, M.; Rimm, E.B.; Rudel, L.L.; Robinson, J.G. Dietary fats and cardiovascular disease: A presidential advisory from the American Heart Association. Circulation 2017, 136, e1–e23. [Google Scholar] [CrossRef]
  7. Fehr, W.R. Breeding for modified fatty acid composition in soybean. Crop Sci. 2007, 47, S-72. [Google Scholar] [CrossRef]
  8. Gebauer, S.K.; Psota, T.L.; Harris, W.S.; Kris-Etherton, P.M. n−3 fatty acid dietary recommendations and food sources to achieve essentiality and cardiovascular benefits. Am. J. Clin. Nutr. 2006, 83, 1526S–1535S. [Google Scholar] [CrossRef]
  9. Chalon, S. Omega-3 fatty acids and monoamine neurotransmission. Prostaglandins Leukot. Essent. Fat. Acids 2006, 75, 259–269. [Google Scholar] [CrossRef]
  10. Clemente, T.E.; Cahoon, E.B. Soybean oil: Genetic approaches for modification of functionality and total content. Plant Physiol. 2009, 151, 1030–1040. [Google Scholar] [CrossRef] [Green Version]
  11. Shi, Z.; Bachleda, N.; Pham, A.T.; Bilyeu, K.; Shannon, G.; Nguyen, H.; Li, Z. High-throughput and functional SNP detection assays for oleic and linolenic acids in soybean. Mol. Breed. 2015, 35, 176. [Google Scholar] [CrossRef]
  12. Pham, A.-T.; Shannon, J.G.; Bilyeu, K.D. Combinations of mutant FAD2 and FAD3 genes to produce high oleic acid and low linolenic acid soybean oil. Theor. Appl. Genet. 2012, 125, 503–515. [Google Scholar] [CrossRef]
  13. Bachleda, N.; Grey, T.; Li, Z. Effects of high oleic acid soybean on seed yield, protein and oil contents, and seed germination revealed by near-isogeneic lines. Plant Breed. 2017, 136, 539–547. [Google Scholar] [CrossRef]
  14. Rebetzke, G.J.; Burton, J.W.; Carter, T.E.; Wilson, R.F. Changes in agronomic and seed characteristics with selection for reduced palmitic acid content in soybean. Crop Sci. 1998, 38, 297–302. [Google Scholar] [CrossRef]
  15. Johnson, R.C.; Bergman, J.W.; Flynn, C.R. Oil and meal characteristics of core and non-core safflower accessions from the USDA collection. Genet. Resour. Crop Evol. 1999, 46, 611–618. [Google Scholar] [CrossRef]
  16. Fernandez-Martinez, J.; Del Rio, M.; De Haro, A. Survey of safflower (Carthamus tinctorius L.) germplasm for variants in fatty acid composition and other seed characters. Euphytica 1993, 69, 115–122. [Google Scholar] [CrossRef]
  17. Goffman, F.D.; Pinson, S.; Bergman, C. Genetic diversity for lipid content and fatty acid profile in rice bran. J. Am. Oil Chem. Soc. 2003, 80, 485–490. [Google Scholar] [CrossRef]
  18. Mourtzinis, S.; Marburger, D.; Gaska, J.; Diallo, T.; Lauer, J.; Conley, S. Corn and soybean yield response to tillage, rotation, and nematicide seed treatment. Crop Sci. 2017, 57, 1704–1712. [Google Scholar] [CrossRef]
  19. Carter, T.E.; Nelson, R.L.; Sneller, C.H.; Cui, Z.; Boerma, H.R.; Specht, J.E.; Carter, T.; Nelson, R.; Sneller, C.; Cui, Z. Genetic Diversity in Soybean. In Soybeans: Improvement, Production and Use, 3rd ed.; Boerma, H., Specht, J., Eds.; American Society of Agronomy: Madison, WI, USA, 2004; pp. 303–450. [Google Scholar]
  20. Wee, C.D.; Hashiguchi, M.; Anai, T.; Suzuki, A.; Akashi, R. Fatty acid composition and distribution in wild soybean (Glycine soja) seeds collected in Japan. Asian J. Plant Sci. 2017, 16, 52–64. [Google Scholar]
  21. La, T.; Large, E.; Taliercio, E.; Song, Q.; Gillman, J.D.; Xu, D.; Nguyen, H.T.; Shannon, G.; Scaboo, A. Characterization of select wild soybean accessions in the USDA germplasm collection for seed composition and agronomic traits. Crop Sci. 2019, 59, 233–251. [Google Scholar] [CrossRef] [Green Version]
  22. Zhao, X.; Jiang, H.; Feng, L.; Qu, Y.; Teng, W.; Qiu, L.; Zheng, H.; Han, Y.; Li, W. Genome-wide association and transcriptional studies reveal novel genes for unsaturated fatty acid synthesis in a panel of soybean accessions. BMC Genom. 2019, 20, 68. [Google Scholar] [CrossRef] [Green Version]
  23. Uzun, B.; Arslan, Ç.; Furat, Ş. Variation in fatty acid compositions, oil content and oil yield in a germplasm collection of sesame (Sesamum indicum L.). J. Am. Oil Chem. Soc. 2008, 85, 1135–1142. [Google Scholar] [CrossRef]
  24. Sharafi, Y.; Majidi, M.M.; Goli, S.A.H.; Rashidi, F. Oil content and fatty acids composition in Brassica species. Int. J. Food Prop. 2015, 18, 2145–2154. [Google Scholar] [CrossRef] [Green Version]
  25. Kurasiak-Popowska, D.; Ryńska, B.; Stuper-Szablewska, K. Analysis of distribution of selected bioactive compounds in Camelina sativa from seeds to pomace and oil. Agronomy 2019, 9, 168. [Google Scholar] [CrossRef] [Green Version]
  26. La Bella, S.; Tuttolomondo, T.; Lazzeri, L.; Matteo, R.; Leto, C.; Licata, M. An agronomic evaluation of new safflower (Carthamus tinctorius L.) germplasm for seed and oil yields under Mediterranean climate conditions. Agronomy 2019, 9, 468. [Google Scholar] [CrossRef] [Green Version]
  27. Medic, J.; Atkinson, C.; Hurburgh, C.R., Jr. Current knowledge in soybean composition. J. Am. Oil Chem. Soc. 2014, 91, 363–384. [Google Scholar] [CrossRef]
  28. Park, M.R.; Seo, M.J.; Lee, Y.Y.; Park, C.H. Selection of useful germplasm based on the variation analysis of growth and seed quality of soybean germplasms grown at two different latitudes. Plant Breed. Biotechnol. 2016, 4, 462–474. [Google Scholar] [CrossRef] [Green Version]
  29. Song, J.Y.; Piao, X.M.; Choi, Y.M.; Lee, G.A.; Chung, J.W.; Lee, J.R.; Jung, Y.; Park, H.J.; Lee, M.C. Evaluation of genetic diversity and comparison of biochemical traits of soybean (Glycine max L.) Germplasm collections. Plant Breed. Biotechnol. 2014, 1, 374–384. [Google Scholar] [CrossRef] [Green Version]
  30. Lee, J.D.; Bilyeu, K.D.; Shannon, J.G. Genetics and breeding for modified fatty acid profile in soybean seed oil. J. Crop Sci. Biotech. 2007, 10, 201–210. [Google Scholar]
  31. Grieshop, C.M.; Fahey, G.C. Comparison of quality characteristics of soybeans from Brazil, China, and the United States. J. Agric. Food Chem. 2001, 49, 2669–2673. [Google Scholar] [CrossRef] [PubMed]
  32. Liu, X.; Wu, J.; Ren, H.; Qi, Y.; Li, C.; Cao, J.; Zhang, X.; Zhang, Z.; Cai, Z.; Gai, J. Genetic variation of world soybean maturity date and geographic distribution of maturity groups. Breed. Sci. 2017, 67, 221–232. [Google Scholar] [CrossRef] [Green Version]
  33. Qiu, L.; Xing, L.; Guo, Y.; Wang, J.; Jackson, S.A. A platform for soybean molecular breeding: The utilization of core collections for food security. Plant Mol. Biol. 2013, 83, 41–50. [Google Scholar] [CrossRef] [PubMed] [Green Version]
  34. Qiu, L.; Li, Y.; Guan, R.; Liu, Z.; Wang, L.; Chang, R. Establishment, representative testing and research progress of soybean core collection and mini core collection. Acta Agron. Sin. 2009, 35, 571–579. [Google Scholar] [CrossRef]
  35. Li, Y.; Reif, J.C.; Ma, Y.; Hong, H.; Liu, Z.; Chang, R.; Qiu, L. Targeted association mapping demonstrating the complex molecular genetics of fatty acid formation in soybean. BMC Genom. 2015, 16, 841. [Google Scholar] [CrossRef] [PubMed] [Green Version]
  36. Yang, R.P.; Song, W.W.; Sun, S.; Wu, C.X.; Wang, H.J.; Han, T.F. Comparison of soybean yield and yield-related traits of agri-technology demonstration counties in different regions of China. Soybean Sci. 2012, 31, 557–567. [Google Scholar]
  37. Song, W.; Sun, S.; Ibrahim, S.E.; Xu, Z.; Wu, H.; Hu, X.; Jia, H.; Cheng, Y.; Yang, Z.; Jiang, S.; et al. Standard Cultivar Selection and Digital Quantification for Precise Classification of Maturity Groups in Soybean. Crop Sci. 2019, 59, 1997–2006. [Google Scholar] [CrossRef] [Green Version]
  38. Nelson, R.L.; Amdor, P.J.; Orf, J.H.; Lambert, J.W.; Cavins, J.F.; Kleiman, R.; Laviolette, F.A.; Athow, K.L. Evaluation of the USDA Soybean Germplasm Collection: Maturity Groups 000 to IV; Technical Bulletins 157020; United States Department of Agriculture, Economic Research Service: Washington, DC, USA, 1987; 267p.
  39. Zhang, J.; Ge, Y.; Han, F.; Li, B.; Yan, S.; Sun, J.; Wang, L. Isoflavone content of soybean cultivars from maturity group 0 to VI grown in northern and southern China. J. Am. Oil Chem. Soc. 2014, 91, 1019–1028. [Google Scholar] [CrossRef] [Green Version]
  40. Fan, S.; Li, B.; Yu, F.; Han, F.; Yan, S.; Wang, L.; Sun, J. Analysis of additive and epistatic quantitative trait loci underlying fatty acid concentrations in soybean seeds across multiple environments. Euphytica 2015, 206, 689–700. [Google Scholar] [CrossRef] [Green Version]
  41. SAS Institute. The SAS system for Windows, Release 9.2; SAS Inst. Inc.: Cary, NC, USA, 2009. [Google Scholar]
  42. Qin, P.; Song, W.; Yang, X.; Sun, S.; Zhou, X.; Yang, R.; Li, N.; Hou, W.; Wu, C.; Han, T. Regional distribution of protein and oil compositions of soybean cultivars in China. Crop Sci. 2014, 54, 1139–1146. [Google Scholar] [CrossRef]
  43. Song, W.; Yang, R.; Wu, T.; Wu, C.; Sun, S.; Zhang, S.; Jiang, B.; Tian, S.; Liu, X.; Han, T. Analyzing the effects of climate factors on soybean protein, oil contents, and composition by extensive and high-density sampling in China. J. Agric. Food Chem. 2016, 64, 4121–4130. [Google Scholar] [CrossRef]
  44. Simopoulos, A.P. The importance of the omega-6/omega-3 fatty acid ratio in cardiovascular disease and other chronic diseases. Exp. Biol. Med. 2008, 233, 674–688. [Google Scholar] [CrossRef]
  45. Wang, Q.; Liang, X.; Wang, L.; Lu, X.; Huang, J.; Cao, J.; Li, H.; Gu, D. Effect of omega-3 fatty acids supplementation on endothelial function: A meta-analysis of randomized controlled trials. Atherosclerosis 2012, 221, 536–543. [Google Scholar] [CrossRef]
  46. Santos, E.M.; Piovesan, N.D.; de Barros, E.G.; Moreira, M.A. Low linolenic soybeans for biodiesel: Characteristics, performance and advantages. Fuel 2013, 104, 861–864. [Google Scholar] [CrossRef] [Green Version]
  47. Zhang, J.; Wang, X.; Lu, Y.; Bhusal, S.J.; Song, Q.; Cregan, P.B.; Yen, Y.; Brown, M.; Jiang, G. Genome-wide scan for seed composition provides insights into soybean quality improvement and the impacts of domestication and breeding. Mol. Plant 2018, 11, 460–472. [Google Scholar] [CrossRef] [PubMed] [Green Version]
  48. Fehr, W.R.; Welke, G.A.; Hammond, E.G.; Duvick, D.N.; Cianzio, S.R. Inheritance of reduced linolenic acid content in soybean genotypes A16 and A17. Crop Sci. 1992, 32, 903–906. [Google Scholar] [CrossRef]
  49. Jiang, G.L.; Chen, P.; Zhang, J.; Florez-Palacios, L.; Zeng, A.; Wang, X.; Bowen, R.A.; Miller, A.; Berry, H. Genetic analysis of sugar composition and its relationship with protein, oil, and fiber in soybean. Crop Sci. 2018, 58, 2413–2421. [Google Scholar] [CrossRef]
  50. Graef, G.; LaVallee, B.J.; Tenopir, P.; Tat, M.; Schweiger, B.; Kinney, A.J.; Van Gerpen, J.H.; Clemente, T.E. A high-oleic-acid and low-palmitic-acid soybean: Agronomic performance and evaluation as a feedstock for biodiesel. Plant Biotechnol. J. 2009, 7, 411–421. [Google Scholar] [CrossRef]
  51. Mourtzinis, S.; Gaspar, A.P.; Naeve, S.L.; Conley, S.P. Planting date, maturity, and temperature effects on soybean seed yield and composition. Agron. J. 2017, 109, 2040–2049. [Google Scholar] [CrossRef] [Green Version]
  52. Dardanelli, J.L.; Balzarini, M.; Martínez, M.J.; Cuniberti, M.; Resnik, S.; Ramunda, S.F.; Herrero, R.; Baigorri, H. Soybean maturity groups, environments, and their interaction define mega-environments for seed composition in Argentina. Crop Sci. 2006, 46, 1939–1947. [Google Scholar] [CrossRef]
  53. Assefa, Y.; Bajjalieh, N.; Archontoulis, S.; Casteel, S.; Davidson, D.; Kovács, P.; Naeve, S.; Ciampitti, I.A. Spatial characterization of soybean yield and quality (amino acids, oil, and protein) for United States. Sci. Rep. 2018, 8, 14653. [Google Scholar] [CrossRef] [Green Version]
  54. Goldflus, F.; Ceccantini, M.; Santos, W. Amino acid content of soybean samples collected in different Brazilian states: Harvest 2003/2004. Braz. J. Poult. Sci. 2006, 8, 105–111. [Google Scholar] [CrossRef] [Green Version]
  55. Bajaj, S.; Chen, P.; Longer, D.E.; Hou, A.; Shi, A.; Ishibashi, T.; Zhang, B.; Brye, K.R. Planting date and irrigation effects on seed quality of early-maturing soybean in the Mid-South USA. J. New Seeds 2008, 9, 212–233. [Google Scholar] [CrossRef]
  56. Assefa, Y.; Purcell, L.C.; Salmeron, M.; Naeve, S.; Casteel, S.N.; Kovács, P.; Archontoulis, S.; Licht, M.; Below, F.; Kandel, H.; et al. Assessing variation in us soybean seed composition (protein and oil). Front. Plant Sci. 2019, 10, 1–13. [Google Scholar] [CrossRef] [PubMed]
  57. Bellaloui, N.; Smith, J.R.; Ray, J.D.; Gillen, A.M. Effect of maturity on seed composition in the early soybean production system as measured on near-isogenic soybean lines. Crop Sci. 2009, 49, 608–620. [Google Scholar] [CrossRef] [Green Version]
  58. Rahman, S.M.; Kinoshita, T.; Anai, T.; Takagi, Y. Combining ability in loci for high oleic and low linolenic acids in soybean. Crop Sci. 2001, 41, 26–29. [Google Scholar] [CrossRef]
  59. Patel, M.; Jung, S.; Moore, K.; Powell, G.; Ainsworth, C.; Abbott, A. High-oleate peanut mutants result from a MITE insertion into the FAD2 gene. Theor. Appl. Genet. 2004, 108, 1492–1502. [Google Scholar] [CrossRef] [PubMed]
  60. Patil, A.; Taware, S.P.; Oak, M.D.; Tamhankar, S.A.; Rao, V.S. Improvement of oil quality in soybean [Glycine max (L.) Merrill] by mutation breeding. J. Am. Oil Chem. Soc. 2007, 84, 1117–1124. [Google Scholar] [CrossRef]
  61. Wu, T.; Yang, X.; Sun, S.; Wang, C.; Wang, Y.; Jia, H.; Man, W.; Fu, L.; Song, W.; Wu, C. Temporal–spatial characterization of seed proteins and oil in widely grown soybean cultivars across a century of breeding in China. Crop Sci. 2017, 57, 748–759. [Google Scholar] [CrossRef]
  62. Wang, X.; Liu, Z.; Yang, C.; Xu, R.; Lu, W.; Zhang, L.; Wang, Q.; Wei, S.; Yang, C.; Wang, H. Stability of growth periods traits for soybean cultivars across multiple locations. J. Integr. Agric. 2016, 15, 963–972. [Google Scholar] [CrossRef]
  63. Abdulai, M.S.; Sallah, P.Y.K.; Safo-Kantanka, O. Maize grain yield stability analysis in full season lowland maize in Ghana. Int. J. Agric. Biol 2007, 9, 41–45. [Google Scholar]
  64. Temesgen, T.; Keneni, G.; Sefera, T.; Jarso, M. Yield stability and relationships among stability parameters in faba bean (Vicia faba L.) genotypes. Crop J. 2015, 3, 258–268. [Google Scholar] [CrossRef] [Green Version]
  65. Hemingway, J.; Eskandari, M.; Rajcan, I. Genetic and environmental effects on fatty acid composition in soybeans with potential use in the automotive industry. Crop Sci. 2015, 55, 658–668. [Google Scholar] [CrossRef]
  66. You, F.M.; Jia, G.; Xiao, J.; Duguid, S.D.; Rashid, K.Y.; Booker, H.M.; Cloutier, S. Genetic variability of 27 traits in a core collection of flax (Linum usitatissimum L.). Front. Plant Sci. 2017, 8, 1636. [Google Scholar] [CrossRef] [PubMed] [Green Version]
  67. Lee, J.; Hwang, Y.S.; Kim, S.T.; Yoon, W.B.; Han, W.Y.; Kang, I.K.; Choung, M.G. Seed coat color and seed weight contribute differential responses of targeted metabolites in soybean seeds. Food Chem. 2017, 214, 248–258. [Google Scholar] [CrossRef] [PubMed]
  68. Yoon, M.S.; Lee, J.; Kim, C.Y.; Kang, J.H.; Cho, E.G.; Baek, H.J. DNA profiling and genetic diversity of Korean soybean (Glycine max (L.) Merrill) landraces by SSR markers. Euphytica 2009, 165, 69–77. [Google Scholar] [CrossRef]
  69. Terhaag, M.M.; Almeida, M.B.; de Benassi, M.T. Soymilk plain beverages: Correlation between acceptability and physical and chemical characteristics. Food Sci. Technol. 2013, 33, 387–394. [Google Scholar] [CrossRef] [Green Version]
  70. Suppavorasatit, I.; Lee, S.; Cadwallader, K.R. Effect of enzymatic protein deamidation on protein solubility and flavor binding properties of soymilk. J. Food Sci. 2013, 78, C1–C7. [Google Scholar] [CrossRef]
  71. Ma, L.; Li, B.; Han, F.; Yan, S.; Wang, L.; Sun, J. Evaluation of the chemical quality traits of soybean seeds, as related to sensory attributes of soymilk. Food Chem. 2015, 173, 694–701. [Google Scholar] [CrossRef] [Green Version]
Figure 1. Boxplots of five fatty acid composition of 633 soybean accessions collected from four different germplasm origins (averaged across three locations and two years). (A) palmitic acid (PA), (B) stearic acid (SA), (C) oleic acid (OA), (D) linoleic acid (LA), and (E) linolenic acid (LNA). Different lowercase letters (a, b, and c) at the top of each boxplot indicate statistically significant differences at P < 0.05 level among the four germplasm origins.
Agronomy 10 00024 g001
Figure 2. Relationship between means of soybean seed five fatty acid composition (%) with maturity groups (MG0–VII). (A) palmitic acid, (B) stearic acid, (C) oleic acid, (D) linoleic acid, and (E) linolenic acid.
Agronomy 10 00024 g002
Figure 3. Pearson’s correlation coefficients between soybean seed fatty acid composition. * Significant at the P < 0.05 probability level, ** significant at the P < 0.01 probability level, *** significant at the P < 0.001 probability level. Values without asterisks are not significant at P < 0.05. PA, palmitic acid; SA, stearic acid; OA, oleic acid; LA, linoleic acid; LNA, linolenic acid.
Agronomy 10 00024 g003
Figure 4. Scatter plots showing the relationship between means of five fatty acids and coefficients of variation (CVs) for 633 soybean accessions grown in five different locations. (A) palmitic acid, (B) stearic acid, (C) oleic acid, (D) linoleic acid, (E) linolenic acid. Horizontal and vertical dashed lines, in blue, represent average CV and mean of the five fatty acids, respectively.
Agronomy 10 00024 g004
Table 1. Statistical summary of soybean seed fatty acid composition.
ComponentMean aSDCV (%)Min (%)Max (%)SkewKur
Palmitic acid12.120.786.448.2317.200.244.09
Stearic acid3.920.4110.362.715.190.23−0.11
Oleic acid21.632.9413.6013.5531.880.480.36
Linoleic acid54.412.765.0745.6463.93−0.210.51
Linolenic acid7.931.2215.343.4312.760.280.94
a The content of each fatty acid is expressed as a percentage of total fatty acid content.SD, standard deviation; CV, coefficient of variation; Min, minimum; Max, maximum; Skew, skewness; Kur, kurtosis.
Table 2. Accessions with highest and lowest contents of five fatty acids.
Fatty AcidID NumberNameMean aOrigin
Palmitic acid-YZY2004-15-W908.23China
WDD01709T30917.20USA
Stearic acidWDD00405Yellow marvel2.71USA
ZDD00294Qingdou5.19China
Oleic acidZDD09581DLHD13.55China
ZDD02925DLFB31.88China
Linoleic acidZDD02925DLFB45.64China
WDD03084S01-939163.93USA
Linolenic acidWDD01482C16403.43USA
ZDD03739PXDZHC12.76China
a The content of each fatty acid is expressed as a percentage of total fatty acid content.
Table 3. Fatty acid composition (%) in soybean seeds from different maturity groups (MGs) across two years.
MG Palmitic AcidStearic AcidOleic AcidLinoleic AcidLinolenic Acid
0Mean a12.33 a3.92 b22.63 a53.77 ef7.31 d
Range10.27–15.332.24–5.513.3–4634.55–63.364.3–13.67
IMean12.20 ab4.16 a22.99 a53.30 f7.35 d
Range9.91–14.672.80–41.0210.64–63.9338.88–63.934.08–12.90
IIMean12.01 c3.94 b21.34 b55.02 bc7.51 d
Range9.8–15.562.21–5.9112.6–35.4944.18–66.752.94–11.89
IIIMean12.07 c4 b21.89 b54.21 de7.89 c
Range9.61–17.482.37–6.3913.03–42.4838.77–62.433.94–14.91
IVMean12.15 bc3.93 b21.48 d54.15 de8.30 b
Range9.97–15.002.49–6.5714.08–32.7843.48–61.715.05–12.58
VMean12.09 bc3.79 c21.18 d54.70 cd8.25 b
Range9.77–14.712.37–6.4813.62–37.9842.93–61.744.65–13.37
VIMean12.08 bc3.69 cd19.88 c55.47 ab8.88 a
Range7.93–16.712.61–5.4911.95–33.5044.67–66.903.68–13.91
VIIMean11.75 d3.79 c19.73 c56.20 a8.54 ab
Range9.72–18.442.62–6.0813.63–28.8548.80–62.315.04–13.95
a The content of each fatty acid is expressed as a percentage of total fatty acid content. Values of means within each column with different letters indicate statistically significant differences at P < 0.05.
Table 4. Accessions showing desired contents of five fatty acids with higher stability (lower CV).
Fatty AcidID NumberNameMean aCV (%)Origin
Higher palmitic acid (PA)WDD01709T30917.202.03USA
WDD01215Saikai 2014.813.45Japan
ZDD24126gongdou1014.011.18China
WDD02708PSB31313.973.05Russia
Higher stearic acid (SA)WDD02225L72-9205.048.48USA
-Laidou245.0112.57China
-HLT2-Heihe134.726.39China
Z13-633-1Z13-633-14.8112.82China
Higher oleic acid (OA)ZDD11235SQDDD28.479.98China
ZDD06021Qingpidou28.144.93China
ZDD12746SCQPD27.314.67China
WDD02995PI 46890327.276.58USA
Higher linoleic acid (LA)WDD03084S01-939163.933.20USA
ZDD03222RNPDS63.302.32China
-YZY2004-15-15W8362.864.51China
WDD00713Dorchsoy61.883.30USA
WDD01488CX1038-1461.043.86USA
WDD01618Camp60.101.55USA
Lower linoleic acid (LA)ZDD04382DYBHSBD47.364.55China
ZDD06450YGZHD47.714.59China
ZDD07088LQDD48.244.40China
ZDD06021Qingpidou48.293.51China
Higher linolenic acid (LNA)ZDD03739PXDZHC12.767.82China
ZDD16816CSHD11.4811.02China
PI84751G1593|201711.3210.68USA
WDD02708PSB31311.3110.00Russia
PI43848913G1592|201711.077.90USA
WDD01674T116H11.059.47USA
Lower linolenic acid (LNA)WDD01482C16403.4312.53USA
a The content of each fatty acid is expressed as a percentage of total fatty acid content. CV, Coefficient of variation.

