Article

QTL Mapping for Drought-Responsive Agronomic Traits Associated with Physiology, Phenology, and Yield in an Andean Intra-Gene Pool Common Bean Population

1
Crop Science Department, Agricultural Institute of Slovenia, Hacquetova ulica 17, SI-1000 Ljubljana, Slovenia
2
Plant Protection Department, Agricultural Institute of Slovenia, Hacquetova ulica 17, SI-1000 Ljubljana, Slovenia
*
Author to whom correspondence should be addressed.
Agronomy 2020, 10(2), 225; https://doi.org/10.3390/agronomy10020225
Submission received: 18 December 2019 / Revised: 23 January 2020 / Accepted: 28 January 2020 / Published: 4 February 2020
(This article belongs to the Special Issue Genetics, Genomics, and Breeding of Legume Crops)

Abstract

:
Understanding the genetic background of drought tolerance in common bean (Phaseolus vulgaris L.) can aid its resilience improvement. However, drought response studies in large seeded genotypes of Andean origin are insufficient. Here, a novel Andean intra-gene pool genetic linkage map was created for quantitative trait locus (QTL) mapping of drought-responsive traits in a recombinant inbred line population from a cross of two cultivars differing in their response to drought. Single environment and QTL × environment analysis revealed 49 QTLs for physiology, phenology, and yield-associated traits under control and/or drought conditions. Notable QTLs for days to flowering (Df1.1 and Df 1.2) were co-localized with a putative QTL for days to pods (Dp1.1) on linkage group 1, suggesting pleiotropy for genes controlling them. QTLs with stable effects for number of seeds per pod (Sp2.1) in both seasons and putative water potential QTLs (Wp1.1, Wp5.1) were detected. Detected QTLs were validated by projection on common bean consensus linkage map. Drought response-associated QTLs identified in the novel Andean recombinant inbred line (RIL) population confirmed the potential of Andean germplasm in improving drought tolerance in common bean. Yield-associated QTLs Syp1.1, Syp1.2, and Sp2.1 in particular could be useful for marker-assisted selection for higher yield of Andean common beans.

1. Introduction

Common bean (Phaseolus vulgaris L.) is an important legume crop for human consumption [1]. During the growing season it requires between 300 and 500 mm of rain for optimal development and production of seed according to its genetic potential [1,2]. Water deficit results in a reduction of quality and quantity of yield and is problematic especially in drought-endemic regions in developing countries [2]. Due to ongoing climate changes, traits associated with drought tolerance are being introduced in many common bean breeding programs in Europe and worldwide [3].
Adaption of plants to drought stress can be a result of drought escape or different drought tolerance mechanisms. The plant can escape the drought by completing their life cycle before the onset of severe stress conditions, which is enabled by early maturation and seed development characterized by increased mobilization of carbon to the seed. Resistance mechanisms include avoiding the drought consequences by maintaining high water potential (drought avoidance) or tolerating low water potential (drought tolerance) [4]. Drought avoidance is facilitated by the maximization of water uptake by the root system and optimization of water consumption by shoots resulting in greater biomass production in relation to transpired water [5]. An important characteristic of drought tolerance is osmotic adjustment with an accumulation of compatible solutes [6].
Common bean originates from two major gene pools, Andean and Mesoamerican, that contain a great diversity of genotypes from which traits contributing to increased performance under drought have been identified, including earliness, deep rooting, increased ability to partition dry matter for grain production, and water use efficiency [5]. Common beans of the Mesoamerican gene pool, belonging to races Durango and Mesoamerica, are especially known for their superior drought tolerance and have been used to develop drought-tolerant bean cultivars [7]. Although Andean cultivars with better performance under drought have been reported in Andean races Nueva Granada and Peru [8], the reports of their use in breeding are lacking [9]. On the other hand little progress has been achieved in transferring traits related to drought tolerance across gene pools to large-seeded beans of the Andean origin.
Consequently, the majority of drought responsive quantitative trait loci (QTLs) mapping studies were performed on mapping populations where the resistant parent consisted of one of the more drought-tolerant Mesoamerican cultivars. Inter-genepool crosses enable high coverage of the genetic map with polymorphic markers between Andean and Mesoamerican genepools and were utilized to detect phenological and seed mass QTLs associated with drought tolerance [10]. On the other hand QTLs identified in an intra-genepool population can be easier to transfer to plants within the same gene pool; however, because of a more similar genetic makeup, the development of genetic linkage maps is limited by lower numbers of polymorphic markers [11,12,13,14]. Mesoamerican mapping population has been utilized to identify drought tolerance-associated QTL for phenological and yield-related traits [15], as well as QTL for photosynthate acquisition, accumulation, and remobilization traits in drought stress [16]. Although Andean genetic maps have previously been utilized to detect QTL associated with complex traits with polygenic inheritance, such as popping ability [14], only recently has QTL mapping of drought-responsive traits been reported [9]. In this particular study, a population derived from drought-tolerant Ecuadorian cultivar Portillo was used for mapping of phenology, yield component, and partitioning traits in field trials in Uganda [9].
Developing Andean cultivars with enhanced performance under drought conditions and adaptability to local environments remains a challenge [9]. Andean varieties represent the majority of common bean germplasm in Europe (67%), are becoming an important staple food on the international market, and are commonly consumed in parts of Africa [11,17,18,19,20]. The potential of Andean genotypes for improving drought tolerance by selection for yield-associated traits has been indicated in phenotyping studies examining genotypes from both gene pools under drought and irrigation conditions [8,21,22]. Perspective cultivars of both gene pools exhibited similar grain yield potential under watered conditions, as well as no significant changes in canopy biomass in drought between the genepools. The sensitivity to drought stress of Andean genotypes was attributed to poor mobilization of photosyntates to pod production resulting in lower yields [22]. However, the same study identified an Andean genotype with the same level of ability to remobilize the photosyntate reserves to pod development and grain filling. Although yield-associated traits remain the most important indicator of genotype performance under drought stress, studies are also directed toward investigation of physiological parameters such as chlorophyll fluorescence with respect to drought susceptibility in common bean [23].
For the improvement of Andean genepool to drought tolerance, it will be crucial to explore drought tolerance alleles and QTLs in additional genotypes of Andean origin in order to identify alternative sources of drought tolerance and more compatible genetic donors for improvement of Andean common bean. Therefore, the objectives of this study were (1) to develop a novel stable Andean common bean recombinant inbred line (RIL) mapping population, (2) to construct an Andean intra-gene pool genetic linkage map of common bean based on simple sequence repeat (SSR) and amplified fragment length polymorphism (AFLP) markers, and (3) to identify QTLs for physiology traits (leaf water potential and effective quantum yield of photosystem II (PSII), termed in this paper as ΦPSII) under drought and control conditions, as well as QTL for phenology traits (days to flowering, days to pods) and yield traits (pods per plant, seed per pod, seed yield per plant, 100 seed mass, and pod harvest index) under drought conditions in two consecutive seasons.

2. Materials and Methods

2.1. Plant Material

A common bean RIL population consisting of 82 lines resulting from Andean intra-gene pool cross of ‘Tiber’ × ‘Starozagorski čern’ was used in this study. The population was developed by hand pollination of parental genotypes to develop initial F1 hybrids, and single seed descent method was used to generate F2 to F8 generations. ‘Tiber’ (Clause Semences, France) is a cultivar that exhibits more drought tolerance in comparison to ‘Starozagorski čern’ (Semenarna Ljubljana, Ljubljana, Slovenia) [24,25].

2.2. Greenhouse Experiments

For the evaluation of drought tolerance-associated traits in parental genotypes and 82 RILs, 15 plants per genotype were planted in two greenhouse environments in two consecutive years. The experiments were carried out in greenhouses at two locations: the Biotechnical faculty, University of Ljubljana (46.05 N, 14.47 E), during the May-July season of 2013; and The Agricultural Institute of Slovenia (46.06 N, 14.52 E), during the April-July season of 2014.
The parental genotypes and the RIL population were planted in 27 cm diameter pots containing a mixture of fertilized peat (Klasmann Potgrond P, Klassman-Deilmann, Geeste, Germany) and vermiculite (1:1, v/v). For each genotype and RIL, five healthy seeds were planted per pot in three pots, after being surface-sterilised with 5% sodium hypochlorite (Kemika, Zagreb, Croatia). When the plants developed the first trifoliate leaf (5 days of growth after plant emergence), three most equally developed plants per pot were kept and the others were discarded.
Equal soil water conditions were maintained for control plants by watering them regularly to 60% of volumetric water content (VWC), close to field capacity. Stressed plants with discontinued irrigation (moderate and severe drought) gradually achieved wilting point, on the basis of measurements of substrate water holding capacity. At each sampling time point, physiological response of plant was assessed by measuring plant water potential. Fresh mass (Fws) of the soil mixture sample was weighed in a 10 cm3 cylinder, and placed in an oven for 24 h at 105 °C to dry completely (Dws). VWC was calculated according to the formula:
VWC [vol%] = (Fws − Dws) × Dws−1 × 100 × ρsubstrate
where ρsubstrate is substrate density. Equal soil water conditions for different pots in the same treatment were maintained by weighing the pots to assess the gradual decrease in VWC between watering.
Drought conditions were induced for parent cultivars and the RIL population by discontinuing watering after 21 days of plant growth after emergence. Measurements of physiology traits were performed at three time-points: 1 day before discontinuation of watering (control), after 10–13 days of induced drought (moderate drought), and after 17–23 days of induced drought (severe drought). After the final measurement, the watering was re-established until the harvest. The differential response between stress and non-stress (continuous watering) conditions was evaluated in parallel blocks for parental genotypes.
Plants were grown under natural light, temperature, and relative humidity conditions. Outside daily temperatures and rainfall were monitored because of their potential effect on humidity and are shown in Figure S1. During the duration of the experiments, the plants were treated three times in 2-week intervals with acaricide Vermitec Pro and insecticide Actara 25 WG (Syngenta, Basel, Switzerland) following the manufacturers’ guidelines.

2.3. Trait Evaluation

Plant response to drought stress for parental genotypes and RIL populations was evaluated by recording leaf water potential (Wp) and the effective quantum yield of PSII (ΦPSII) at three time-points: control, moderate drought, severe drought. Water potential was measured on the third trifoliate leaf by using pressure chamber 3005–1223 (Soil Moisture Equipment Corp., Goleta, CA, USA) as described by Scholander et al. [26]. Water potential for each condition was measured on three consecutive days—each day, measurements were performed on all RILs in the time period of 10-13 h, and in total three plants from different pots were measured per each RIL. Chlorophyll a fluorescence parameters were measured with a Mini-PAM (pulse-amplitude-modulated) fluorometer (Heinz Walz GmbH, Effeltrich, Germany). The parameter effective quantum yield of PSII:
ΦPSII = (Fm’ − Fs) × (Fm’)−1,
was measured on light-adapted leaves under natural illumination present in the shaded glasshouse (average photosynthetic photon flux density (PPFD), values ranged from 80–90 µmol m−2s−1). Fm’ and Fs are the maximal and steady-state fluorescence under light conditions, respectively; PPFD is the photosynthetic photon flux density incident on the leaf; 0.5 if the factor that assumes equal distribution of energy between the two photosystems; and 0.84 is the leaf absorbance factor [27,28]. Chlorophyll a fluorescence parameters were measured on the same day or on two consecutive days, and each time, three plants from one pot were measured consecutively for all RILs in the time period of 10–13 h or 13–17 h to minimize the changes in light conditions that highly affect these measurements.
Days to flowering (Df) were determined for individual RILs as the number of days from sprouting to number of days when flower opening were observed on more than 50% of the plants. Days to pod-setting (Ds) for individual RILs was determined as the number of days from days to flowering to number of days when pod-setting was observed on more than 50% of the plants. Seed yield-related parameters were recorded when the pods reached maturity (on average after 55 days of plant growth): pods per plant—the number of both full and empty pods (Pp); seeds per pod—the number of seed per full pods (Sp), seed yield per plant (Syp), and 100 seed mass (Hsm). Pod harvest index (Phi) was calculated as
Phi = (dry mass of seed) × (dry mass of pod at harvest)−1 × 100.

2.4. DNA Extraction and Population Genotyping

Fresh leaf samples of each RIL and parental genotypes were collected and 60-100 mg of tissue was homogenized in 200 µl RLT lysis buffer (Qiagen, Germantown, MA, USA) using TissueLyzer (Qiagen, Stockah, Germany). Total genomic DNA was extracted using MagMAX Express magnetic extractor (Applied Biosystems, Waltham, MA, USA) and BioSprint 15 DNA Plant kit (Qiagen, Germantown, MA, USA) according to the optimized user manual.
Screening for polymorphisms between the parental genotypes was performed using 447 SSR markers and 256 AFLP marker combinations. Primers were obtained from the previously reported studies in common bean. Among them, 103 primer pairs with the prefix ‘BM’ [29,30], 79 with the prefix ‘BMb’, 10 with the prefix ‘BMc’ [31], 50 with the prefix ‘BMg’, and 15 with the prefix ‘PVBR’ were tested. Among the gene-based SSR markers, 36 primer pairs with the prefix ‘BMd’ [32,33], 49 with the prefix ‘PvM’ [34], and 29 with the prefix ‘SSR-IAC’ [35] were tested. PCR amplification of SSR markers was performed as previously reported [19]. AFLP amplification was performed following the original protocol [36] with previously reported modifications [37]. Briefly, DNA was cut with EcoRI (cuts at G/AATTC ) and MseI (cuts at T/TAA) restriction endonuclease enzymes and double-stranded adaptors (EcoRI-adaptor: CTC GTA GAC TGC GTA CC CAT CTG ACG CAT GGT TAA; MseI-adaptor: GAC GAT GAG TCC TGA G TA CTC AGG ACT CAT) were ligated to the fragment ends. Pre-amplification was performed using non-selective primers, followed by a selective amplification using a total of 256 combinations of forward primers (E-AGC, E-AGG, E-ACC, E-ACT, E-ACG, E-AAA, E-AGA, E-AAC, E-ACA, E-AAG, E-AAT, E-ATA, E-ATC, E-ATT, E-ATG, E-AGT; where E is GAC TGC GTA CCA ATT C) and reverse primers (M-CAG, M-CAT, M-CAC, M-CAA, M-CTC, M-CTT, M-CGC, M-CTA, M-CTG, M-CGA, M-CGT, M-CGG, M-CCA, M-CCC, M-CCT, M-CCG; where M is GAT GAG TCC TGA GTA A). The amplified products were genotyped on ABI 3130XL Genetic Analyzer (Applied Biosystems, Waltham, MA, USA), QIAxcel advanced system (Qiagen, Germantown, MA, USA), or separated on agarose gel electrophoresis, depending on the base pair difference between the polymorphic markers. The AFLPs were named by combining the last two selective bases ligated to EcoRI and MseI adaptors in the amplification step and by numbering the individual bands in order of decreasing molecular weight [13].

2.5. Genetic Linkage Map Construction and QTL Analysis

The genetic linkage map was constructed using QTL IciMapping integrated software for building linkage maps and mapping quantitative trait genes [38]. Markers were assigned anchor values on the basis of common bean consensus linkage map to inform their linkage group placement and marker order [39]. Grouping of markers was performed using a logarithm of odds (LOD) score of 3.0 as a threshold to declare significant linkage relationship between two markers. Unanchored markers were moved to the appropriate linkage groups on the basis of data from the literature. The final marker order was determined using the algorithms “nnTwoOpt” for the marker ordering and “SARF” for rippling. The mapping function Kosambi [40] was used to convert the recombination fractions to centimorgans (cM).
Single environment QTLs were detected using Windows QTL Cartographer 2.5 [41] with the composite interval mapping method (CIM) set to Model 6: standard model, backward regression, 5 control markers, 10 cM window size, and 0.05 probabilities. The threshold value for QTL detection was calculated using 1000 permutations with a significance level of 0.05. The phenotypic variance associated with each QTL was determined with a determination coefficient (R2). QTL by environment interaction mapping for each trait was performed using QTL IciMapping using the MET functionality [38,42]. In both types of analysis, the LOD score threshold for significance (P = 0.05) was calculated using 1000 permutations. QTLs were named according to the trait and the linkage group they were located on in sequential order. The genetic linkage map was drawn using MapChart v2.3 [43].

2.6. Consensus Map Integration and QTL Validation

A high-density integrated linkage map was constructed using the ‘iterative map projection’ functionality of BioMercator V4.2 to project the linkage map from our experiment onto a reference common bean consensus linkage map [39,44]. As a validation approach of QTLs detected in our study, BioMercator V4.2 was used to project them on the integrated map together with previously reported QTLs in common bean that were placed on a consensus map by Galeano et al. [39].

3. Results

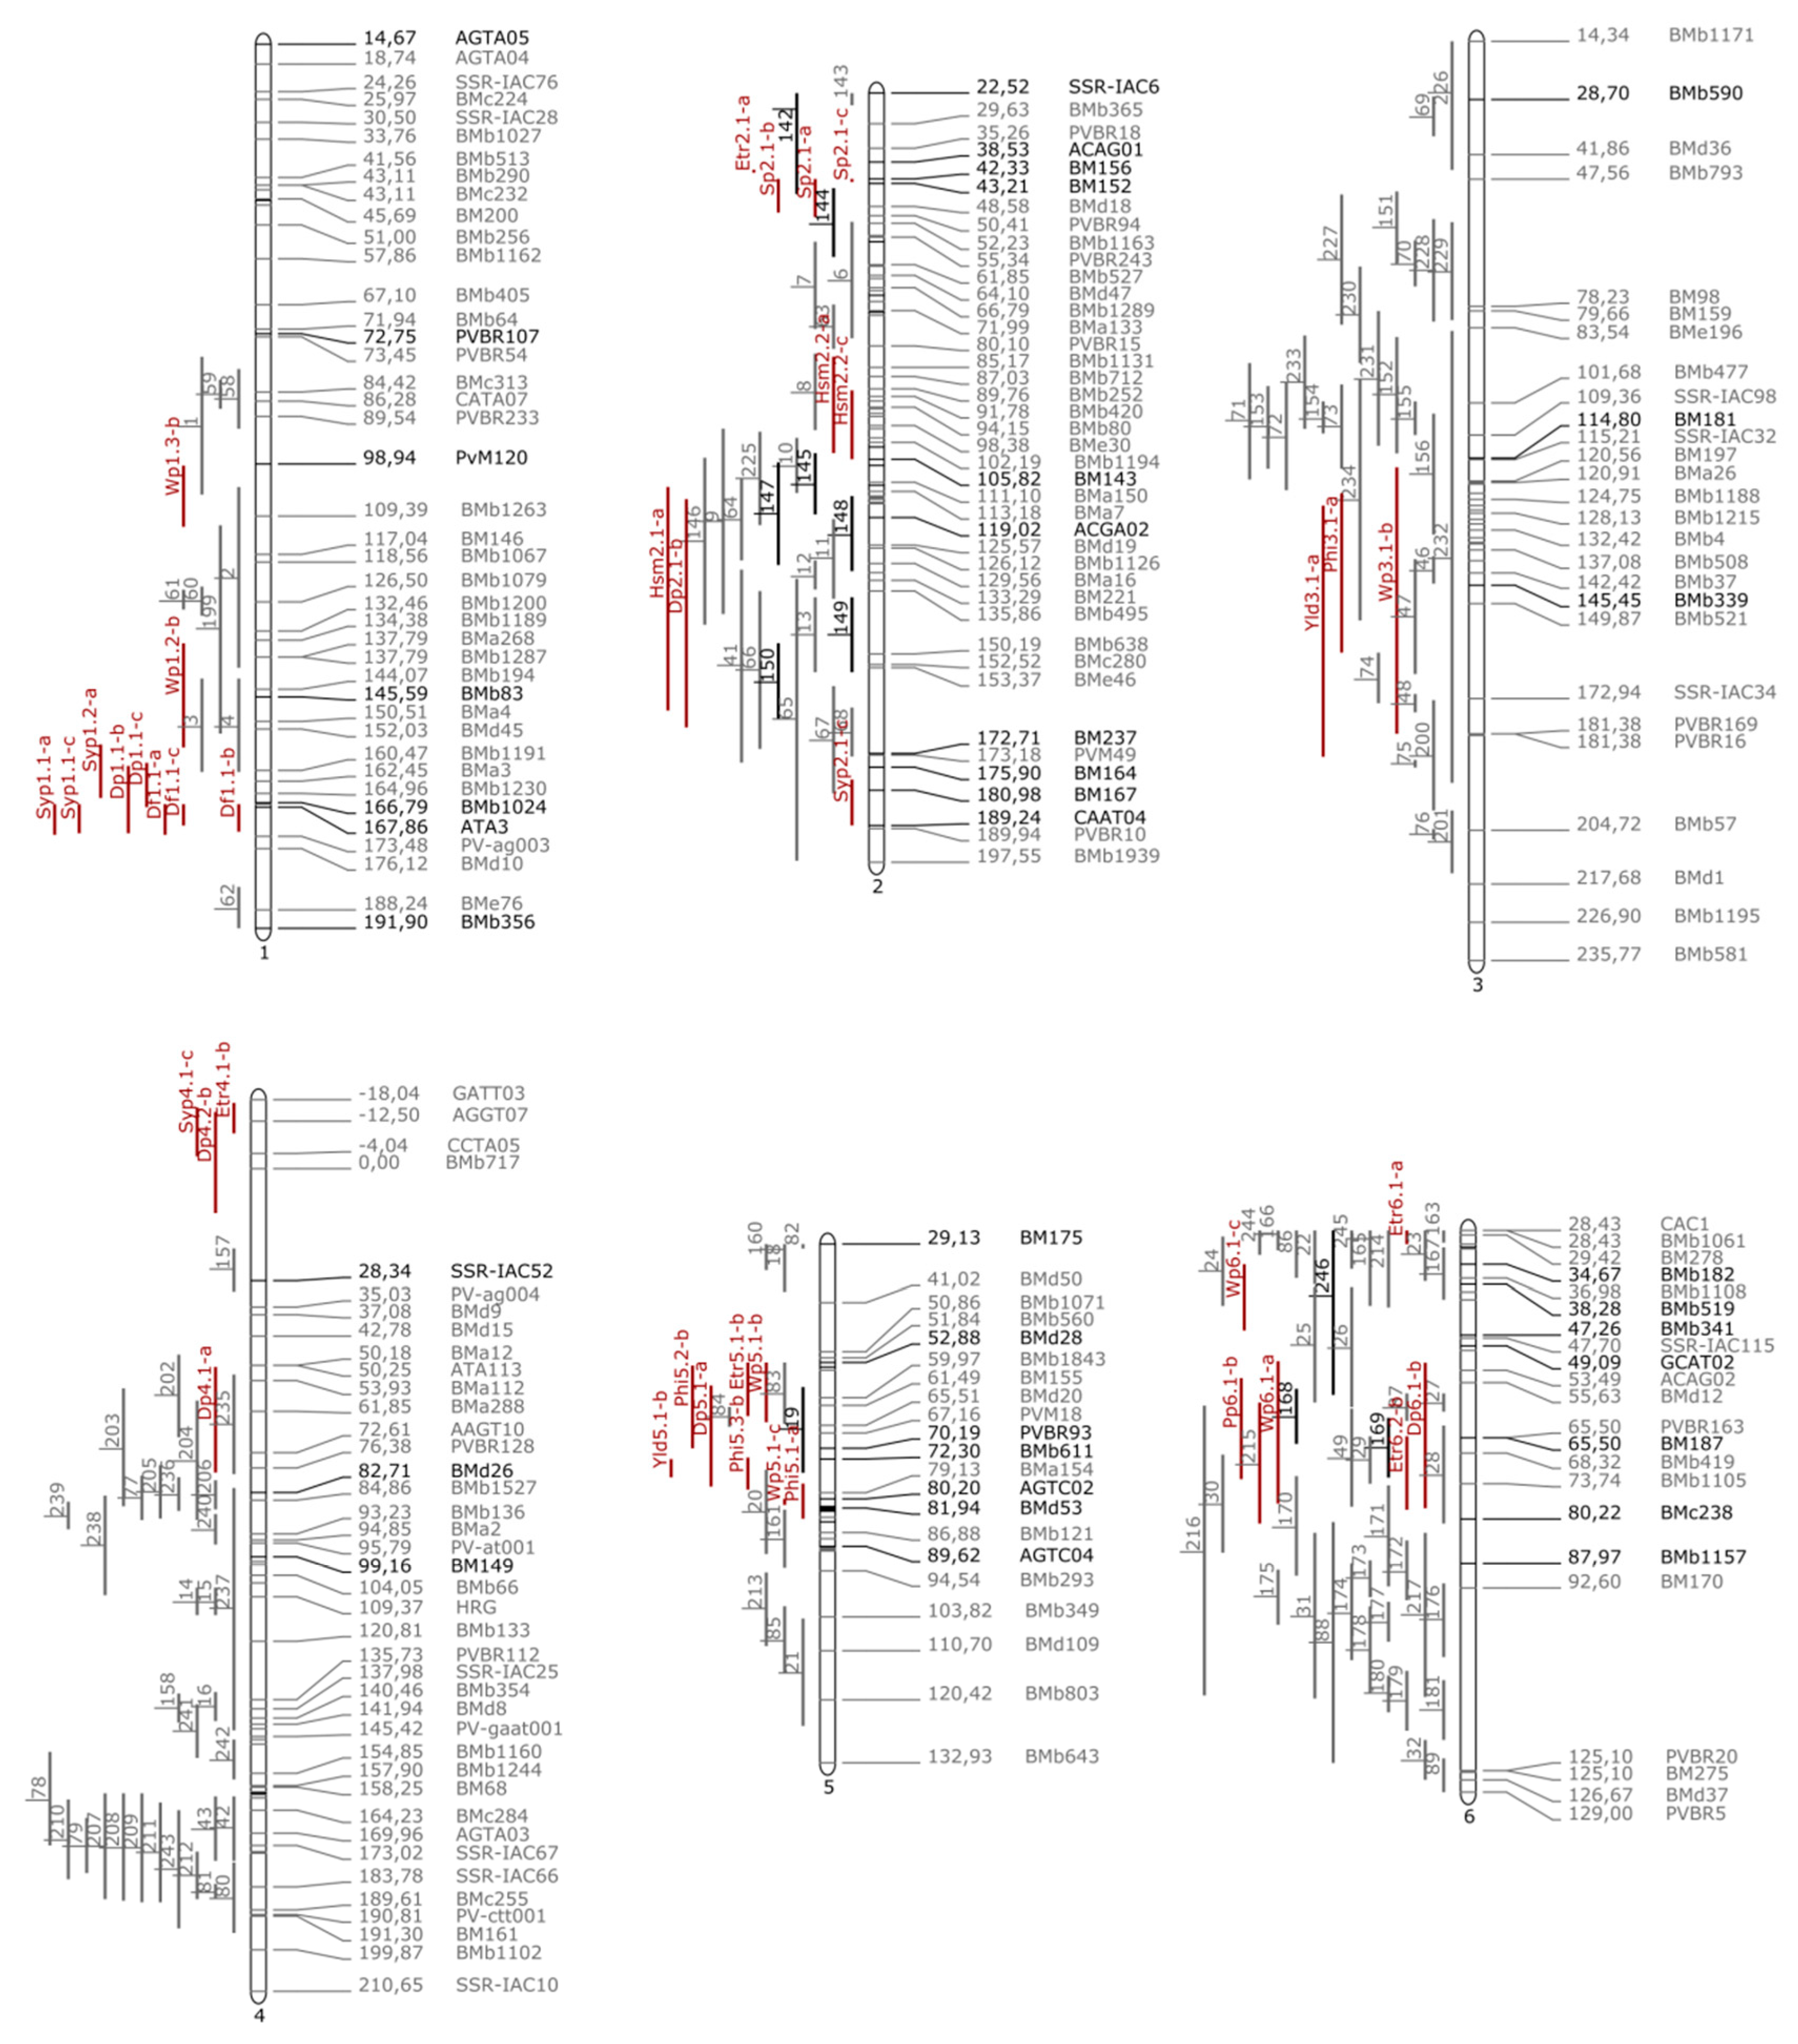
3.1. A Novel Andean Intra-Gene Pool Genetic Linkage Map of Common Bean

A total of 447 SSR primer pairs developed for common bean and 256 AFLP combinations were screened for polymorphisms in the parental genotypes. Among the successfully amplified markers, 26 polymorphic AFLP combinations and 105 polymorphic SSR markers were detected. In total, 123 markers were placed on the genetic map (Table 1).
Common bean consensus map was used to assign anchor values to 73 markers informing their linkage group placement and marker order [39]. Grouping of markers was on the basis of the LOD value, and 123 markers segregating in the recombinant inbred line population were assigned to all 11 linkage groups of the common bean genome (Table 1). The resulting genetic linkage map was in total 1288.4 cM long, with an average marker density of 11.5 cM. Good coverage of the majority of linkage groups was achieved with 6–19 markers, and with the length in the range of 40.3–221.1 cM. Exceptions were group 3 and 11, with low number of markers covering 30%–50% of the consensus linkage group. In groups 5, 6, and 7, despite higher number of obtained markers, the coverage was below 50% compared to the consensus map. The distribution of markers in these groups was even with the average distance between markers 11.5 cM and ranging from 4.0 to 33.0 cM. The inclusion of AFLP markers contributed to the reduction of the average distance between markers. Linkage groups 2, 9, and 10 were the most populated, containing 15–19 markers. Groups 2 and 4 were the longest, both over 190 cM.
The linkage map with detected QTLs (Figure 1, Figure S2) was projected onto the consensus linkage map [39] on the basis of common markers (Figure 2, Figures S3–S5). The resulting linkage map had a total length of 1880.7 cM and enabled comparison of detected QTLs with previously published QTLs in common bean.

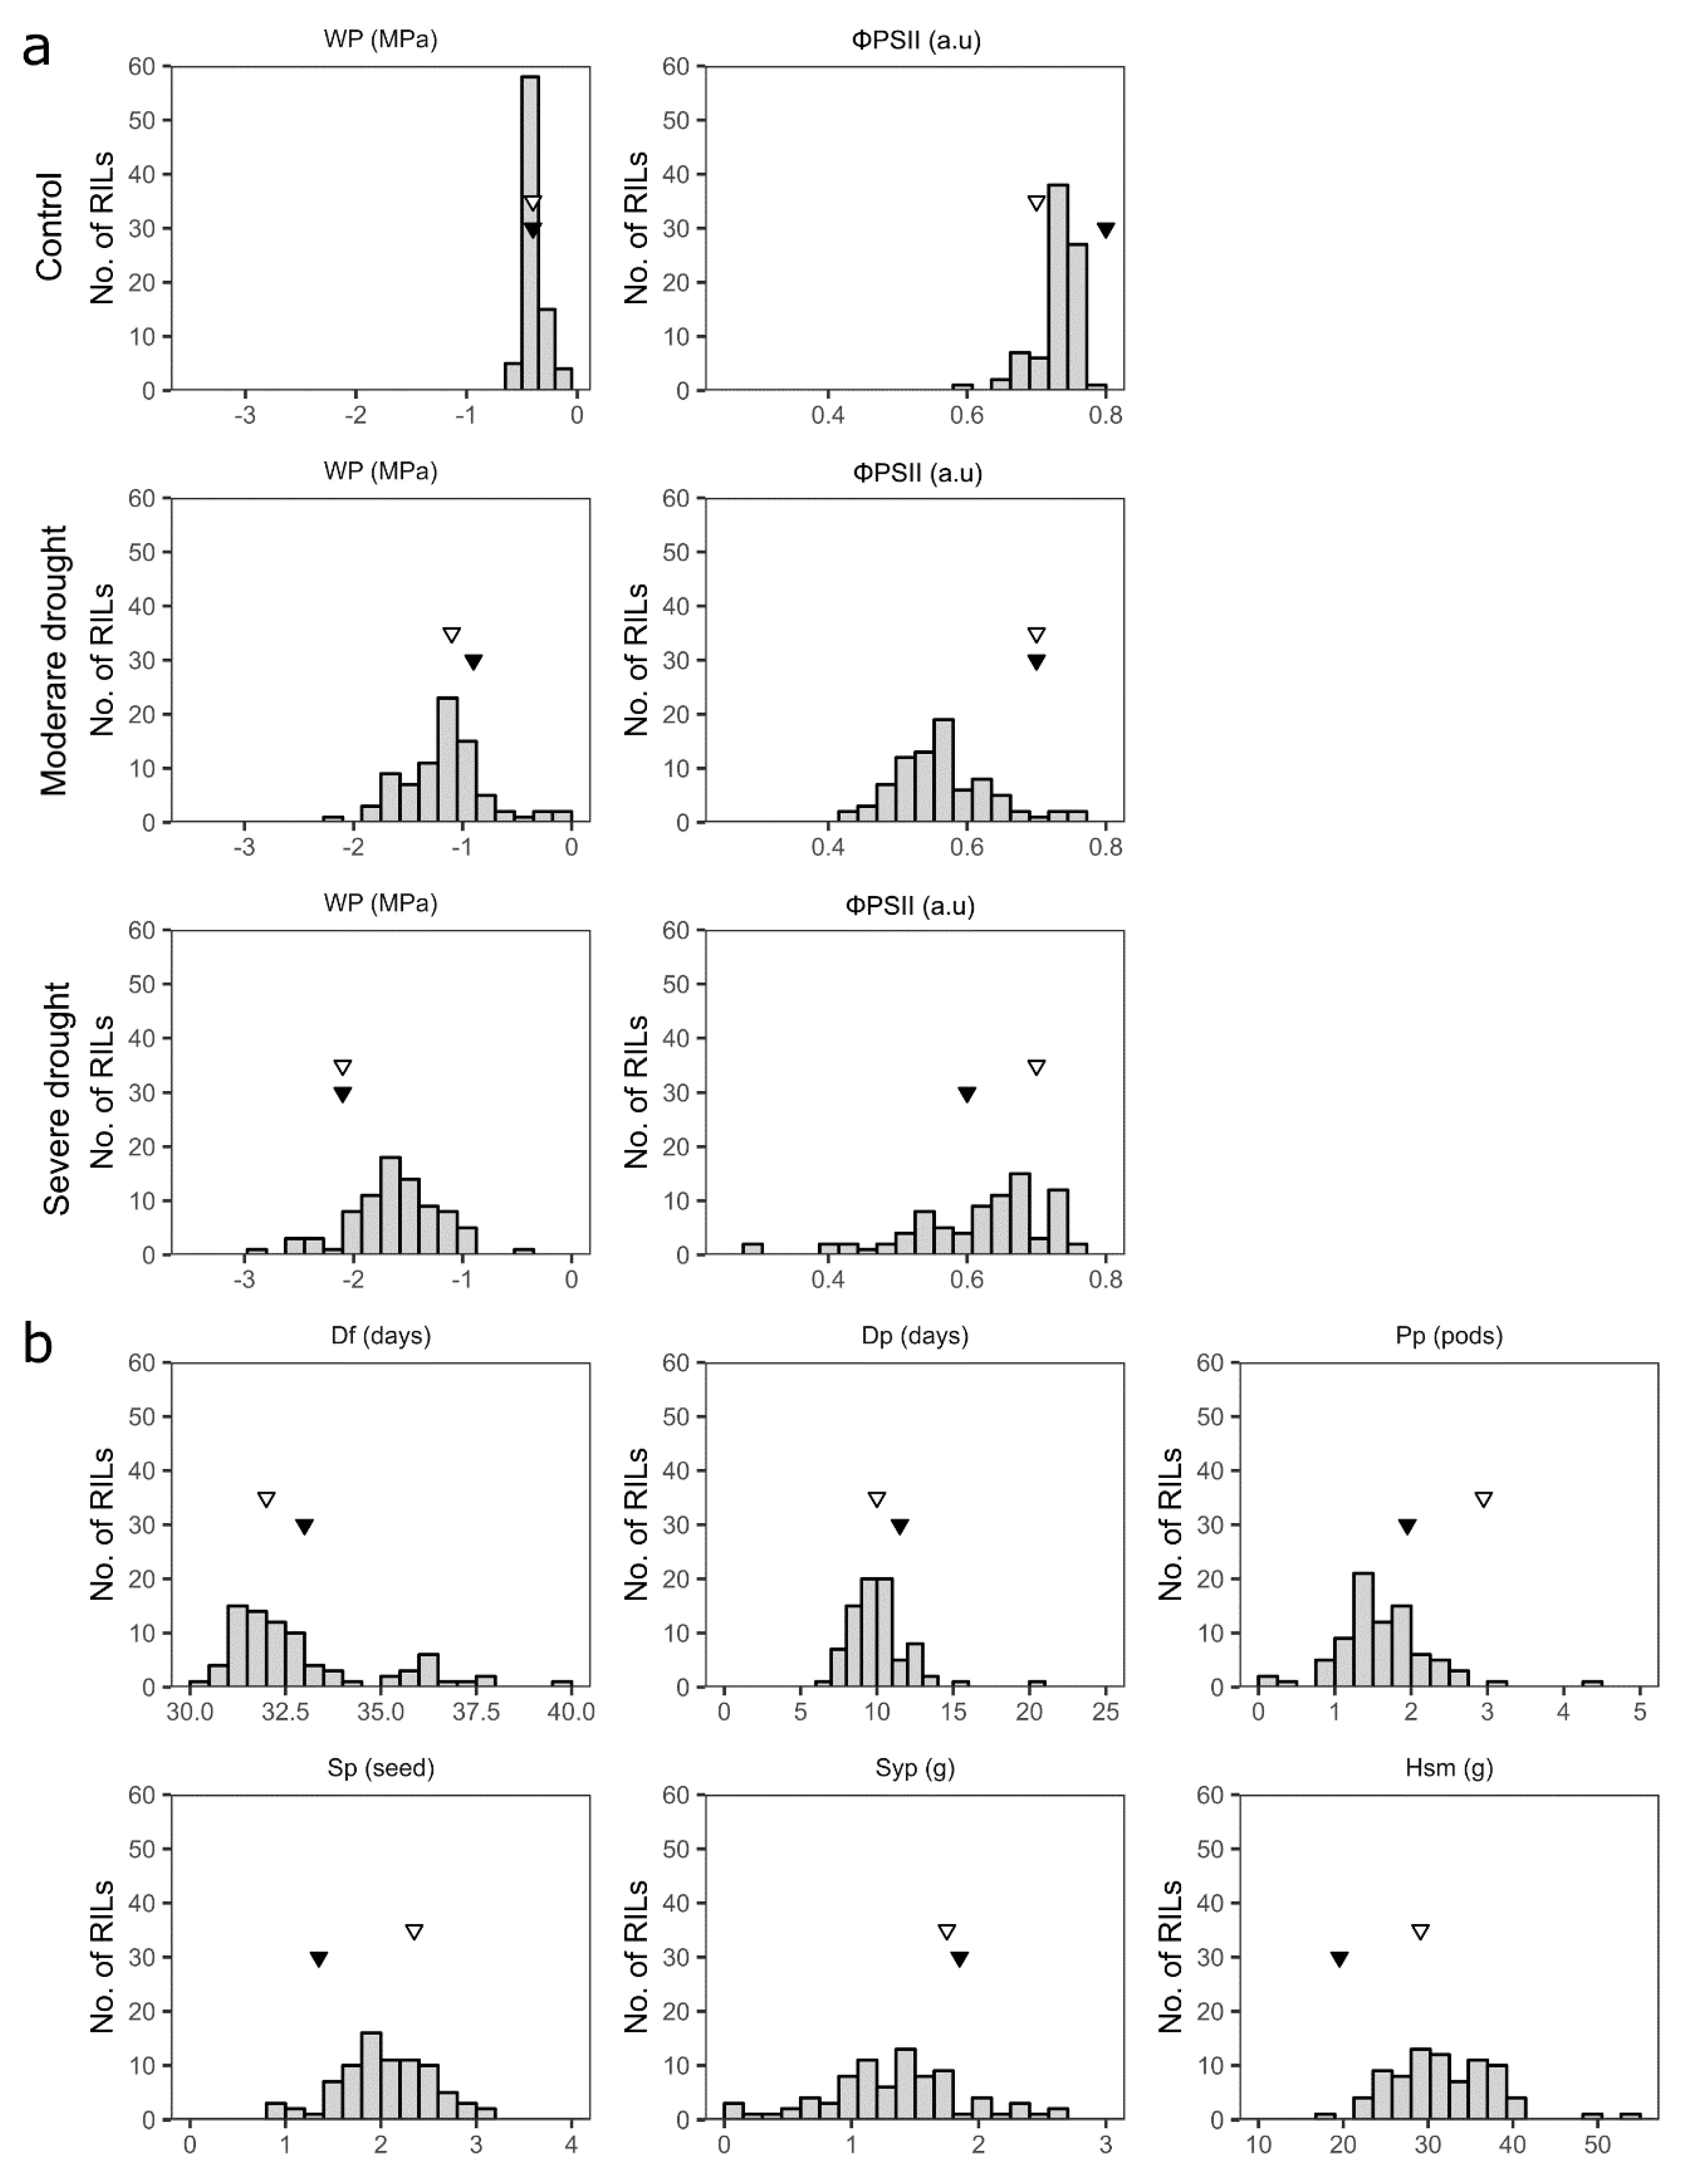
3.2. Phenotypic Variation of Drought Tolerance-Related Traits in the Parents and the Mapping Population

All traits were continuously distributed and displayed transgressive segregation (Figure 3). Descriptive statistics for measured physiology-associated, phenological, and yield traits in the RIL population is presented in Table S3. In watered plants, the coefficient of variation (CV) for physiological traits for a specific year ranged from 18.8%–31.3% for water potential and 3.9%–7.1% for ΦPSII. In drought exposed plants, decreased leaf water potential and reduced ΦPSII were observed and compared to watered plants. In 2014, a temporary reduction in ΦPSII was observed during moderate drought (Figure 3). Evaluation of Wp and ΦPSII during progressive drought conditions in parental genotypes and comparison to simultaneously grown plants that were watered confirmed that reduction of these parameters was due to drought and not due to changes in plant physiology due to ageing. The CV for continuously assessed phenology traits in each season was low, ranging from 5.5%–8.0%, and yield traits assessed in both seasons after re-established watering ranged from 19.4%–26.4% (100 seed mass) to 38.9%–88.0% (seed yield per plant).
Rainfall distribution and outside average daily temperatures were measured during experiment duration in two consecutive seasons because of their potential effect on the humidity in the greenhouses (Figure S1). In both seasons, the range between average maximum and minimum temperatures was similar (12–24 °C) with the cumulative rainfall being lower in the first season (224.7 mm) compared to the second (281.3 mm). Plants in the second season started to flower before the period of discontinued watering, whereas plants in the first season started to flower after, and had later maturation times and lower yields.

3.3. Drought Tolerance-Related QTL Identification Using the Novel Andean Intra-Gene Pool Genetic Linkage Map

In total, 46 QTLs exceeding the LOD threshold were detected using single environment analysis in control and drought conditions, with two of them identified in both seasons and one of them identified in different treatments during the same season (Table S1). QTL × environment analysis confirmed nine QTLs and identified three additional QTLs (Table 2).

3.3.1. Water Potential (Wp)

A total of 12 QTLs for water potential in control plants and drought-exposed plants were identified in both seasons (Table S1), and one of them was identified for different treatments during the same season. QTL Wp1.2 was detected on linkage group 1 and had stable effects at moderate and severe drought of season 2014 and a LOD score in the range from 2.8 to 4.8 (Figure 1). Two different QTL with LOD score in range of 2.4 to 6 LOD were detected on linkage group 5 for either control or moderate drought of season 2014 (Figure S2). On linkage group 6, also, two different QTL with a LOD score in a range of 2.3 to 4 were detected for either control or severe drought of season 2013 (Figure S2). Among additionally detected putative QTLs, two were on linkage group 1 and one each at linkage groups 3, 7, 8, 9, and 10, for either moderate or severe drought in either one season or the other (Figure 1, Figure S2). QTLs for Wp explained 8%–27% of phenotypic variance.
On the projected map, QTLs Wp1.1 and Wp1.2 were surrounded by the QTLs for root hair length (60, 61) and specific root length (62) reported by Yan et al. [45] and Beebe et al. [46] (Figure 2).

3.3.2. The Effective Quantum Yield of PSII (ΦPSII)

Six putative QTLs were detected for ΦPSII in either of the seasons, with LOD scores from 2.4 to 4.6, and explaining up to 20% of phenotypic variance (Figure S2, Table S1).

3.3.3. Days to Flowering (Df)

Two QTLs were detected for days to flowering. QTL Df1.1 with stable effects on days to flowering under environmental conditions of both seasons was detected on linkage group 1 with LOD scores in the range from 7.0 to 9.4 and accounting for 26%–34% of phenotypic variation (Figure 1, Table S1). Df1.1 alleles linked to earlier flowering of the plants originated from ‘Tiber’. Additional putative QTL Df1.2 was detected in one of the seasons with LOD 7.8.
The location of detected days to flowering QTL Df1.1 on the projected map was in the vicinity of QTLs for first flower (2) and last flower (4) previously reported by Pérez-Vega et al. [47] (Figure 2).

3.3.4. Days to Pod-Setting (Dp)

Six QTLs were detected for days to pod-setting. QTL on linkage group 1 (Dp1.1) with LOD score 6.1 and accounting for 23% of phenotypic variation was detected on the same locus as a stable QTL for days to flowering Df1.1 (Figure 1, Table S1). Two putative QTLs were detected on different locations on linkage group 2, one in each of the seasons (Figure 1). An additional three putative QTLs were detected on linkage groups 2, 5, and 6 each in only one of the seasons, with LOD scores in the range from 1.8 to 2.5 and explaining 7%–13% of phenotypic variation (Figure 1, Figure S2).
The location of detected days to maturity QTL Dp1.1 on the projected map was in the vicinity of QTL for full maturity (3) previously reported by Pérez-Vega et al. [47] (Figure 2). The location of QTL Dp5.1 on the projected map overlapped with QTL for first flower (19) previously reported by Blair et al. [15] (Figure 2).

3.3.5. Pods per Plant (Pp)

Two putative QTLs for Pp were detected in only one of the seasons on linkage groups 6 and 11, with LOD scores ranging from 2.6 to 2.7 and explaining 11% of phenotypic variation (Figure S2, Table S1).
The location of detected putative QTLs Pp6.1 and Pp11.1 partially overlapped QTLs for seeds per plant (246) and seed mass (168, 169, 198) previously reported by Blair et al. [15,48] (Figure 2 and Figure S5).

3.3.6. Seeds per Pod (Sp)

Four QTLs for Sp were detected (Table S1). QTL with stable effects on number of seeds per pod under environmental conditions of both seasons was detected on linkage group 2 (Sp2.1) with LOD scores in the range from 3.1 to 4.0 and explaining 11%–15% of phenotypic variation (Figure 1). Three additional putative QTLs were detected with LOD in the range of 2.9–3.7 (Figure S2). QTLs on linkage group 7 were detected in both seasons and QTL on linkage group 8 in only one season.
The location of detected QTLs Sp2.1 on the projected map partially overlapped with QTLs for seed mass (142) and seed length (144) previously reported by Blair et al. [48] and Pérez-Vega et al. [47] (Figure 2). Similarly, the location of QTL Sp7.2 overlapped with QTL for seed yield (247) previously reported by Blair et al. [15] (Figure S3).

3.3.7. Seed Yield per Plant (Syp)

Two major putative QTLs for Syp (Syp1.1 and Syp1.2) were found on linkage group 1 and were significant only for environmental conditions in season 2013 with LOD scores 10.6 and 12.6 and a high percentage of phenotypic variation (37%–39%) (Figure 1, Table S1).
On the projected map, QTLs for seed yield per plant were located in the same cluster as QTLs for phenology traits (Figure 2).

3.3.8. One Hundred Seed Mass (Hsm)

Three putative QTLs for Hsm were detected on linkage groups 1 and 2 and were significant only for environmental conditions in season 2013 (Figure 1, Table S1).
On the projected map, QTL for 100 seed mass Hsm2.1 overlapped with a cluster of seed mass QTLs (145, 147-150) reported by Blair et al. [15] and was also adjacent to QTL Hsm2.2 (Figure 2).

3.3.9. Pod Harvest Index (Phi)

Six putative QTLs for Phi were detected. Three of them were on linkage group 5, with QTLs Phi5.1 and Phi5.3 detected in different seasons partially overlapping (Figure S2, Table S1). An additional three putative QTLs were detected on linkage groups 3, 7, and 9 (Figure S2).

3.4. QTL × Environment Interaction

The analysis of QTL × environment interaction was performed by taking into account phenotypic data for a specific trait for both seasons simultaneously, in order to detect QTL with smaller effects in each individual season. The analysis confirmed the presence of nine QTLs already detected in the single QTL analysis (Table 2). Three additional putative QTLs were also detected: ΦPSII10.1, Syp2.1, and Syp4.1 (Table 2).

3.5. Transgressive Segregation

For traits with the greatest additive effects in both directions and observed transgressive segregation of RIL (Wp, Dp, and Pp) graphical genotypes were inspected for genotypes in the top 10% and bottom 10% of the trait values, and allelic composition was determined for significant QTL with high additive effect (Figure S6). For all three traits, higher average positive allele numbers were observed for genotypes in the top 10% of values for individual trait compared to the bottom 10%.
The RILs with the lowest relative water potential between severe drought and control in season 2013 had on average 1.9 positive alleles (1.3 from ‘Tiber’ and 0.6 from ‘Starozagorski’) from three contributing loci of parental genotypes. The RILs with lowest number of days to pod-setting averaged from both seasons had on average 4.1 positive alleles (2.1 from ‘Tiber’ and 2 from ‘Starozagorski’) from six contributing loci of parental genotypes. The RILs with the lowest number of pods per plant in season 2014 had on average 1.5 positive alleles from parental genotypes (0.9 from ‘Tiber’ and 0.5 from ‘Starozagorski’) from two contributing loci of parental genotypes.

4. Discussion

An Andean intra-gene pool genetic map integrating two molecular marker types was created in order to explore the potential of common bean genotypes of Andean origin as a source of drought tolerance traits. The employment of AFLP markers in addition to SSR markers proved effective in saturating the linkage map and increasing the map length to 1288.4 cM, which compares favorably to that of other intra-gene pool genetic maps in common bean employing similar marker combination approaches [13,15]. Similarly, as in those studies, the search for polymorphisms in the highly genetically similar genotypes of the same gene pool necessitated a screening of a large number of markers for sufficient coverage of the genetic map [13,15]. In addition, the percentage of polymorphic markers and the map length also compare favorably to studies in common bean and other legumes utilizing SNP markers [9] and recent restriction site-associated DNA sequencing (RADseq) approaches [49,50]. The novel genetic map proved effective in detecting QTLs for drought-responsive agronomic traits associated with physiology, phenology, and yield. However, projection of our linkage map to the consensus map also revealed areas where the coverage of our genetic map is low in cases of lower marker density, which also affected the quality of QTL mapping—these map regions could be further studied by making a denser map before QTL reanalysis.
For water potential, it was notable that more of the QTLs were detected during severe drought than during moderate drought or control. Although QTL Wp1.2 was detected in different treatments of the same season and different QTLs were detected on linkage groups 5 and 6, they were not consistent across seasons. Leaf water potential is an indicator of water saving (isohydric) or water spending (anisohydric) behavior in plants, both when water is available and when it is not. More anisohydric behavior was previously implied for ‘Starozagorski’ plants on account of high water consumption and seed yield in control conditions, as well as early onset of wilting, decreased water potential, and seed yield in drought [25]. Maintaining high leaf water potential is an important trait that enables plants to avoid the effects of drought. In our study, some of the RIL exhibited better leaf Wp during drought than the parents, which suggests bidirectional transgressive segregation of this trait under drought conditions. This is caused by the allelic combination of multiple loci with additive effects in different directions between parents—RILs with the best relative leaf water potential in severe drought had on average at least two positive alleles coming from both parental genotypes on three loci with additive effects. Interestingly, one of the loci (BM187) also contributed to earlier pod-setting and lower number of pods per plant—four RILs with low relative leaf water potential were observed that were also in the bottom 10% in terms of either day to pod-setting, number of pods per plant, or both.
QTLs for ΦPSII were also detected predominantly during a severe drought. This might have been caused by fluorescence parameters being measured in relatively low light conditions due to shading of the glasshouse, where some of the discriminating power between drought-stressed and irrigated plants was lost [23,51]. However, we were able to discern significant differences in ΦPSII between drought and control treatments of parental cultivars. This is in line with reports that the effectiveness of photosynthesis during drought is more impaired with the increase in the severity of drought conditions. Reduced electron transport rate was reported at the maximum water deficit in common bean, whereas no photo-inhibition was observed in irrigated and moderately water-stressed plants [52]. Reduction of photosynthetic activity and photosynthate accumulation during the drought has been associated with leaf area reduction that benefits the plants by limiting transpiration [53]. Low average R2 values for ΦPSII (1.6%) suggest low heritability of this trait, which is in line with high dependence of the measured values on the weather conditions, especially the solar radiation.
Stable QTL for days to flowering and putative QTL for days to pod-setting were overlapped and co-localized on linkage group Pv01 (closest markers ATA3 and BMb1024), suggesting pleiotropy for genes controlling these highly correlated traits. In soybean, such a gene involved in both maturation and induction of flowering (E1 and its homologues) has been reported [54]. The overall numbers of detected QTLs for phenological traits were higher in the season of 2014, which might be associated with observed difference in timing of flowering and maturation with regard to watering conditions. High R2 values, however, suggest that phenological traits have high heritability and are less influenced by the interaction of genotype and environment, which is supported by the stability of Df1.1 in both seasons. The alleles seemingly beneficial for earlier flowering were from ‘Tiber’. The ability of plants to flower earlier and complete their life cycle before the onset of drought has been described as an important drought escape ability [55]. In plants exposed to the drought, the timing of flowering may, however, impact the final yield production because the severity of drought conditions within the season may change on a day-to-day basis.
For yield-associated traits, the majority of putative QTLs were detected for seed per pod and pod harvest index, with Sp2.1 being the only stable yield-associated QTL detected in both seasons. The additivity scores suggest that the alleles for higher number of seeds per pod were contributed by ‘Tiber’, whereas most of the alleles for higher pod harvest index were contributed by ‘Starozagorski’. Although QTLs for pods per plant were detected in both seasons, their location did not overlap, and QTLs for seed yield per plant and 100 seed mass were detected only in one of the seasons. Some of these differences could have been due to a period of 14 days without rainfall and a daily temperature exceeding 30 °C, resulting in flowers falling off, delayed maturity, and overall lower yields observed in the 2013 season.
Selection for higher yield remains one of the most common approaches of breeding for drought-tolerant plants, with seed mass being an important indicator of drought response. Seed filling is inhibited during drought, and large seed could potentially indicate drought tolerance [56]. In our study, RILs were identified (RIL53 and RIL13) as having both average seed size as well as a pod-harvest index in the top 20% of all RILs averaged between both seasons.
Some of the phenology and yield QTLs in our study were observed on the same linkage groups as previously reported QTLs. QTLs for phenology traits on linkage group 1 were previously reported for inter-gene pool populations (reviewed in Broughton et al. [1]); however, they were not observed in a Mesoamerican population, which was speculated to be because of the genetic differences between the gene pools [15]. In that study QTLs for phenological traits did however map consistently across seasons, with days to flowering and days to maturity QTLs clustered together on linkage group 5 [15], overlapping with QTL for days to pod-setting Dp5.1 from our study.
Positions of some notable QTLs from our study matched previously reported QTL and could be of potential use for marker-assisted selection. Specifically, the position of stable QTL Sp2.1 on linkage group 2 in our study was narrowed down to 2.8 Mb on the basis of the available location for one of the flanking markers, BM156. In the vicinity of this location, a QTL for pod mass per plant PW2.1PR was reported in the population ‘Portillo’ × ‘Red Hawk’ exposed to drought stress, and was tagged by marker ss715649478 at 0.12 Mb.
Additionally, the QTLs for seed yield per plant Syp1.1 and Syp1.2 observed in our study were located in the region spanning from 41.5 to 51.4 Mb on the genome on the basis of the locations of flanking markers BMb83 and BMb356. The RILs with the highest seed yield per plant had the alleles from ‘Tiber’ for markers ATA3 and BMb1024 closest to the peaks of Syp1.1 and Syp1.2, respectively. The location suggests one of these QTLs might be the same as those reported in the same region in ‘Buster’ × ‘Roza’ and ‘Portillo’ × ‘Red Hawk’ populations [9,57]. SY1.1BR with an LOD score ranging from 2.4 to 13.9 was detected in ‘Buster’ × ‘Roza’ population in multiple stress environments at 47.7 Mb near marker SNP50809 [57]. Recently SY1.1PR with LOD score 3.7 was also detected in an Andean ‘Portillo’ × ‘Red Hawk’ population exposed to drought with peak region tagged by SNP marker ss715646076 at 45.15 Mb, suggesting it was the same QTL [9]. Additionally, another QTL was detected in the ‘DOR 364′ × ‘BAT 477′ population in non-stress conditions; however, it was localized near marker BM200 at 30.8 Mb, which suggests it is a different QTL [16].
To conclude, our study contributes to the evaluation of drought-responsive traits in genotypes belonging to the Andean gene pool. Drought response-associated QTL identified in the novel Andean RIL population, especially seed yield-associated forms Syp1.1, Syp1.2, and Sp2.1, could be useful for marker-assisted selection for higher yield of Andean common beans. Especially valuable are QTLs that are stable across environments (Sp2.1, Df1.1). The presented QTL mapping results confirm the potential of Andean germplasm in improving drought tolerance in common bean by selection for traits associated with phenology, seed yield, and physiology.

Supplementary Materials

The following are available online at https://www.mdpi.com/2073-4395/10/2/225/s1: Table S1. QTLs for leaf water potential (Wp), effective quantum yield of PSII (ΦPSII), days to flowering (Df), days to pod-setting (Dp), number of pods per plant (Pp), number of seeds per pod (Sp), seed yield per plant (Syp), 100 seed mass (Hsm), and pod harvest index (Phi) in two seasons for drought and control for the common bean RIL mapping population. Table S2. Identification numbers used in our study for previously reported Phaseolus vulgaris QTLs with known positions on the consensus linkage map [39]. Table S3. Descriptive statistics for measured physiology-associated, phenological, and yield traits in the RIL population for both seasons and different experiment conditions. Figure S1: Outside temperatures (max, min) and rainfall distribution at greenhouse experiment station location during two successive years. Figure S2: Common bean linkage groups Pv03 to Pv11 showing QTLs for physiology-associated traits, phenological traits, and yield-associated traits. Figure S3: QTLs for physiology-associated traits, phenological traits, and yield-associated traits on the integrated genetic map of the ‘Tiber’ × ‘Starozagorski’ recombinant inbred line population and common bean consensus map reported by Galeano et al. [39]. Figure S4: Comparison of the order and distance between the SSR and AFLP loci of ‘Tiber’ × ‘Starozagorski’ map, reference map [39], and the projected map for linkage groups 1-6. Figure S5: Comparison of the order and distance between the SSR and AFLP loci of ‘Tiber’ × ‘Starozagorski’ map, reference map [39], and the projected map for linkage groups 7–11. Figure S6: Number of positive alleles for QTLs with high additive effects in both directions observed in top and bottom 10% of values for individual trait.

Author Contributions

Conceptualization, V.M., M.M., J.Š.-V., M.Z., and B.P.; methodology, M.Z., M.M., A.S., B.P., and J.R.; software, A.S. and M.Z.; validation, A.S. and M.Z.; formal analysis, A.S., M.Z., and J.R.; investigation, M.Z., M.M., J.R., and A.S.; resources, V.M. and J.Š.-V.; data curation, M.Z., J.R., and A.S.; writing—original draft preparation, A.S.; writing—review and editing, A.S., V.M., B.P., M.Z., M.M., and J.Š.-V.; visualization, A.S.; supervision, V.M.; project administration, V.M. and M.Z.; funding acquisition, V.M. All authors have read and agreed to the published version of the manuscript.

Funding

This research was funded by Slovenian Research Agency (project J4-4126, program P4-0072, young researcher grant for Ms. Zupin) and the FP7 Project CropSustaIn (FP7-REGPOT-CT2012-316205).

Conflicts of Interest

The authors declare no conflict of interest.

References

  1. Broughton, W.J.; Hernández, G.; Blair, M.W.; Beebe, S.E.; Gepts, P.L.; Vanderleyden, J. Beans (Phaseolus spp.)—model food legumes. Plant Soil 2003, 252, 55–128. [Google Scholar] [CrossRef] [Green Version]
  2. Beebe, S.E.; Rao, I.M.; Blair, M.W.; Acosta-Gallegos, J.A. Phenotyping common beans for adaptation to drought. Front. Physiol. 2013, 4, 35. [Google Scholar] [CrossRef] [PubMed] [Green Version]
  3. Beaver, J.S.; Osorno, J.M. Achievements and limitations of contemporary common bean breeding using conventional and molecular approaches. Euphytica 2009, 168, 145–175. [Google Scholar] [CrossRef]
  4. Levitt, J. Responses of Plants to Environmental Stresses; Academic Press: New York, NY, USA, 1972; p. 697. [Google Scholar]
  5. Polania, J.A.; Poschenrieder, C.; Beebe, S.; Rao, I.M. Effective use of water and increased dry matter partitioned to grain contribute to yield of common bean improved for drought resistance. Front. Plant Sci. 2016, 7, 660. [Google Scholar] [CrossRef] [PubMed] [Green Version]
  6. Yadav, S.; Sharma, K.D. Molecular and morphophysiological analysis of drought stress in plants. In Plant growth; Everlon, R., Ed.; IntechOpen: London, UK, 2016; pp. 149–173. [Google Scholar]
  7. Singh, S.P.; Terán, H.; Gutiérrez, J.P. Registration of SEA 5 and SEA 13 drought tolerant dry bean germplasm. Crop Sci. 2001, 41, 276–277. [Google Scholar] [CrossRef]
  8. Pérez-Vega, J.C.; Blair, M.W.; Monserrate, F.; Ligaretto, M. Evaluation of an Andean common bean reference collection under drought stress. Agron. Colomb. 2011, 29, 17–26. [Google Scholar]
  9. Dramadri, I.O.; Nkalubo, S.T.; Kelly, J.D. Identification of QTL associated with drought tolerance in Andean common bean. Crop Sci. 2019, 59, 1007–1020. [Google Scholar] [CrossRef]
  10. Mukeshimana, G.; Butare, L.; Cregan, P.B.; Blair, M.W.; Kelly, J.D. Quantitative trait loci associated with drought tolerance in common bean. Crop Sci. 2014, 54, 923–938. [Google Scholar] [CrossRef] [Green Version]
  11. Blair, M.W.; Astudillo, C.; Rengifo, J.; Beebe, S.E.; Graham, R. QTL analyses for seed iron and zinc concentrations in an intra-genepool population of Andean common beans (Phaseolus vulgaris L.). Theor. Appl. Genet. 2010, 122, 511–521. [Google Scholar] [CrossRef]
  12. Cichy, K.A.; Blair, M.W.; Galeano Mendoza, C.H.; Snapp, S.S.; Kelly, J.D. QTL analysis of root architecture traits and low phosphorus tolerance in an Andean bean population. Crop Sci. 2009, 49, 59–68. [Google Scholar] [CrossRef]
  13. Cichy, K.A.; Caldas, G.V.; Snapp, S.S.; Blair, M.W. QTL Analysis of seed iron, zinc, and phosphorus levels in an Andean bean population. Crop Sci. 2009, 49, 1742–1750. [Google Scholar] [CrossRef] [Green Version]
  14. Yuste-Lisbona, F.J.; Santalla, M.; Capel, C.; García-Alcázar, M.; De La Fuente, M.; Capel, J.; De Ron, A.M.; Lozano, R. Marker-based linkage map of Andean common bean (Phaseolus vulgaris L.) and mapping of QTLs underlying popping ability traits. BMC Plant Biol. 2012, 12, 136. [Google Scholar] [CrossRef] [PubMed] [Green Version]
  15. Blair, M.W.; Galeano, C.H.; Tovar, E.; Muñoz Torres, M.C.; Castrillón, A.V.; Beebe, S.E.; Rao, I.M. Development of a Mesoamerican intra-genepool genetic map for quantitative trait loci detection in a drought tolerant × susceptible common bean (Phaseolus vulgaris L.) cross. Mol. Breed 2012, 29, 71–88. [Google Scholar] [CrossRef] [PubMed] [Green Version]
  16. Asfaw, A.; Blair, M.W.; Struik, P.C. Multienvironment quantitative trait loci analysis for photosynthate acquisition, accumulation, and remobilization traits in common bean under drought stress. G3 (Bethesda) 2012, 2, 579–595. [Google Scholar] [CrossRef] [Green Version]
  17. Angioi, S.A.; Rau, D.; Nanni, L.; Belluci, E.; Papa, R.; Attene, G. The genetic make-up of the European landraces of the common bean. Plant Genet. Resour. 2011, 9, 197–201. [Google Scholar] [CrossRef]
  18. Maras, M.; Šuštar-Vozlič, J.; Kainz, W.; Meglič, V. Genetic diversity and dissemination pathways of common bean in Central Europe. J. Am. Soc. Hortic. Sci. 2013, 138, 297–305. [Google Scholar] [CrossRef]
  19. Maras, M.; Pipan, B.; Šuštar-Vozlič, J.; Todorović, V.; Đurić, G.; Vasić, M.; Kratovalieva, S.; Ibusoska, A.; Agić, R.; Matotan, Z.; et al. Examination of genetic diversity of common bean from the Western Balkans. J. Am. Soc. Hortic. Sci. 2015, 140, 308–316. [Google Scholar] [CrossRef] [Green Version]
  20. Sedlar, A.; Kidrič, M.; Šuštar-Vozlič, J.; Pipan, B.; Zadražnik, T.; Meglič, V. Drought stress response in agricultural plants: A case study of common bean (Phaseolus vulgaris L.). In Drought—Detection and Solutions; Ondrasek, G., Ed.; IntechOpen: London, UK, 2019. [Google Scholar] [CrossRef] [Green Version]
  21. Asfaw, A.; Ambachew, D.; Shah, T.; Blair, M.W. Trait associations in diversity panels of the two common bean (Phaseolus vulgaris L.) gene pools grown under well-watered and water-stress conditions. Front. Plant Sci. 2017, 8, 733. [Google Scholar] [CrossRef]
  22. Polania, J.; Rao, I.M.; Cajiao, C.; Rivera, M.; Raatz, B.; Beebe, S. Physiological traits associated with drought resistance in Andean and Mesoamerican genotypes of common bean (Phaseolus vulgaris L.). Euphytica 2016, 210, 17–29. [Google Scholar] [CrossRef]
  23. Sánchez-Reinoso, A.D.; Ligarreto-Moreno, G.A.; Restrepo-Díaz, H. Evaluation of drought indices to identify tolerant genotypes in common bean bush (Phaseoulus vulgaris L.). J. Integr. Agric. 2019, 18, 2–10. [Google Scholar]
  24. Zadražnik, T.; Hollung, K.; Egge-Jacobsen, W.; Meglič, V.; Šuštar-Vozlič, J. Differential proteomic analysis of drought stress response in leaves of common bean (Phaseolus vulgaris L.). J. Proteomics 2013, 78, 254–272. [Google Scholar] [CrossRef] [PubMed] [Green Version]
  25. Zupin, M.; Sedlar, A.; Kidrič, M.; Meglič, V. Drought-induced expression of aquaporin genes in leaves of two common bean cultivars differing in tolerance to drought stress. J. Plant Res. 2017, 130, 735–745. [Google Scholar] [CrossRef] [PubMed]
  26. Scholander, P.F.; Bradstreet, E.D.; Hemmingsen, E.A.; Hammel, H.T. Sap pressure in vascular plants. Science 1965, 148, 339–346. [Google Scholar] [CrossRef] [PubMed]
  27. Brooks, M.D.; Niyogi, K.K. Use of a pulse-amplitude modulated chlorophyll fluorometer to study the efficiency of photosynthesis in Arabidopsis plants. In Chloroplast Research in Arabidopsis; Jarvis, R., Ed.; Humana Press: Totowa, NJ, USA, 2011; p. 432. [Google Scholar]
  28. Lichtenthaler, H.K.; Buschmann, C.; Knapp, M. How to correctly determine the different chlorophyll fluorescence parameters and the chlorophyll fluorescence decrease ratio RFd of leaves with the PAM fluorometer. Photosynthetica 2005, 43, 379–393. [Google Scholar] [CrossRef]
  29. Blair, M.W.; Torres, M.M.; Pedraza, F.; Giraldo, M.C.; Buendía, H.F.; Hurtado, N. Development of microsatellite markers for common bean (Phaseolus vulgaris L.) based on screening of non-enriched, small-insert genomic libraries. Genome. 2009, 52, 772–782. [Google Scholar] [CrossRef]
  30. Gaitán-Solís, E.; Duque, M.C.; Edwards, K.J.; Tohme, J. Microsatellite repeats in common bean (Phaseolus vulgaris): Isolation, characterization, and cross-species amplification in Phaseolus ssp. Crop Sci. 2002, 42, 2128–2136. [Google Scholar] [CrossRef]
  31. Blair, M.W.; Torres, M.M.; Giraldo, M.C.; Pedraza, F. Development and diversity of Andean-derived, gene-based microsatellites for common bean (Phaseolus vulgaris L.). BMC Plant Biol. 2009, 9, 100. [Google Scholar] [CrossRef] [Green Version]
  32. Blair, M.W.; Pedraza, F.; Buendia, H.F.; Gaitán-Solís, E.; Beebe, S.E.; Gepts, P.; Tohme, J. Development of a genome-wide anchored microsatellite map for common bean (Phaseolus vulgaris L.). Theor. Appl. Genet. 2003, 107, 1362–1374. [Google Scholar] [CrossRef]
  33. Blair, M.W.; Hurtado, N.; Sharma, P. New gene-derived simple sequence repeat markers for common bean (Phaseolus vulgaris L.). Mol. Ecol. Resour. 2012, 12, 661–668. [Google Scholar] [CrossRef]
  34. Hanai, L.R.; Santini, L.; Camargo, L.E.; Fungaro, M.H.; Gepts, P.; Tsai, S.M.; Vieira, M.L. Extension of the core map of common bean with EST-SSR, RGA, AFLP, and putative functional markers. Mol. Breed 2010, 25, 25–45. [Google Scholar] [CrossRef] [Green Version]
  35. Benchimol, L.L.; de Campos, T.; Carbonell, S.A.M.; Colombo, C.A.; Chioratto, A.F.; Formighieri, E.F.; Gouvêa, L.R.L.; de Souza, A.P. Structure of genetic diversity among common bean (Phaseolus vulgaris L.) varieties of Mesoamerican and Andean origins using new developed microsatellite markers. Genet. Resour. Crop Evol. 2007, 54, 1747–1762. [Google Scholar] [CrossRef]
  36. Vos, P.; Hogers, R.; Bleeker, M.; Reijans, M.; van de Lee, T.; Hornes, M.; Frijters, A.; Pot, J.; Peleman, J.; Kuiper, M. AFLP: A new technique for DNA fingerprinting. Nucleic Acids Res. 1995, 23, 4407–4414. [Google Scholar] [CrossRef] [PubMed] [Green Version]
  37. Šuštar-Vozlič, J.; Maras, M.; Javornik, B.; Meglič, V. Genetic diversity and origin of Slovene common bean (Phaseolus vulgaris L.) germplasm as revealed by AFLP markers and phaseolin analysis. J. Am. Soc. Hortic. Sci. 2006, 131, 242–249. [Google Scholar]
  38. Meng, L.; Li, H.; Zhang, L.; Wang, J. QTL IciMapping: Integrated software for genetic linkage map construction and quantitative trait locus mapping in biparental populations. Crop J. 2015, 3, 269–283. [Google Scholar] [CrossRef] [Green Version]
  39. Galeano, C.H.; Fernandez, A.C.; Franco-Herrera, N.; Cichy, K.A.; McClean, P.E.; Vanderleyden, J.; Blair, M.W. Saturation of an intra-gene pool linkage map: Towards a unified consensus linkage map for fine mapping and synteny analysis in common bean. PLoS ONE 2011, 6, e28135. [Google Scholar] [CrossRef] [Green Version]
  40. Kosambi, D.D. The estimation of map distances from recombination values. Ann Eugen 1943, 12, 172–175. [Google Scholar] [CrossRef]
  41. Wang, S.; Basten, C.J.; Zeng, Z.B. Windows QTL Cartographer 2.5. Department of Statistics, North Carolina State University, Raleigh, North Carolina, 2012. Available online: http://statgen.ncsu.edu/qtlcart/WQTLCart.htm (accessed on 3 February 2020).
  42. Li, S.; Wang, J.; Zhang, L. Inclusive composite interval mapping of QTL by environment interactions in biparental populations. PLoS ONE 2015, 10, e0132414. [Google Scholar] [CrossRef] [Green Version]
  43. Voorips, R.E. MapChart: Software for the Graphical Presentation of Linkage Maps and QTLs. J. Hered. 2002, 93, 77–78. [Google Scholar] [CrossRef] [Green Version]
  44. Sosnowski, O.; Charcosset, A.; Joets, J. BioMercator V3: An upgrade of genetic map compilation and quantitative trait loci meta-analysis algorithms. Bioinformatics 2012, 28, 2082–2083. [Google Scholar] [CrossRef] [Green Version]
  45. Yan, X.L.; Liao, H.; Beebe, S.E.; Blair, M.W.; Lynch, J.P. QTL mapping of root hair and acid exudation traits and their relationship to phosphorus uptake in common bean. Plant Soil 2004, 265, 17–29. [Google Scholar] [CrossRef]
  46. Beebe, S.E.; Rojas-Pierce, M.; Yan, X.L.; Blair, M.W.; Pedraza, F.; Muñoz, F.; Tohme, J.; Lynch, J.P. Quantitative trait loci for root architecture traits correlated with phosphorus acquisition in common bean. Crop Sci. 2006, 46, 413–423. [Google Scholar] [CrossRef]
  47. Pérez-Vega, E.; Pañeda, A.; Rodríguez-Suárez, C.; Campa, A.; Giraldez, R.; Ferreira, J.J. Mapping of QTLs for morpho-agronomic and seed quality traits in a RIL population of common bean (Phaseolus vulgaris L.). Theor. Appl. Genet. 2010, 120, 1367–1380. [Google Scholar] [CrossRef]
  48. Blair, M.W.; Iriarte, G.; Beebe, S. QTL analysis of yield traits in an advanced backcross population derived from a cultivated Andean x wild common bean (Phaseolus vulgaris L.) cross. Theor. Appl. Genet. 2006, 112, 1149–1163. [Google Scholar] [CrossRef] [PubMed]
  49. Pan, L.; Wang, N.; Wu, Z.; Gao, R.; Yu, X.; Zheng, Y.; Xia, Q.; Gui, S.; Chen, C. A high density genetic map derived from RAD sequencing and its application in QTL analysis of yield-related traits in Vigna unguiculata. Front Plant Sci. 2017, 8, 1544. [Google Scholar] [CrossRef] [PubMed] [Green Version]
  50. Valdisser, P.A.M.R.; Pappas, G.J., Jr.; de Menezes, I.P.P.; Müller, B.S.F.; Pereira, W.J.; Narciso, M.G.; Brondani, C.; Souza, T.L.P.O.; Borba, T.C.O.; Vianello, R.P. SNP discovery in common bean by restriction-associated DNA (RAD) sequencing for genetic diversity and population structure analysis. Mol. Genet. Genomics 2016, 291, 1277–1291. [Google Scholar] [PubMed]
  51. Li, J.; Cang, Z.; Jiao, F.; Bai, X.; Zhang, D.; Zhai, R. Influence of drought stress on photosynthetic characteristics and protective enzymes of potato seedling stage. J. Saudi Soc. Agric. Sci. 2017, 16, 82–88. [Google Scholar] [CrossRef] [Green Version]
  52. Santos, M.G.; Ribeiro, R.V.; Machado, E.C.; Pimentel, C. Photosynthetic parameters and leaf water potential of five common bean genotypes under mild water deficit. Biol. Plant 2009, 53, 229–236. [Google Scholar] [CrossRef]
  53. Anyia, A.O.; Herzog, H. Genotypic variability in drought performance and recovery in cowpea under controlled environment. J. Agron. Crop Sci. 2004, 190, 151–159. [Google Scholar] [CrossRef]
  54. Xu, M.; Yamagishi, N.; Zhao, C.; Takeshima, R.; Kasai, M.; Watanabe, S.; Kanazawa, A.; Yoshikawa, N.; Liu, B.; Yamada, T.; et al. Soybean-specific E1 family of floral repressors controls night-break responses through down-regulation of FLOWERING LOCUS T orthologs. Plant Physiol. 2015, 168, 1735–1746. [Google Scholar] [CrossRef] [Green Version]
  55. McKay, J.K.; Richards, J.; Nemali, K.S.; Sen, S.; Mitchell-Olds, T.; Boles, S.; Stahl, E.A.; Wayne, T.; Juenger, T.E. Genetics of drought adaptation in Arabidopsis thaliana II. QTL analysis of a new mapping population, KAS-1 x TSU-1. Evol. Int. J. Org. Evol. 2008, 62, 3014–3026. [Google Scholar] [CrossRef]
  56. Ramirez-Vallejo, P.; Kelly, J.D. Traits related to drought resistance in common bean. Euphytica 1998, 99, 127–136. [Google Scholar] [CrossRef]
  57. Trapp, J.J.; Urrea, C.A.; Cregan, P.B.; Miklas, P.N. Quantitative trait loci for yield under multiple stress and drought conditions in a dry bean population. Crop Sci. 2015, 55, 1596–1607. [Google Scholar] [CrossRef] [Green Version]
Figure 1. Common bean linkage groups Pv01 and Pv02 showing quantitative trait loci (QTLs) for physiology-associated traits (green), phenological traits (black), and yield-associated traits (red) in ‘Tiber’ × ‘Starozagorski’ genetic linkage map detected with single environment analysis. The rest of the linkage groups are presented in Figure S2. For QTL names, see Table 1.
Agronomy 10 00225 g001
Figure 2. QTLs for physiology-associated traits, phenological traits, and yield-associated traits on the integrated genetic map of the ‘Tiber’ × ‘Starozagorski’ recombinant inbred line population and common bean consensus map reported by Galeano et al. [39]. Markers and QTLs from the novel ‘Tiber’ × ‘Starozagorski’ genetic map are marked bold and QTLs are colored red (for QTL names, see Table S1). The suffix in QTL names denotes whether they were detected in single environment analysis (-a, -b) or QTL × environment analysis (-c). For clarity reasons, not all loci names are displayed. QTLs from the consensus map are numbered (see Table S2) and colored gray for clarity reasons; only QTLs relevant for discussion are colored black.
Agronomy 10 00225 g002
Figure 3. Trait distribution in a recombinant inbred line (RIL) population of ‘Tiber’ × ‘Starozagorski’ cross evaluated in greenhouses in Ljubljana in seasons 2013 and 2014. (a) Distribution of leaf water potential (Wp) and the effective quantum yield of photosystem II (PSII, ΦPSII) in watered plants and plants exposed to moderate and severe drought. (b) Distribution of days to flowering (Df), days to pod-setting (Dp), pods per plant (Pp), seeds per pod (Sp), seed yield per plant (Syp), and 100 seed mass (Hsm) in plants that underwent a period of drought. Values for parental genotypes are indicated by triangle symbols (white—‘Tiber’, black—‘Starozagorski’).
Agronomy 10 00225 g003
Table 1. Distribution of simple sequence repeat (SSR) and amplified fragment length polymorphism (AFLP) markers on the genetic map of common bean recombinant inbred line (RIL) population derived from the ‘Tiber’ × ‘Starozagorski’ cross.
LG 1SSRAFLPTotal No. of MarkersTotal Linkage Group Length (cM)Average Distance all Markers
(cM)
Anchor MarkersTotal Linkage Group Length in Consensus Map (cM)
Pv01718149.921.48191.9
Pv0214519221.112.312192.4
Pv0330365.933.03235.8
Pv046612194.417.74228.7
Pv051031356.44.78132.9
Pv06741140.34.06129
Pv07707172.228.76180
Pv081131478.46.07166.1
Pv0914115135.59.77128.2
Pv1013215100.17.19131.9
Pv1151674.214.85163.8
Total97261231288.411.5731880.7
1 Linkage group (‘Pv’ signifies Phaseolus vulgaris). cM: centimorgans.
Table 2. QTL × environment interaction QTLs for leaf water potential (Wp), effective quantum yield of PSII (ΦPSII), days to flowering (Df), days to pod-setting (Dp), number of seeds per pod (Sp), seed yield per plant (Syp), and 100 seed mass (Hsm) in two seasons for drought and control for the common bean RIL mapping population.
TraitQTLTreatment 1LGPositionLeft
Marker
Right
Marker
LOD 2LOD ThresholdLOD
(A) 2
LOD
(AbyE) 2
PVE 3PVE
(A) 3
PVE
(AbyE) 3
Add 4
WpWp5.2Control544AGTC02BMd534.33.42.02.262.819.243.60.0
Wp6.1Control613SSR-IAC47BMb5193.73.40.03.716.70.316.40.0
ΦPSIIΦPSII7.1Severe795BMb502BM1503.33.11.91.59.36.33.00.0
ΦPSII10.1Severe1023BM212BMd423.33.12.01.29.06.62.40.0
ΦPSII11.1Severe110BMd22BM2394.63.13.21.513.711.12.60.1
DfDf1.1 179BMb356ATA313.03.311.02.130.129.11.0−1.1
DpDp1.1 181ATA3BMb10245.93.24.51.413.613.10.5−0.6
SpSp2.1 286BM236BM1564.93.34.40.511.311.30.00.2
SypSyp1.1 178BMb356ATA310.43.40.310.13.31.71.60.1
Syp2.1 24CAAT04BM1393.73.40.92.84.84.30.50.1
Syp4.1 4187CCTA05AGGT073.73.41.91.810.77.82.9−0.2
HsmHsm2.2 253BM142PVBR254.13.33.20.914.210.73.5−2.0
1 Moderate—moderate drought vs. control, severe—severe drought vs. control. 2 Logarithm of odds (LOD) score is presented for additive and dominance effects (LOD(A)) and additive and dominance by environment effects (LOD(AbyE)). 3 Phenotypic variation explained (PVE) is presented as explained by additive and dominance effect (PVE(A)) and by additive and dominance by environment effect (PVE(AbyE)). 4 The sources of additivity (Add) are ‘Tiber’ (+value) and ‘Starozagorski čern’ (−value). QTL also detected in single environment analysis are marked bold.

