Article

Adaptation of Grass Pea (Lathyrus sativus) to Mediterranean Environments

1
Institute for Sustainable Agriculture, CSIC, Avda. Menéndez Pidal s/n, 14004 Córdoba, Spain
2
Faculty of Agriculture, Kafrelsheikh University, Kafr El-Sheikh 33516, Egypt
3
Departamento de Ciencias Agroforestales, E.T.S.I. Campus El Carmen, Universidad de Huelva, Avda. Fuerzas Armadas s/n, 21007 Huelva, Spain
*
Author to whom correspondence should be addressed.
Agronomy 2020, 10(9), 1295; https://doi.org/10.3390/agronomy10091295
Submission received: 28 July 2020 / Revised: 19 August 2020 / Accepted: 26 August 2020 / Published: 1 September 2020

Abstract

:
Grass pea (Lathyrus sativus) is an annual legume crop widely cultivated in South Asia and Sub-Saharan Africa, but in regression in Mediterranean region. Its rusticity and nutritious value is calling back attention for its reintroduction into Mediterranean rain-fed farming systems. We studied the adaptation of a range of breeding lines in multi-environment field testing in Spain and Egypt, showing wide variation for grain yield. Broomrape (Orobanche crenata) infection appeared as the major limiting factor in both countries. Level of broomrape infection was highly influenced by environmental conditions, being favored by moderate temperatures at crop flowering and rain and humidity after flowering. The additive main effects and multiplicative interaction (AMMI) analysis was applied to understand the interaction between genotype (G) and environment (E) on grain yield and on broomrape infection. AMMI analyses revealed significant G and E effects as well as G*E interaction with respect to both traits. The AMMI analysis of variance (ANOVA) revealed that both, yield and broomrape infection were dominated by the environment main effect. AMMI1 biplot for grain yield revealed Ls10 and Ls11 as the accession with highest yields, closely followed by Ls16, Ls18 and Ls19. However, these accessions showed also lower stability, being particularly adapted to Delta Nile conditions. On the contrary, accessions Ls12 and Ls14 were more adapted to rain fed Spanish conditions. Accessions Ls7, Ls1 and Ls3 were the most stable over environments for grain yield.

1. Introduction

Grass pea (Lathyrus sativus L.) is an annual cool season legume grown for human food but also for animal feed and as forage since ancient times in many of the harshest agro-environments of the world [1]. It is still grown in 1.5 Mha, mainly in South Asia and Sub-Saharan Africa, but is in regression in Mediterranean environments. As world demand for legume protein increases, the rusticity of grass pea recalls its potential for cropping systems in marginal environments as those in Mediterranean cropping systems [2,3,4,5,6]. This called for a renewed interest to gather and characterize the adaptation of landraces and to submit them to breeding in order to exploit the potential of the species [7,8,9,10,11].
However, grass pea suffers from a reputation of being toxic, because under certain circumstances its overconsumption has caused neurolathyrism, a neurodegenerative disease in humans and domestic animals, due to its content of the neuroexcitatory β-N-oxalyl-L-α,β-diaminopropionic acid (β-ODAP) [6,12]. This directed most efforts in breeding to the development of cultivars with a low β-ODAP [1,13]. However, the long-term results of these efforts are often questioned [3,4,6,12]. The β-ODAP content is highly influenced by climatic and edaphic conditions and has a strong genotype × environment effect [3,14,15]. It is today understood that the occurrence of the disease can be prevented by addition of sufficient cereals and fruits and vegetables in the diet [6,16]. Moreover, seeds can be partly detoxified by various food processing methods [4,17]. Also, β-ODAP is today looked as a multifunctional plant metabolite with a number of therapeutic potentials [6,12]. All this made breeders reconsider yield stability as a higher concern. Therefore, the objective of this research was to evaluate the performance and stability of yield among grass pea accessions in Mediterranean cropping systems. Yield stability is a complex trait. Its expression depends on factors such as the genotype (G), the environment (E) and G*E interaction. G*E is the most common feature resulting from the differential expression of G over the E which complicate the selection of a genotype for a target trait. This is of most relevant in breeding programs, as large G*E brings about discrepancies between expected and observed responses to selection due to a higher estimation of genetic variances. Under such conditions, stability analysis provides the best solution for the relative performance of G over the E. Genotype-by-Environment (G*E) interactions have already been reported for grain yield of grass pea [8,9,10], thus hampering proper selection. Here we use the multivariate Additive Main Effect and Multiplicative Interaction (AMMI) model [18,19] to give the correct picture of G*E interaction on G. The AMMI model uses analysis of variance (ANOVA) and principal component analysis (PCA) to achieve a better understanding of G*E interaction, its causes and consequences.

2. Materials and Methods

2.1. Plant Material and Experimental Design

Performance of 19 grass pea breeding accession was studied at 7 location–year environments (Table 1). At each location, a randomized complete block design with three replications was used. The experimental unit consisted of 1 m long rows, one per accession, separated 35 cm, 10 plants per row. Sowing took place by middle December each season. Following local practice, Spanish plots were rain-fed, whereas those of Egypt were flood irrigated (4 irrigations of 40 mm each). Weeds were controlled by hand weeding. Number of emerged broomrape plants per row were recorded and referred as number of broomrapes per grass pea plant. Attention was paid to record presence and to quantify naturally occurring pests and disease. The harvest of the plants took place by late April, May, depending on the environment.

2.2. Statistical Analysis

Data for each trait (grain yield and number of broomrapes per plant) were submitted to a combined analysis of variance (ANOVA) with genotype and location-year (environment) as fixed factors using SAS® 9.3 (SAS Institute Inc., Cary, NC, USA). F-ratios were used to test effects for randomized complete block experimental design [20]. Prior to each ANOVA, tests for normality and equality of variance were conducted for each dependent variable. ANOVA analysis to quantify the contribution of genotype, environment and their interaction (G*E) was performed according to the statistical model:
y e g k   =   μ +   E e +   G g +   G E e g +   B k ( e ) +   ε e g k
where yegk was the yield or the number of broomrapes per plant of the k block of the g genotype in the e environment; μ the overall mean of the group of genotypes; Ee the effect of the e environment, Gg the effect contributed by the g genotype; G*Eeg the effect interaction between the g genotype and the e environment; Bk(e) is the replication effect for k at environment e and εegk was the residual error effect.

2.3. AMMI Analysis

AMMI statistical model structure and computational methods were used in the current study as previously described [21,22,23]. The AMMI method combines the traditional analysis of variance for the main effects of G and E as well as the principal component analysis (PCA) with multiplicative parameters which was used for the partition of the G*E interaction into several components [21]. Analyses were made with the SAS® 9.4 (SAS Institute Inc., Cary, NC, USA) [24] to graph AMMI biplots.
The AMMI model [21] is given by:
y g e =   μ +   α g +   β e +   n = 1 N λ n γ g n δ e n +   ε g e
where Yge is either the yield or the number of broomrapes per plant of the g-th genotype in the e-th environment; µ is the grand mean; αg and βe are the genotype and environment deviations from the grand mean, respectively; λn is the eigenvalue of the PCA axis n; γgn and δen are the genotype and environment principal component scores for axis n; N is the number of principal components retained in the model; and εge is the residual term.
A simple protocol for using AMMI effectively was used here according to Gauch [22]. This protocol includes four steps: (1) analysis of variance, (2) model diagnosis, (3) mega-environment delineation, and (4) agricultural recommendations.
(1) Analysis of variance: the sums of squares (SS) for genotypes (G), G*E signal (GEs), and G*E noise (GEN) provide a preliminary indication whether AMMI analysis will be worthwhile. AMMI analysis is appropriate for datasets having substantial G and substantial GEs [22]. To estimate the SS for GEN we multiplied the error mean square from replication by the number of degrees of freedom (df) for G*E. Also we obtained GES by subtracting GEN from G*E. According to the high SS values of G and GES, the AMMI model was employed to study the GEI of grass pea yield and number of broomrapes per plant.
(2) Model diagnosis: AMMI constitutes a model family, not a single model. Consequently, model diagnosis was required to determine which member of this model family was the best for a given dataset and research purpose [22]. Malik et al. [25] proposed resampling-based methods for multi-environment trial data with replicates, which are free from distributional assumptions. The R code for the proposed method [25] was used. The p values of the resampling-based tests were derived using B = 5000 bootstrap samples.
(3) Mega-environment delineation: we obtained a ranking table showing the ranks for the accessions in each environment. Mega-environments can be displayed by this table [22]. In order to characterize testing sites in terms of environmental factors which would possibly support the AMMI analysis results, a Non-Metric Multidimensional Scaling (NMDS) ordination [26] was performed. Climate data for each location [maximum, minimum and average temperature, maximum, minimum and average humidity, evapotranspiration and accumulated rain during pre-flowering, at flowering and post-flowering period, also during the growing season] were obtained from the Red Andaluza de Estaciones Meteorológicas (https://www.juntadeandalucia.es/agriculturaypesca/ifapa/riaweb/web/estaciones) for Spanish locations, and from Metrological Station, Rice Research and Training Center, ARC, Sakha, for Egyptian ones.
(4) Drawing recommendations on best accessions: the goal of yield-trial research is the identification of the best performing genotypes [22]. For this purpose, we used AMMI1 biplot graphs, in which the displacements along the abscissa indicate differences in main (additive) effects whereas; displacements along the ordinate indicate differences in the interaction effects. This was complemented with the rankings of the best accessions per environment in terms of yield and broomrape infection estimated by AMMI1.

3. Results

Results showed the impact of the environment on the yield and broomrape infection on grass pea accessions. Grain yields of the accessions for each environment are shown in Table 2. Global average for grain yield over environments and accessions was 1883 kg ha−1. Average yield over environments was highest for Ls10 (2762 kg ha−1) and lowest for Ls12 (1368 kg ha−1). Average yield over accessions was highest at TOM09 (4103 kg ha−1) and lowest at CAMP09 (407 kg ha−1).
No significant levels of infection of insect pests and fungal diseases were noticed at any site. However, high infection by broomrape infection was recorded in most sites (Table 3). Global average of broomrape infection over accessions and environments was 0.98 broomrapes per grass pea plant. Average infection over accessions was lowest at TOM09 and highest at KAFR08 (0.04 and 1.91 broomrapes per plant, respectively). Average infection over environments was lowest on Ls3 and highest on Ls6 (0.31 and 1.69 broomrapes per plant, respectively).
The combined analysis of variance for grain yield and number of broomrapes per plantrevealed that all main effects (environments (E), genotypes (G) and G*E interaction) were statistically significant (Table 4 and Table 5). Environment was the most important factor for both traits (Table 4 and Table 5), retaining more than a half of the variance contribution while, G and G*E showed similar contribution. Environment explained for 76% of the total variation (G + E + G*E sum of squares (SS)) for yield, whereas G and G*E accounted for 9% and 15%, respectively (Table 4). For number of broomrapes per plant, E, G and G*E accounted for 60%, 17% and 23%, respectively (Table 5).
Table 4 and Table 5 also show the degrees of freedom (DF) for the two first principal components of interaction (IPCAs) assigned according to the method of Gollob [27]. In Table 4, the SS for G is 68,746,582, for GEN = 108 × 476,515 = 51,463,620, and for GES = 113,679,415 − 51,463,620 = 62,215,795. In Table 5, the SS for G is 48, for GEN = 108 × 0.15 = 16.2, and for GES = 64 − 16.2 = 47.8. In both cases, the GES was as large as the SS of G. Therefore, AMMI analysis was quite likely to be used worthwhile [13].

3.1. Model Diagnosis

According to Malik et al. [25] it is crucial to decide how many significant multiplicative interaction terms to retain. They propose resampling-based methods for multi-environment trial data with replicates, which are free from the distributional assumptions. The p values of the resampling-based tests were derived using B = 5000 bootstrap samples. For yield and K + 1 = 1 the test statistic was of 0.2296693 and a p-value of 0.0000 whereas, for k + 1 = 2 the test statistic was of 0.04037152 and a p-value of 0.5420. For the number of broomrapes per plant and K + 1 = 1 the test statistic was of 0.4515335 and a p-value of 0.0000 whereas, for k + 1 = 2 the test statistic was of 0.04538442 and a p-value of 0.490. For both traits, the resampling-based methods resulted in the same number of significant multiplicative terms. This test suggested that an AMMI model with only one multiplicative term was appropriate for the grass pea dataset. Therefore, the most precise model was the AMMI1.
Correlation coefficients can be calculated between IPCA scores and various genetic or environmental measurements to discern causal factors. For grain yield environmental IPCA1 was positive significantly correlated with evapotranspiration and minimum humidity (r2 = 0.87, p < 0.01 and r2 = 0.93, p < 0.01, respectively), and maximum temperature in pre-flowering (r2 = 0.90, p < 0.01). It was also negative significantly correlated to the maximum humidity in growing season (r2 = −0.83, p < 0.01). For the number of broomrapes per plant environmental IPCA1 was positive significantly correlated to the growing season evapotranspiration and minimum humidity (r2 = 0.97, p < 0.01 and r2 = 0.88, p < 0.01, respectively), and maximum temperature in pre-flowering (r2 = 0.89, p < 0.01) and it also was negative significantly correlated to the maximum humidity in growing season (r2 = −0.88, p < 0.01) and minimum temperature in flowering (r2 = −0.82, p < 0.01). These results are in agreement with NMDS (Figure 1 and Figure 2) and with the Principal Components analysis with climatic parameters (not shown).

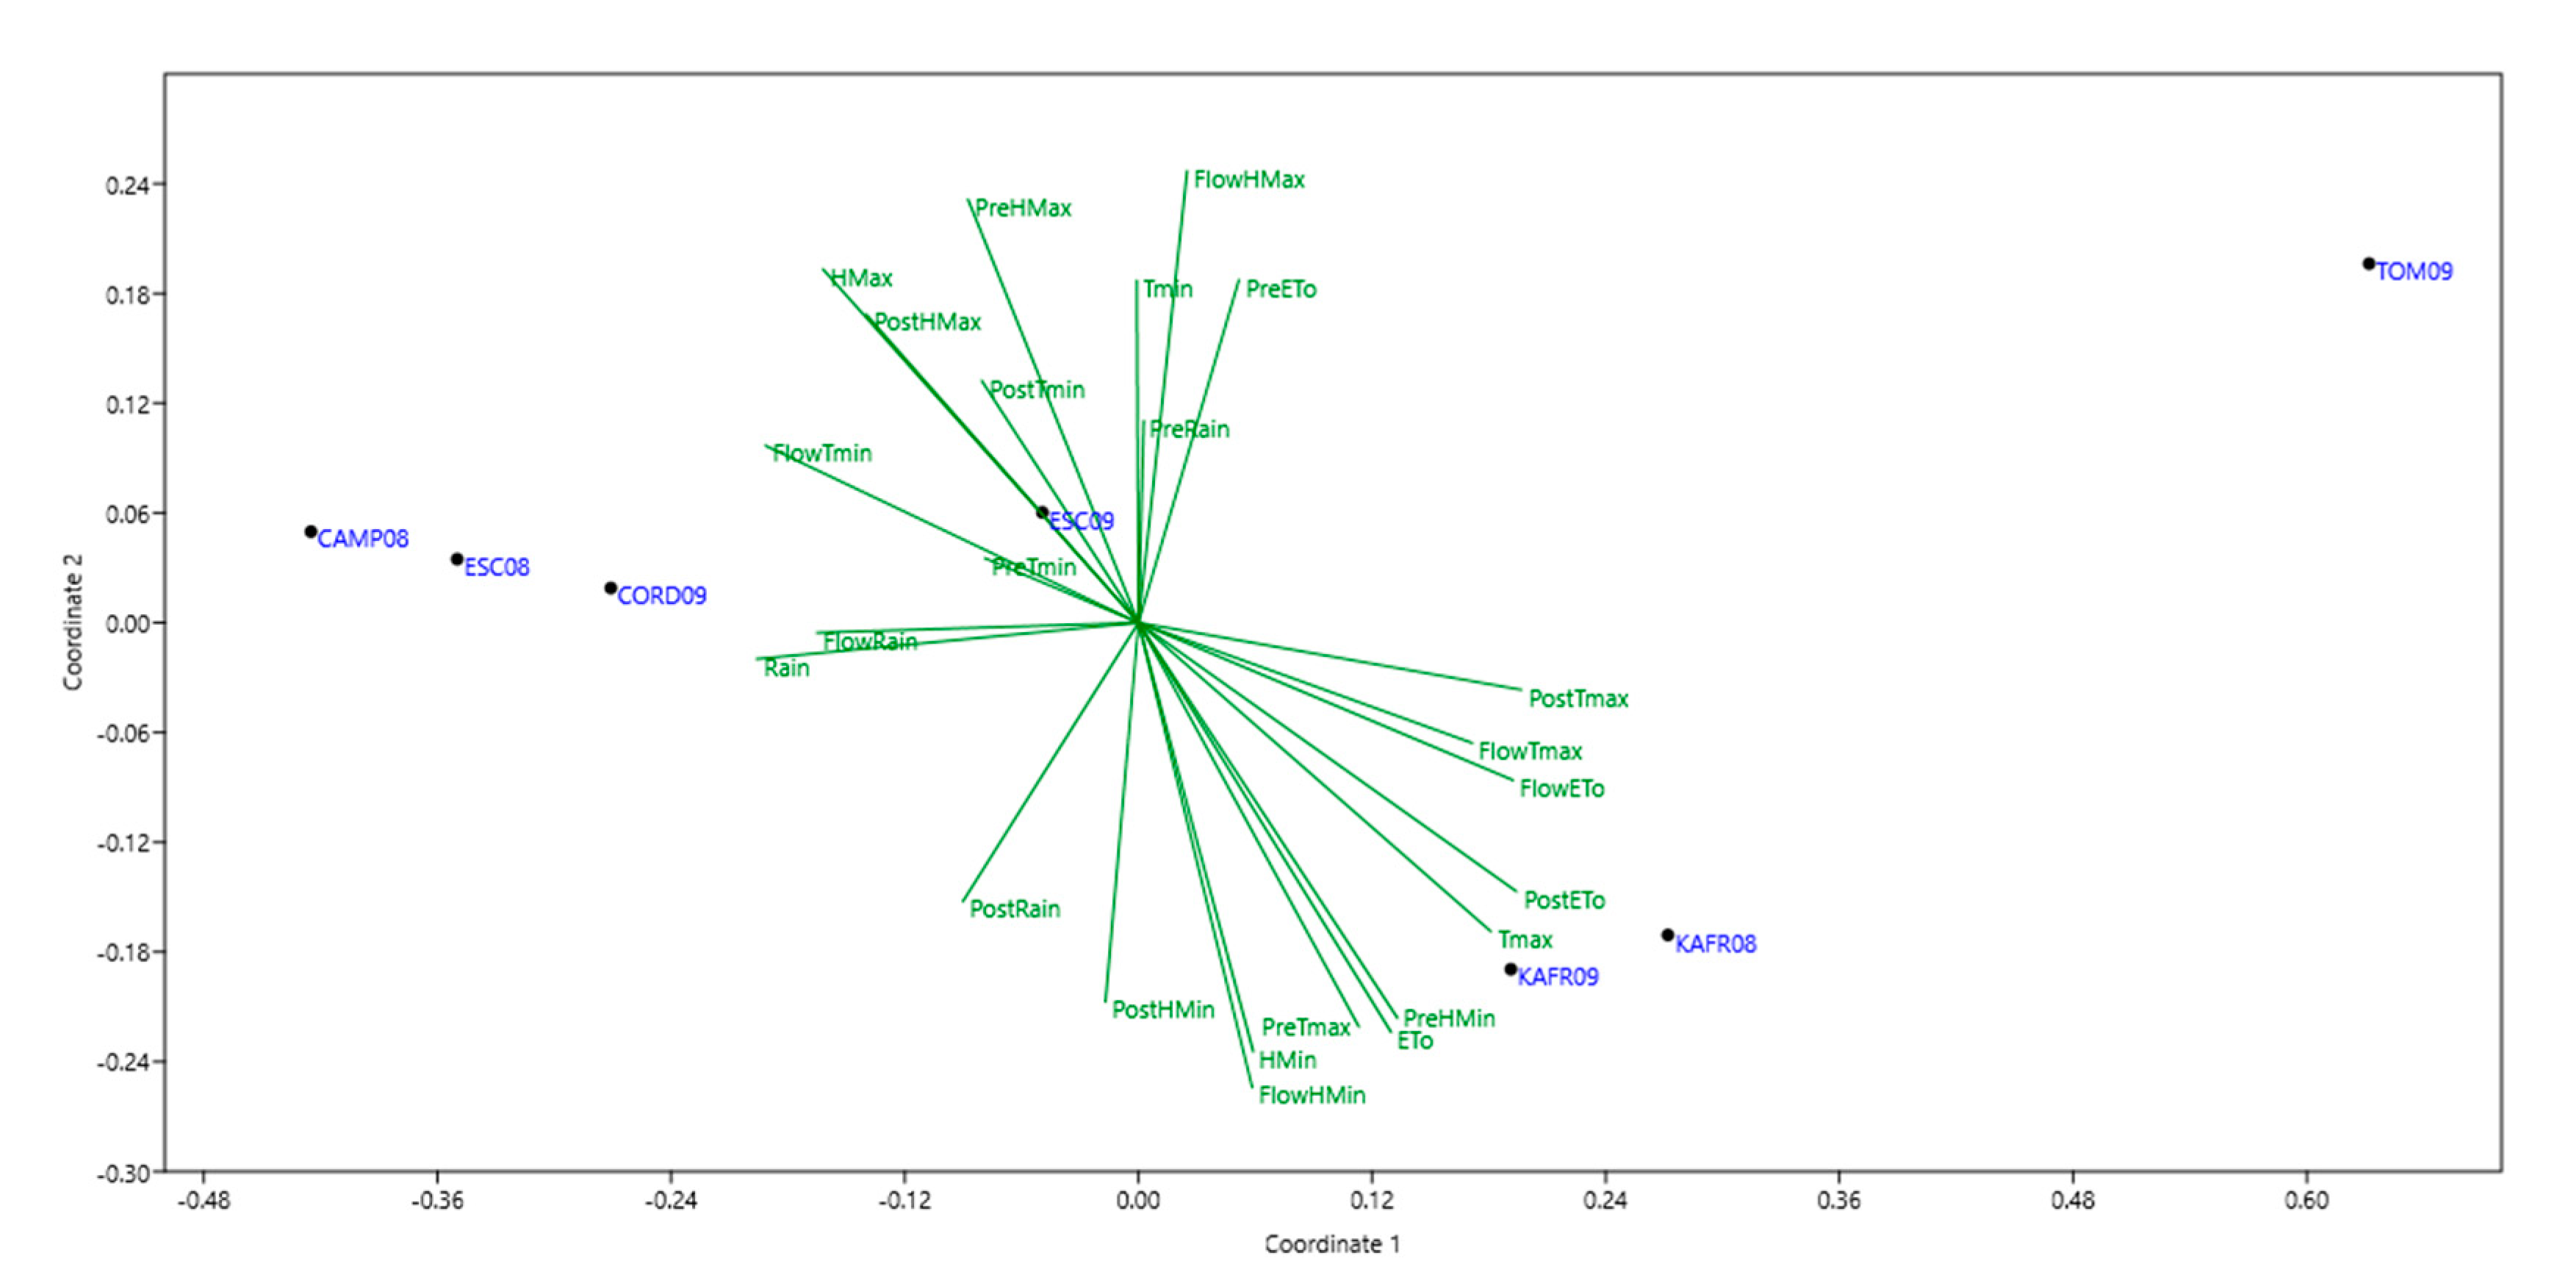
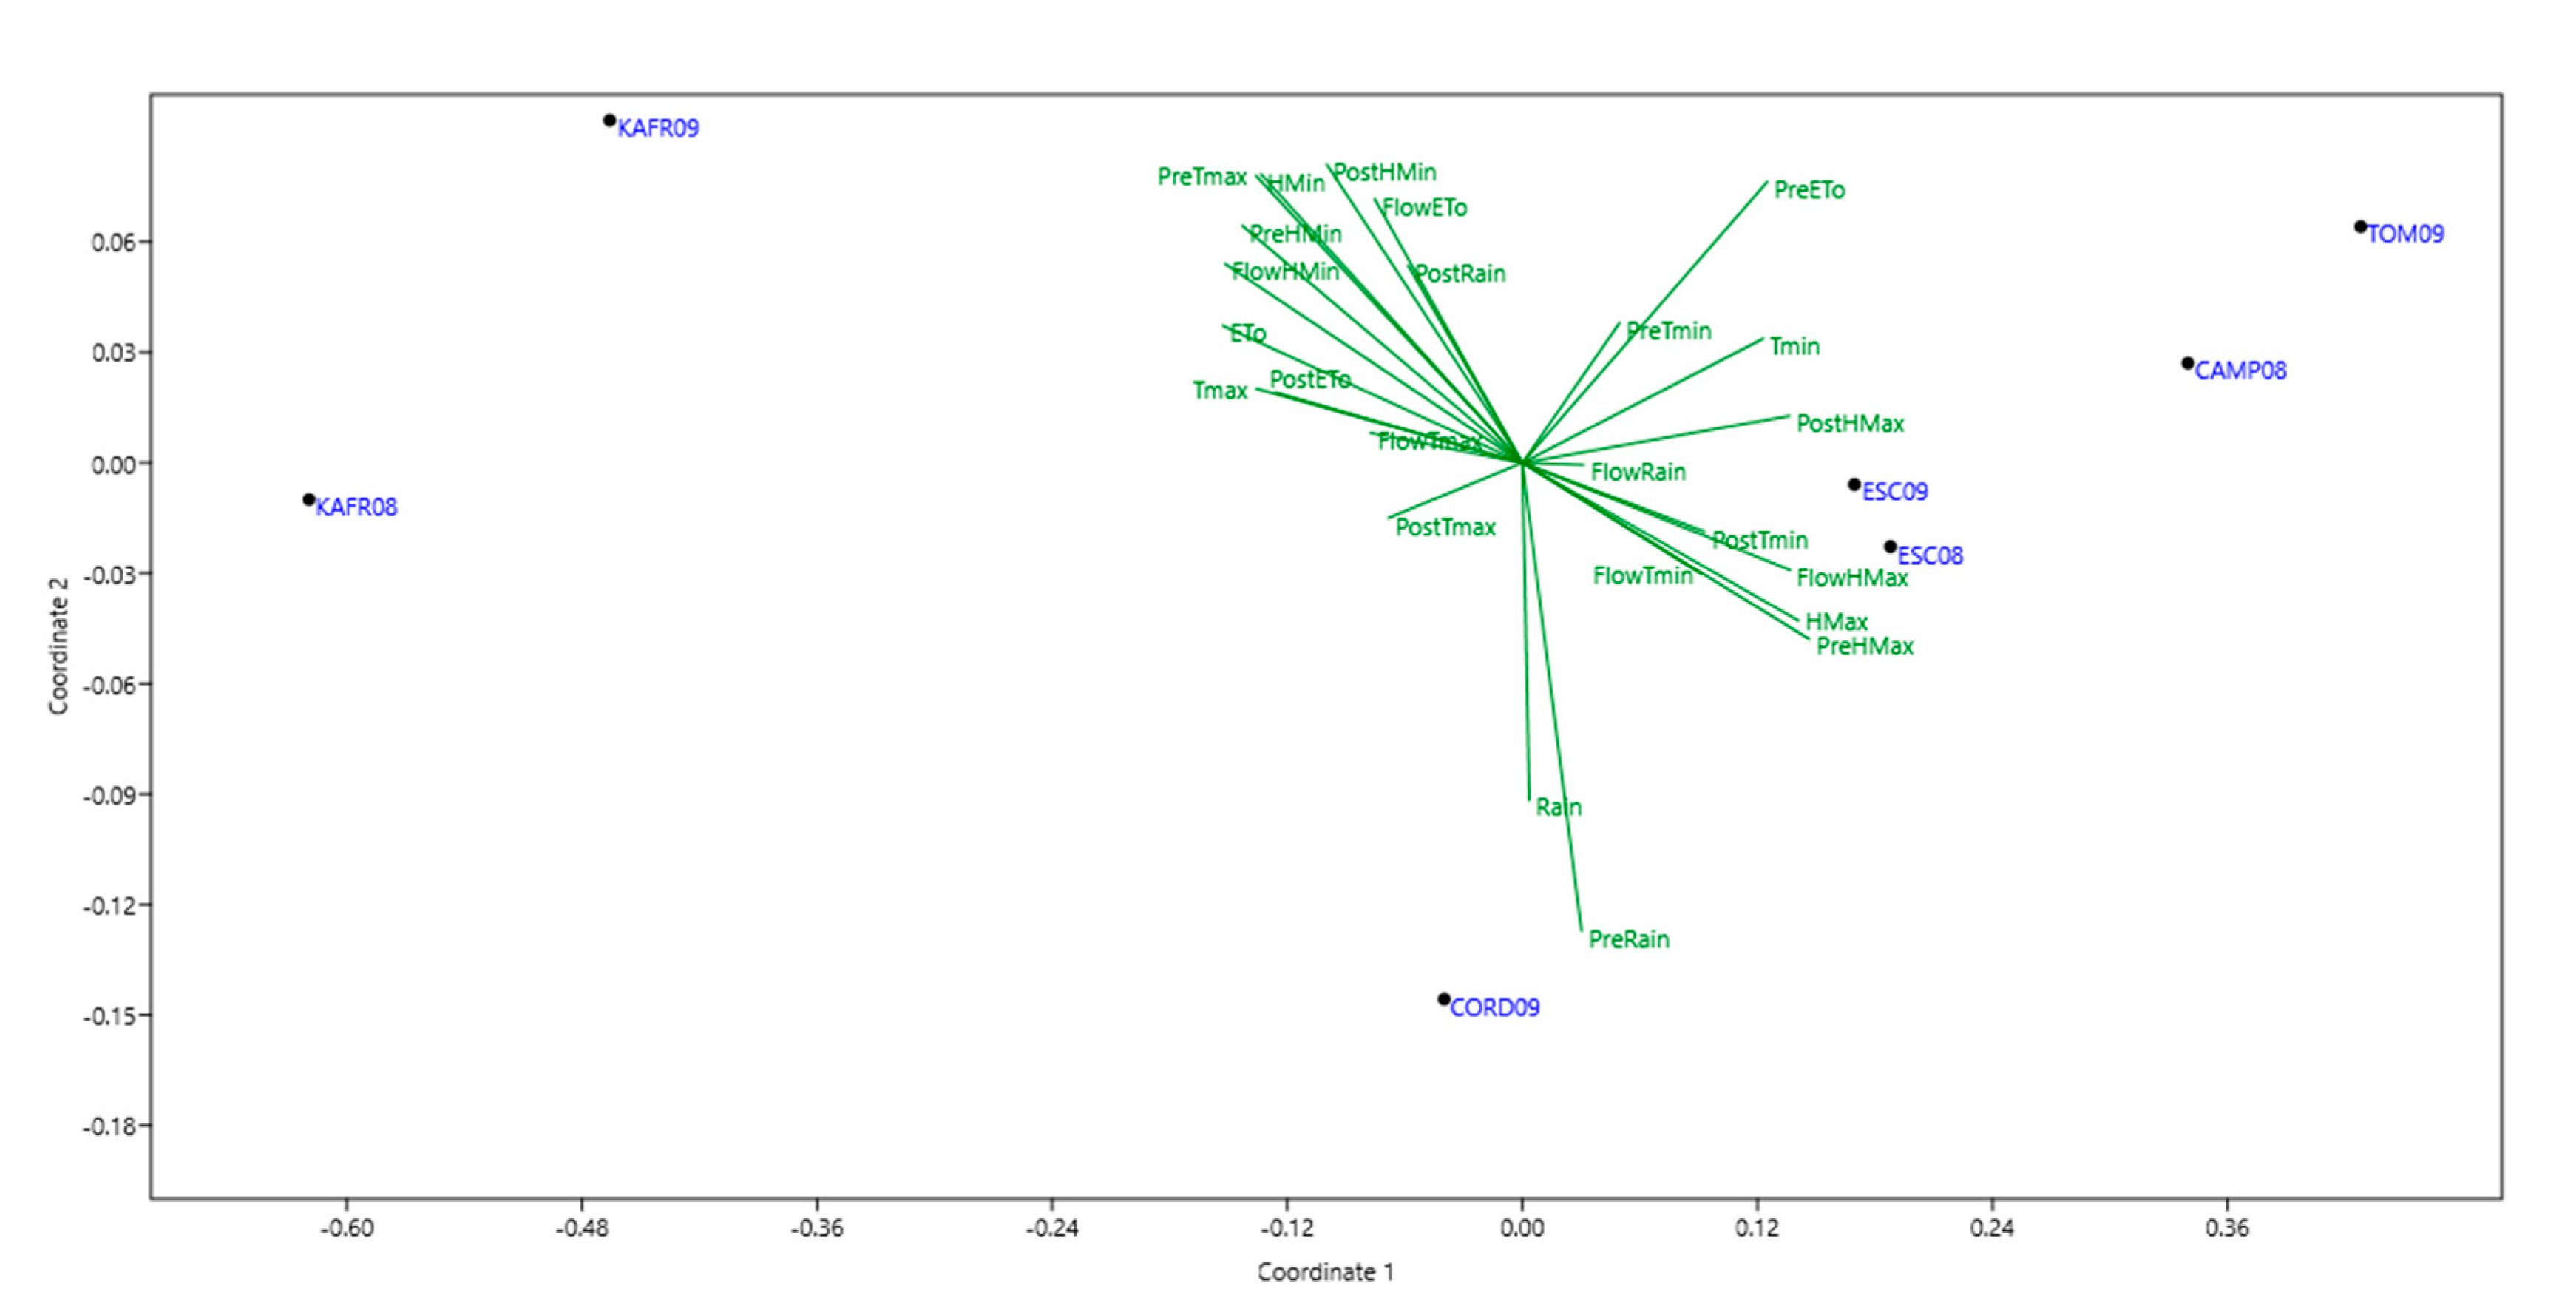
3.2. Mega-Environments (MEs) Delineation and Description

In the next step of our analysis, we employed the most precise AMMI model to determine the existence of mega-environments [22]. Table 6 is a ranking table listing the top 6 accessions in each of the 7 environments according to AMMI1. This model is of particular interest because is suitable for mega-environment delineation [22]. In our case, AMMI1 is also the model which optimizes predictive accuracy according to the resampling-based method [25]. According to AMMI1 analysis, accessions Ls10 and Ls11 were ranked winner for grain yield in most locations (Group 1, sites suffering from broomrape infestation), whereas accessions Ls8 and Ls13 were the winners for this trait in TOM09 (Group 2, the only site with little broomrape). Different cultivars were winners in the case of the number of broomrapes per plant, being Ls3 and Ls1 in the first rank positions (lowest infection) for most environments, with no groups detected.

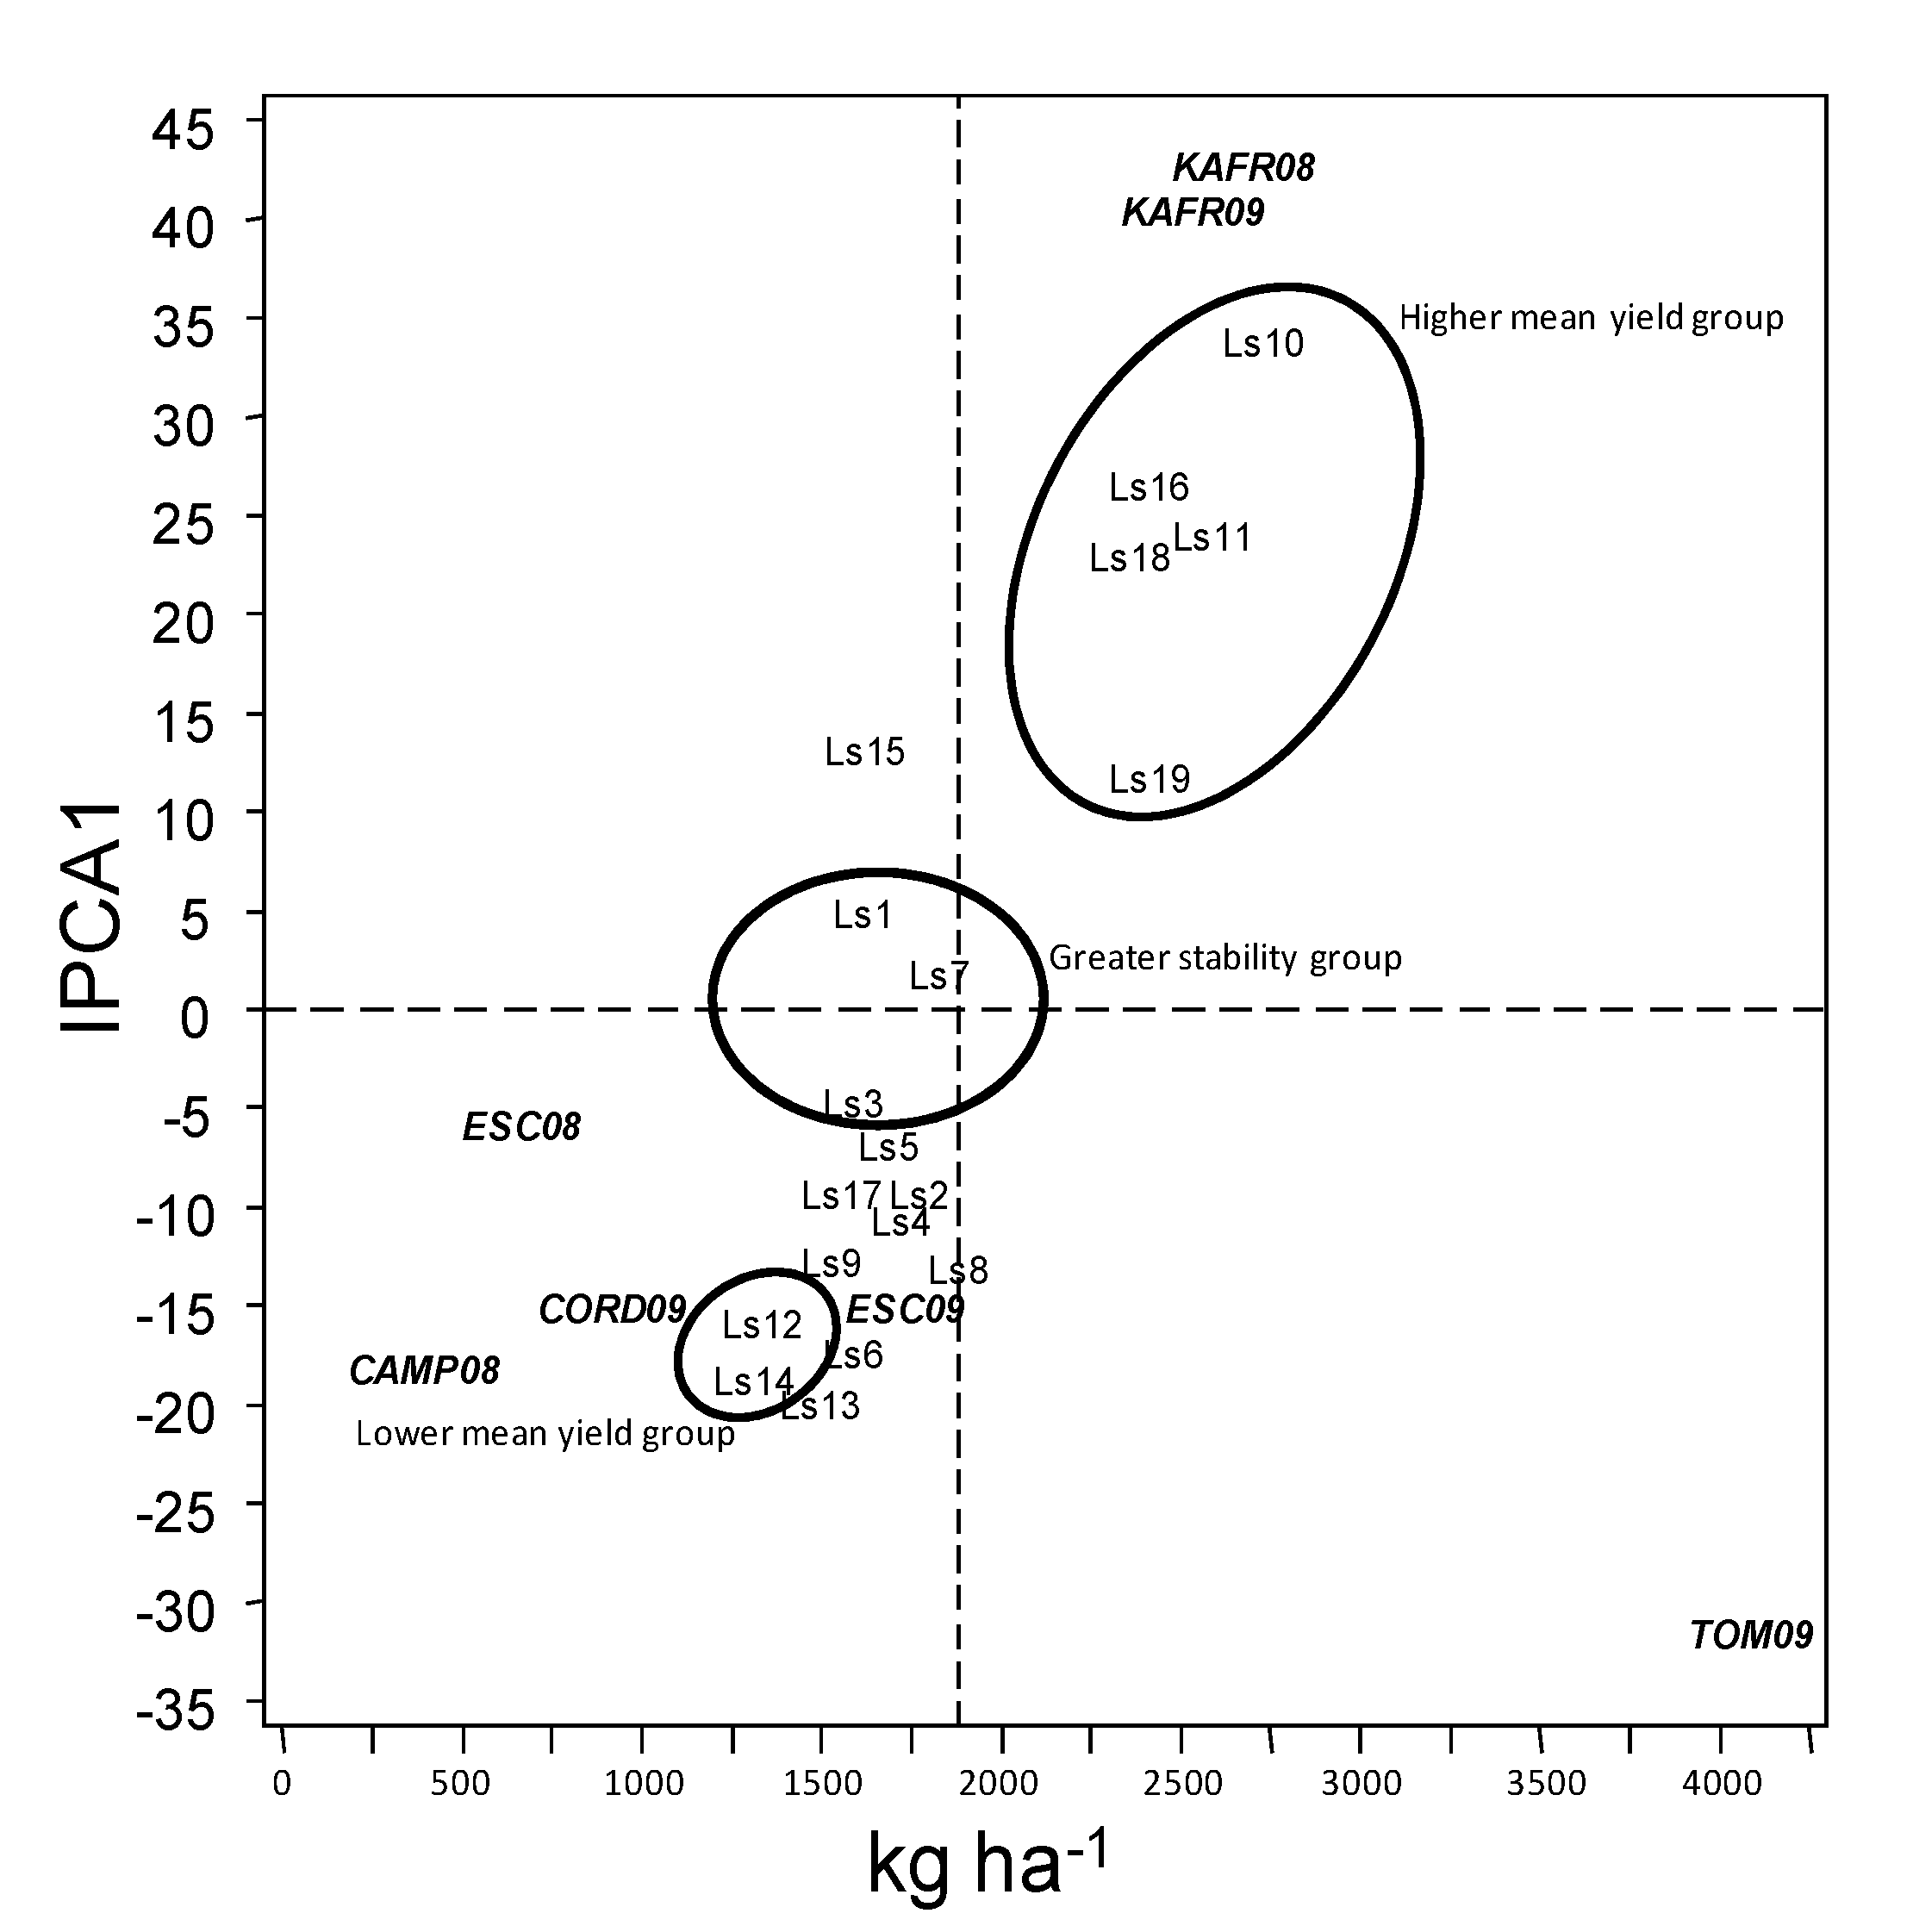
3.3. Selection or Recommendation of the Best Accessions

Accessions falling almost on a horizontal line in the AMMI1 biplot (Figure 3) have similar interaction pattern lines or environments. For instance, accessions Ls8 and Ls9 were clearly observed from the biplot for similar interaction patterns. Similarly, environments KAFR08 and KFR09 showed similar interaction patterns. On the other hand, accession or environments appearing almost on the vertical line have similar means. For instance, accessions Ls19, Ls18 and Ls16 are shown by the biplot having similar means above general mean of the trial. Also, accession or environment on the right side of the midpoint on the vertical lines have higher mean yield than those on the left side. As a result, it is quite evident from the biplot (Figure 3) that accessions with highest yield were Ls10 and Ls11, followed close by Ls16, Ls18 and Ls19. In contrast, Ls12 and Ls14 were those with lowest yield.
Environments on the right hand side of the midpoint of the main effect axis suggested that these environments were more favorable for yield (TOM09, KAFR08 and KAFR09), whereas those to the left (CAMP08, ESC08 and CORD09) were less favorable. Likewise, lines or environments with IPCA1 scores of zero or near zero (either positive or negative) have small interactions and show greater stability and adaptation over the test environment. On the contrary, a large IPCA1 scores indicate high interaction effect and reflect adaptation to specific environments. In this present case, ESC08 was the environment with lowest IPCA1 scores whereas KAFR08, KAFR09 and TOM09 were those with highest scores, therefore there were accessions specifically adapted to these environments.
Accessions Ls7, Ls1 and Ls3 recorded the lowest IPCA1 scores and showed small interactions (close to vertical axis). On the contrary, accessions Ls18, Ls16, Ls11 and Ls10 recorded the highest IPCA1 score. This implied that high interaction effect of lines had specific stability and adaptations to particular environments.
The stability of responses to broomrape can be seen in the AMMI1 biplot (Figure 4). Accessions Ls6, Ls19, Ls12, Ls17 and Ls14 interacted positively with KAFR08 and KAFR09 (all in the right upper corner of the biplot), indicating that they are best suited for these environments, but negatively with the remaining environments. Similarly, accessions Ls3, Ls1, Ls18, Ls7 and Ls10 interacted positively with CAMP08, ESC08, ESC09, and CORD09 (all in the left down corner), but negatively with KAFR08 and KAFR09. The group of lines Ls11, Ls15, Ls4 and Ls5 and the group of lines Ls9, Ls16, Ls2 and Ls13 have low interaction and hence stable over environments.
With the help of the rankings shown in Table 6 we can recommend for broomrape infection Ls3, Ls1 and Ls18 in spite of their low value in Figure 4, showing that they are better adapted to Egyptian than to Spanish locations. The most interesting accessions would be those with high yield and low broomrape infection, particularly Ls10, Ls11 and Ls18.

4. Discussion

Common experience in Mediterranean countries is a severe decrease in grass pea cultivation during the last 50 years, with little or negligible trade. However, farmers share an appreciation on derived food products and show interest in the crop, provided that better adapted cultivars are made available. As a highly nutritive food/feed crop and its high drought tolerance with minimal input requirements for its cultivation, grass pea provides food and nutrition security to many low-income communities.
Great morphological variation is reported in grass pea, showing a clear grouping in two major types, one covering blue flower and colored seeds, and other white flowers and seeds [28]. The first group is typical of Indian subcontinent whereas the second has more western distribution. Our Ls accessions correspond to the first group, whereas Ls19 has larger and whiter seeds, the type preferred by Mediterranean consumers. Mediterranean accessions are regarded also to have lower content of β-ODAP [13], although we did not assess this trait. The β-ODAP content is highly influenced by climatic and edaphic conditions and has a strong G*E effect [3,14,15]. This, together with the current understanding that the disease is caused only when there is overconsumption of grass pea in a non-balanced diet, made breeders reconsider yield stability as a higher concern. We therefore focused in this study on adaptation of current breeding lines to different farming systems in the Mediterranean Basin, identifying the more productive for each of the studies locations and the more stable ones. AMMI1 biplot (Figure 3) allowed identification of the accessions better adapted to Delta Nile conditions (Ls10, Ls11, Ls16, Ls18 and Ls19) and to rain fed Spanish conditions (Ls12 and Ls14) as well as those most stable over environments (Ls7, Ls1 and Ls3).
We also paid attention to other factors potentially affecting yield, such as pests and diseases. Grass pea has been reported to be affected by a number of pests and diseases, including aphid, weevil, rust, powdery mildew or fusarium wilt [6,29]. However, in Mediterranean regions, the weedy root parasite crenate broomrape is regarded as a major constraint for grass pea cultivation [30]. Our current results confirm this, as we did not identify any other pest or disease at worrying levels in any of the locations. Grass pea appears as very sensitive crop to broomrape infection, suffering higher yield penalty than pea or faba bean [31], with 100% reduction at severities higher than four parasites per plant. In addition to the host, infection severity of broomrape strongly depends on parasitic seedbank density and on environmental factors such as temperature and rain. Level of broomrape infection was favored by moderate temperatures and high humidity at crop flowering (Figure 2), what coincides with broomrape seed germination and establishment, and by higher pluviometry after crop flowering, what coincides with broomrape development and emergence. Temperature effects have already been reported, with cool winters acknowledged to reduce infection [32,33,34]. Water availability is indeed acknowledged as an important factor for broomrape development [32,33,35]. Small levels of resistance have been reported in grass pea [20] which would be the result of a combination of different escape and resistance mechanisms, acting each one at different phases of the infection process as is the case in most crops [36]. AMMI1 biplot (Figure 4) allowed the identification of accessions performing better in Egypt (Ls6, Ls12, Ls14, Ls17and Ls19), those performing better in Spain (Ls1, Ls3, Ls7, Ls10 and Ls18) and those stable over environments ((Ls2, Ls4, Ls5, Ls9, Ls11, Ls13, Ls15 and Ls16). The most interesting accessions would be those with high yield and low broomrape infection (Table 6), particularly Ls10, Ls11 and Ls18. Availability of accessions with high and stable yield offers hope for the reintroduction of the crop in Mediterranean conditions.

Author Contributions

D.R., A.A.E. and late A. Moral designed and performed the trials; D.R. and F.F. analyzed the data and wrote the manuscript. All authors have read and agreed to the published version of the manuscript.

Funding

This research was funded by the Spanish Agencia Estatal de Investigación (AEI) grant AGL2017-82019 to finalize the data analysis.

Acknowledgments

Authors are deeply indebted to late Anita Moral whose enthusiasm inspired these studies. ICARDA is acknowledged for providing the Sel-number accessions studied.

Conflicts of Interest

The authors declare no conflict of interest.

References

  1. Almeida, N.F.; Leitão, S.T.; Krezdorn, N.; Rotter, B.; Winter, P.; Rubiales, D.; Vaz Patto, M.C. Allelic diversity in the transcriptomes of contrasting rust-infected genotypes of Lathyrus sativus, a lasting resource for smart breeding. BMC Plant Biol. 2014, 14, 376. [Google Scholar] [CrossRef] [PubMed] [Green Version]
  2. Vaz Patto, M.C.; Skiba, B.; Pang, E.C.K.; Ochatt, S.J.; Lambein, F.; Rubiales, D. Lathyrus improvement for resistance against biotic and abiotic stresses: From classical breeding to marker assisted selection. Euphytica 2006, 147, 133–147. [Google Scholar] [CrossRef]
  3. Girma, D.; Korbu, L. Genetic improvement of grass pea (Lathyrus sativus) in Ethiopia: An unfulfilled promise. Plant Breed. 2012, 131, 231–236. [Google Scholar] [CrossRef]
  4. Kumar, S.; Bejiga, G.; Ahmed, S.; Nakkoul, H.; Sarker, A. Genetic improvement of grass pea for low neurotoxin (B-ODAP) content. Food Chem. Toxicol. 2011, 3, 589–600. [Google Scholar] [CrossRef] [PubMed]
  5. Gonςalves, L.; Rubiales, D.; Vaz Patto, M.C. Grass pea prospective at the Mediterranean Basin. Legume Perspect. 2015, 10, 8–9. [Google Scholar]
  6. Lambein, F.; Travella, S.; Kuo, Y.; Van Montagu, M.; Heidje, M. Grass pea (Lathyrus sativus L.): Orphan crop, nutraceutical or just plain food? Planta 2019, 250, 821–838. [Google Scholar] [CrossRef] [Green Version]
  7. De-la-Rosa, L.; Martí, I. Morphological characterization of Spanish genetic resources of Lathyrus sativus L. Lathyrus Lathyrism Newsl. 2001, 2, 31–34. [Google Scholar]
  8. Tavoletti, S.; Iommarini, L.; Crinò, P.; Granati, E. Collection and evaluation of grass pea (Lathyrus sativus L.) germplasm of central Italy. Plant Breed. 2005, 124, 388–391. [Google Scholar] [CrossRef]
  9. Piergiovanni, A.R.; Lupo, F.; Zaccardelli, M. Environmental effect on yield, composition and technological seed traits of some Italian ecotypes of grass pea (Lathyrus sativus L.). J. Sci. Food Agric. 2011, 91, 122–129. [Google Scholar] [CrossRef]
  10. Grela, E.R.; Rybiński, W.; Matras, J.; Sobolewska, S. Variability of phenotypic and morphological characteristics of some Lathyrus sativus L. and Lathyrus cicera L. accessions and nutritional traits of their seeds. Genet. Resour. Crop Evol. 2012, 59, 1687–1703. [Google Scholar] [CrossRef] [Green Version]
  11. Aci, M.M.; Lupini, A.; Badagliacca, G.; Mauceri, A.; Lo Presti, E.; Preiti, G. Genetic diversity among Lathyrus ssp. based on agronomic traits and molecular markers. Agronomy 2020, 10, 1182. [Google Scholar] [CrossRef]
  12. Dixit, G.P.; Parihar, A.K.; Bohra, A.; Singh, N.P. Achievements and prospects of grass pea (Lathyrus sativus L.) improvement for sustainable food production. Crop J. 2016, 4, 407–416. [Google Scholar] [CrossRef] [Green Version]
  13. Hillocks, R.J.; Maruthi, M.N. Grass pea (Lathyrus sativus): Is there a case for further crop improvement? Euphytica 2012, 186, 647–654. [Google Scholar] [CrossRef]
  14. Fikre, A.; Negwo, T.; Kuo, Y.H.; Lambein, F.; Ahmed, S. Climatic, edaphic and altitudinal factors affecting yield and toxicity of Lathyrus sativus grown at five locations in Ethiopia. Food Chem. Toxicol. 2011, 49, 623–630. [Google Scholar] [CrossRef] [PubMed]
  15. Jiao, C.J.; Jiang, J.L.; Ke, L.M.; Cheng, W.; Li, F.M.; Li, Z.X.; Wang, C.Y. Factors affecting beta-ODAP content in Lathyrus sativus and their possible physiological mechanisms. Food Chem. Toxicol. 2011, 49, 543–549. [Google Scholar] [CrossRef]
  16. Getahun, H.; Lambein, F.; Vanhoorne, M.; Van der Stuyft, P. Food-aid cereals to reduce neurolathyrism related to grass-pea preparations during famine. Lancet 2003, 362, 1808–1810. [Google Scholar] [CrossRef]
  17. Buta, M.B.; Emire, S.A.; Posten, C.; André, S.; Greiner, R. Reduction of β-ODAP and IP6 contents in Lathyrus sativus L. seed by high hydrostatic pressure. Food Res. Int. 2019, 120, 73–82. [Google Scholar] [CrossRef]
  18. Gauch, H.G. Model selection and validation for yield trials with interaction. Biometrics 1988, 88, 705–715. [Google Scholar] [CrossRef]
  19. Flores, F.; Moreno, M.T.; Cubero, J.I. A comparison of univariate and multivariate methods to analyze G*E interaction. Field Crops Res. 1998, 56, 271–286. [Google Scholar] [CrossRef]
  20. McIntosh, M.S. Analysis of combined experiments. Agron. J. 1983, 75, 153–155. [Google Scholar] [CrossRef]
  21. Zobel, R.W.; Wright, M.J.; Gauch, H.G. Statistical analysis of a yield trial. Agron. J. 1988, 80, 388–393. [Google Scholar] [CrossRef]
  22. Gauch, H.G. A simple protocol for AMMI analysis of yield trials. Crop Sci. 2013, 53, 1860–1869. [Google Scholar] [CrossRef]
  23. Iglesias-García, R.; Prats, E.; Flores, F.; Amri, M.; Mikic, A.; Rubiales, D. Assessment of field pea (Pisum sativum L.) grain yield, aerial biomass and flowering date stability in Mediterranean environments. Crop Past. Sci. 2017, 68, 915–923. [Google Scholar] [CrossRef] [Green Version]
  24. Burgueño, J.; Crossa, J.; Vargas, M. SAS Programs for Graphing GE and GGE Biplots; Biometrics and Statistics Unit, CIMMYT, Int.: México City, Mexico, 2003. [Google Scholar]
  25. Malik, W.A.; Forkman, J.; Piepho, H.P. Testing multiplicative terms in AMMI and GGE models for multienvironment trials with replicates. Theor. App. Gen. 2019, 132, 2087. [Google Scholar] [CrossRef] [PubMed]
  26. Anderson, M.J. A new method for non-parametric multivariate analysis of variance. Austral. Ecol. 2001, 26, 32–46. [Google Scholar]
  27. Gollob, H.F. A statistical model which combines features of factor analytic and analysis of variance techniques. Psychometrika 1968, 33, 73–115. [Google Scholar] [CrossRef]
  28. Hanbury, C.D.; Siddique, K.H.M.; Galwey, N.W.; Cocks, P.S. Genotype-environment interaction for seed yield and ODAP concentration of Lathyrus sativus L. and L. cicera L. in Mediterranean type environments. Euphytica 1999, 110, 45–60. [Google Scholar] [CrossRef]
  29. Vaz Patto, M.C.; Rubiales, D. Lathyrus diversity: Available resources with relevance to crop improvement. Ann. Bot. 2014, 113, 895–908. [Google Scholar] [CrossRef] [Green Version]
  30. Fernández-Aparicio, M.; Flores, F.; Rubiales, D. Escape and true resistance to crenate broomrape (Orobanche crenata Forsk.) in grass pea (Lathyrus sativus L.) germplasm. Field Crops Res. 2011, 125, 92–97. [Google Scholar] [CrossRef]
  31. Fernández-Aparicio, M.; Flores, F.; Rubiales, D. The effect of Orobanche crenata infection severity in faba bean, field pea, and grass pea productivity. Front. Plant Sci. 2016, 7, 1409. [Google Scholar] [CrossRef] [Green Version]
  32. Rubiales, D.; Alcántara, C.; Pérez-de-Luque, A.; Gil, J.; Sillero, J.C. Infection of chickpea (Cicer arietinum) by crenate broomrape (Orobanche crenata) as influenced by sowing date and weather conditions. Agronomie 2003, 23, 359–362. [Google Scholar] [CrossRef]
  33. Rubiales, D.; Pérez-de-Luque, A.; Cubero, J.I.; Sillero, J.C. Crenate broomrape (Orobanche crenata) infection in field pea cultivars. Crop Prot. 2003, 22, 865–872. [Google Scholar] [CrossRef]
  34. Pérez-de-Luque, A.; Flores, F.; Rubiales, D. Differences in crenate broomrape parasitism dynamics on three legume crops using a Thermal Time Model. Front. Plant Sci. 2016, 7, 1910. [Google Scholar] [CrossRef] [PubMed] [Green Version]
  35. Pérez-de-Luque, A.; Sillero, J.C.; Moral, A.; Cubero, J.I.; Rubiales, D. Effect of sowing date and host resistance on the establishment of Orobanche crenata in faba bean and common vetch. Weed Res. 2004, 44, 282–288. [Google Scholar] [CrossRef]
  36. Rubiales, D. Parasitic plants, wild relatives and the nature of resistance. New Phytol. 2003, 160, 459–461. [Google Scholar] [CrossRef]
Figure 1. Non metric multidimensional scaling (NMDS) analysis of climate variables including: maximum temperature (Tmax), minimum temperature (Tmin), maximum humidity (Hmax), minimum humidity (Hmin), Evapotranspiration (ETo) and rain during different growing stages [pre-flowering (Pre), flowering (Flow), post-flowering (Post) and complete growing season] characterizing the seven environments, used for phenotyping grain yield.
Agronomy 10 01295 g001
Figure 2. Non metric multidimensional scaling (NMDS) analysis of climate variables including: maximum temperature (Tmax), minimum temperature (Tmin), maximum humidity (Hmax), minimum humidity (Hmin), Evapotranspiration (ETo) and rain during different growing stages [pre-flowering (Pre), flowering (Flow), post-flowering (Post) and complete growing season] characterizing the seven environments, used for phenotyping the number of broomrapes per plant.
Agronomy 10 01295 g002
Figure 3. AMMI1 Biplot display for mean yield and IPCA 1 scores of the 19 grass pea lines tested across seven environments. Vertical line at the centre of biplot is the general grand mean.
Agronomy 10 01295 g003
Figure 4. AMMI1 Biplot display for broomrape per plant and IPCA 1 scores of the 19 grass pea lines tested across seven environments. Vertical line at the centre of biplot is the general grand mean.
Agronomy 10 01295 g004
Table 1. Description of the environments (combination of location and season) of the trials of the multi-environment study. Summary climatic data corresponding to each growing season are provided (more detailed data used in Figures 3 and 4 are not listed here).
EnvironmLocationSoil TypeSoil pHLatitudeLongit.Altit.
(m)
SeasonAvTmax (°C)AvTmin (°C)Rain
(mm)
CAMP08Campillo,
Spain
Vertisol7.5–837°20′ N4°51′ W4612007–0818.87.8264
TOM09Tomejil,
Spain
Vertisol7–7.537°30′ N5°57′ W122008–0922.67.5219
CORD09Córdoba,
Spain
Fluvisol6.5–737°50′ N4°50′ W902008–0921.77.9280
ESC08Escacena,
Spain
Fluvisol7–7.537°25′ N6°15′ W882007–0820.710.1391
ESC09Escacena,
Spain
Fluvisol7–7.537°25′ N6°15′ W882008–0921.49.4252
KAFR08Kafr El-Sheik,
Egypt
Entisol7.5–830°47′ N30°59′ E02007–0823.95.4276 B
KAFR09Kafr El-Sheik,
Egypt
Entisol7.5–830°47′ N30°59′ E02008–0923.48.3193 B
B this includes the irrigations performed at KAFR08 and 09, consisting on 4 flooding irrigations of 40 mm.
Table 2. Mean grain yield (kg ha−1) of 19 grass pea accessions grown at 7 location–year environments.
Grain Yield (kg ha−1) in Different Environments
SPAINEGYPT
AccessionSynom.CAMP08CORD09ESC08ESC09TOM09KAFR08KAFR09Mean
Ls1Sel19053392666715672903259923431648
Ls2Sel288340102166717474468218920691786
Ls3Sel289340137064516143631230218891685
Ls4Sel29050797844017864398190322671754
Ls5Sel29935590052016384238246519081718
Ls6Sel38746793430016924402145915691546
Ls7Sel39039387345716204220273727171860
Ls8Sel449320123888919844724223719951912
Ls9SelB11131194260017084343207618841695
Ls10SelB2221401556153423433963499948002762
Ls11Sel2177607201190816194325478940872621
Ls12Sel211920768532914364035137315071368
Ls13SelETH-730798540017454374121416741528
Ls14SelETH-151607163341472414616049781344
Ls15Sel94544053480616372565280027871653
Ls16Sel1784613515104526883892342750922468
Ls17Sel194233884048015904256211718611640
Ls18Sel19595471197122714644083480833992389
Ls19Lisa81075370319884985398835672399
Mean 40799968217554103268925471883
SE 3057525011720817876
Table 3. Number of broomrapes per plant of 19 grass pea accessions grown at 7 location–year environments.
AccessionCAMP08CORD09ESC08ESC09TOM09KAFR08KAFR09Mean
Ls10.130.480.370.340.00.500.560.40
Ls20.231.150.630.660.02.180.860.95
Ls30.100.400.300.470.00.380.190.31
Ls40.371.120.500.490.02.521.471.08
Ls50.101.020.700.790.02.071.941.10
Ls60.331.580.630.680.03.613.301.69
Ls70.170.980.500.510.00.990.690.64
Ls80.000.800.570.400.01.021.180.66
Ls90.030.980.600.590.01.541.510.88
Ls100.101.630.500.530.00.991.000.79
Ls110.100.830.400.390.032.401.640.96
Ls120.271.180.630.680.03.203.301.54
Ls130.130.970.500.450.01.261.320.77
Ls140.271.170.600.670.02.592.471.29
Ls150.170.930.630.380.02.211.721.01
Ls160.201.150.530.550.01.651.490.93
Ls170.401.220.500.740.03.282.471.43
Ls180.030.280.570.460.00.850.700.48
Ls190.500.980.831.400.653.093.001.63
Mean0.190.990.550.590.041.911.620.98
SE0.030.080.020.030.030.140.140.05
Table 4. Analysis of variance for yield (kg ha−1) of 19 accessions of grass pea in 7 environments (DF: degrees of freedom; SS: sum of squares; MS: mean square; G*E: term of the genotype-by-environment interaction).
SourceDFSSMS% Variation
Environment (E)6594,938,55199,156,425 ***76 A
Replication/E1410,326,066737,576
Genotype (G)1868,746,5823,819,254 ***9 A
G*E108113,679,4151,052,587 ***15 A
IACP12382,737,3533,597,276 ***73 B
IACP22114,543,665692,55513 B
Residual6416,398,397256,224
Error252120,081,873476,515
Total398907,772,488
*** Significant at p < 0.0001 level of probability, IPCA: principal component of interaction. A % variation respect (E + G + G*E) SS. B % variation respect (G*E) SS.
Table 5. Analysis of variance for number of broomrape per plant of 19 genotypes of grass pea in 6 environments (DF: degrees of freedom; SS: sum of squares; MS: mean square; G*E: term of the genotype * environment interaction).
SourceDFSSMS% Variation
Environment (E)617128.5 ***60 A
Replication/E1430.19
Genotype (G)18482.64 ***17 A
G*E108640.58 ***23 A
IACP123542.32 ***84 B
IACP22150.238 B
Residual6450.08
Error252380.15
Total398322
*** Significant at p < 0.0001 level of probability, IPCA: principal component of interaction. A % variation respect (E + G + G*E) SS. B % variation respect (G*E) SS.
Table 6. Ranking tables showing the top 6 accessions with highest grain yield and lowest broomrape infection in each environment, according to AMMI1.
AMMI1 Rank
for Grain Yield
AMMI1 Rank
for Number Broomrapes Per Plant
Environment123456123456
CAMP08Ls11Ls19Ls10Ls8Ls16Ls18Ls3Ls1Ls18Ls11Ls8Ls5
CORD09Ls11Ls10Ls19Ls8Ls16Ls18Ls3Ls1Ls18Ls8Ls7Ls11
ESC08Ls10Ls11Ls19Ls8Ls16Ls18Ls18Ls3Ls11Ls1Ls8Ls15
ESC09Ls10Ls11Ls19Ls16Ls8Ls18Ls3Ls1Ls18Ls11Ls8Ls13
KAFR08Ls10Ls11Ls16Ls18Ls19Ls15Ls3Ls1Ls18Ls7Ls10Ls8
KAFR09Ls10Ls11Ls16Ls18Ls19Ls15Ls3Ls1Ls18Ls7Ls10Ls8
TOM09Ls8Ls13Ls6Ls2Ls4Ls9

