1. Introduction
As the global population continues to increase, demand on the limited water supply is expected to follow suit. With the future of water restrictions still unknown, the move towards more efficient containerized plant production systems is essential. To create an efficient system in container production, the substrate, irrigation system, and the container must be considered together as a whole. Soilless substrates were first introduced for container production to increase drainage by maintaining a high air-filled porosity as compared to mineral soils [
1]. The higher air space in container substrates compared to mineral soil was used to decrease the hypoxic potential of the container, regardless of over-irrigating or increased precipitation. The side-effect of increased airspace is the practice of excess water application to limit the risk of under watering [
2].
Factors that affect a substrate’s wettability include moisture content, hydrophobicity, and particle distribution. Understanding the components that make up a substrate allows better potential management strategies to improve the efficiency of plant production practices. Peat as a horticultural substrate has demonstrated the ability to capture and retain copious amounts of water while possessing adequate air space [
3,
4]. However, peat can become hydrophobic at lower moisture contents, producing a lower wetting potential without the addition of wetting agents [
5,
6].
Coconut coir is a hydrophilic material known for its high total porosity, available water, and low bulk density with ~90% of particles less than 2.0 mm in diameter [
7]. One major advantage of coir as a substrate is its ability to be rewet under drier conditions, where peat becomes increasingly hydrophobic [
8,
9].
Pine bark has been a major component in container nursery substrates for over 30 years and is important in greenhouse substrates in the form of aged, softwood bark. Pine bark can have variable properties based on processing, including more air space, lower total porosity, and available water than both peat and coir [
10]. Studies have shown that the aging process of bark encourages wettability, whereas fresh bark can be more resistant to water uptake [
11]. The wider particle size distribution and aggregate shapes in pine bark reduce the total water holding capacity compared to both peat and coir, however the internal pores of the bark structure attribute to a higher percentage of available water for plant uptake [
12].
As an irrigation technique, subirrigation provides water and/or nutrients to the bottom of the containers while capillary action of the substrate provides the plant root system with water and nutrients [
13,
14]. Whether ebb-and-flow, flood-floor, or trough systems, subirrigation is a popular technique in container plant production to be able to control the application of water, fertilizer, and the overall improvement of efficiency [
14,
15]. Although originally designed to reduce water runoff from greenhouse systems, the economic benefits of a subirrigation system can include less labor required than traditional overhead and more even applications of water, leading to a more uniform crop [
16]. Water efficiency through irrigation systems has shown to be a major issue, and the past few years have shown that inefficiency results in an increased risk of water shortages during seasonal and climactic drought periods [
17]. Subirrigation systems have the ability to reduce application runoff [
18], further reducing water and fertilizer costs, which are a few key points in the use of this irrigation practice.
Substrate properties typically associated with overhead irrigation systems have high air-filled porosity and faster drainage for water moving with gravity, but lesser capillary rise properties and available water [
17]. Compared to overhead and surface irrigation systems, subirrigation was found to consistently reduce overall water use due to the recollection and reuse of water in the system [
16,
19,
20,
21]. In 2006, Davis et al. [
20] found that subirrigation systems use 44% less water than surface-applied systems. Then, Roeber [
22] in 2010 analyzed the overall water use discrepancies between irrigation systems and found that ebb-and-flow units and used 0.4 to 0.8 m
3 m
−2 water per year, drip irrigation used 0.8 to 1.6 m
3 m
−2 water per year, and hand or sprinkler irrigation use 1.2 to 2.4 water m
3 m
−2 per year, indicating that subirrigation systems can be more efficient than surface application systems.
Efficiency of substrates is modeled by its wettability, Letey et al. [
23] defined this as the ability of a liquid to spread over a materials surface. Effective wettability can also improve the substrates water holding capacity, which has been shown to also improve plant growth [
24]. Research has shown the impacts hydrophobicity has on the wettability of some horticultural substrates [
5,
6,
23]. However, few have studied the influence of irrigation pulsing duration and water depth on the ability of substrates to hydrate or rehydrate. The objective of this experiment was to understand the effect of pulsing irrigation techniques and initial moisture content on the hydration of peat, coir, and pine bark substrates using ebb and flood subirrigation.
A recent survey of European substrate manufacturers revealed the future projections of horticultural substrate components as far ahead as 2050, with peat increasing by 250%, coir by 700%, and bark nearly 1000%. More research needs to be done understanding how individual base substrates and initial moisture ultimately affect the wettability of greenhouse substrate mixes.
2. Materials and Methods
2.1. Preparation of Substrates
On 22 July 2019, sphagnum peat (Premier Pro-Moss, Quakertown, PA, USA) was hydrated and fluffed to an initial moisture content (IMC) of 70%. Peat was removed from the compressed bale and placed into a large tub; water was then added in 3 L increments after which peat was agitated by hand to allow proper water absorption. Initial MCs were then tested using an Ohaus MB27 soil moisture determination balance (Ohaus Corp., Parsippany, NJ, USA) to determine further water additions needed to bring peat to an IMC of 70%. On 23 July 2019, two compressed bricks of coconut coir (Densu Coir, Hamilton, ON, Canada) were hydrated individually by adding 14 L of water (in 1 L increments), by hand, until the compressed brick of coir was completely broken apart. Moisture levels were then tested using the soil moisture balance to determine further water additions needed to bring coir to an IMC of 70%. On 24 July 2019, loblolly (
Pinus taeda L.) pine bark (Pacific Organics, Henderson, NC, USA) which had been aged in outdoor windrows for four months and specifically engineered (hammer milled and screened) to have a container capacity (CC) of 55% volumetric water content (VWC) was separated, moisture levels tested, and further hydrated to a moisture content of 70%. Physical properties of the substrates, including CC, air space, total porosity, and bulk densities were derived using a modified version of the NC State University Porometer method [
25] with three representative samples of each substrate, and CC is reported in , and .
Table 1.
Particle size distribution of three traditional greenhouse substrate components.
Table 2.
Average water capture (% VWC) of coconut coir at three initial moisture contents (IMC) of 33%, 50%, and 67%, three irrigation water levels of 2 mm, 20 mm, and 35 mm, and at five irrigation pulse durations (by event total) per water level.
Table 3.
Average water capture (% VWC) of peat at three initial moisture contents (IMC) of 33%, 50%, and 67%, three irrigation water levels of 2 mm, 20 mm, and 35 mm, and at five irrigation pulse durations (by event total) per water level.
Each of the three substrate components were tested at three IMCs. The most common and recommended MC for potting soils has a mass wetness of 1.0 g/g (50% MC). To test effects of MC, each component was also brought to half (0.5 g/g) and double (2.0 g/g) this normal level, which resulted in percent MCs of 33%, 50%, and 67% by weight. All substrates were then air-dried down to IMCs of 67%, 50%, and 33%. Initial MC and total weight of each sample were used to calculate how much water needed to be lost to reach IMCs of 67%, 50% and 33% IMC. Using a 160 cm × 49 cm × 69 cm four-tier PVC-enclosed dehumidifying chamber, substrates air dried until weight (g) loss equals number of mL’s calculated to be removed from the substrate. Once the target IMC was reached, samples were transferred to a plastic bag and sealed to prevent further water loss, while allowing the substrate to reach moisture equilibrium after 24–48 h.
2.2. Particle Size
Particle size distribution () was performed on three, 50-g oven dried samples of each substrate using a total of 11 sieves. These sieves ranged in size from greater than 6.3 mm to less than 0.063 mm plus a bottom pan to collect fine particulates. The sieves were placed into the RX-29 Ro-Tap sieve shaker (278 oscillations/min, 150 taps/min; W.S, Tyler, Mentor, OH, USA). The sieves and pan were shaken for five minutes, and the particle fractions retained on each sieve and the amount collected in the bottom pan (representing the smallest particle fractions) were weighed.
2.3. Subirrigation System
This experiment was conducted using materials and modified procedures described by [
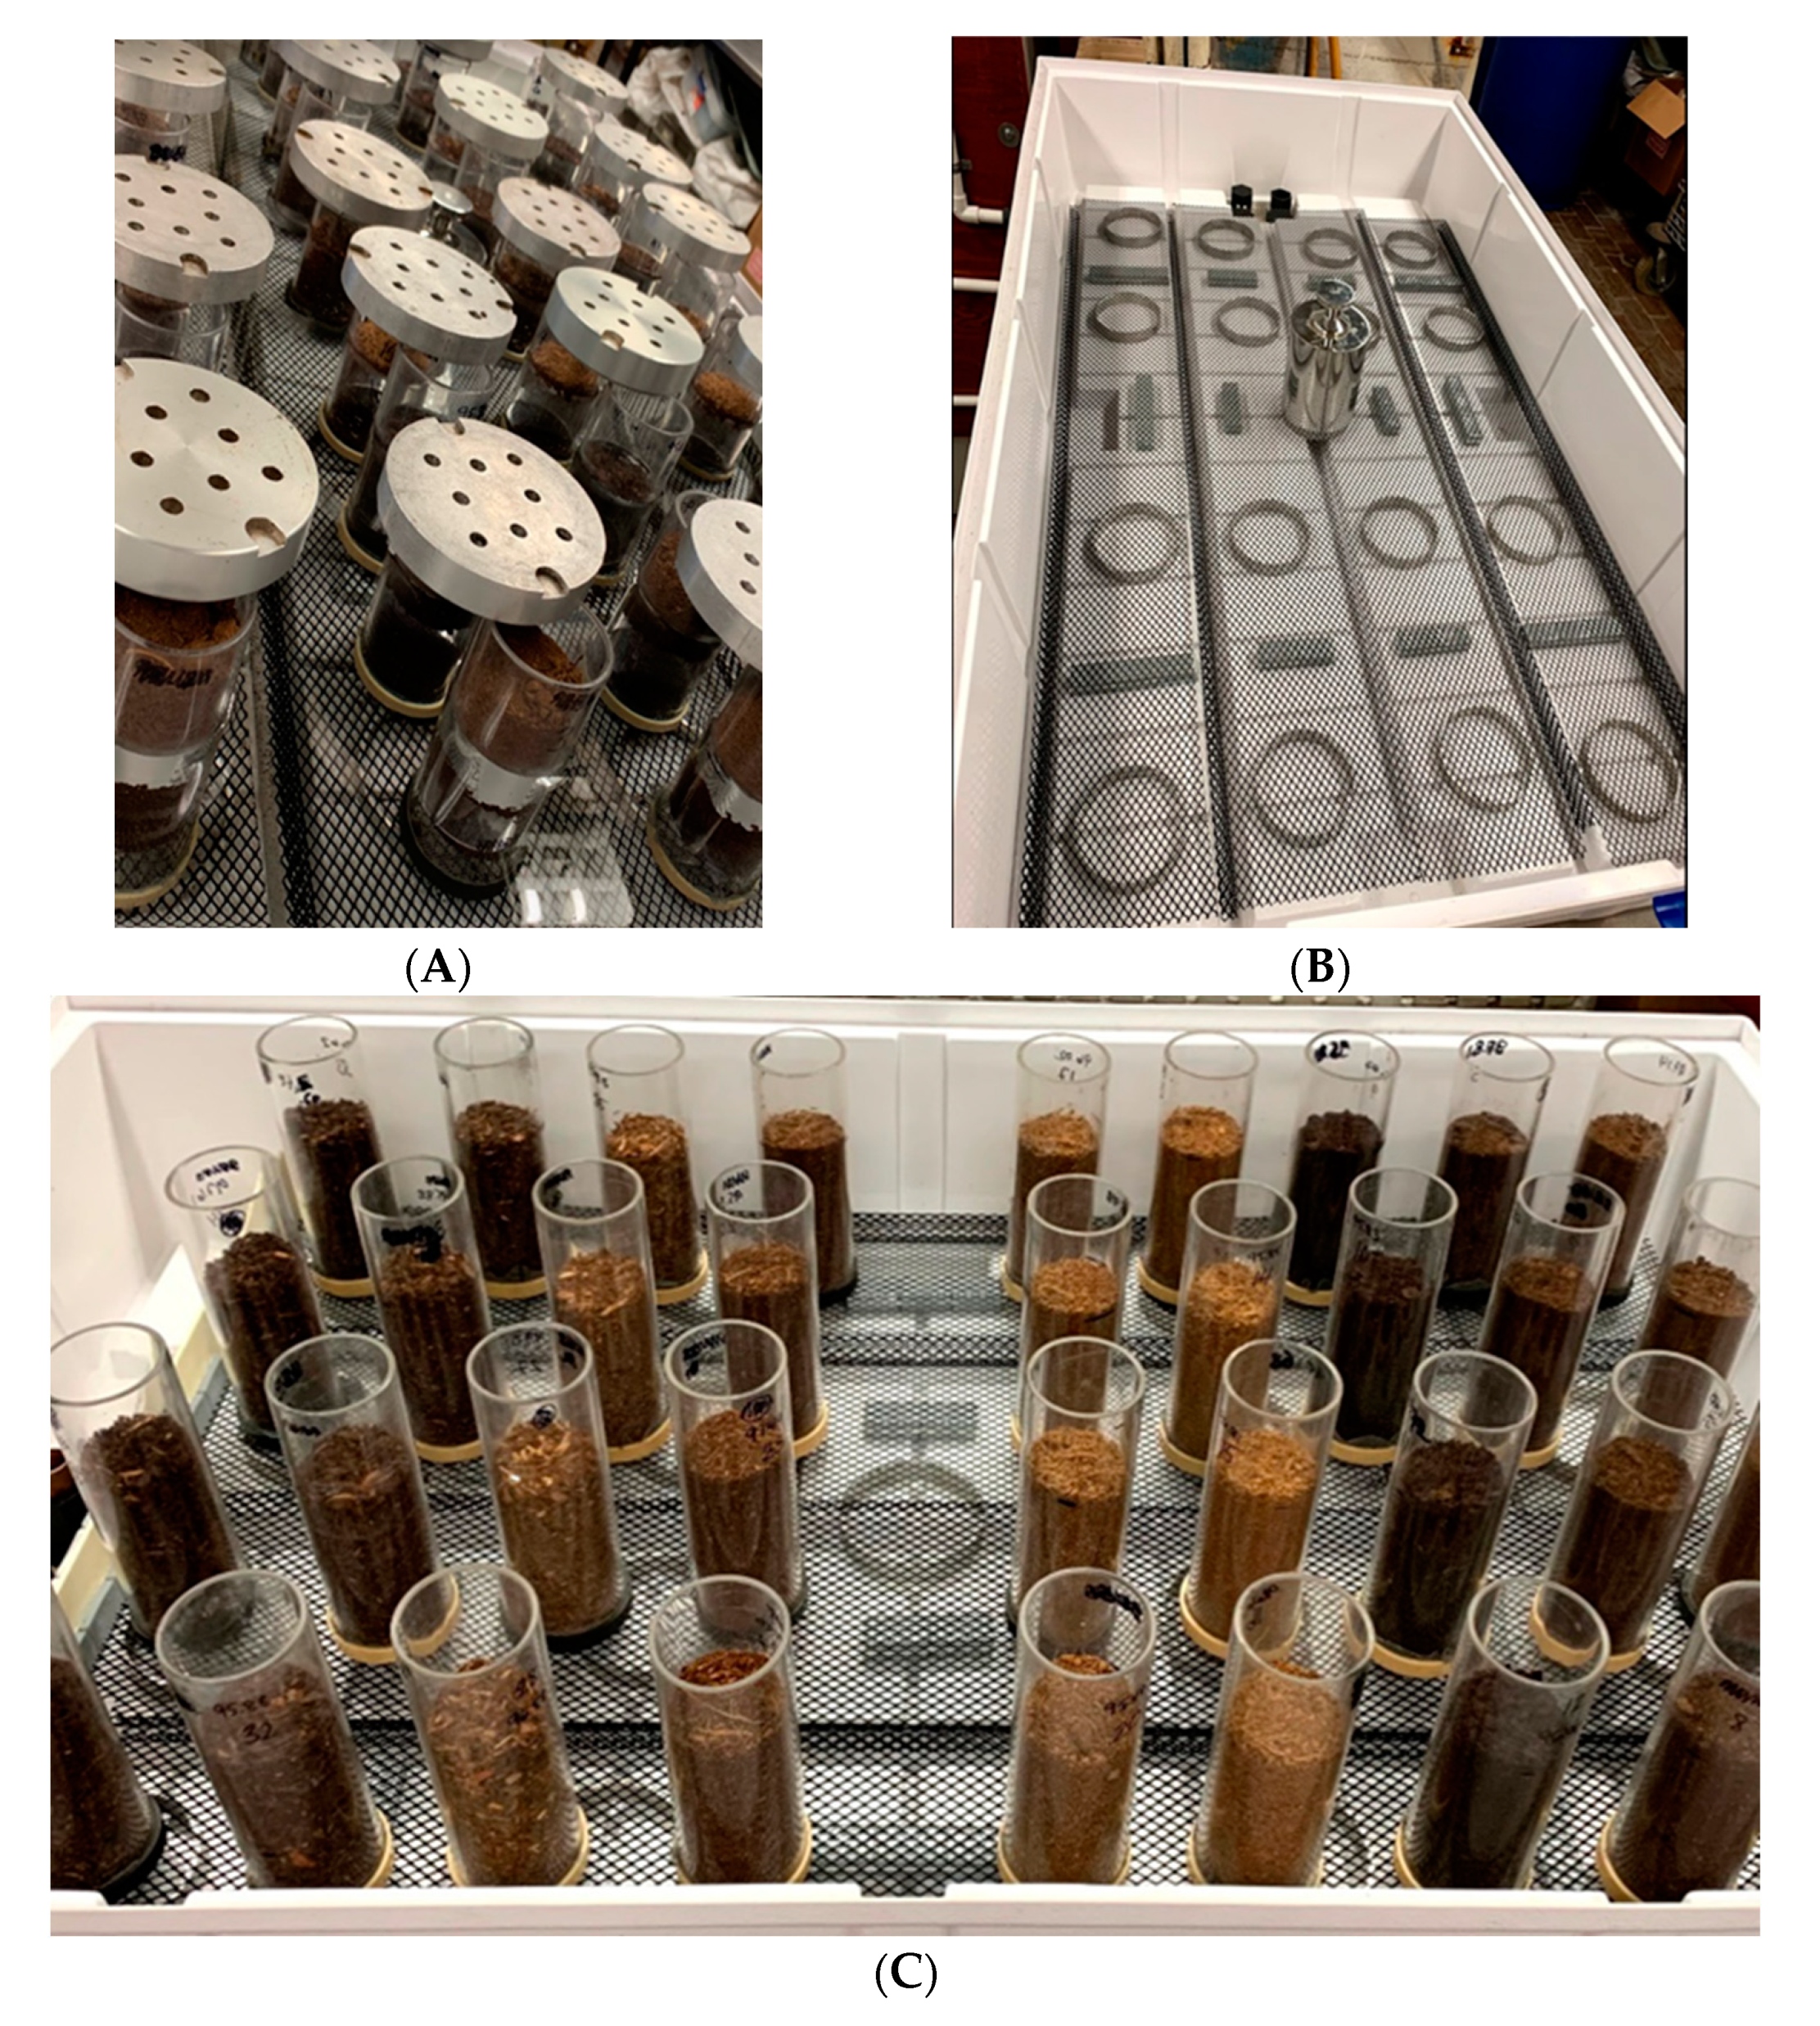
9]. The required equipment consisted of a transparent cylinder, 5 cm i.d. × 15 cm·h
−1, with a mesh screen (mesh size 18 × 16; New York Wire, York, PA, USA), attached to one end, using rubber pressure plate rings (Soil moisture Equipment Corp., Santa Barbara, CA, USA) (A). The subirrigation method used to simulate capillary rise uses an Ebb and Flood irrigation unit (Hawthorn Hydroponics, Vancouver, WA, USA) 60.96 cm wide by 121.92 cm in length [
26] (). Water was introduced into this system via a faucet and controlled through a series of gate valves connected to the system (C). Water level was maintained at a continuous height with a flow rate of ~21 L/min. To be able to control the height of the water while also having a steady flow into the unit, a standing copper pipe was cut to allow water to be held at heights of 2 mm, 20 mm and 35 mm above the surface of the unit at a steady state. Water levels were chosen to simulate three subirrigation conditions: 2 mm for trough methods, 20 and 35 mm for ebb and flood systems, where water levels are usually between 20 and 35% of the container height. The water level of 2 mm is also analogous to the RHP WOK method [
27] where water level is held at a few millimeters in height.
Figure 1.
Ebb and flood subirrigation system. (A) Container capacity testing with 2 kg aluminum weights. (B) Partially constructed ebb and flood unit with aluminum rings with mesh screen. (C) Fully constructed system completes with packed substrate cylinders.
The transparent cylinders were packed with each substrate component to have a Db within 5% of other samples of the same component. To achieve this, cylinders were filled with substrate (by weight) and then raised 12 cm off a flat surface, then tapped four times to bring the top of all 4 replications to a pre-measured line 10 cm from the base of the cylinder and 5 cm from the brim, representing 200 mL of substrate. Cylinders were then placed on an elevated mesh screen to optimize surface area exposure to water at about 1.7 cm off of the base of the flood unit.
2.4. Hydration Events
Each water application is referred to as a hydration event. Pulsing in this context means time of exposure to water based on a total time of 60 min. The hydration events tested were 5 min exposure over 12 events, 10min exposure over 6 events, 20 min exposure over 3 events, 30 min exposure over 2 events, and 60 min exposure in 1 event. All hydration events were tested at water heights of a 2 mm, 20 mm, and 35 mm above the sample base. Once placed on the mesh screen, the unit was filled with water. Water was allowed to fill until water poured into the copper piping fitted to the desired water level. At that time, water flow input equaled output, allowing constant flow of water without a change in water level. The substrates were held at a constant water level for the allotted event time (between 5 min and 60 min) to absorb water through flooding and capillary action. Once the event was finished, water was drained from the unit for one timed minute before each cylinder was weighed. The difference between final and initial weights was the amount of water captured by the substrate during that hydration event. This procedure was repeated based on specified time-allotted events (12, 6, 3, 2, 1 irrigation event(s)).
2.5. Container Capacity
After the final hydration event was complete and final weights were taken, CC was determined as a measure of the substrate’s maximum hydration. To determine CC, the cylinders were returned to the ebb and flood unit for measurements following a modified version of the method described in the North Carolina State University Porometer Manual [
25]. After samples were placed in the subirrigation unit, a 2 kg aluminum weight was placed on the top of each cylinder to prevent tipping because of buoyancy (A). The samples were then saturated from below by allowing water to flow in until it reached 1/3 of the height of the sample (3 cm from the base of the sample, 4.7 cm from the base of the unit). After waiting two minutes, water was allowed to flow again until reaching 2/3 of the height of the cylinder, or 6 cm from the base of the cylinder. After an additional two minutes, the water was applied until reaching the top of the sample within the cylinder (A), 10 cm from the base of the cylinder [
6]. After saturating in the system for an additional 30 min, the water was drained, and samples were reweighed to record changes in weight (water captured and retained). Samples were then placed into a forced-air drying oven at 105 °C for 48 h to dry. Then, each sample was weighed, and dry weight was used to determine total water retained and moisture content.
2.6. Capture Rate
Water capture rate (CR) was calculated for subirrigated substrates using a modified version of the flow rate formula to account for variables in this experiment, the equation was written as (1):
where CR is the amount of water captured by the substrate after one irrigation per unit time (mL/min), C
i (initial capture) is the weight (g) of the substrate after the present irrigation event (minus the weight of the cylinder), C
p (previous capture) is the weight (g) of the substrate (minus the cylinder) taken after the previous irrigation (for the first irrigation event, C
p is equal to the pack weight of the cylinder (minus the weight of the cylinder), t is the amount of time per irrigation (minutes).
2.7. Capture Values
In order to provide both statistical and numeric comparisons, hydration efficiency of the substrates were examined using irrigation simulations and categorized in four ways: (1) initial moisture content, (2) water depth, (3) hydration event time and (4) pulsing effects. This allowed for the direct comparison of initial uptake and maximum uptake across single, and multiple events as affected by depth and initial moisture content. Data is presented for coir, peat and pine bark in , and , respectively. Initial hydration was the amount of water absorbed by the substrate after one irrigation event and compared across all pulsing technique durations. Final hydration was the amount of water absorbed by the substrate after the last or longest irrigation event.
Table 4.
Average water capture (% VWC) of pine bark at three initial moisture contents (IMC) of 33%, 50%, and 67%, three irrigation water levels of 2 mm, 20 mm, and 35 mm, and at five irrigation pulse durations (by event total) per water level.
Statistics were determined using SAS v. 9.4 (SAS Institute; Cary, NC, USA). A Tukey’s HSD test with alpha = 0.05 was used to identify differences and similarities between substrates at individual MCs and pulsing regimens. This test also determined the similarities and differences of CC, initial hydration, and final hydration across substrates, MCs, and pulsing techniques.
3. Results
3.1. Particle Size
Substrate particle size analysis was performed on all three substrates, with the results displayed in . Coir represented the substrate with the highest percentage of particles smaller than 2.0 mm, showing 69.2% of all particles tested with pine bark representing the highest percentage of coarse particles with 57.0% Peat occupied the middle of the three substrates with 8.8% more coarse particles than coir, but 41.4% less than that of pine bark. Bulk density values were also attained by taking the substrate initial dry weight and dividing by the total volume of the cylinder, with peat, coir, and pine bark recording values of 0.13 g/cm3, 0.10 g/cm3, and 0.16 g/cm3, respectively.
3.2. Hydration Curves
Previously described by [
26], using VWC and time as our variables, these curves were designed to illustrate the cumulative water absorbed by the substrate. Peat, coir, and pine bark are all represented on different figures with each cell representing the three IMCs under that treatment condition. The IMCs for this experiment of 33%, 50%, and 67% were all determined by weight. Furthermore, the hydration efficiency curves were determined by VWC to describe the amount of water contained in the substrate. These curves show a VMC reading at event zero and represent the percent VWC at the IMC. Therefore, the IMC of 50% by weight is 12% to 15% by vol for peat. For coir, the IMC of 50% by weight ranges from 9% to 11% by vol, and for pine bark (at 50% initial moisture) they are 16% to 18% by vol. The differences represent the density differences between the three substrate materials.
3.3. Coir
The hydration curves related to the treatments of coir identify a pattern related to IMC, water level, and time (). Regardless of IMC, coir was able to capture water, but the intensity at which it imbibed water was dependent on water level and IMC. At a depth of 2 mm, the difference between a single 5 min pulse and a 60 min pulse was as <4% VWC (). In fact, as IMC increased, the difference between 5 and 60 min lessened while water capture was nearly the same across all IMCs. Timed pulses of water impacted the amount of water captured by coir, increasing its total water captured by as much as 12% VWC at 2 mm and 30 min when pulsed six times. Representing the most water captured by coir at a 2 mm water depth. Raising the water level to 20 mm increased water capture by ~10% VWC, with the gap in water captured between single and multiple pulses lessening to just 7% VWC. As IMC intensity increased, capture increased for the single 5 min pulse, but for single and multiple pulses between 10 and 60 min, there was very little significant change. At a water depth of 35 mm, pulsing regimens do not return any greater water capture than a longer single pulse. Imbibed water does increase compared to 20 mm, with 50% IMC returning the greatest water captured. Capture rate (CR) was calculated (1) for each pulsing time, water level, and IMC of coir. CR was directly affected by water level and pulsing duration. The highest CR for coir was under a single 5 min pulse, with the maximum rate recorded at 35 mm and 5 min representing 14.27 mL/min.
Figure 2.
Substrate waters capture volumetric water content curves for coir over three initial moisture contents (IMC) of (A) 33%, (B) 50%, and (C) 67%, three irrigation water levels of 2mm (orange), 20mm (gray), and 35mm (blue), and at five irrigation pulse durations of 5 min (1), 10 min (2), 20 min (3), 30 min (4), and 60 min (5). The container capacity for each water level is denoted by the color matched solid bar on the figure.
3.4. Peat
Intensity of moisture preconditioning impacted the hydration curves of peat under lower moisture conditions (). Time, IMC, and water depth all impacted the hydration of peat, with IMC effectively reducing water captured by 4×. At a depth of 2 mm, it was not until 67% IMC that peat began to capture water (), effectively capturing only 42% of its container capacity at its greatest capture. Regardless of water level, 33% IMC proved to be too low of a moisture level for peat to capture any water, with the low moisture also impacting the CC, keeping it below 30% VWC (). Water capture increased with time, however pulsing showed little impact, with the greatest capture recorded after a single 60 min pulse. Increasing the water level to 35 mm resulted in an increase in water captured by ~5% VWC (), with the greatest capture at 35 mm and 67% IMC. The intensity of hydrophobicity was an important factor in the amount of water captured by peat, limiting the amount of water being imbibed by the substrate at both 33% and 50% IMC. As water depth, time, and IMC increased, capture also increased. However, the CC of peat was largely affected by IMC and water level, with a CC as low as 15.2% volumetrically at 5 min and 2 mm. Container capacity increases as IMC increases, rebounding to ~68% at 50% IMC and further to ~80% at 67% IMC. Pulsing time did not have an effect on peat CC. CR was also calculated using the same Formula (1). It is clear () that peat, mainly at 50% IMC and 67% IMC, captured the majority of water within the first 10 min. Beyond that threshold, even at 67% IMC, peat does not gain much water. Based on , the maximum CR for peat was at 35 mm and 5 min at 9.49 mL/min after the first irrigation.
Figure 3.
Substrate water capture volumetric water content curves for peat over three initial moisture contents (IMC) of (A) 33%, (B) 50%, and (C) 67%, three irrigation water levels of 2 mm (orange), 20 mm (gray), and 35 mm (blue), and at five irrigation pulse durations of 5 min (1), 10 min (2), 20 min (3), 30 min (4), and 60 min (5). The container capacity for each water level is denoted by the color matched solid bar on the figure.
3.5. Pine Bark
Larger particle size and pore structure equated to a linear increased in water capture in pine bark, displayed in the hydration curves (). With event time and pulsing showing no significant impact, the water level and IMC were the two factors that affected the water captured by pine bark. At 2 mm, bark displayed errant capture characteristics, with more water captured at both 33% and 50% IMC than 67%, and the highest capture recorded at 33% IMC and 6 pulses of 5 min each at 25% VWC (). With water capture reducing as moisture level increases up to 67% IMC. Raising the water level to 20 mm increased water capture by ~5% VWC at 50% IMC, with very little statistical differences across all treatments. Lastly, raising to 35 mm represented the greatest water captured at 39% VWC, and the closest any substrate came to its treatment CC, capturing 55% of its known CC. The CC of pine bark is consistent, regardless of treatment with only ~10% difference between the lowest and highest recorded CCs. What is important to note is that pine bark did not show any response to the time or pulsing treatment parameters, slowly increasing water captured as water level was increased from 2 mm to 35 mm. Capture rate for each treatment showed the consistency of pine bark’s ability to imbibe water. Compared to both peat and coir, pine bark captured the majority of water within the first 5min. the CR for pine bark did not increase with IMC, in most cases it actually decreased. With 33% IMC representing the highest CR for most pine bark treatments. However, the maximum CR of pine bark was at 35mm and 10min representing 11.26 mL/min during the first irrigation event.
Figure 4.
Substrate waters capture volumetric water content curves for pine bark over three initial moisture contents (IMC) of (A) 33%, (B) 50%, and (C) 67%, three irrigation water levels of 2 mm (orange), 20 mm (gray), and 35 mm (blue), and at five irrigation pulse durations of 5 min (1), 10 min (2), 20 min (3), 30 min (4), and 60 min (5). The container capacity for each water level is denoted by the color matched solid bar on the figure.
4. Discussion
From the hydration curves in , and , it appeared that the intensity of substrate moisture preconditioning prior to the first irrigation and water level had the overall greatest effect on water capture of peat, coir, and pine bark. Peat was the only substrate that demonstrated fluctuating CC values based on IMC from as low as 15.2% at 2 mm, 5 min, and 33% IMC to 84.1% at 20 mm, 20 min, and 50% IMC. While pine bark and coir were less affected by treatments, representing ~10% between the lowest and highest CC of both substrates. While all substrates increased water capture as both IMC and water level increased, peat had the largest increase in capture. With the 2 mm water level representing the substrates capillary water uptake, coir demonstrated the highest capture () at 33% IMC and 50% IMC, with peat narrowing the margin of difference at 67% IMC.
Across all IMCs, coir was able to capture and retain water. However, IMC did play a role in the rate at which it was able to do so. At 50% IMC, there was very little difference in the water capture between 5 min and 60min of irrigation exposure. Again, water capture increased ~10% VWC as water level increased, and the greatest capture happened at 35 mm. Coir is known to be normally hydrophilic; Abad et al. [
7] characterizes coir as having a sponge-like ability to soak up water and be able to retain it within the pores of the substrates. This is, in part, because of the increased level of fines in coir compared to both peat and pine bark, between 0.5 mm and 2.0 mm coir has ~20% more particles in that size class than both peat and coir (). Subirrigation uses capillary rise (along with flooding level) to facilitate water uptake into the substrate. Couple this with the hydrophilic nature and retention of its sponge-like ability at lower moisture conditions, coir seemed generally unaffected by pulsing time differences [
13]. That process was also evident in the hydration curves in , regardless of pulsing time coir captured the most water within the first five minutes of irrigating.
From the data in , there is evidence that IMC had the greatest impact on peat’s ability to capture water at all water levels and pulsing times. As IMCs increased in peat, the substrate’s ability to capture water increased, in a nearly linear fashion. Peat is known to express hydrophobic intensity at lower moisture levels [
5] or from the material drying processes in the production of these substrates [
28]. However, these hydrophobic expressions can hinder the ability of peat to rewet, taking more water and effort for the substrate to hydrate [
28,
29]. At 33% IMC, capturing any water whether this was 5 min of exposure over 12 events or 60min and 1 event proved difficult under the drier conditions. For perspective, the initial hydration for peat at 35 mm and 5 min events was 9.9%VWC, whereas coir under the same treatment conditions was 40.6%VWC, with pine bark reaching 33.2%VWC (, and ). The hydration curves showed the same trends for peat; that increase in IMC increases the effectiveness of irrigation. The main idea is that the capture potential of peat is nearly 50% less under lower moisture conditions, while having the most variable CC across all substrates tested.
Compared to both peat and coir, pine bark has the highest percentage of coarse particles, with ~30% more particles above 2.0 mm than peat (). While a higher percentage of particles >0.5 mm has been shown to greatly influence air space and CC [
30], the larger pore sizes created tend to have difficulty holding water after saturation [
31]. Pine bark was comparably unaffected by water exposure variables pulsing and time and observed an increase in water captured as depth increased. Similar to both peat and coir, the higher the IMC and water depth, the greater the capture. Most notably for pine bark, is the ability of the substrate to capture ~81% of the water throughout all irrigation events in the initial hydration under 5 min pulses and 33% IMC. No other substrate tested observed that level of efficiency under low moisture conditions.
5. Conclusions
Using preconditioning, and exposure (pulsing, depth, and time) as the metrics to describe the response of these substrates, the amount of water capture varied with different combinations of intensity and exposure. Coir exhibited the least difficulty capturing and retaining water, with the greatest water capture occurring at 35 mm. Peat was affected by IMC, regardless of water level or pulse duration with 33% IMC capturing the least amount of water. Most notably, the difference between water capture at 5 min and 60 min was negligible, with all substrates demonstrating ~70% of the water taken up using the 60 min pulse within the first 5 min. Overall, these three substrates exhibited fundamentally varied abilities of capturing water in response to initial moisture conditions, water level, and irrigation pulsing time.


