Article

Soil Chemical Properties and Trace Elements after Wildfire in Mediterranean Croatia: Effect of Severity, Vegetation Type and Time-Since-Fire

1
Department of General Agronomy, Division of Agroecology, Faculty of Agriculture, University of Zagreb,10000 Zagreb, Croatia
2
Environmental Management Center, Mykolas Romeris University, Ateities g. 20, LT-08303 Vilnius, Lithuania
*
Author to whom correspondence should be addressed.
Agronomy 2022, 12(7), 1515; https://doi.org/10.3390/agronomy12071515
Submission received: 23 May 2022 / Revised: 20 June 2022 / Accepted: 22 June 2022 / Published: 24 June 2022
(This article belongs to the Special Issue Resilience in Soils and Land Use)

Abstract

:
Natural landscapes in the Mediterranean ecosystem have experienced extensive changes over the last two centuries due to wildfire activity. Resulting interactions between climatic warming, vegetation species, soil natural, and meteorological condition before and after a wildfire create substantial abrupt landscape alterations. This study investigates the evolution (2 days, 3, 6, 9, and 12 months after a fire) of topsoil (0–5 cm) chemical properties in burned Cambisols (Zadar County, Croatia) with respect to different wildfire severities (HS—high severity, MS—medium severity, C—unburned) and vegetation species (Quercus pubescens Willd. and Juniperus communis L.). Soil pH, electrical conductivity (EC), calcium carbonates (CaCO3), total organic carbon (TOC), total nitrogen (TN), total sulphur (TS), copper (Cu) and zinc (Zn) were significantly higher in HS than in MS and C. Total soil potassium (TK), Fe and Ni were significantly higher in C than in HS. The increase of TOC and TN was more pronounced in Quercus p. than Juniperus c., especially in the first three months. Soil pH, EC, CaCO3, TOC, TN, and TS were most affected by wildfire severity. The distinction between C, MS and HS categories was less visible 9 and 12 months post-fire, indicating the start of the recovery of the soil system. Post-fire management and temporal recovery of the soil system should consider the obvious difference in soil disturbance under HS and MS between vegetation species.

1. Introduction

Wildfires are an inevitable occurrence in ecosystems worldwide and are considered one of the main causes of environmental change [1,2]. A warmer and drier climate, along with land abandonment and afforestation, is leading to an increase in catastrophic wildfires [3,4,5,6].
Soils are an important component of the ecosystem and can be significantly altered by wildfires and their recurrence [7]. The changes in soil systems after wildfires are mainly caused by high temperatures, duration, and severity of the wildfire [8]. Several authors have indicated how the increase in wildfire severity can lead to degradative long-term cumulative effects on soil chemistry [9,10,11], while low and moderate severity fires increase soil organic matter (SOM), total nitrogen (TN), and total carbon (TC) [1,12]. Regardless of the fire severity, organic matter burning leads to rapid mineralisation and an increase of soil nutrients and trace elements such as iron (Fe), aluminium (Al), zinc (Zn), nickel (Ni), cadmium (Cd), and lead (Pb) [13]. Their concentrations depend mainly on the severity of the fire and the type of vegetation burned [8,14,15]. The biological toxicity and potential bioaccumulation of trace elements in the ecosystem after a wildfire are of major concern for the contamination and environmental sustainability of downstream lands and water bodies [13,16,17].
Understanding the relationships between forest management, vegetation species, fire severity, and post-fire recovery of forest ecosystems is especially important for developing fire governance and management strategies to increase socio-ecological resilience in a rapidly changing environment affected by the changing climate [18]. Fire behaviour is determined by the quantity and quality of the fuel load. Therefore, the differences in fire behaviour between grasslands, shrublands, and forests cannot be ignored [19]. Low fuel loads in grasslands and shrublands result in low fire severity and rapid spread, while forests generally have slower fire spread and moderate to high fire severity [20,21]. Different vegetation species in burned forest land have been shown to have significant effects on soil properties. Lombao et al. [11] studied the effects of wildfires on soil under Eucalyptus and Quercus vegetation and indicated that vegetation was the most important factor controlling the overall quality of burned soils and that wildfire is also an important source of variation in soil quality.
Vegetation species is an important determinant of the composition of ash incorporated into the soil over time, and because of the close relationship between fire severity, ash, and soil interaction in the post-fire period, it is critical to conduct research that considers the overall influence of these interacting factors (vegetation species × fire severity × time) on soil quality recovery following a wildfire. Few studies have examined the phenomenon of fire severity in relation to different vegetation species [22,23,24], while the interaction between these factors and the evolution of chemical properties and trace elements in burned soils after a fire is not well understood. To fill this knowledge gap, this study aims to: (a) determine the short-term evolution of soil chemical properties after a wildfire and their temporal dynamics and (b) compare the impact of vegetation species (Quercus pubescens Willd. and Juniperus communis L.) on soil properties in the environmental conditions of Mediterranean Croatia.

2. Materials and Methods

2.1. Study Area and Soil Sampling

The study was conducted in Zadar County, Croatia (44° 05′ N; 15° 22′ E; 72 m a.s.l.), characterized by hot-summer Mediterranean (Csa) climate according to the Köppen–Geiger classification [25]. The average annual temperature is 14.9 °C, and the average annual precipitation is 879.2 mm in the period from 1971 to 2000 [26]. Most of the vegetation in the area consists of Quercus pubescens Willd., Pinus halpensis Mill., Pinus pinaster Ait., Pinus pinea L., and Juniperus communis L. The soil type of the study area is chromic Cambisol [27] with calcareous parent material and sandy clay loam to clayey texture. These soils are characterized by their permeability and good drainage. The general soil properties of the study area are listed in Table 1.
The wildfire affected ~13.5 ha of a mixed forest of Quercus pubescens Willd. and Juniperus communis L. in August 2019. Fire severity was moderate to high, as determined by visual inspection of burned vegetation and ash characteristics using the methodology described in Pereira et al. [28] and Úbeda et al. [29]. According to the characteristics of the burned area, the experimental design recognized three categories of sampling areas: C—control, unaffected by fire; HS—high severity, which came from sites where the foliage and trunk were completely burned, and the soil was covered with white ash; and MS—medium severity, where the foliage and trunk were partially burned, and the soil was covered with black ash. Additionally, each category was subdivided by the two vegetation species, i.e., each of the three severity categories contained thirteen (13) sample areas under Quercus pubescens Willd. and seven (7) sample areas under Juniperus communis L. Flat terrain and an area with average wind strength of 2 Beaufort (1.6–3.3 m/s) were selected to minimize the intensity of immediate ash transport due to terrain slope and wind. The final experimental design is shown in Figure 1. Soil samples (with the ash layer removed) were collected at a depth of 0–5 cm using a spade and georeferenced using a Trimble GeoXH handheld device (GeoExplorer ® 6000 series, Trimble GmbH, Raunheim, Germany). Samples were collected two days (0 MAF), 3 months (3 MAF), 6 months (6 MAF), 9 months (9 MAF), and 12 months (12 MAF) after wildfires. During each sampling period, 60 soil samples were collected (20 per severity category), resulting in a total of 300 samples collected.

2.2. Laboratory Analysis

Soil samples were air-dried and sieved through a 2 mm sieve. Subsequently, soil pH, electrical conductivity (EC), carbonates (CaCO3), total organic carbon (TOC), TN, and total sulfur (TS) were determined by standard laboratory methods: pH and EC were determined electrometrically, using Beckman’s φ 72 pH meter, in H2O (1: 2.5) and a HACH-CO150 conductometer (300–1900 μS), respectively. CaCO3 content was determined via volumetric Scheibler calcimeter and TOC, TN, and TS content by dry combustion using a CHNS analyzer (Elementar Analysensysteme GmbH, Langenselbold, Germany). Total soil potassium (TK) and trace element (Fe, Zn, Ni, and Cu) contents were determined by X-ray fluorescence using a VantaTM C series handheld XRF analyzer (Olympus Scientific Solutions Americas, MA, USA).

2.3. Statistical Analysis

Before statistical analysis was carried out, the collected data were checked for normality using Q–Q plots and transformed when needed to meet this assumption in the statistical analysis. Z-scores were subsequently calculated for each variable in order to detect outliers, which were removed if the score exceeded 3 standard deviations [30]. Data were then analyzed using a factorial ANOVA to determine the percent of variation attributable to each of the factors: fire severity, time, and vegetation species. Tukey’s HSD test was applied when significant differences were found (p < 0.05). In the case of EC, CaCO3, TK, and Cu, where data normality could not be achieved, a non-parametric Kruskal–Wallis analysis was applied, and a multiple comparison of mean ranks for all groups was used as a post-hoc test.
A principal component analysis (PCA) was also conducted to examine the relationship between selected soil variables and wildfire severity during the study period. PCA analysis was performed separately for each sampling period in the R 3.6.2 environment [31] using plyr (v1.8.5) and car (v3.0-6) packages and visualized using ggbiplot (v0.55) package. Statistica 12.0 software [32] was used for factorial ANOVA analysis, and additional graphs were created using Plotly Chart Studio [33].

3. Results

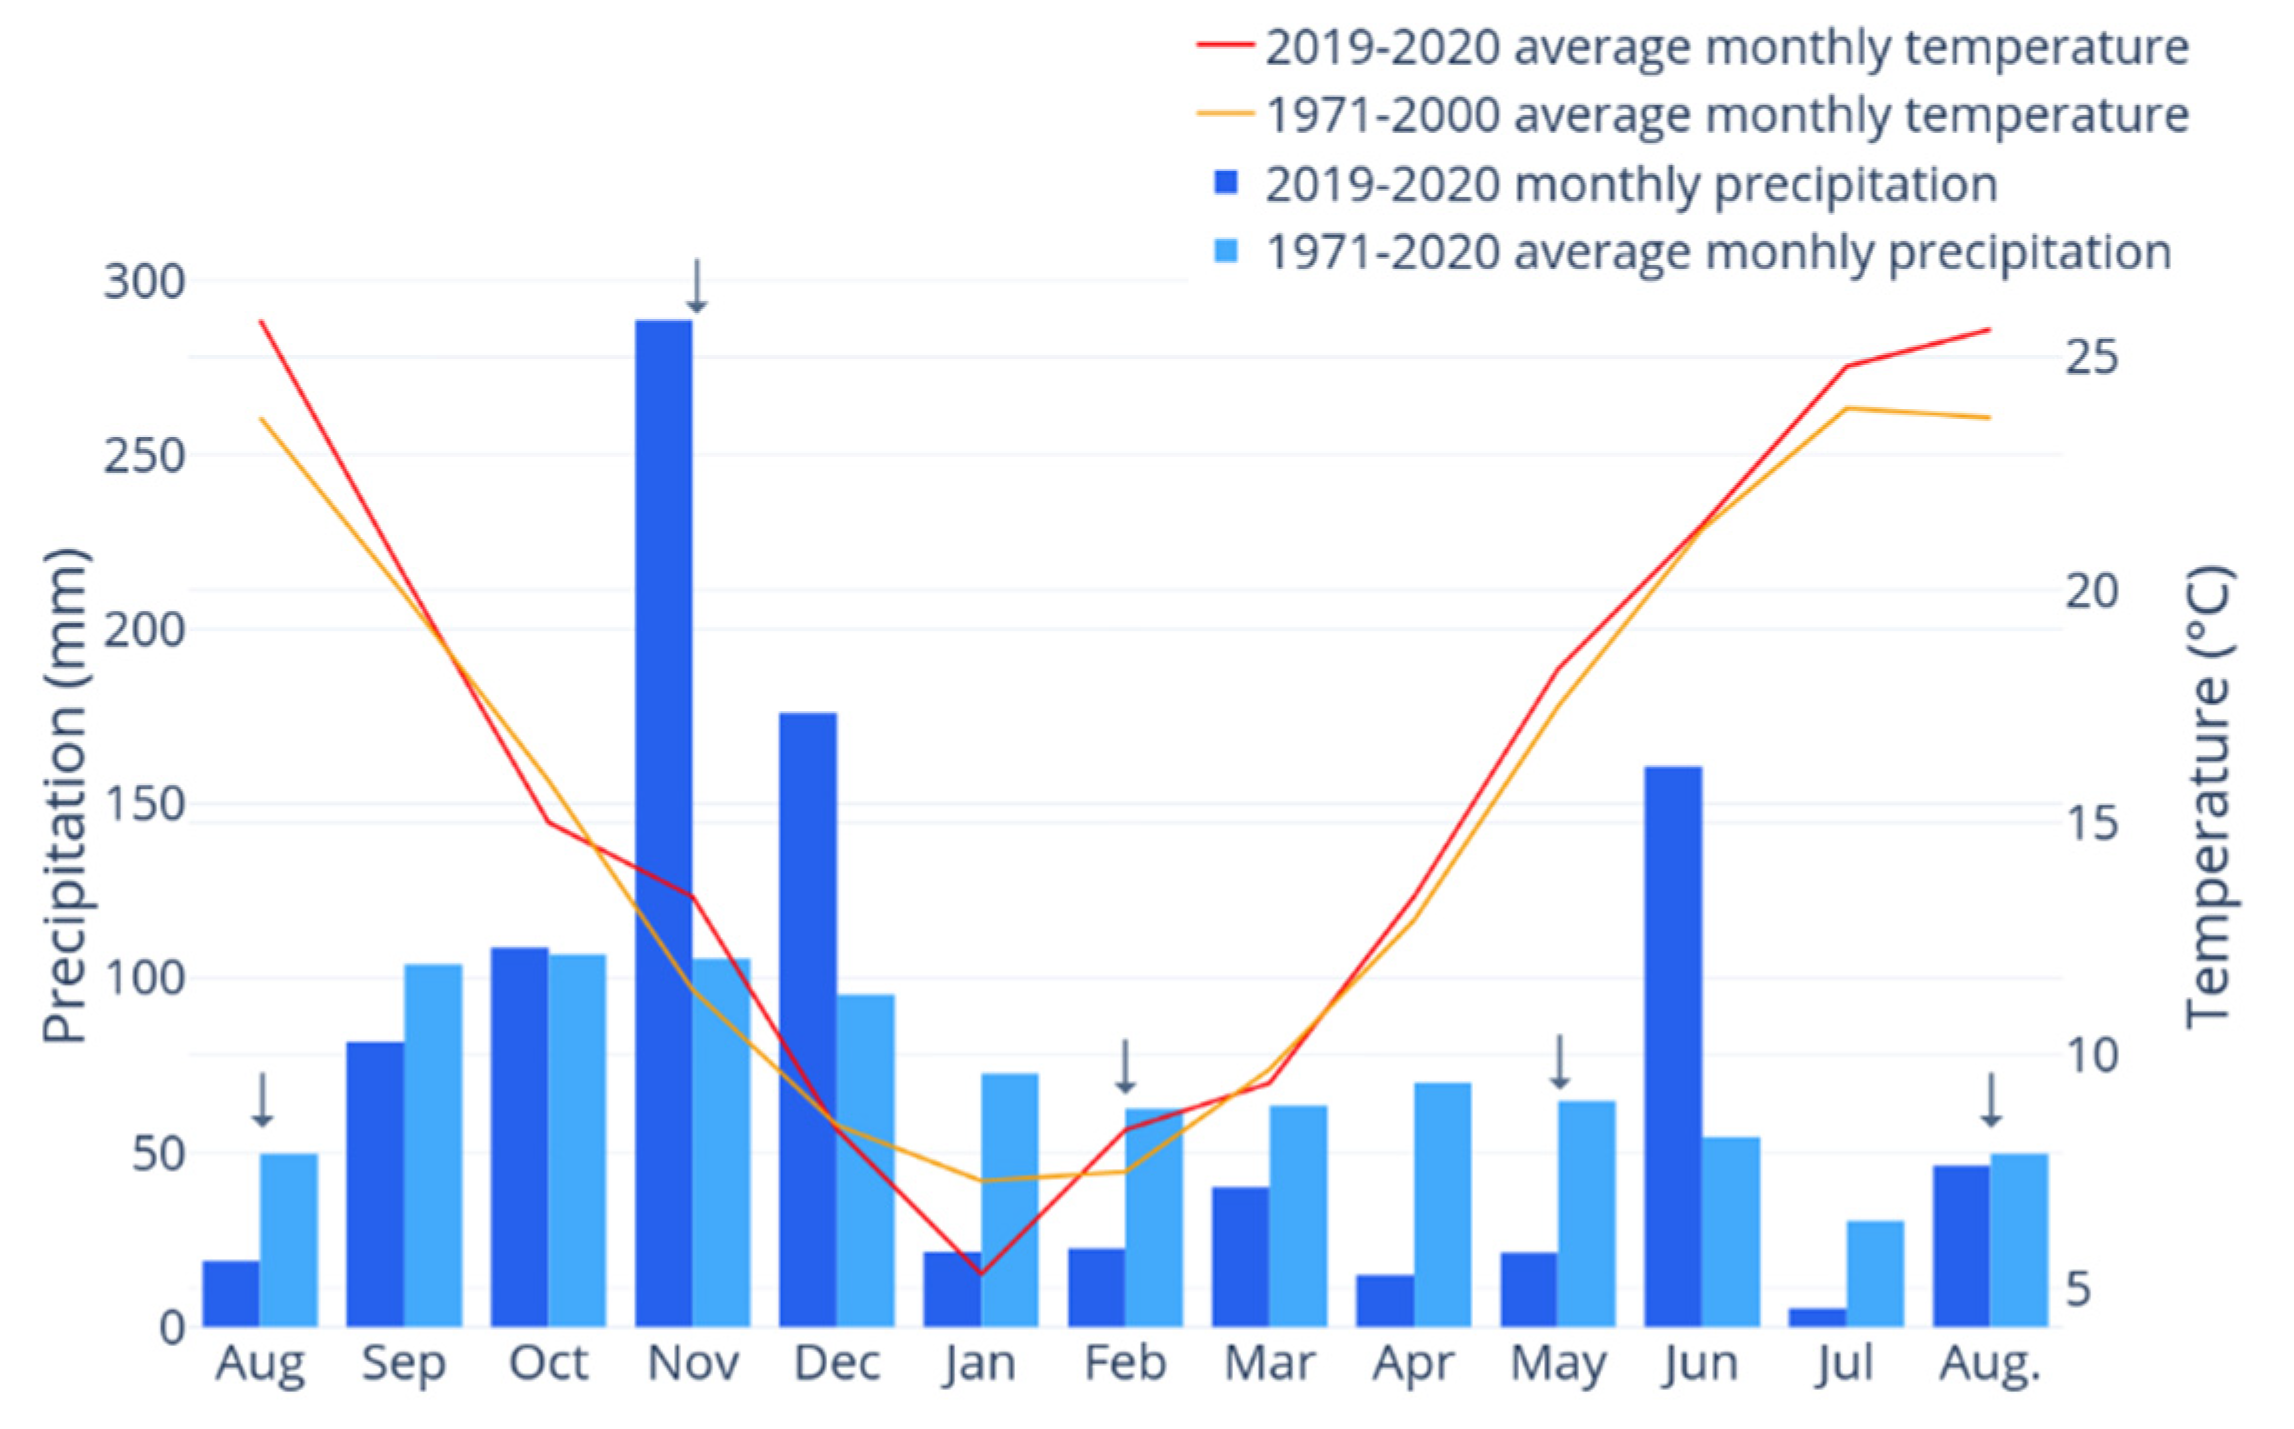
3.1. Meteorological Observations

During the study period, total average precipitation was 959.8 mm, 80.6 mm above the 30-year average (879.2 mm). Precipitation was higher than the average in November and December 2019 and June 2020, while it was lower in January through May 2020 (Figure 2). The monthly average temperature was slightly lower (14.5 °C) than average (14.9 °C) during the study year. The largest difference was observed in January 2020, when the average temperature was 2 °C lower than the 30-year average. The first major precipitation events were recorded about 30 days after the fire, on September 24 and 26, with 19.1 and 44.9 mm of precipitation, respectively.

3.2. Basic Chemical Properties

Factorial and Kruskal–Wallis ANOVA and post-hoc results of soil properties are presented in Table 2, Table 3 and Table 4. All properties studied were significantly affected by fire severity. pH, EC, TOC, TN, TS, and Zn were significantly different for vegetation, while all properties (with the exception of TN) were significantly different between sampling periods (Table 2). The difference between fire severity × vegetation interaction was significant for pH, Fe, and Zn, while the difference between fire severity × time interaction was significant only for pH and TS. Additionally, the difference between vegetation × time was significant for TS. Fire severity × vegetation × time was not significant for any soil property.
Wildfires caused an increase in soil pH, EC, and soil CaCO3 content. Throughout the study period, pH was significantly higher in HS and MS than in C. Soil samples collected under Juniperus communis L. had significantly higher pH values than those collected under Quercus pubescens Willd. (Table 2). Both MS -Q and HS -Q (collected under Quercus pubescens Willd. Vegetation) had significantly higher values than C-Q throughout the monitoring period, with the exception of 6 MAF, where a significant difference in pH was observed only in the HS -Q samples (Table 3). There was no significant difference between C-J and MS -J (taken under Juniperus communis L. vegetation) in 0 MAF and 12 MAF, while significantly higher pH values were observed mainly in HS -J. The overall significantly higher pH values in samples MS and HS persisted until 12 MAF (Table 3).
Soil samples collected under Quercus p. had significantly higher EC values than samples collected under Juniperus c., but no significant differences in CaCO3 were observed in samples from the two vegetation species (Table 2). Both EC and CaCO3 behaved similarly and were significantly higher in HS than in MS and C samples at all sampling times, regardless of the vegetation species under which they were taken (Table 3).
Overall, TOC, TN, and TS content were significantly higher in HS than in MS and C samples collected during the study period and significantly lower in soil samples under Juniperus c. than under Quercus p. (Table 2). Immediately after a wildfire, the higher content of TOC, TN, and TS were evident in HS -Q samples compared to HS -J samples. One year after a wildfire, both MS -Q and HS -Q had significantly higher TOC content than MS -J and HS -J, respectively. Significantly higher TOC and TN content in soil samples under Quercus p. were observed in HS than in C during all sampling periods. Under Juniperus c., significantly higher content of TOC and TN values were observed in HS than in C at 9 MAF. Furthermore, 6 MAF TOC and TN under Juniperus c. were significantly higher in HS than in MS. Additionally, the overall increase in TOC and TN content was significant in HS -Q and MS -Q compared to C-Q throughout the study period, while HS -J and MS -J showed a slight relative increase compared to C-J; however, it was significant only at 6 and 9 MAF (Table 3). In soil samples under Quercus p., a significantly higher TS content was observed in HS compared to C 0, 6, and 9 MAF. Under Juniperus c., a significantly higher TS content was observed in HS compared to C 6 MAF.
Furthermore, TK content was significantly lower in HS in the first 6 months after a fire, while at 9 MAF, whereas it was significantly lower in both HS and MS than in C 9 months after fire (Table 3). No significant differences in TK content were observed in the soil samples taken under different vegetation species (Table 2).

3.3. Soil Trace Elements

During the 12-month observation period, significantly lower Fe and Ni content was observed in HS and MS than in C. HS showed significantly higher Cu and Zn content than MS and C (Table 2). Zn content was significantly higher under Quercus p. (Table 2). Under Quercus p., Fe content was significantly lower in HS than in C and MS during 0 to 9 MAF, while under Juniperus c., on 6 and 12 MAF, Fe content was significantly lower in HS than in MS and C. Moreover, the significant effect of fire severity on Ni content was found mainly in Quercus p. on 3 and 6 MAF (Table 4). Ni concentrations were significantly lower in HS than in MS and C (Table 2).
The significantly lower Cu content was observed at 0 and 9 MAF in C than at MS, which was collected under both Quercus p. and Juniperus c. (Table 4). In addition, significantly higher Zn content was observed under Quercus p. at 3 and 12 MAF in HS than in C and MS. Among Juniperus c., at 6 MAF, significantly more Zn was seen in C and HS than in MS.

3.4. Multivariate Analysis

For each sample date, a matrix was constructed with three principal components, with the corresponding proportion of variance explained by them, as well as the variables with the highest loadings (Table 5). The relationship between PC1 and PC2 for each corresponding sampling time is shown in Figure 3. The variables with the highest loadings do not differ much between sampling dates. These are TOC, TN, and EC in PC1, which explain 35 to 54% of the variance in all sampling dates, and Ni, Cu, Zn, and Fe in PC2, which account for 17 to 24% of the total variance throughout the sampling period. The remainder of 11 to 15% of the variance can be attributed to high pH, CaCO3, and TS loadings in PC3.
The relationships between PC1 and PC2 shown in the graphs reveal that pH, EC, CaCO3, TN, TS, and TOC are positively correlated and are most responsible for separating the C, MS, and HS groups. In addition, the graph for 0 MAF shows that EC, CaCO3, TN, TS, and TOC are inversely related to TK and Fe content, and while this relationship persists at 12 MAF, it is less pronounced for Fe.

4. Discussion

4.1. Basic Chemical Properties

Soil pH values were significantly higher on both MS and HS than on C taken under both vegetation species during the entire study period. The observed increase was due to the combustion of above-ground organic matter, which produced large quantities of ash containing base cations [28,29,34], and to the loss of hydroxyl groups (-OH) and organic acids during the oxidation process of burning [35]. At 12 MAF, the observed pH values were still significantly higher at MS and HS than at C, which was consistent with previous studies that reported high pH values one year [1,36] and up to two years post-fire [37,38]. Higher pH in Juniperus c. samples was consistent with a study by Huang et al. [39] that found a relationship between increasing SOM content and a decrease in pH due to the release of organic acids following SOM decomposition. In this study, Juniperus c. samples had lower TOC contents and consequently higher pH values.
Higher levels of EC and CaCO3 content were also observed in burned areas. However, significantly higher values were only observed in HS, while MS was not significantly different from C. High values of EC and CaCO3 in HS soil samples observed under both vegetation species and throughout the study period might have resulted from the burning of organic matter, which produced high levels of inorganic ions [40]. However, many authors reported increased EC to be ephemeral and recorded its recovery to pre-fire levels within a year, i.e., 8 months [41] and 12 months post-fire [37]. In this study, the increased EC values 12 MAF persisted in HS samples, although they began to show signs of decline, possibly due to the effects of rainfall, ion leaching [42], or nutrient uptake by plants [43]. High EC values 6 MAF could be related to the overall slower recovery of vegetation in HS compared to MS, considering that EC is a measure of soil salinity that negatively affects plant germination [44]. The absence of vegetation recovery in HS was observed in the first 6 months, and recovery began to be visible after 9 months (both vegetation types), although some sites remained without significant vegetation growth after this time.
The initial increase in CaCO3 content, especially at 3 and 6 MAF, showed a declining trend at 12 MAF in HS. This could be attributed to the alkaline oxides in the ash reacting with atmospheric CO2 and water vapour, resulting in the formation of soluble hydroxides and carbonates in the soil [45,46]. Moreover, Goforth et al. [46] observed that white ash originating from completely combusted organic matter contained more alkaline oxides available to form carbonates, supporting the significantly higher content found in this study in HS areas.
In this study, there was a significant increase in TOC content in the HS soil samples compared to MS and C, and no change in MS compared to the C samples throughout the study period. The higher TOC content in the samples from HS could be caused by residual ash and charred residue after the combustion of organic matter incorporated within the soil. Namely, the combustion of organic material leads to the formation of aromatic compounds that may be more recalcitrant to decomposition [47], which could explain the increase in TOC in HS. These findings coincide with a study by Muráňová and Šimanský [48], who observed a 24% increase in SOM in high-severity fires.
The more pronounced increase in TOC content in burned Quercus p. compared to burned Juniperus c. area could be related to the greater overall amount of biomass in Quercus p. vegetation (i.e., fuel) available for combustion and subsequent incorporation into the soil, as well as the different nutrient composition of the two vegetation species [49]. This assumption stems from the fact that the interaction between fire severity and vegetation factor was not significant, implying that further research is needed to determine the reasons for this discrepancy.
Nevertheless, the higher content of soil nutrients in the form of TOC and TN in MS -Q and HS -Q compared to MS -J and HS -J suggested that the wildfire caused an increase that was beneficial for the regrowth and development of Quercus p. seedlings that began to grow in the spring after the fire (9 MAF).
Similar to TOC and TN content, significantly higher TS content was found in the HS samples compared to the MS and C samples, and the increase was equally pronounced in both vegetation species. The TS content returned to pre-fire levels after 12 months, which is in agreement with a study by Kong et al. [50] that observed an initial increase in this soil nutrient and its rapid recovery to pre-fire levels. Although the increase was evident, the seasonality of TS content appeared to remain relatively unchanged during the monitoring period and was highest in 9 MAFs at both C and MS and HS, most likely due to accelerated mineralization at higher temperatures and plant uptake rather than the effects of a wildfire [51].
The content of TK was the only soil property that decreased 0 MAF in both MS and HS. However, this change appears to be temporary because 12 MAF content in MS and HS did not differ from that of unburned soils. Caon et al. [52], Litton and Santelices [53], Simelton [53], Úbeda et al. [54], and Xue et al. [36] reported a continuous decrease in total and exchangeable potassium in the time-since-fire period. The decrease observed in this study could have further been caused by the above-average rainfall in November and December 2019 (Figure 2), which resulted in consistent depletion of potassium through leaching and plant uptake [55].

4.2. Soil Trace Elements

After the wildfire, a decrease in Fe and Ni content was observed in MS and HS. In general, the main source of these elements is mineral soil [15,55]. However, under favourable pH conditions (between 6.5 and 7.5), Fe and Ni form complexes with organic acids in the SOM [56,57], and it is possible that these compounds volatilised as a result of the high wildfire temperatures. A similar observation was made by Delač et al. [58], who found significantly lower Fe content in the post-fire period in burned areas due to leaching and plant consumption. Furthermore, source rocks containing crystallised Fe oxides are also known to contain certain amounts of Ni [59], and this is why they are highly correlated throughout the study period (Figure 3). Santorufo et al. [60] and Fernández et al. [61] also observed a decrease in Fe and Ni during the post-fire period.
A significant increase in Cu and Zn content was observed in the soil samples from HS, while it was not significant in MS compared to C throughout the study period. These results could be explained by the fact that, in addition to mineral soil, biomass is an important source of Cu and Zn in the soil [15,56], so the ash incorporated into the soil after the combustion of vegetation most likely increased the content of these elements in the topsoil of HS. Notably, in the samples from HS, the entire canopy was burned, and no leaves were left on the branches of the burned trees, while in MS, some leaves remained untouched by the fire, which meant that quantitatively not as much ash reached the soil surface. Additionally, ash from lower severity fires contain a greater amount of incompletely combusted material and thus more organic compounds [62], which could have led to the formation of complex ligands that affect the bioavailability and mobility of Zn and Cu in the soil. This is most likely the reason why the effects of a medium wildfire severity are less pronounced throughout the study period. Mitic et al. [63] also found that Zn and Cu levels increased after a fire.
Moreover, at this stage, we can rule out the possibility that elevated concentrations of trace elements Cu, Ni, and Zn in the studied soils are an environmental problem. According to the Croatian legislation [64], the maximum permissible levels for pollutants in agricultural soils in Croatia are 150, 75, and 200 mg/kg for Cu, Ni, and Zn, respectively. Although this legislation concerns agricultural soils, it is the only available reference to determine whether the concentrations are likely to cause environmental damage. The established limits were not exceeded even in the immediate post-fire period. Only the Ni content was found to be borderline problematic at the beginning of the sampling campaign in August 2019. However, the elevated concentrations were found in both unburned and burned soil, suggesting that other external factors were the cause of this occurrence. Further studies are needed to confirm that other factors may have compromised soil health, as these metals can be involved in a number of complex chemical and biological interactions that are beyond the scope of this investigation.

4.3. Interrelations between Properties

PCA analysis revealed similar relationships between soil properties in PC1 and PC2 in all 5 sampling intervals (Figure 3) and identified pH, EC, CaCO3, TOC, TN, and TS as the group of variables most affected by wildfire severity. These properties were inversely related to TK throughout the study period. This indicates that the former increased and the latter decreased after a wildfire. Additionally, Fe was also inversely related to the first group 0 MAF, suggesting that it was the trace element most affected by the fire, although this relationship decreased with time. Furthermore, PCA analysis identified the highly correlated Fe and Ni from parent rock and Cu and Zn from biomass as two separate groups of variables that were less affected by the wildfire. As expected, the greater impact of HS compared to MS is most evident at 0 MAF. At 9 MAF, the difference between HS and MS is least pronounced, likely due to intense vegetation recovery in the spring. The simultaneous recovery of vegetation and soil properties was also observed by Muñoz-Rojas et al. [42]. Previous studies also observed the correlated relationships between pH, EC, TN, and TOC in burned soils and concluded that soil system recovery could take years [12,58,65].

4.4. Implications for Soil Management

Mediterranean ecosystems are adapted to wildfire, so in many situations, there is no need for post-fire management activities [28]. In areas more susceptible to soil degradation, such as hillsides, post-fire management is desirable [66] but not often used. Most post-fire management practices include mulching to reduce soil runoff and erosion on slopes or adding organic amendments to help soil nutrient recovery [67]. Other practices include afforestation and seeding, salvage logging, erosion barriers, or soil preparation. None of the above practices has been tested under current conditions. However, given the soil conditions and visual observations, it is important to mention that the rapid growth of vegetation in the study area in spring 2020 (9 MAF) indicates continued ecosystem recovery. The recuperation could be further supported by the fact that the wildfire occurred in an area with well-developed Cambisols, which are characterised by favourable aggregate structure and high content of weatherable minerals [27] that provide the nutrients needed for resprouting. This suggests that this Mediterranean locality is well adapted to wildfires. Moreover, nutrient-rich soil and no risk of erosion by water support the “leave as-is” recommendation in this area. However, considering that forest managers typically conduct post-fire restoration activities such as salvage logging, burned tree removal, tillage, and reforestation, the vegetation used as a factor in this study could be useful for conducting future activities in a similar setting. The greater soil disturbance observed at HS compared to MS appears to depend on vegetation composition and should be considered in post-fire management. Although not directly measured, the authors visually observed vigorous new sprouting of Quercus p. in the spring after wildfire (9 MAF), while Juniperus c. exhibited low intensity of new sprouting, especially in HS. Therefore, in the case of reforestation of the study area, the results suggest that Quercus p. would be more suitable because the soil under Quercus p. had higher TOC and TN content, especially in HS, compared to Juniperus c. As both carbon and nitrogen are essential for plant growth and development, in the event of future fire occurrence, the higher soil TOC and TN content would provide the essential nutrients for faster vegetation recovery.
Vegetation was shown in this study to be an important factor controlling soil quality after a fire and should be taken into consideration for future management activities.

5. Conclusions

The studied wildfire had a disturbing impact on the soil, especially in the HS treatment. Significantly higher levels of soil pH, EC and CaCO3, TOC, TN, Cu, and Zn content were observed throughout the study period, especially in HS, most likely due to the slow recovery of vegetation. TOC and TN content were higher under Quercus pubescens Willd. than under Juniperus communis L., especially during the first three months, which may be attributed to the overall higher initial fuel quantity of the former. Moreover, the increase in Cu and Zn content in HS was due to the complete canopy combustion.
Under Juniperus c., TOC and TN content at HS returned to pre-fire levels 12 MAF, while the persistently higher levels at HS under Quercus p. may be due to the higher biomass and higher wildfire resistance of Quercus p. species. Elevated soil pH, EC, and CaCO3 content persisted in both HS -J and HS -Q 1 year after a fire, indicating that more than 12 months are required for soil system recovery. Multivariate analysis showed a positive correlation between pH, EC, CaCO3, TOC, TN, and TS content and identified them as most affected by wildfire severity. The difference between the HS and MS categories was less visible 9 and 12 MAF, indicating that recovery of the soil system was underway. The differences in soil disturbance under HS and MS depend on vegetation composition and suggest that this factor should be imperatively considered in post-fire management. Namely, the higher TOC and TN content observed in Quercus p., especially in HS, suggests that this deciduous species is a more suitable choice for reforestation than the coniferous Juniperus c. However, the differences in the properties studied among vegetation types and their evolution over time suggest that further research on the recovery process of soil properties is recommended to understand the mechanisms of long-term soil recovery better.

Author Contributions

Conceptualization, I.H., I.B. and P.P.; methodology, I.B. and P.P.; software, I.H. and I.Š.; validation, I.H., I.B. and I.Š.; formal analysis, I.H., I.B. and D.D.; investigation, I.H., I.B., I.Š. and P.P.; resources, I.B. and I.Š.; writing—original draft preparation, I.H.; writing—review and editing, I.H., I.Š., I.B. and D.D.; visualization, I.H.; supervision, I.B., I.Š. and P.P.; project administration, I.B. and I.Š.; funding acquisition, I.B. All authors have read and agreed to the published version of the manuscript.

Funding

This research was funded by CROATIAN SCIENCE FOUNDATION through the project “Soil erosion and degradation in Croatia” (UIP-2017-05-7834) (SEDCRO).

Institutional Review Board Statement

Not applicable.

Informed Consent Statement

Not applicable.

Data Availability Statement

The data presented in this study are available on request from the corresponding author. The data are not publicly available due to their current usage for the preparation of another draft for publication.

Conflicts of Interest

The authors declare no conflict of interest. The funders had no role in the design of the study; in the collection, analyses, or interpretation of data; in the writing of the manuscript, or in the decision to publish the results.

References

  1. Alcañiz, M.; Outeiro, L.; Francos, M.; Farguell, J.; Úbeda, X. Long-Term Dynamics of Soil Chemical Properties after a Prescribed Fire in a Mediterranean Forest (Montgrí Massif, Catalonia, Spain). Sci. Total Environ. 2016, 572, 1329–1335. [Google Scholar] [CrossRef] [PubMed]
  2. Pausas, J.G.; Llovet, J.; Rodrigo, A.; Vallejo, R. Are Wildfires a Disaster in the Mediterranean Basin?-A Review. Int. J. Wildland Fire 2008, 17, 713. [Google Scholar] [CrossRef]
  3. Halofsky, J.E.; Peterson, D.L.; Harvey, B.J. Changing Wildfire, Changing Forests: The Effects of Climate Change on Fire Regimes and Vegetation in the Pacific Northwest, USA. Fire Ecol. 2020, 16, 4. [Google Scholar] [CrossRef] [Green Version]
  4. Pavlek, K.; Bišćević, F.; Furčić, P.; Grđan, A.; Gugić, V.; Malešić, N.; Moharić, P.; Vragović, V.; Fuerst-Bjeliš, B.; Cvitanović, M. Spatial Patterns and Drivers of Fire Occurrence in a Mediterranean Environment: A Case Study of Southern Croatia. Geogr. Tidsskr. Dan. J. Geogr. 2017, 117, 22–35. [Google Scholar] [CrossRef] [Green Version]
  5. Westerling, A.L. Increasing Western US Forest Wildfire Activity: Sensitivity to Changes in the Timing of Spring. Phil. Trans. R. Soc. B 2016, 371, 20150178. [Google Scholar] [CrossRef] [PubMed]
  6. IPCC. Climate Change 2013: The Physical Science Basis. Contribution of Working Group I to the Fifth Assessment Report of the Intergovernmental Panel on Climate Change; Stocker, T.F., Qin, D., Plattner, G.-K., Tignor, M., Allen, S.K., Boschung, J., Nauels, A., Xia, Y., Bex, V., Midgley, P.M., Eds.; Cambridge University Press: Cambridge, UK, 2013; Available online: https://www.ipcc.ch/report/ar5/wg1/ (accessed on 5 May 2022).
  7. Pausas, J.G.; Keeley, J.E. Wildfires as an Ecosystem Service. Front. Ecol. Environ. 2019, 17, 289–295. [Google Scholar] [CrossRef] [Green Version]
  8. Pereira, P.; Francos, M.; Brevik, E.C.; Ubeda, X.; Bogunovic, I. Post-Fire Soil Management. Curr. Opin. Environ. Sci. Health 2018, 5, 26–32. [Google Scholar] [CrossRef]
  9. Moya, D.; González-De Vega, S.; Lozano, E.; García-Orenes, F.; Mataix-Solera, J.; Lucas-Borja, M.E.; de las Heras, J. The Burn Severity and Plant Recovery Relationship Affect the Biological and Chemical Soil Properties of Pinus Halepensis Mill. Stands in the Short and Mid-Terms after Wildfire. J. Environ. Manag. 2019, 235, 250–256. [Google Scholar] [CrossRef] [PubMed]
  10. Dzwonko, Z.; Loster, S.; Gawroński, S. Impact of Fire Severity on Soil Properties and the Development of Tree and Shrub Species in a Scots Pine Moist Forest Site in Southern Poland. For. Ecol. Manag. 2015, 342, 56–63. [Google Scholar] [CrossRef]
  11. Lombao, A.; Barreiro, A.; Carballas, T.; Fontúrbel, M.T.; Martín, A.; Vega, J.A.; Fernández, C.; Díaz-Raviña, M. Changes in Soil Properties after a Wildfire in Fragas Do Eume Natural Park (Galicia, NW Spain). Catena 2015, 135, 409–418. [Google Scholar] [CrossRef]
  12. Francos, M.; Úbeda, X.; Pereira, P.; Alcañiz, M. Long-Term Impact of Wildfire on Soils Exposed to Different Fire Severities. A Case Study in Cadiretes Massif (NE Iberian Peninsula). Sci. Total Environ. 2018, 615, 664–671. [Google Scholar] [CrossRef] [PubMed]
  13. Murphy, S.F.; McCleskey, R.B.; Martin, D.A.; Holloway, J.M.; Writer, J.H. Wildfire-Driven Changes in Hydrology Mobilize Arsenic and Metals from Legacy Mine Waste. Sci. Total Environ. 2020, 743, 140635. [Google Scholar] [CrossRef]
  14. Harper, A.R.; Santin, C.; Doerr, S.H.; Froyd, C.A.; Albini, D.; Otero, X.L.; Viñas, L.; Pérez-Fernández, B. Chemical Composition of Wildfire Ash Produced in Contrasting Ecosystems and Its Toxicity to Daphnia Magna. Int. J. Wildland Fire 2019, 28, 726. [Google Scholar] [CrossRef] [Green Version]
  15. Santín, C.; Doerr, S.H.; Otero, X.L.; Chafer, C.J. Quantity, Composition and Water Contamination Potential of Ash Produced under Different Wildfire Severities. Environ. Res. 2015, 142, 297–308. [Google Scholar] [CrossRef] [PubMed] [Green Version]
  16. Fernández, S.; Cotos-Yáñez, T.; Roca-Pardiñas, J.; Ordóñez, C. Geographically Weighted Principal Components Analysis to Assess Diffuse Pollution Sources of Soil Heavy Metal: Application to Rough Mountain Areas in Northwest Spain. Geoderma 2018, 311, 120–129. [Google Scholar] [CrossRef] [Green Version]
  17. Li, C.; Zhou, K.; Qin, W.; Tian, C.; Qi, M.; Yan, X.; Han, W. A Review on Heavy Metals Contamination in Soil: Effects, Sources, and Remediation Techniques. Soil Sediment Contam. 2019, 28, 380–394. [Google Scholar] [CrossRef]
  18. Zald, H.S.J.; Dunn, C.J. Severe Fire Weather and Intensive Forest Management Increase Fire Severity in a Multi-Ownership Landscape. Ecol. Appl. 2018, 28, 1068–1080. [Google Scholar] [CrossRef]
  19. Stavi, I. Wildfires in Grasslands and Shrublands: A Review of Impacts on Vegetation, Soil, Hydrology, and Geomorphology. Water 2019, 11, 1042. [Google Scholar] [CrossRef] [Green Version]
  20. Bond, W. Fires, Ecological Effects of. In Encyclopedia of Biodiversity; Academic Press: Cambridge, MA, USA, 2001; Volume 2, pp. 745–753. [Google Scholar]
  21. Pereira, P.; Bogunovic, I.; Zhao, W.; Barcelo, D. Short-Term Effect of Wildfires and Prescribed Fires on Ecosystem Services. Curr. Opin. Environ. Sci. Health 2021, 22, 100266. [Google Scholar] [CrossRef]
  22. Birch, D.S.; Morgan, P.; Kolden, C.A.; Abatzoglou, J.T.; Dillon, G.K.; Hudak, A.T.; Smith, A.M.S. Vegetation, Topography and Daily Weather Influenced Burn Severity in Central Idaho and Western Montana Forests. Ecosphere 2015, 6, 1–23. [Google Scholar] [CrossRef]
  23. Caldwell, P.V.; Elliott, K.J.; Liu, N.; Vose, J.M.; Zietlow, D.R.; Knoepp, J.D. Watershed-scale Vegetation, Water Quantity, and Water Quality Responses to Wildfire in the Southern Appalachian Mountain Region, United States. Hydrol. Process 2020, 34, 5188–5209. [Google Scholar] [CrossRef]
  24. Fernández-Guisuraga, J.M.; Suárez-Seoane, S.; García-Llamas, P.; Calvo, L. Vegetation Structure Parameters Determine High Burn Severity Likelihood in Different Ecosystem Types: A Case Study in a Burned Mediterranean Landscape. J. Environ. Manag. 2021, 288, 112462. [Google Scholar] [CrossRef]
  25. Kottek, M.; Grieser, J.; Beck, C.; Rudolf, B.; Rubel, F. World Map of the Köppen-Geiger Climate Classification Updated. Metz 2006, 15, 259–263. [Google Scholar] [CrossRef]
  26. Zaninović, K.; Gajić Čapka, M.; Perčec Tadić, M.; Vučetić, M. Klimatski Atlas Hrvatske Climate Atlas of Croatia 1961–1990. 1971–2000; Državni hidrometeorološki zavod: Zagreb, Croatia, 2008; ISBN 978-953-7526-01-6. [Google Scholar]
  27. IUSS Working Group WRB. World Reference Base for Soil Resources 2014, Update 2015: International Soil Classification System for Naming Soils and Creating Legends for Soil Maps; World Soil Resources Reports No. 106; FAO: Rome, Italy, 2015; p. 192. [Google Scholar]
  28. Pereira, P.; Brevik, E.; Bogunović, I.; Ferran, E.-S. Ash and soils: A Close Relationship in Fire-Affected Areas. In Fire Effects on Soil Properties; Pereira, P., Mataix-Solera, J., Úbeda, X., Rein, G., Cerdà, A., Eds.; CSIRO Publishing: Clayton, Australia, 2019; ISBN 9781486308149. [Google Scholar]
  29. Úbeda, X.; Pereira, P.; Outeiro, L.; Martin, D.A. Effects of Fire Temperature on the Physical and Chemical Characteristics of the Ash from Two Plots of Cork Oak (Quercus Suber). Land Degrad. Dev. 2009, 20, 589–608. [Google Scholar] [CrossRef] [Green Version]
  30. Kannan, K.S.; Manoj, K.; Arumugam, S. Labeling methods for identifying outliers. Int. J. Stat. Syst. 2015, 10, 231–238. [Google Scholar]
  31. R Core Team. R: A Language and Environment for Statistical Computing. Available online: https://www.r-project.org (accessed on 3 April 2021).
  32. StatSoft, Inc. STATISTICA (Data Analysis Software System), Version 12.0. Available online: https://www.statsoft.de/en/home (accessed on 12 January 2022).
  33. Plotly Technologies Inc. Collaborative Data Science. Available online: https://plot.ly (accessed on 26 April 2022).
  34. Alcañiz, M.; Outeiro, L.; Francos, M.; Úbeda, X. Effects of Prescribed Fires on Soil Properties: A Review. Sci. Total Environ. 2018, 613, 944–957. [Google Scholar] [CrossRef]
  35. Heydari, M.; Rostamy, A.; Najafi, F.; Dey, D.C. Effect of Fire Severity on Physical and Biochemical Soil Properties in Zagros Oak (Quercus Brantii Lindl.) Forests in Iran. J. For. Res. 2017, 28, 95–104. [Google Scholar] [CrossRef]
  36. Xue, L.; Li, Q.; Chen, H. Effects of a Wildfire on Selected Physical, Chemical and Biochemical Soil Properties in a Pinus Massoniana Forest in South China. Forests 2014, 5, 2947–2966. [Google Scholar] [CrossRef] [Green Version]
  37. Granged, A.J.P.; Zavala, L.M.; Jordán, A.; Bárcenas-Moreno, G. Post-Fire Evolution of Soil Properties and Vegetation Cover in a Mediterranean Heathland after Experimental Burning: A 3-Year Study. Geoderma 2011, 164, 85–94. [Google Scholar] [CrossRef]
  38. Litton, C.M.; Santelices, R. Effect of wildfire on soil physical and chemical properties in a Nothofagus glauca forest, Chile. Rev. Chil. De Hist. Nat. 2003, 76, 529–542. [Google Scholar] [CrossRef]
  39. Huang, Y.; Wu, L.; Yu, J. Relationships between soil organic matter content (SOM) and pH in topsoil of zonal soils in China. Acta Pedol. Sin. 2009, 46, 851–860. [Google Scholar]
  40. Certini, G. Effects of Fire on Properties of Forest Soils: A Review. Oecologia 2005, 143, 1–10. [Google Scholar] [CrossRef]
  41. Kutiel, P.; Inbar, M. Fire Impacts on Soil Nutrients and Soil Erosion in a Mediterranean Pine Forest Plantation. Catena 1993, 20, 129–139. [Google Scholar] [CrossRef]
  42. Muñoz-Rojas, M.; Erickson, T.E.; Martini, D.; Dixon, K.W.; Merritt, D.J. Soil Physicochemical and Microbiological Indicators of Short, Medium and Long Term Post-Fire Recovery in Semi-Arid Ecosystems. Ecol. Indic. 2016, 63, 14–22. [Google Scholar] [CrossRef]
  43. Pereira, P.; Cerda, A.; Martin, D.; Úbeda, X.; Depellegrin, D.; Novara, A.; Martínez-Murillo, J.F.; Brevik, E.C.; Menshov, O.; Comino, J.R.; et al. Short-Term Low-Severity Spring Grassland Fire Impacts on Soil Extractable Elements and Soil Ratios in Lithuania. Sci. Total Environ. 2017, 578, 469–475. [Google Scholar] [CrossRef] [Green Version]
  44. Moreno-Casasola, P. Dunes. In Encyclopedia of Ecology; Jorgensen, S.E., Fath, B., Eds.; Elsevier: Amsterdam, The Netherlands, 2008. [Google Scholar]
  45. Ulery, A.L.; Graham, R.C.; Amrhein, C. Wood-ash composition and soil pH following intense burning. Soil Sci. 1993, 156, 358–364. [Google Scholar] [CrossRef]
  46. Goforth, B.R.; Graham, R.C.; Hubbert, K.R.; Zanner, C.W.; Minnich, R.A. Spatial Distribution and Properties of Ash and Thermally Altered Soils after High-Severity Forest Fire, Southern California. Int. J. Wildland Fire 2005, 14, 343. [Google Scholar] [CrossRef]
  47. Santín, C.; Doerr, S.H. Carbon. In Fire Effects on Soil Properties; Pereira, P., Mataix-Solera, J., Úbeda, X., Rein, G., Cerdà, A., Eds.; CSIRO Publishing: Clayton, Australia, 2019; ISBN 9781486308149. [Google Scholar]
  48. Muráňová, K.; Šimanský, V. The effect of different severity of fire on soil organic matter and aggregates stability. Acta Fytotech. Zootech. 2015, 18, 1–5. [Google Scholar] [CrossRef] [Green Version]
  49. Iglesias, T.; Cala, V.; Gonzalez, J. Mineralogical and Chemical Modifications in Soils Affected by a Forest Fire in the Mediterranean Area. Sci. Total Environ. 1997, 204, 89–96. [Google Scholar] [CrossRef]
  50. Kong, J.; Yang, J.; Bai, E. Long-Term Effects of Wildfire on Available Soil Nutrient Composition and Stoichiometry in a Chinese Boreal Forest. Sci. Total Environ. 2018, 642, 1353–1361. [Google Scholar] [CrossRef] [PubMed]
  51. Williams, C. Seasonal Fluctuations in Mineral Sulphur under Subterranean Clover Pasture in Southern New South Wales. Soil Res. 1968, 6, 131. [Google Scholar] [CrossRef]
  52. Caon, L.; Vallejo, V.R.; Ritsema, C.J.; Geissen, V. Effects of Wildfire on Soil Nutrients in Mediterranean Ecosystems. Earth Sci. Rev. 2014, 139, 47–58. [Google Scholar] [CrossRef]
  53. Simelton, E. Texture and Nutrient Status in the Topsoil Six Years after Low and High Intensity Wildfires, NE Catalonia, Spain. Ph.D. Thesis, Earth Sciences Centre, Göteborg University, Gothenburg, Sweden, 2001. [Google Scholar]
  54. Úbeda, X.; Bernia, S.; Simelton, E. Chapter 6 The Long-Term Effects on Soil Properties from a Forest Fire of Varying Intensity in a Mediterranean Environment. In Developments in Earth Surface Processes; Elsevier: Amsterdam, The Netherlands, 2005; Volume 7, pp. 87–102. ISBN 978-0-444-52084-5. [Google Scholar]
  55. Lasanta, T.; Cerdà, A. Long-Term Erosional Responses after Fire in the Central Spanish Pyrenees. Catena 2005, 60, 81–100. [Google Scholar] [CrossRef]
  56. Burton, C.A.; Hoefen, T.M.; Plumlee, G.S.; Baumberger, K.L.; Backlin, A.R.; Gallegos, E.; Fisher, R.N. Trace Elements in Stormflow, Ash, and Burned Soil Following the 2009 Station Fire in Southern California. PLoS ONE 2016, 11, e0153372. [Google Scholar] [CrossRef]
  57. Mellis, E.V.; Cruz, M.C.P.d.; Casagrande, J.C. Nickel Adsorption by Soils in Relation to pH, Organic Matter, and Iron Oxides. Sci. Agric. 2004, 61, 190–195. [Google Scholar] [CrossRef] [Green Version]
  58. Delač, D.; Kisić, I.; Bogunović, I.; Pereira, P. Temporal Impacts of Pile Burning on Vegetation Regrowth and Soil Properties in a Mediterranean Environment (Croatia). Sci. Total Environ. 2021, 799, 149318. [Google Scholar] [CrossRef]
  59. Massoura, S.T.; Echevarria, G.; Becquer, T.; Ghanbaja, J.; Leclerc-Cessac, E.; Morel, J.-L. Control of Nickel Availability by Nickel Bearing Minerals in Natural and Anthropogenic Soils. Geoderma 2006, 136, 28–37. [Google Scholar] [CrossRef]
  60. Santorufo, L.; Memoli, V.; Panico, S.C.; Santini, G.; Barile, R.; Di Natale, G.; Trifuoggi, M.; De Marco, A.; Maisto, G. Early Post-Fire Changes in Properties of Andosols within a Mediterranean Area. Geoderma 2021, 394, 115016. [Google Scholar] [CrossRef]
  61. Fernández, I.; Cabaneiro, A.; Carballas, T. Organic Matter Changes Immediately after a Wildfire in an Atlantic Forest Soil and Comparison with Laboratory Soil Heating. Soil Biol. Biochem. 1997, 29, 1–11. [Google Scholar] [CrossRef]
  62. Pereira, P.; Jordán, A.; Cerdà, A.; Martin, D. Editorial: The role of ash in fire-affected ecosystems. Catena 2014, 135, 337–339. [Google Scholar] [CrossRef]
  63. Mitić, V.D.; Stankov Jovanović, V.P.; Ilić, M.D.; Nikolić Mandić, S.D. Impact of Wildfire on Soil Characteristics and Some Metal Content in Selected Plants Species of Geraniaceae Family. Environ. Earth Sci. 2015, 73, 4581–4594. [Google Scholar] [CrossRef]
  64. Ministry of Agriculture. Regulation on the Protection of the Agricultural Land from Pollution; Official Gazette 71/2019; Narodne Novine: Zagreb, Croatia, 2019. Available online: https://narodne-novine.nn.hr/clanci/sluzbeni/2019_07_71_1507.html (accessed on 6 May 2022). (In Croa)
  65. Francos, M.; Úbeda, X.; Pereira, P. Impact of Torrential Rainfall and Salvage Logging on Post-Wildfire Soil Properties in NE Iberian Peninsula. Catena 2019, 177, 210–218. [Google Scholar] [CrossRef]
  66. Prats, S.; Malvar, M.; Martins, M.A.S.; Keizer, J.J. Post-fire soil erosion mitigation: A review of the last research and techniques developed in Portugal. Cuadernos de Investigación Geográfica 2014, 40, 403–428. [Google Scholar] [CrossRef] [Green Version]
  67. Fontúrbel, M.T.; Barreiro, A.; Vega, J.A.; Martín, A.; Jiménez, E.; Carballas, T.; Fernández, C.; Díaz-Raviña, M. Effects of an Experimental Fire and Post-Fire Stabilization Treatments on Soil Microbial Communities. Geoderma 2012, 191, 51–60. [Google Scholar] [CrossRef]
Figure 1. Study area and experimental design. Different shapes denote vegetation species (circle indicate sample under Quercus pubescens Willd.; triangle indicates sample under Juniperus communis L.), and different colours denote wildfire severity (green—Control; orange—Medium severity; red—High severity). Source: Google Earth.
Agronomy 12 01515 g001
Figure 2. Monthly 30-year average of precipitation and temperature (measured in the period from 1971 to 2000) and during the investigated year (2019–2020). The arrows indicate the dates on which sampling campaigns were conducted.
Agronomy 12 01515 g002
Figure 3. The relationship between PC1 and PC2: (a) 0 MAF; (b) 3 MAF; (c) 6 MAF; (d) 9 MAF; (e) 12 MAF (MAF—months after fire).
Agronomy 12 01515 g003aAgronomy 12 01515 g003b
Table 1. General soil properties in the investigated area.
HorizonTexture (%)pHSOM
(%)
P2O5K2O
SandSiltClayg kg−1
0–10 cm56.017.826.26.53.20.0020.19
10–60 cm41.012.246.86.50.80.0020.22
Table 2. Factorial ANOVA (for pH, TOC, TN and TS, Fe, Ni, and Zn) and Kruskal–Wallis (for EC, CaCO3, TK, and Cu) test results and mean values for investigated soil properties according to fire severity, time, vegetation, and their interactions.
pHEC (µS/cm)CaCO3 (%)TOC (%)TN (%)TS (%)TK (g/kg)Fe (g/kg)Ni (mg/g)Cu (mg/kg)Zn (mg/g)
FS********************************
V****n.s.*********n.s.n.s.n.s.n.s.*
T*********n.s.****************
FS × V*--n.s.n.s.n.s.-*n.s.-**
FS × Tn.s.--n.s.n.s.**-n.s.n.s.-n.s.
V × Tn.s.--n.s.n.s.**-n.s.n.s.-n.s.
FS × V × Tn.s.--n.s.n.s.n.s.-n.s.n.s.-n.s.
Fire severity
C6.47 ± 0.02 c106.2 ± 11.91 b0.07 ± 0.04 b3.84 ± 0.17 b0.28 ± 0.01 b0.07 ± 0.0 b19.48 ± 0.12 a29.78 ± 0.23 a67.63 ± 0.79 a28.39 ± 0.8 b73.05 ± 0.82 b
MS6.71 ± 0.02 b114.1 ± 11.91 b0.08 ± 0.04 b4.06 ± 0.17 b0.29 ± 0.01 b0.07 ± 0.0 b18.83 ± 0.12 ab28.64 ± 0.23 b65.59 ± 0.79 ab29.82 ± 0.8 b70.39 ± 0.82 b
HS7.42 ± 0.02 a277.2 ± 11.91 a0.53 ± 0.04 a5.34 ± 0.17 a0.38 ± 0.01 a0.08 ± 0.0 a18.25 ± 0.12 b28.01 ± 0.23 c64.12 ± 0.79 b33.46 ± 0.8 a74.23 ± 0.82 a
Time
0 MAF6.90 ± 0.03 b266.9 ± 15.38 a0.15 ± 0.05 ab4.95 ± 0.22 a0.33 ± 0.01 a0.05 ± 0.0 c21.24 ± 0.15 a30.38 ± 0.3 a73.21 ± 1.02 a33.13 ± 1.04 a72.75 ± 1.06 a
3 MAF6.85 ± 0.03 b140.1 ± 15.38 ab0.37 ± 0.05 a4.23 ± 0.22 ab0.32 ± 0.01 a0.08 ± 0.0 b16.89 ± 0.15 d27.83 ± 0.3 c63.28 ± 1.02 b28.79 ± 1.04 cb74.47 ± 1.06 a
6 MAF7.12 ± 0.03 a168.1 ± 15.38 ab0.33 ± 0.05 a4.59 ± 0.22 ab0.33 ± 0.01 a0.08 ± 0.0 b19.42 ± 0.15 bc28.78 ± 0.3 b64.51 ± 1.02 b31.13 ± 1.04 acb73.71 ± 1.06 a
9 MAF6.76 ± 0.03 c132.8 ± 15.38 b0.14 ± 0.05 b4.30 ± 0.22 ab0.31 ± 0.01 a0.09 ± 0.0 a20.62 ± 0.15 ac29.33 ± 0.3 b65.08 ± 1.02 b30.69 ± 1.04 acb70.52 ± 1.06 bc
12 MAF6.70 ± 0.03 c121.4 ± 15.38 b0.12 ± 0.05 b4.00 ± 0.22 b0.30 ± 0.01 a0.08 ± 0.0 b16.10 ± 0.15 d27.73 ± 0.3 c62.83 ± 1.02 b29.04 ± 1.04 b71.33 ± 1.06 ac
Vegetation
Quercus p.6.83 ± 0.01 b181.5 ± 8.14 a0.24 ± 0.03 a4.90 ± 0.11 a0.36 ± 0.01 a0.08 ± 0.0 a18.80 ± 0.11 a28.68 ± 0.21 a65.29 ± 0.54 a30.03 ± 0.75 a73.29 ± 0.56 a
Juniperus c.6.90 ± 0.02 a150.2 ± 11.09 b0.21 ± 0.03 a3.93 ± 0.16 b0.28 ± 0.01 b0.07 ± 0.0 b18.91 ± 0.08 a28.93 ± 0.16 a66.28 ± 0.74 a31.09 ± 0.55 a71.83 ± 0.77 b
Abbreviations: FS—Fire severity; V—Vegetation; T—Time; C—Control; MS—Medium severity; HS—High severity; MAF—Months after fire Significant differences at: p < 0.05 *, p < 0.01 **, p < 0.001 ***, n.s. not significant at p < 0.05 Different letters represent significant (p < 0.05) differences between fire severity, sampling time and vegetation values following ± indicate standard deviation.
Table 3. Results of factorial ANOVA (for pH, TOC, TN, and TS) and Kruskal–Wallis test (for EC and CaCO3, and TK) during the study period.
C -QMS -QHS -QC -JMS -JHS -J
0 MAF
pH (−log[H+])6.57 ± 0.06 c6.77 ± 0.06 b7.23 ± 0.06 aB6.61 ± 0.08 b6.76 ± 0.08 b7.45 ± 0.08 aA
EC (µS/cm)204.9 ± 32.09 b202.9 ± 32.09 b558.1 ± 32.09 a118.4 ± 43.74 b122.4 ± 43.74 b394.6 ± 43.74 a
CaCO3 (%)0.05 ± 0.01 b0.06 ± 0.01 b0.35 ± 0.01 a0.08 ± 0.12 b0.07 ± 0.12 b0.30 ± 0.12 a
TOC (%)4.43 ± 0.44 b4.41 ± 0.44 b7.77 ± 0.44 aA3.79 ± 0.61 a4.89 ± 0.61 a4.41 ± 0.61 aB
TN (%)0.30 ± 0.03 b0.30 ± 0.03 b0.54 ± 0.03 aA0.26 ± 0.04 a0.28 ± 0.04 a0.28 ± 0.04 aB
TS (%)0.05 ± 0.00 b0.05 ± 0.00 b0.06 ± 0.00 aA0.05 ± 0.00 a0.05 ± 0.00 a0.05 ± 0.00 aB
TK (g/kg)21.71 ± 0.32 a21.04 ± 0.32 ab20.65 ± 0.32 b21.65 ± 0.43 a21.34 ± 0.43 ab21.04 ± 0.43 b
3 MAF
pH (−log[H+])6.39 ± 0.06 c6.64 ± 0.06 b7.35 ± 0.06 a6.43 ± 0.08 c6.79 ± 0.08 b7.51 ± 0.08 a
EC (µS/cm)104.1 ± 32.09 b99.3 ± 32.09 b249.1 ± 32.09 a83.1 ± 43.74 b101.1 ± 43.74 b203.9 ± 43.74 a
CaCO3 (%)0.08 ± 0.01 b0.09 ± 0.01 b0.96 ± 0.01 a0.06 ± 0.12 b0.09 ± 0.12 b0.96 ± 0.12 a
TOC (%)4.15 ± 0.44 bA4.34 ± 0.44 bA6.22 ± 0.44 aA3.36 ± 0.61 aB3.39 ± 0.61 aB3.92 ± 0.61 aB
TN (%)0.31 ± 0.03 bA0.31 ± 0.03 bA0.48 ± 0.03 aA0.26 ± 0.04 aB0.26 ± 0.04 aB0.29 ± 0.04 aB
TS (%)0.08 ± 0.0 aA0.08 ± 0.0 a0.08 ± 0.00 a0.07 ± 0.00 aB0.07 ± 0.00 a0.07 ± 0.00 a
TK (g/kg)17.8 ± 0.32 a17.11 ± 0.32 a15.59 ± 0.32 b17.54 ± 0.43 a17.16 ± 0.43 a16.13 ± 0.43 b
6 MAF
pH (−log[H+])6.71 ± 0.06 b6.82 ± 0.06 b7.70 ± 0.06 a6.77 ± 0.08 c7.02 ± 0.08 b7.71 ± 0.08 a
EC (µS/cm)105.3 ± 32.09 b112.9 ± 32.09 b242.9 ± 32.09 a104.2 ± 43.74 b116.9 ± 43.74 b326.6 ± 43.74 a
CaCO3 (%)0.07 ± 0.01 b0.12 ± 0.01 b0.92 ± 0.01 a0.07 ± 0.12 b0.14 ± 0.12 ab0.66 ± 0.12 a
TOC (%)4.18 ± 0.44 b4.04 ± 0.44 b5.87 ± 0.44 a3.83 ± 0.61 ab3.70 ± 0.61 b5.93 ± 0.61 a
TN (%)0.31 ± 0.03 b0.30 ± 0.03 b0.44 ± 0.03 a0.29 ± 0.04 ab0.27 ± 0.04 b0.41 ± 0.04 a
TS (%)0.07 ± 0.00 b0.07 ± 0.00 b0.08 ± 0.00 aB0.07 ± 0.00 b0.07 ± 0.00 b0.09 ± 0.00 aA
TK (g/kg)20.31 ± 0.32 a19.48 ± 0.32 ab18.56 ± 0.32 b20.28 ± 0.43 a19.38 ± 0.43 ab18.52 ± 0.43 b
9 MAF
pH (−log[H+])6.41 ± 0.06 c6.70 ± 0.06 b7.14 ± 0.06 aB6.32 ± 0.08 c6.57 ± 0.08 b7.39 ± 0.08 aA
EC (µS/cm)98.7 ± 32.09 b126.5 ± 32.09 b209.0 ± 32.09 a66.3 ± 43.74 b87.4 ± 43.74 b208.8 ± 43.74 a
CaCO3 (%)0.12 ± 0.01 ab0.06 ± 0.01 b0.26 ± 0.01 a0.09 ± 0.12 b0.07 ± 0.12 b0.26 ± 0.12 a
TOC (%)4.11 ± 0.44 bA4.67 ± 0.44 ab5.88 ± 0.44 a3.07 ± 0.61 bB3.75 ± 0.61 a4.35 ± 0.61 a
TN (%)0.29 ± 0.03 bA0.33 ± 0.03 abA0.43 ± 0.03 aA0.23 ± 0.04 bB0.27 ± 0.04 abB0.30 ± 0.04 aB
TS (%)0.09 ± 0.00 b0.10 ± 0.00 abA0.10 ± 0.00 a0.09 ± 0.00 a0.09 ± 0.00 aB0.09 ± 0.00 a
TK (g/kg)21.29 ± 0.32 a20.06 ± 0.32 b19.88 ± 0.32 b21.33 ± 0.43 a20.61 ± 0.43 b20.54 ± 0.43 b
12 MAF
pH (−log[H+])6.25 ± 0.06 c6.52 ± 0.06 b7.25 ± 0.06 a6.29 ± 0.08 b6.47 ± 0.08 b7.44 ± 0.08 a
EC (µS/cm)94.0 ± 32.09 b100.3 ± 32.09 b215.1 ± 32.09 a83.4 ± 43.74 b71.6 ± 43.74 b163.8 ± 43.74 a
CaCO3 (%)0.02 ± 0.01 b0.05 ± 0.01 b0.34 ± 0.01 a0.02 ± 0.12 b0.02 ± 0.12 b0.29 ± 0.12 a
TOC (%)3.85 ± 0.44 b4.21 ± 0.44 bA5.36 ± 0.44 aA3.65 ± 0.61 a3.22 ± 0.61 aB3.70 ± 0.61 aB
TN (%)0.29 ± 0.03 b0.31 ± 0.03 b0.41 ± 0.03 aA0.27 ± 0.04 a0.25 ± 0.04 a0.26 ± 0.04 aB
TS (%)0.08 ± 0.00 a0.08 ± 0.00 a0.08 ± 0.00 aA0.08 ± 0.00 a0.07 ± 0.00 a0.07 ± 0.00 aB
TK (g/kg)16.62 ± 0.32 a15.9 ± 0.32 a15.97 ± 0.32 a16.23 ± 0.43 a16.23 ± 0.43 a15.67 ± 0.43 a
Abbreviations: C—Control; MS—Medium severity; HS—High severity; Q—Quercus pubescens Willd.; J—Juniperus communis L.; MAF—Months after fire. Values represent the sampling means followed with standard deviation. Different letters indicate significant (p < 0.05) differences between fire severity (lowercase letters) in one vegetation group and vegetation (uppercase letters).
Table 4. Results of factorial ANOVA (for Fe, Ni and Zn) and Kruskal–Wallis test (for Cu) during the study period.
C -QMS -QHS -QC -JMS -JHS -J
0 MAF
Fe (g/kg)31.00 ± 0.61 a30.76 ± 0.61 a28.15 ± 0.61 b31.56 ± 0.83 a30.38 ± 0.83 a30.42 ± 0.83 a
Ni (mg/kg)75.46 ± 2.09 a73.92 ± 2.09 a68.00 ± 2.09 a74.71 ± 2.85 a72.71 ± 2.85 a74.43 ± 2.85 a
Cu (mg/kg)29.69 ± 2.13 b34.85 ± 2.13 ab34.38 ± 2.13 a31.29 ± 2.90 b29.00 ± 2.90 ab39.57 ± 2.90 a
Zn (mg/kg)72.38 ± 2.17 a73.08 ± 2.17 a72.46 ± 2.17 a73.57 ± 2.96 a71.00 ± 2.96 a74.00 ± 2.96 a
3 MAF
Fe (g/kg)28.39 ± 0.61 a28.29 ± 0.61 a26.28 ± 0.61 b28.56 ± 0.83 a27.53 ± 0.83 a27.96 ± 0.83 a
Ni (mg/kg)65.38 ± 2.09 a64.15 ± 2.09 a59.00 ± 2.09 b63.43 ± 2.85 a63.29 ± 2.85 a64.43 ± 2.85 a
Cu (mg/kg)25.31 ± 2.13 a30.00 ± 2.13 a28.00 ± 2.13 a28.14 ± 2.90 a26.71 ± 2.90 a34.57 ± 2.90 a
Zn (mg/kg)73.23 ± 2.17 b76.38 ± 2.17 bA79.23 ± 2.17 a74.00 ± 2.96 a69.00 ± 2.96 aB75.00 ± 2.96 a
6 MAF
Fe (g/kg)29.42 ± 0.61 a28.71 ± 0.61 a27.63 ± 0.61 b30.65 ± 0.83 a28.39 ± 0.83 a27.85 ± 0.83 b
Ni (mg/kg)66.77 ± 2.09 a66.08 ± 2.09 a61.38 ± 2.09 b68.71 ± 2.85 a61.71 ± 2.85 a62.43 ± 2.85 a
Cu (mg/kg)28.15 ± 2.13 a31.54 ± 2.13 a31.08 ± 2.13 a30.00 ± 2.90 a27.71 ± 2.90 a38.29 ± 2.90 a
Zn (mg/kg)71.85 ± 2.17 a69.54 ± 2.17 a76.62 ± 2.17 a77.29 ± 2.96 a68.43 ± 2.96 b78.57 ± 2.96 a
9 MAF
Fe (g/kg)30.50 ± 0.61 a28.72 ± 0.61 b28.54 ± 0.61 c30.68 ± 0.83 a28.31 ± 0.83 b29.24 ± 0.83 a
Ni (mg/kg)65.00 ± 2.09 a62.92 ± 2.09 a62.85 ± 2.09 a70.14 ± 2.85 a65.14 ± 2.85 a64.43 ± 2.85 a
Cu (mg/kg)26.15 ± 2.13 b32.15 ± 2.13 ab30.85 ± 2.13 a28.86 ± 2.90 b28.86 ± 2.90 ab37.29 ± 2.90 a
Zn (mg/kg)72.00 ± 2.17 a69.69 ± 2.17 a73.31 ± 2.17 a72.00 ± 2.96 a67.00 ± 2.96 a69.14 ± 2.96 a
12 MAF
Fe (g/kg)27.82 ± 0.61 a28.57 ± 0.61 a27.5 ± 0.61 a29.25 ± 0.83 a26.70 ± 0.83 b26.52 ± 0.83 c
Ni (mg/kg)60.00 ± 2.09 b65.38 ± 2.09 a63.00 ± 2.09 b66.71 ± 2.85 a60.57 ± 2.85 a61.29 ± 2.85 a
Cu (mg/kg)27.46 ± 2.13 a32.23 ± 2.13 a28.54 ± 2.13 a28.86 ± 2.90 a25.14 ± 2.90 a32.00 ± 2.90 a
Zn (mg/kg)70.23 ± 2.17 b72.77 ± 2.17 b76.53 ± 2.17 aA74.00 ± 2.96 a67.00 ± 2.96 a67.43 ± 2.96 aB
Abbreviations: C—Control; MS—Medium severity; HS—High severity; Q—Quercus pubescens Willd.; J—Juniperus communis L.; MAF—Months after fire. Values represent the sampling means followed with standard deviation. Different letters indicate significant (p < 0.05) differences between fire severity (lowercase letters) and vegetation (uppercase letters).
Table 5. Summary of the results of principal component analysis.
0 MAF3 MAF6 MAF9 MAF12 MAF
PC1PC2PC3PC1PC2PC3PC1PC2PC3PC1PC2PC3PC1PC2PC3
Eigenvalue2.381.381.192.251.581.302.431.381.122.181.611.141.961.591.29
Proportion of variance0.510.170.130.460.230.150.540.170.110.430.240.120.350.230.15
Cumulative proportion0.510.680.810.460.690.840.540.710.820.430.670.790.350.580.73
Eigenvectors
pH (−log[H+])0.2690.257−0.4530.3240.128−0.4410.3080.232−0.3540.3420.022−0.4990.2950.196−0.488
EC (µS/cm)0.3360.133−0.1910.3990.075−0.2120.3810.076−0.0410.4050.051−0.2970.4340.114−0.195
CaCO3 (%)0.3280.132−0.2850.3640.103−0.3180.3020.226−0.3910.2780.098−0.4110.2730.182−0.356
TOC (%)0.3700.0180.3080.3800.0490.3550.366−0.0500.3290.4150.0840.2780.470−0.0210.240
TN (%)0.3840.0360.2930.3820.0780.3320.360−0.0400.3590.4120.1020.3050.463−0.0450.272
TS (%)0.3630.0700.3410.1800.2290.5330.3280.0330.2640.3290.2100.3230.291−0.2210.452
TK (g/kg)−0.3250.2320.110−0.3710.0610.116−0.3400.0170.104−0.3310.220−0.206−0.237−0.2160.040
Fe (g/kg)−0.3310.3490.117−0.2560.4760.027−0.2990.4040.228−0.2080.511−0.009−0.025−0.586−0.135
Ni (mg/kg)−0.2310.4950.090−0.2450.456−0.036−0.2640.4670.103−0.1640.477−0.050−0.011−0.484−0.316
Cu (mg/kg)0.0870.501−0.371−0.0140.477−0.3080.0700.496−0.3590.0940.321−0.3430.073−0.137−0.372
Zn (mg/kg)0.1250.4700.4560.1300.4910.1690.1360.5060.4590.0490.5350.2390.261−0.470−0.055
The loadings that significantly contribute to each principal component are shown in bold.
Publisher’s Note: MDPI stays neutral with regard to jurisdictional claims in published maps and institutional affiliations.

