Article

From Spatial Characterisation to Prediction Maps of the Naturally Occurring Radioactivity in Groundwaters Intended for Human Consumption of Duero Basin, Castilla y León (Spain)

by
David Borrego-Alonso
1,*,
Antonio M. Martínez-Graña
2,
Begoña Quintana
1 and
Juan Carlos Lozano
1
1
Laboratorio de Radiaciones Ionizantes y Datación, Departamento de Física Fundamental, Facultad de Ciencias, Universidad de Salamanca, Espejo nº2, 37008 Salamanca, Spain
2
Departamento de Geología, Facultad de Ciencias, Universidad de Salamanca, Plaza de la Merced s/n, 37008 Salamanca, Spain
*
Author to whom correspondence should be addressed.
Agronomy 2022, 12(9), 2059; https://doi.org/10.3390/agronomy12092059
Submission received: 26 July 2022 / Revised: 26 August 2022 / Accepted: 26 August 2022 / Published: 29 August 2022
(This article belongs to the Special Issue Resilience in Soils and Land Use)

Abstract

:
According to the European Council Directive 51/2013 EURATOM, the radionuclide content in human consumption waters must comply with the stated recommendations to ensure the protection of public health. The radiological characterisation assessed in Laboratorio de Radiaciones Ionizantes y Datación of Universidad de Salamanca, in more than 400 groundwater samples gathered from intakes intended for human consumption from the Castilla y León region (Spain), has provided worthwhile data for evaluating the spatial distribution of the radioactivity content in the Duero basin. For this purpose, geostatistical exploration and interpolation analysis, using the inverse distance weighting (IDW) method, was performed. The IDW prediction maps showed higher radioactivity occurrence in western and southern areas of the study region, mainly related to the mineralogical influence of the igneous and metamorphosed outcroppings in the Cenozoic sediments that formed the porous detritic aquifers of the Duero basin edges. The hydraulic characteristics promote the distribution of these radioactivity levels towards the centre of the basin as a consequence of the unconfined nature of the aquifers. Prediction maps provide a worthwhile tool that can be used for better planning and managing of groundwater monitoring programmes.

1. Introduction

It is widely known that the quality assessment of groundwater arouses great interest in environmental management for planning the use of water. Groundwater is not only a strategic resource for drinking water supply for human consumption, but also to satisfies irrigation demand, especially in arid and semi-arid regions, where intensive agriculture is one of the main economical driving forces and the seasonal variability in the precipitation regimes frequently lead to drought periods. In Spain, groundwater withdrawal is estimated at 22% of the total [1], However, there exists a wide variability range among the different administrative authorities commissioned for hydrographical planning. In Castilla y León the primary groundwater abstraction comes from the Duero Hydrographical Confederation (DHC), which extends through 82.2% of their territory, and is approximately 1220 hm3/yr, mainly intended for agriculture and livestock farming (78%) and domestic human consumption (16%). Their use becomes especially significant in regions where the superficial supply can no longer provide enough water, due to the absence of reservoirs or during the aforementioned seasonal droughts. Hence, it is essential to accomplish exhaustive characterization assessments that ensure the quality levels of the groundwater resources intended for human consumption are in compliance with public health recommendations.
Given their critical impact on human health, the determination and spatial distribution of heavy metal concentrations have been addressed in different environments [2,3,4,5]. The naturally occurring concentration of these elements in groundwater depends on the involved processes in the transference from rock and soil minerals to aquifers. Apart from the chemical toxicity associated with the ingestion of heavy metals through the food chain and drinking water, some of them, such as uranium, radium, lead or polonium, are also radiotoxic due to the ionising radiation emitted as a consequence of their radioisotope disintegration. Consequently, regulatory frameworks developed during recent years, have increasingly focused on the radioactivity content in groundwaters intended for human consumption to protect public health from radionuclide substances.
The naturally occurring radionuclides present in groundwaters come from the three natural decay chains that form part of the crystalline structure of the bedrock minerals. Taking into account their relevance as a key resource for water availability in many worldwide regions, several works [6,7,8,9,10] have focused on the hydrogeochemical processes involved in the radionuclide mobilisation from mineral-bearing to the groundwater environment. Background radioactivity levels on groundwaters are often innocuous, and it is also a fact that there are regions prone to lithological features with specific hydrogeochemical settings where the radionuclide presence is enhanced [11,12,13,14,15], highlighting the need for quantifying and monitoring of their content. Prolonged radiation exposure due to the ingestion of drinking water containing certain radionuclide levels is likely to lead to an increase in the risk of stochastic effects on the development of severe diseases [16], related to the radiological toxicity and the chemical behaviour of uranium, radium, polonium and lead. Hence, an accurate radiological characterisation of the groundwater bodies is an important challenge to guaranteeing safe human water consumption. The current legal framework for the protection of public health regarding the radioactivity parameters was laid down in the European Council Directive 51/2013/EURATOM [17]. Spain, as a Member State of the EU, also incorporates the European Directive requirements in its legislation to ensure compliance with the quality radioactivity standards [18]. According to the safety guidelines of radioactivity in drinking water, the control of the indicative dose (ID) must be addressed by determining the activity concentrations of 226,228Ra, 234,238U, 210Pb and 210Po, as established in Annexe X of the Royal Decree (RD) 314/2016. Once the water has been radiologically characterised, the gross α- and gross β-activity determinations can be used as a screening strategy for monitoring the radioactivity levels. If gross α- and gross β-activity values are kept below their screening levels, 0.1 and 1.0 Bq/L, respectively, it may be assumed that the ID does not exceed the parametric value of 0.1 mSv, and no further costly and expertise-specific radiological determinations are necessary. Between 2017 and 2021, in the framework of the project promoted by the General Directorate of Public Health of Castilla y León, our laboratory carried out a comprehensive radioactivity characterisation of the groundwater intakes placed throughout the whole region, which comprised an analysis of the 238,234,235U, 228,226Ra, 210Pb and 210Po activity concentrations for the ID assessment. Furthermore, their respective gross α- and gross β-activities, hereinafter referred to as aα and aβ, respectively, were also determined, due to their wide use in water radioactivity monitoring.
In the last decade, geostatistic and geospatial analysis has become a highly useful and versatile tool for understanding environmental variability and the spatial distribution of groundwater quality [19,20,21,22]. Some publications have reported that high radioactivity levels on groundwaters are severely associated with the bedrock type and the hydrogeochemical variables [22,23,24,25]. Geographic Information System (GIS) and geostatistical tools implemented in the software enable the assessment of spatial potential relationships between the groundwater radionuclide content and the environmental setting [26,27]. Despite the existence of data-driven methods used for environmental studies, such as artificial neural networks [28], we performed the inverse distance weighted (IDW) interpolation method, which allows the estimation of the unmonitored area based on the quantitative measurements carried out in neighbourhood sampled locations, to assess the spatial distribution of the radioactivity content in the aquifers of Castilla y León. The IDW interpolation method is widely used in geospatial studies related to groundwater pollution and quality assessment [29]. Despite the different interpolation methods, the most appropriate depends on the type of data parameters and their predictability is determined by multiple factors related to the distribution of the sampling points [30]. Some publications have addressed the monitoring, geospatial analysis and projecting of prediction maps of the environmental radioactivity in waters, such as 222Rn in southern Belgium [31] or aα and aβ in Turkey [32]. Our study presents a radioactivity assessment in a region where different main lithologies and permeabilities define the aquifers of Castilla y León. Given that the prediction maps of the radioactivity parameters in the study region constitute an important milestone, not only for a better understanding of the groundwater radionuclide distribution, but also because they provide a powerful tool from a management perspective for compliance with the current law. Thus, the current study was conducted to assess the spatial distribution of the main naturally occurring radionuclides using the IDW method, by considering analysed samples from hydraulically interconnected aquifers belonging to the DHC, and to provide groundwater prediction maps that can be used as a tool in the groundwater planning.

2. Materials and Methods
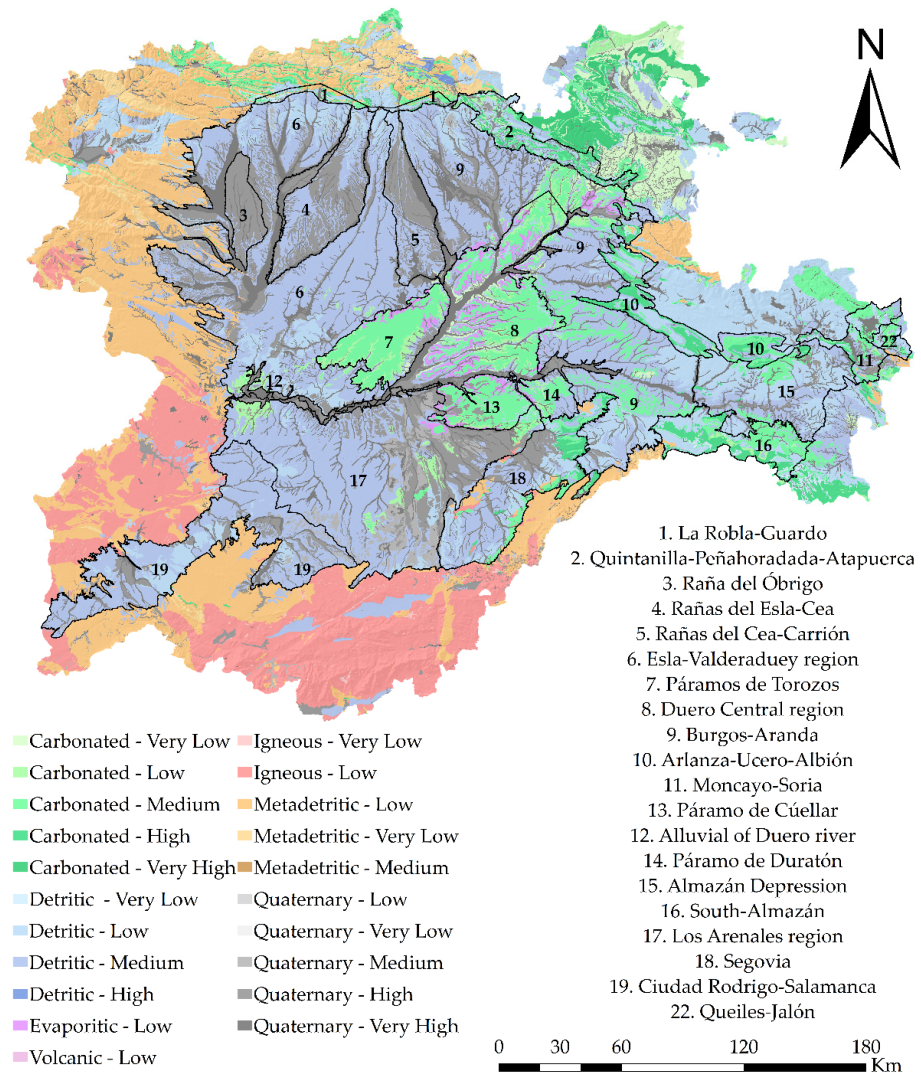
2.1. Study Area

Castilla y León (CyL) is situated in the NW of the Iberian Peninsula, and occupies approximately 94,225 km2, thus, constituting the largest region of Spain and the third largest of the European Union.
Geologically, regarding the lithostratigraphic and structural features, different domains can be distinguished, as can be observed in Figure 1. The Hercynian basement is comprised mainly of igneous and metamorphic outcroppings, originating during Precambrian and Paleozoic, and constitutes the Central System (CS). Throughout the westernmost areas of the provinces of Zamora and Salamanca and the southern areas of Salamanca, Ávila, Segovia and León, acidic plutonic outcroppings and Precambrian-Cambrian metasediments, which mainly consist of slates, greywackes and sandstones, and small occurrences of quartzites, conglomerates and black-carbonaceous slates, mainly comprise the basement, which constitutes the Schist-Greywacke Complex (SGC). Igneous intrusive bodies are broadly formed by two-mica granites and other biotitic granitoids. Throughout the western Asturian-Leonese zone, and in small outcrops located in the Iberian System, located in the eastern region of CyL, Cambrian-Ordovician-Silurian sediments, with some interlaced levels of carbonates, overlying in discordance with the Precambrian metasediments, such as slates, shales, quartzites and Ollo de Sapo gneiss rocks predominate. The Cantabrian zone, which occupies the northernmost areas of the provinces of León and Palencia, is comprised of Precambrian and Paleozoic sediments deposited in shallow marine environments, originating in limestones and sandstones. Terrigenous and carbonated Mesozoic materials mainly constitute the basement of the Basque-Cantabrian Basin, which extends throughout the north of Palencia and Burgos provinces, and the Castillian part of the Iberian Range, represented mainly by the Cameros Basin between SE of Burgos and the north of Soria. The sedimentary sequence of the different sectors of the Cenozoic Duero Basin (DB) is influenced by the bedrock composition that surrounds the Spanish Northern Plateau. It is worth pointing out the significant impact on the composition of the siliciclastic rocks, that fill the southern and western sectors of the DB, of acidic intrusive rock debris and metamorphic sediments belonging to the CS. Finally, fine to coarse detrital grains (sands, clays, limes and conglomerates), associated with the current riverine systems, constitute the Quaternary deposits, which originated from the drainage of the DB materials and the continuous denudation of Mesozoic mountain edges [33].
The spatial distribution of the natural radionuclides, the groundwater occurrence of which is controlled by the processes within the water–rock interactions, is, thus, highly influenced by the main lithologies represented by granitic and metamorphic outcroppings, detritic materials and carbonate rocks and their respective abilities to store, transmit and discharge groundwater [34,35]. Accordingly, 20 hydrogeological unities are defined in the centre of the DHC which are formed by groundwater masses or aquifer systems that present similar hydraulic, hydrogeological and distribution characteristics and also share the same environmental planning goals, as illustrated in Figure 2.
Regarding permeability, there are broadly two types of productive aquifer systems associated with the rock type and permeability characteristics. On the one hand, the intergranular porous aquifers are formed in detritic materials, such as sands, gravels and conglomerates, and extend throughout the Cenozoic sediments of the DB and tectonic depressions of Ciudad Rodrigo or Amblés. These aquifers are included in the following hydrogeological unities: Obrigo, Esla-Cea and Cea-Carrión “Rañas”, Esla-Valderaduey Region, Páramo de Torozos, Duero Central Region, Burgos-Aranda, Alluvials of Duero River, Almazán Depression, Arenales, Ciudad Rodrigo-Salamanca, Valdecorneja and Amblés Valley. Theyepresent 85% of the territory and 70% of the total groundwater volume of the most important hydric resources. The Cenozoic aquifer systems are formed by a wide sands lens with a semipermeable lime-clayish matrix surrounding them. These aquifers behave as a great anisotropic interconnected aquifer complex, which presents a variable thickness of up to 2000 m depth in the basin centre. Infiltration and sideway flow are the main recharge mechanisms. Generally, the groundwater flows towards the basin centre through the current riverine drainage system. Productivity and transmitivity are highly variable, 10–40 L/s and 5–100 m2/d, respectively. The superficial (5–15 m), low-transmissive and low-productive porous aquifers formed in the Quaternary sediments, such as rañas, alluvials and sandbanks, are, likewise, variable. On the other hand, the fissured carbonated aquifers, formed in the Mesozoic and Cenozoic limestones and dolomites, present a permeability related to fissures due to dissolution and structural processes. Mesozoic formations, which comprise the northern and western peripheral areas of the DB, constitute broadly unconfined karst aquifers recharged by freshwater runoff and interconnected groundwater lateral flow with other units, and their transmitivity and productivity range between 20–1500 m2/d and 5–140 L/s, respectively. In the centre of the DB, limestone formations extend, giving rise to the Páramos (Cúellar, Duratón and Torozos) that constitute unconfined aquifers with a subhorizontal tabular structure, 5–50 m depth, radial flow and recharge–discharge through several springs, as well as infiltration. It can be considered that to a greater or lesser extent, all these aquifers are interconnected. It must be noted that the igneous and metasedimentary outcroppings, which extend throughout the Central System and the North-Cantabrian zone, give rise to limited and fractured regionally insignificant aquifers, hydraulically confined, and characterised by very low permeability. In the Ebro Basin, which occupies the Basque-Cantabrian zone, Cenozoic basin sediments exist with clayey interlaced levels that limit the hydraulic relation but give rise to some confined aquifers or locally significant aquifers.

2.2. Groundwater Samples

Between January 2017 and November 2021, two hundred and forty-four drinking water samples were gathered from groundwater intakes situated within the hydraulically interconnected DHC. The georeferenced location of the sampling points is shown in Figure 1. The selection of the sampling points responded to strategic goals stated by the Dirección General de Salud Pública (DGSP) of Junta de Castilla y León to comply with the guidelines for the radiological characterisation of the groundwater masses intended for human consumption.
The water samples were mainly collected by the Pharmaceutical official service of the DGSP in three 10-L PTE vessels and then transported to Laboratorio de Radiaciones Ionizantes y Datación of Universidad de Salamanca for measurement and analysis to determine the radionuclide content. Immediately after this measurement, water samples were acidified with 1 mL/L of analytical grade 65% HNO3 for proper preservation.

2.3. Radioactivity Measurements

The activity concentration of 238,235,234U, 228,226,224Ra, 210Pb and 210Po were determined using γ-ray and α-particle spectrometry techniques. The aα and aβ values were determined using the optimised thin source deposit and proportional counting (TSD-PC) method [36].
The γ-sources were prepared by the thermal concentration of a twenty-five-litre aliquot up to 50 mL final volume. The concentrated samples were then transferred to cylindrical 52 mm diameter and 48 mm height PTE beakers. Two low-level background HPGe detectors, manufactured by Canberra, BE5030 and GR2520 models, hereinafter referred to as BEGe and REGe, respectively, were used for the γ-ray spectrometry measurements. Both detectors were continuously ventilated with N2. The BEGe detector was made of a p-type high-purity Ge crystal of broad-energy range with an active volume of 117 cm3. Its relative energy peak efficiency at 1332 keV was 50% and its nominal resolution at 122 and 1332 keV were 0.75 and 2.20 keV, respectively. The detector was surrounded by a passive shielding consisting of 10 cm thick iron melted and 5 cm thick old lead, which was internally lined with 2 mm thick high-purity electrolytic Cu. The REGe detector was made of an n-type high-purity Ge crystal with an active volume of 59 cm3. Its relative peak efficiency at 1332 keV was 22.60% and nominal resolution at 122 and 1332 keV were 0.842 and 1.79 keV, respectively. The detector was surrounded by a passive shielding made of 27.5 cm thick iron melted, internally lined with 2 mm thick high-purity electrolytic Cu. The data acquisition was done with coupled electronics consisting of an integrated module Canberra DSA1000 model, including a 16 K multichannel analyser. The γ-sources were measured for times ranging between 250,000 to 450,000 seconds. For efficiency calibration, both Monte Carlo (MC) simulation and experimental methods were used [37,38].
The acquired γ-spectra were analysed using the Gamma-Live Expert Analyser, GALEA, developed in our laboratory mainly for the analysis of spectra shaped by the natural radionuclide emissions [39]. It included the algorithm COSPAJ for the full continuum spectra fitting [40]. A genetic algorithm was also included that provided the best peak fit, even in multiplets with more than three peaks. The γ-ray emission energies and probabilities were taken from the Nuclide-Lara Library [41].
The 238,235,234U activity concentrations were also determined using α-particle spectrometry. Sources were prepared through the radiochemical separation procedure which involves sequential extraction using UTEVA resin (Triskem) of purified uranium eluate and electrodeposition onto stainless steel discs at 1.8 A for 1 hour [42,43]. The method used for 210Po determination was based on co-precipitated with Fe(OH)3 and auto-deposition onto silver discs for 4 hours [44,45]. The activity concentration of 210Po corresponded to the 210Po in excess, thus, the activity concentration measured from α-particle spectrometry was corrected with the γ-ray spectrometry 210Pb activity. Measurements were performed using a PIPS semiconductor detector of 450 mm2 active area, Ortec BR-SNA-450-100 models, housed in an Ensemble Spectrometer with Alpha-Duo Modules (Ortec) for uranium sources and Canberra A450-18 AM model, coupled to low-noise preamplifiers and amplifiers, all of them housed in width NIM spectrometers Canberra 7401VR model, coupled to a multichannel analyzer Ortec 920E EtherNIM 16-Input Multichannel Buffer model, was used for polonium. Spectra and hardware were managed by the MCA Maestro Emulator and the suite Alpha-Vision both by Ortec.
According to the European framework, the water quality intended for human consumption should ensure safe radioactivity exposure for public health. Thus, the indicative dose (ID) was determined in all groundwater samples, following Equation (1):
I D = i = 1 n c i c a l c i d e r 0.1   mSv ,
ci (cal) is the activity concentration determined by a radionuclide (i) present in the sample, ci (der) is the derived concentration of a radionuclide (i) listed in RD 314/2016, and n is the number of radionuclides with concentration activities higher than the minimum detectable activity (MDA). The contribution of 210Pb, 210Po, 226Ra, 228Ra, 238U and 234U were considered for the ID assessment. The value of the derived concentration is based on the radiotoxicological properties of the radionuclides [46].
The aα and aβ values were ascertained by following the optimised TSD-PC method developed in our laboratory for drinking water [36]. For each sample, efficiencies were directly calculated by spiking with natural uranium standard solution. Measurements were performed in a low-background gas-proportional counter (model LB770, Berthold Technologies). This equipment enables the simultaneous measurement of the α and β emissions. Underground location, the anticoincidence guard detector and the passive shielding based on thick lead blocks ensured low background.

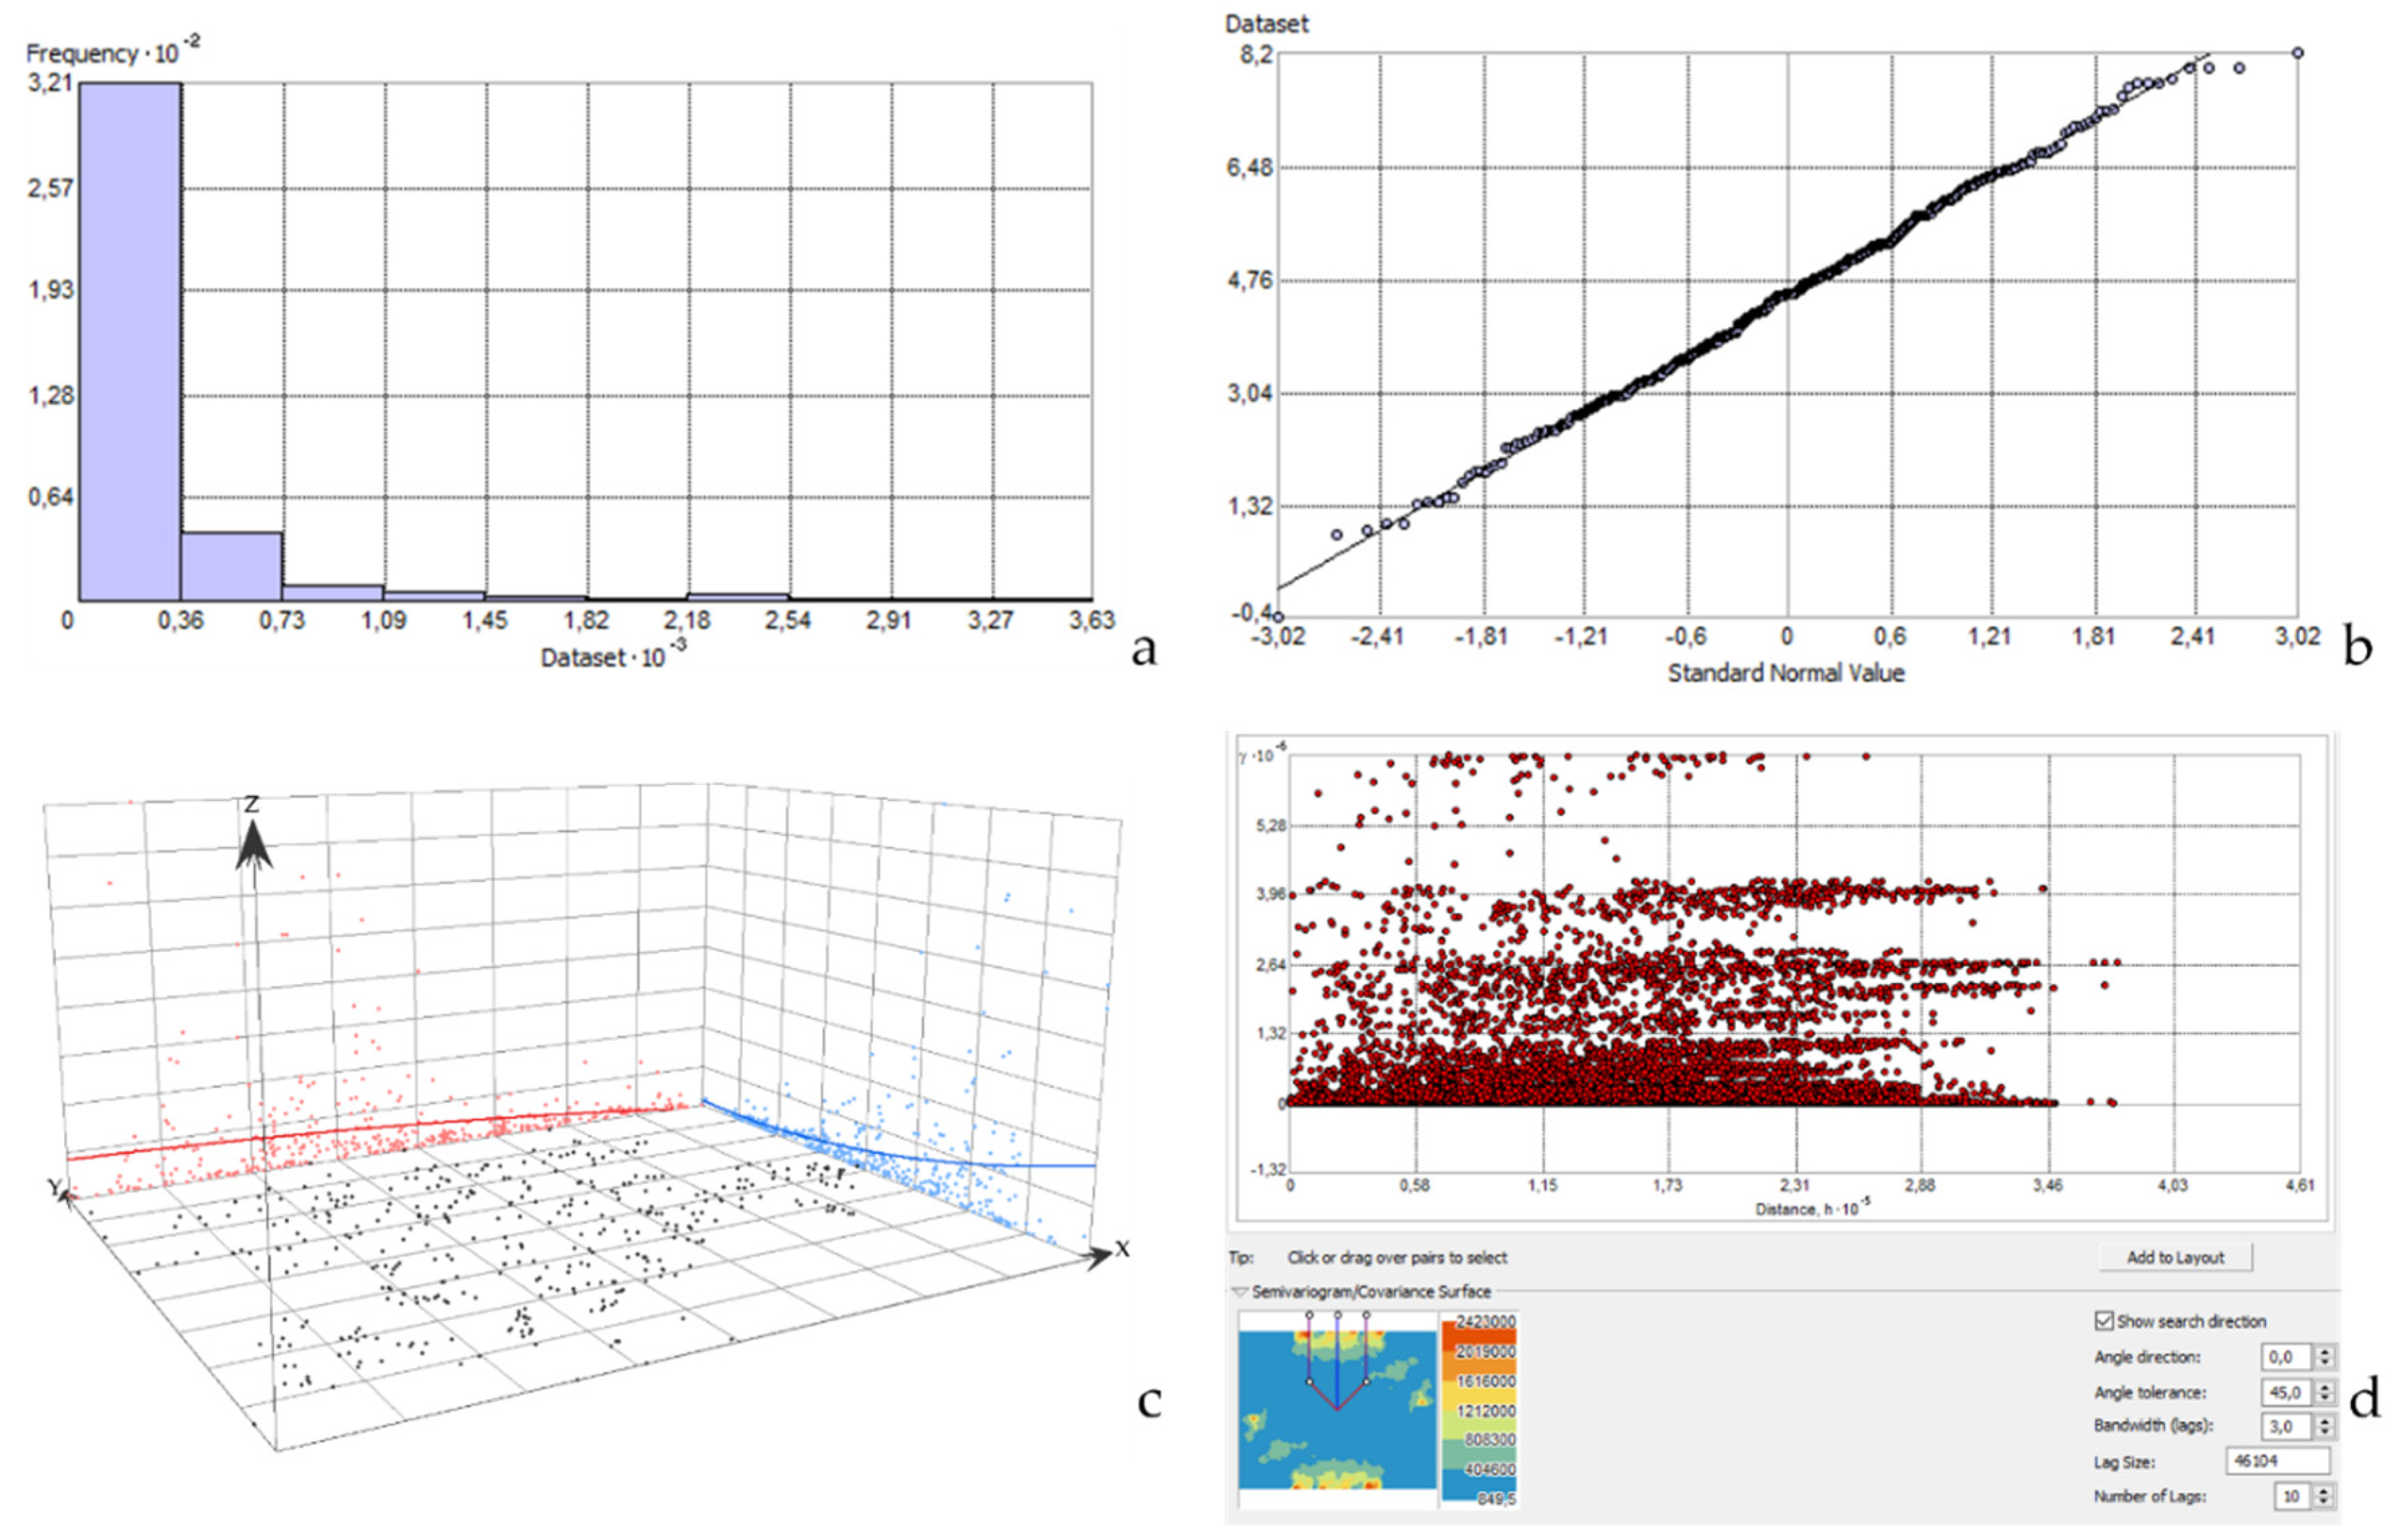
2.4. Statistical Analysis of the Samples

The spatial and geostatistical analysis was performed using ArcGIS software (v 10.9) which included the 3D Analyst Toolkit for applying the interpolation methods and the semivariogram analysis. The inverse distance weighted (IDW) interpolation technique determined the unsampled locations from a linear weighted function based on the inverse distance between the sampled location, in which values were known. This interpolation method takes into account that the nearest measured values have more weight in the prediction than those further away. The predicted surface area was computed using the Equation (2):
Z   S O = i = 1 N λ i Z   S i ,
where Z   S i is the measured value in the sample point i; λ i is the unknown weighting for the measured value in the sample point i; S O is the location of the prediction; and N is the number of measured values [47].
The weight of the set of measured points in the prediction model diminishes with the distance. Despite other non-deterministic interpolation techniques, such as geostatistical techniques like Kriging, often being applied, the current work considered the IDW technique to be most proper interpolation technique to also consider the spatial distribution of the sampled locations and build prediction surface maps with some measure of certainty and predictive accuracy [48]. The absence of a higher density of the grid sampled points in such an extensive territory led to discarding of Kriging interpolation.
The IDW interpolation method was conducted within the boundaries of the hydraulically connected aquifers. It was adjusted to 12 site points with a variable search radius, and with a grid size of 50 m. The power parameter, which determines the significance of the model, was defined with a value of 2. The break values were established to represent in red colour the interpolated areas where the activity concentration of the specific radionuclide exceeded their contribution to the ID parametric value stated. Despite 210Po also being considered for ID calculation, we dide not apply IDW interpolation to it because there were a lot of water samples having 210Po activity concentration below MDA. Moreover, only 9 samples exceeded 10 mBq/L, which is a magnitude order lower than the activity concentration that leads to presenting an ID higher than the stated parametric value, Table 1. In the case of the aα and aβ, classification shown in the map legends was performed regarding whether values exceeded the screening value or not, established at 0.1 Bq/L and 1.0 Bq/L, respectively [17,18].

3. Results

Exploration data analysis was performed to gain a better understanding of the spatial distribution, as well as to identify outliers and trends. For each radionuclide and parameter studied, the histogram provided all the statistics and the frequency distribution shape. The right tail shown in Figure 3a indicated a relative lack of large activity concentration values, evidencing that they were not normally distributed. All of them followed a log-normal decreasing continuous probability distribution as can be seen in Figure 3b, where the QQ plot for aα is shown, in which normality was then demonstrated, given that most of the data were close to the 45-degree line. In Table 2, where non-log-normal transformed statistic values are summarised, the skewness values, as well as the differences observed between the mean and median, indicated high asymmetry of the data distribution and the interpolation method improved the modelisation of the dataset A three-dimensional view of the data was given by the trend analysis tool which allowed us to identify global spatial trends in the dataset. According to the distribution pattern observed in Figure 3c, the spatial autocorrelation of high values increased longitudinally from east to west and latitudinally southward, but the latitudinal component had greater weight than the longitudinal one. The variability of the spatial autocorrelation of the sampling points was analysed through the semivariogram cloud (Figure 3d). The theoretical base was the first Tobler’s law, which states that the nearest points are more similar than those that are outermost and are then more predictable and less variable. On the x-axis the distance separating each pair of points was plotted, while the y-axis refers to the relative semivariogram values, which corresponded to the squared difference between each pair of sampling points. As the distance between the pair of sampling points increased, the semivariogram value also increased. The semivariogram cloud shown in Figure 3d indicated that most of the data were spatially autocorrelated.

3.1. Radionuclide Analysis and Their Relationship with the Lithological Context and Permeability

IDW provided the prediction maps for the main natural radionuclides as well as the aα, aβ and ID, which are represented in Figure 4a–f. The spatial distribution pattern predicted for uranium radionuclides, 234U and 238U, showed a similar defined area, as can be seen in Figure 4a,b, but with a greater occurrence of 234U. Although in the mineral grains both radionuclides were frequently in secular equilibrium, the presence of 234U in groundwater was often much higher than the 238U concentration because of the different physicochemical processes involved in their mobilisation. Given that uranium solubility is enhanced under oxidising conditions at near-neutral pH, typical in shallow aquifers, the weathering of mineral-bearing host rock releases the uranium nuclides to groundwater, which is the only mechanism controlling 238U release from crystal lattice to water phase. However, when 238U decays by alpha emission the recoil process may eject 234Th into the mineral lattices close to the water–rock interaction boundary, producing recoil damage tracks where is located. The rapid decay of 234U from 234Th (half-life 24.1 d), promotes the 234U preferential leaching [49].
As seen in Figure 4a, 238U activity concentrations were higher than 100 mBq/L, which corresponded to the recommended screening level for aα, and had been predicted in the southern and central aquifers of the DB region. The concentrations of 238U extended mainly throughout the hydrogeological units of Los Arenales and Segovia, from the southern edges towards the centre of the DB, reaching values up to and exceeding 700 mBq/L in some points (Table 3). Furthermore, in the surrounding areas of the Duero river, the presence of 238U was predicted in significantly high concentrations, mainly in the south of the carbonate aquifers of Páramo de Torozos and Duero Central region, as well as in the detritic hydrogeological units of Alluvial of the Duero and Esla-Valderaduey.
Similarly to 238U, the spatial distribution of high 234U concentrations was found in the southcentral aquifers of the DB, mainly belonging to Los Arenales, Esla Valderaduey, Ciudad Rodrigo-Salamanca and throughout the course of the Duero river, as illustrated in Figure 4b. 234U concentrations exceeding 100 mBq/L were mainly associated with detritic aquifers, but also some groundwaters hosted in the carbonate rocks developed in the Páramo de Torozos, Páramo de Duratón and Páramo de Cúellar, and the outcroppings in the central-north area of Duero Central region.
The outcropping of U-rich granitoid and other intrusive igneous rocks, as well as metamorphosed Hercynian rocks throughout the CS, gave rise to limited and confined fractured aquifers with 238U and 234U concentrations that could even exceed 1300 and 1900 mBq/L, respectively, in some points of these confined aquifers, from previous analysis performed in our laboratory. High naturally-occurring uranium concentrations in soils developed on the Hercynian basement have been reported in the west of Salamanca province [2]. The freshwater infiltration through the fractured basement, runoff in the mountain system of Sª de Ávila and Gredos, and streamflow infiltration from surface bodies recharge the local confined aquifers, where oxic conditions promote the uranium leaching from mineral-bearing to groundwater, leading to an increase in the uranium concentration. The uranium spatial distribution predicted throughout these aquifers could indicate that the Cenozoic detritic deposits comprising the southern part of the DB are influenced by the U-rich mineral composition characteristic of the CS. Porous and moderate to highly productive, predominantly oxic aquifers [50], Cenozoic and Quaternary aquifers of the DB, and the Mesozoic fissured and moderately productive carbonate ones, are recharged through surface infiltration of runoff freshwater, which easily promotes the leaching and dissolution of U-minerals. Furthermore, the general groundwater flux from recharge mountain areas towards the Duero River, as well as the streamflow of fluvial drainage across the Quaternary deposits, may also positively affect uranium mobilisation to groundwater. According to these hydrogeological settings, the IDW method provided a reliable prediction map of the uranium concentrations in the DB aquifers.
Despite 226Ra (half-life 1.6 × 10³ y) and 228Ra (half-life 5.75 y) having the same chemical behaviour, they come from different disintegration chains, 238U and 232Th decay series, respectively. Thus, the head chain radionuclide concentrations in aquifer rocks and their widely varying half-lives can affect the different occurrences of 226Ra and 228Ra in groundwater [51,52]. As seen in Figure 4c, the interpolation map of 226Ra occurrence predicted groundwater concentrations between 100 to 500 mBq/L, values which correspond to aα screening level and the maximum reference concentration (MRC) in drinking waters, respectively, extending through three main locations:
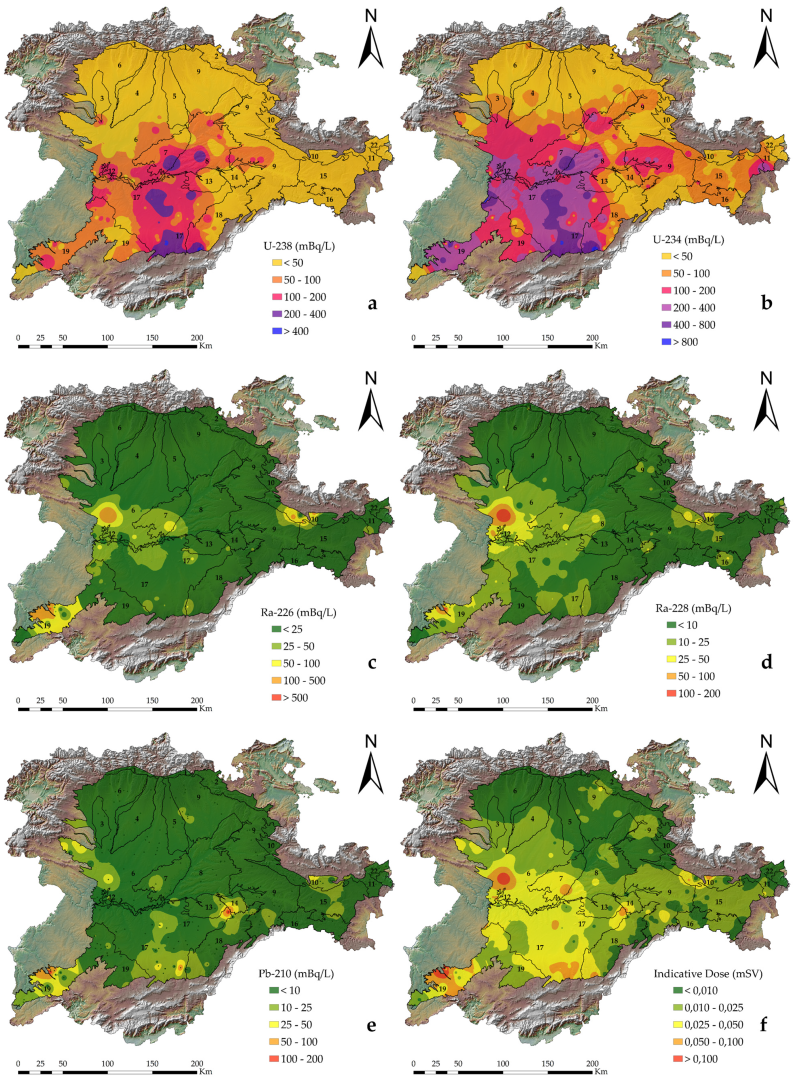
In the central to the west of the Zamora province, and in the western area of the Esla-Valderaduey unit, 226Ra content in groundwaters from the marginal area of Tierra de Campos facies was formed by low to medium permeable detritic rocks, and varied from 100 to 250 mBq/L.
Extending through the southern areas of the Ciudad Rodrigo-Salamanca medium and low permeable detritic aquifers there was up to, or exceeding, 500 mBq/L in Gallegos de Argañan (Salamanca).
In carbonate aquifers of the Arlanza-Ucero-Albión unit, in the Cameros Basin, throughout the Lobos river canyon and the surrounding area of Cabrejas de Pinar, the 226Ra concentration values ranged between 100 and 120 mBq/L.
According to the mechanism that may control the presence of 226Ra in groundwater, the IDW method provided a consistent spatial distribution. The diverse lithological context and the occurrence of high 226Ra concentration may be mainly due to both mineralogical bedrock composition and the chemical properties that govern the water–rock interaction. On the one hand, the elevated uranium content observed in felsic rock and shale groundwater masses enhances the entry of 226Ra into the water by the decay of dissolved parent radionuclides, alpha recoil effect, and desorption from mineral grains. On the other hand, the analogue chemical behaviour of radium with other crustal cations, such as Ca or Ba, may lead to it being included in the carbonate complexes and then mobilised to water through dissolution, adsorption or ion exchange with the reactive surface of other colloids present in groundwater. It can be observed in Figure 4c that in the moderately productive carbonate aquifers, in particular, which extended through the Duero Central region, Páramo de Cúellar and Páramo de Duratón, the 226Ra concentration predicted was <25 mBq/L.
Regarding the 228Ra concentration, given that it decays from 232Th, which in most aquifer conditions tends to precipitate as insoluble hydroxides, high values exceeding MRC (200 mBq/L), were not expected in the study area. As shown in Figure 4d, the prediction map showed a co-occurrence of significant 228Ra concentration in the same areas where 226Ra-rich was found, corresponding to the southwest of the Esla-Valderaduey region aquifers and in the western of the Ciudad Rodrigo-Salamanca unit, with maximum concentrations of 196 and 164 mBq/L, respectively, as reported in Table 3. Nevertheless, in the IDW map, there was no high 228Ra content predicted in the easternmost areas of the Ciudad Rodrigo-Salamanca hydrogeological unit, thus groundwaters of this area must be affected by other local conditions (i.e., groundwater chemical composition and/or 232Th concentration in the rock mineral-bearing) that led to minimizing the presence of 228Ra.
According to the IDW method (Figure 4e), and the concentration values from the analysed groundwater intakes, 210Pb > 200 mBq/L (MRC) was not found in the DB. Significant high concentrations, between 100 and 200 mBq/L, were predicted only in the Ciudad Rodrigo-Salamanca and Los Arenales hydrogeological units, with maximum values exceeding 150 mBq/L at some sampling points, where groundwaters are stored in the Cenozoic and Quaternary medium permeability detritic lithologies. The 210Pb presence in near-neutral pH groundwaters is mainly related to the alpha recoil of 214Pb and its solubility enhancement under reducing conditions [25,53]. Moreover, as 210Pb is a progeny of 226Ra, its presence may be associated with a high 226Ra presence in groundwater. The similarities observed between the spatial distribution of 226Ra and 210Pb in the Ciudad Rodrigo-Salamanca unit, as illustrated in Figure 4c,e, suggest that the same hydrogeological settings are the controlling processes involved in the water–rock interaction and are also the same.

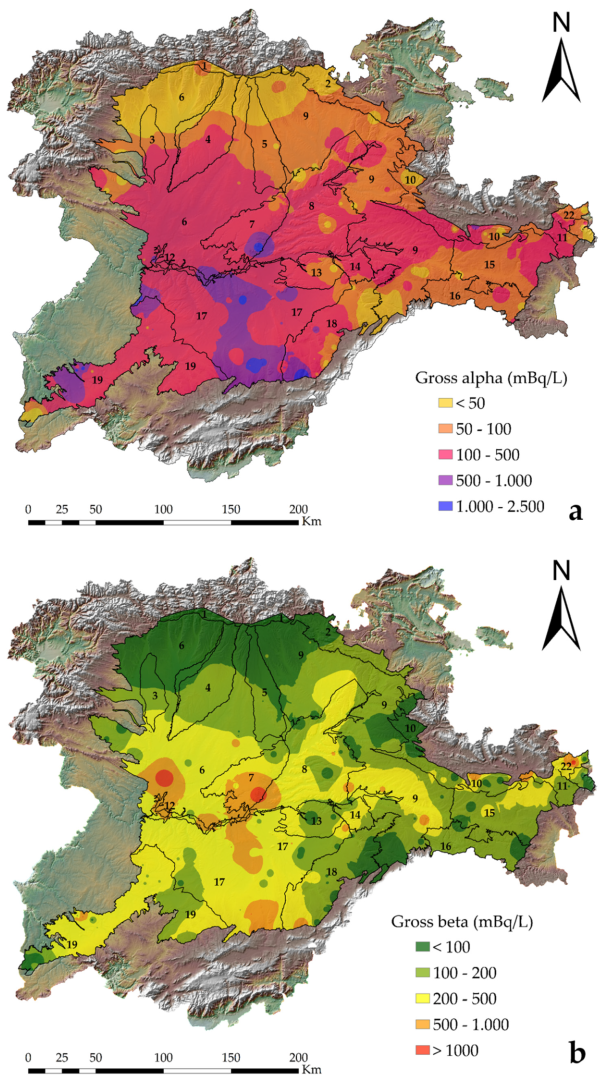
3.2. Radioactivity Parameters Used for Drinking Water Monitoring

As has been discussed in the previous section, the spatial distribution of the uranium isotopes, 238U and 234U, had relatively high concentrations, exceeding 100 mBq/L, in wide areas comprising several hydrogeological units of the DB. Both radioisotopes disintegrate by α emission, so, consequently, their occurrence in groundwater contributes to the aα value. This relation between uranium concentration and aα spatial distribution gave rise to a similar prediction map, as illustrated in Figure 4a,b and Figure 5a. Prediction areas with values higher than 100 mBq/L occupied a wide extension of the Castilla y León territory, and, in the southern boundaries of the Los Arenales, Segovia and Ciudad Rodrigo-Salamanca hydrogeological units. even exceeded by one magnitude order, with a maximum of 2407, 1847, 1223 mBq/L, respectively (Table 3). As can be observed in Figure 5a, in the southern areas of the Los Arenales region and the Segovia HU, the high concentration seemed to follow the groundwater flow pattern towards the centre of the DB, which suggests transference of α emitters, mainly uranium radionuclides, through the unconfined DB aquifers of high concentrations, from the highly influenced mineralogical detritic aquifers to the Duero River. The shape of the interpolated aα matched with the predicted areas of high uranium concentration, as illustrated in Figure 4a,b. In the shallow and well-oxygenated aquifers, formed in alluvial and terraces deposits of the current riverine system occupying the central areas of the DB, aα values were found. Regarding aα prediction in the central carbonate aquifers, especially significant was the concentration in Paramo de Torozos HU, which was higher than 1100 mBq/L, due to the dissolution of the limestones leading to an increase in the concentration of uranium isotopes in groundwater. This correlation between uranium occurrence in the Spanish carbonate aquifers has been previously demonstrated [10,15].
Regarding the aβ prediction map, the occurrence of higher values than their respective screening level, 1000 mBq/L, was limited to small regions within the DB, as seen in Figure 5b. The long-lived 238U-daughters, 234Th and 234mPa, that decay from β-emission, were in secular equilibrium with their parent in the analysed samples. Both β-emitting radionuclides were the main contributors to aβ, especially in the sandy aquifers of the Esla-Valderaduey region and the Páramo de Torozos HU, with maximum values of 1547 and 1425 mBq/L, respectively. It should be noted that aβ hot spots were also influenced by the contribution of the highest 228Ra and 210Pb concentrations, such as those occurring in groundwaters from the southwestern of the Ciudad Rodrigo-Salamanca HU.
According to the ID prediction map shown in Figure 4f, the radioactivity content in groundwaters from the southwestern areas of Ciudad Rodrigo-Salamanca HU, as well as the aquifers placed in the southwestern of the Esla-Valderaduey region, predicted ID that exceeded their corresponding parametric value. The maximum ID values of 0.32 and 0.17 mSv corresponded to both hydrogeological units, respectively, as reported in Table 3. This meant that the consumption of these groundwaters may pose a risk to public health. The suitability of the screening levels as a monitoring strategy is out of the scope of this research, and, due to the low selectivity of screening levels, especially the aα not really appropriate. The interpolation maps do, however, provide evidence that performing specific radionuclide analysis to properly evaluate the radioactivity quality of the groundwaters for human consumption, is necessary.

4. Conclusions

As part of more extensive research concerning the groundwater radiological characterisation of CyL, this paper addressed the use of a proper interpolation method, IDW, for elaborating radioactivity prediction maps to provide an overview concerning radioactive spatial distribution in the hydraulically interconnected aquifers of the DHC. The major occurrence of 234U and 238U activity concentrations were found in the southern area of the DB, mainly promoted by the groundwater flux toward the Duero River, leaching the minerals of the dentritic materials, which form a moderate to highly productive aquifer system, the composition of which is influenced by the igneous and metamorphosed rocks of the CS. Despite the presence of the radionuclides from the natural U- and Th-decay series in groundwater being controlled by several interconnected hydrogeochemical and physical parameters, such as redox, pH, adsorption/desorption rates, water composition, alpha recoil, etc., and water-rock interaction, the geostatistical analysis performed showed that the radioactivity content in DHC groundwaters is related to the hydrogeological context.
It should be underlined that further hydrogeological evaluation is necessary for a better understanding of the behaviour of radionuclides in groundwaters, which was out of the scope of this study. The prediction maps generated a worthwhile qualitative overview concerning the spatial distribution of radionuclides in the studied area. Maps can contribute towards improving radioactivity quality control planning, and in identifying hazardous-prone areas, in which the consumption of groundwaters may pose a potential risk to human health. According to the current drinking water framework, and given the radionuclide spatial distribution content in the DB, the use of the prediction maps of aα and aβ may not be suitable as a radioactivity screening strategy for cost-effective management in groundwater quality control.

Author Contributions

Conceptualization, D.B.-A.; methodology D.B.-A., B.Q., A.M.M.-G. and J.C.L.; software, D.B.-A.; validation, D.B.-A., B.Q., A.M.M.-G. and J.C.L.; formal analysis, D.B.-A.; investigation, D.B.-A. and B.Q.; resources, D.B.-A. and B.Q.; data curation, D.B.-A., B.Q. and A.M.M.-G.; writing—original draft preparation, D.B.-A.; writing—review and editing, D.B.-A.; visualization, D.B.-A.; supervision, D.B.-A., A.M.M.-G., B.Q. and J.C.L.; project administration, B.Q.; funding acquisition, B.Q. All authors have read and agreed to the published version of the manuscript.

Funding

This research received no external funding.

Institutional Review Board Statement

Not applicable.

Informed Consent Statement

Not applicable.

Data Availability Statement

The data presented in this study are available on request from the corresponding author.

Acknowledgments

The authors wish to acknowledge the staff of the Dirección General de Salud Pública of Junta de Castilla y León for the planning, sampling and discussion of the results during the course of the project. This work was promoted and funded by the Dirección General de Salud Pública (Consejería de Sanidad de la Junta de Castilla y León), in the framework of the research project “Radiological characterisation of groundwater intakes intended for human consumption”.

Conflicts of Interest

The authors declare no conflict of interest.

References

  1. De Stefano, L.; Martínez-Santos, P.; Villarroya, F.; Chico, D.; Martínez-Cortina, L. Easier said than done? The establishment of baseline groundwater conditions for the implementation of the water framework directive in Spain. Water Resour. Manag. 2013, 27, 2691–2707. [Google Scholar] [CrossRef]
  2. Santos-Francés, F.; Gil-Pacheco, E.; Martínez-Graña, A.; Alonso-Rojo, P.; Ávila-Zarza, C.; García-Sanchez, A. Concentration of uranium in the soils of the west of Spain. Environ. Pollut. 2018, 236, 1–11. [Google Scholar] [CrossRef] [PubMed]
  3. Luque-Espinar, J.A.; Pardo-Igúzquiza, E.; Grima-Olmedo, J.; Grima-Olmedo, C. Multiscale analysis of the spatial variability of heavy metals and organic matter in soils and groundwater in Spain. J. Hydrol. 2018, 561, 348–371. [Google Scholar] [CrossRef]
  4. Wang, Z.; Su, Q.; Wang, S.; Gao, Z.; Liu, J. Spatial distribution and health risk assessment of dissolved heavy metals in groundwater of eastern China coastal zone. Environ. Pollut. 2021, 290, 118016. [Google Scholar] [CrossRef] [PubMed]
  5. Santos-Francés, F.; Martínez-Graña, A.; Ávila-Zarza, C.; Criado, M.; Sáncez-Sánchez, Y. Soil quality and evaluation of spatial variability in a semi-arid ecosystem in a region of the southeasterrn Iberian Peninsula. Land 2022, 11, 5. [Google Scholar] [CrossRef]
  6. Godoy, J.M.; Godoy, M.L. Natural radioactivity in Brazilian groundwater. J. Environ. Radioact. 2006, 85, 71–83. [Google Scholar] [CrossRef]
  7. Labidi, S.; Mahjoubi, H.; Essafi, F.; Ben Salah, R. Natural radioactivity levels in mineral, therapeutic and spring waters in Tunisia. Radiat. Phys. Chem. 2010, 79, 1196–1202. [Google Scholar] [CrossRef]
  8. Akweetelela, A.; Kgabi, N.; Zivuku, M.; Mashauri, D. Environmental radioactivity of groundwater and sediments in the Kuiseb and Okavango-Omatako basin in Namibia. Phys. Chem. Earth Parts A/B/C 2020, 120, 102911. [Google Scholar] [CrossRef]
  9. Rojas, L.V.; Santos Junior, J.A.; Corcho-Alvarado, J.A.; Amaral, R.S.; Rölin, S.; Milan, M.O.; Herrero, Z.; Francis, K.; Cavalcanti, M.; Santos, J.M.N. Quality and management status of the drinking water supplies in a semiarid region of Northeastern Brazil. J. Environ. Sci. Health Part A 2020, 55, 1247–1256. [Google Scholar] [CrossRef]
  10. Pérez-Moreno, S.M.; Guerrero, J.M.; Mosqueda, F.; Gázquez, M.J.; Bolívar, J.P. Hydrochemical behaviour of long-lived natural radionuclides in Spanish groundwaters. Catena 2020, 191, 104558. [Google Scholar] [CrossRef]
  11. Shabana, E.I.; Kinsara, A.A. Radioactivity in the groundwater of a high background radiation area. J. Environ. Radioact. 2014, 137, 181–189. [Google Scholar] [CrossRef] [PubMed]
  12. Sherif, M.I.; Lin, J.; Poghosyan, A.; Abouelmagd, A.; Sultan, M.I.; Sturchio, N.C. Geological and hydrogeochemical controls on radium isotopes in groundwater of the Sinai Peninsula, Egypt. Sci. Total Environ. 2018, 613, 877–885. [Google Scholar] [CrossRef]
  13. Stackelberg, P.; Szabo, Z.; Jurgens, B.C. Radium mobility and the age of groundwater in public-drinking-water supplies from the Cambrian-Ordovician aquifer system, north-central USA. Appl. Geochem. 2018, 89, 34–48. [Google Scholar] [CrossRef]
  14. Ulrich, S.; Gillow, J.; Roberts, S.; Byer, G.; Sueker, J.; Farris, K. Hydrogeochemical and mineralogical factors influencing uranium in background area groundwater wells: Grants, New Mexico. J. Hydrol. Reg. Stud. 2019, 26, 100636. [Google Scholar] [CrossRef]
  15. Ratia, J.M.; Hernando, A.P.; Aguilar, C.; Ballarín, F.B. Role of lithology in the presence of natural radioactivity in drinking water samples from Tarragona province. Environ. Sci. Pollut. Res. 2021, 28, 39333–39344. [Google Scholar] [CrossRef] [PubMed]
  16. World Health Organization. Management of Radioactivity in Drinking Water; World Health Organization: Geneva, Switzerland, 2018. [Google Scholar]
  17. Council Directive 2013/51/EURATOM of 22 October 2013 Laying down Requirements for the Protection of the Health of the General Public with Regard to Radioactive Substances in Water Intended for Human Consumption. Available online: http://data.europa.eu/eli/dir/2013/51/oj (accessed on 11 February 2022).
  18. RD 314/2016. Real Decreto 314/2016, de 29 de julio, por el que se modifican el Real Decreto 140/2003, de 7 de febrero, por el que se establecen los criterios sanitarios de la calidad del agua de consumo humano, el Real Decreto 1789/2010, de 30 de diciembre, por el que se regula la explotación y comercialización de aguas minerales, naturales y aguas de manantial envasadas para consumo humano, y el Real Decreto 1799/2010, de 30 de diciembre, por el que se regula el proceso de elaboración y comercialización de aguas preparadas envasadas para el consumo humano. Boletín Oficial Estado 2016, 183, 53106–53126.
  19. Paul, R.; Brindha, K.; Gowrisankar, G.; Tan, M.L.; Singh, M.K. Identification of hydrogeochemical processes controlling groundwater quality in Tripura, Northeast India using evaluation indices, GIS, and multivariate statistical methods. Environ. Earth Sci. 2019, 78, 470. [Google Scholar] [CrossRef]
  20. Panneerselvam, B.; Paramasivam, S.K.; Karuppannan, S.; Ravichandran, N.; Selvaraj, P. A GIS-based evaluation of hydrochemical characterisation of groundwater in hard rock region, South Tamil Nadu, India. Arab. J. Geosci. 2020, 13, 837. [Google Scholar] [CrossRef]
  21. Keshavarzi, A.; Tuffour, H.O.; Brevik, E.C.; Ertunc, G. Spatial variability of soil mineral fractions and bulk density in Northern Ireland: Assessing the influence of topography using different interpolation methods and fractal analysis. Catena 2021, 207, 105646. [Google Scholar] [CrossRef]
  22. Asikainen, M.; Kahlos, H. Anomalously high concentrations of uranium, radium and radon in water from drilled wells in the Helsinki region. Geochim. Cosmochim. Acta 1979, 43, 1681–1686. [Google Scholar] [CrossRef]
  23. Banks, D.; Royset, O.; Strand, T.; Skarphagen, H. Redioelement (U, Th, Rn) concentrations in Norwegian bedrock groundwaters. Environ. Geol. 1995, 25, 165–180. [Google Scholar] [CrossRef]
  24. Siegel, M.D.; Bryan, C.R. Radioactivity, Geochemistry, and Health. In Treatise on Geochemistry, 2nd ed.; Henrich, D.H., Turekian, K.T., Eds.; Elsevier: Amsterdam, The Netherlands, 2014; Volume 11, pp. 191–256. [Google Scholar] [CrossRef]
  25. Szabo, Z.; Stackelberg, P.E.; Cravotta III, C.A. Occurrence and geochemistry of lead-210 and polonium-210 radionuclides in public-drinking-water supplies from principal aquifers of the United States. Environ. Sci. Technol. 2020, 54, 7236–7249. [Google Scholar] [CrossRef] [PubMed]
  26. Hu, K.; Huang, Y.; Li, H.; Baoguo, L.; Chen, D.; White, R.E. Spatial variability of shallow groundwater level, electrical conductivity and nitrate concentration, and risk assessment of nitrate contamination in North China Plain. Environ. Int. 2005, 31, 896–903. [Google Scholar] [CrossRef] [PubMed]
  27. Skeppström, K.; Olofsson, B. A prediction method for radon in groundwater using GIS and multivariate statistics. Sci. Total Environ. 2006, 367, 666–680. [Google Scholar] [CrossRef] [PubMed]
  28. Valencia-Ortiz, J.A.; Martínez-Graña, A.M. A neural network model applied to landslide susceptibility analysis. Geomat. Nat. Hazards Risk 2018, 9, 1106–1128. [Google Scholar] [CrossRef]
  29. Gong, G.; Mattevada, S.; O’Bryant, S.E. Comparison of the accuracy of Kriging and IDW interpolations in estimating groundwater arsenic concentrations in Texas. Environ. Res. 2014, 130, 59–69. [Google Scholar] [CrossRef] [PubMed]
  30. Kumar, S.; Sangeetha, B. Assessment of groundwater quality in Madurai city by using geospatial techniques. Groundw. Sustain. Dev. 2020, 10, 100297. [Google Scholar] [CrossRef]
  31. Zhu, H.C.; Charlet, J.M.; Poffijn, A. Radon risk mapping in southern Belgium: An application of geostatistical and GIS techniques. Sci. Total Environ. 2001, 272, 203–210. [Google Scholar] [CrossRef]
  32. Kobya, Y.; Taşkin, H.; Yeşilkanat, C.M.; Çevik, U.; Karahan, G.; Çakir, B. Radioactivity survey and risk assessment study for drinking water in the Artvin province, Turkey. Water Air Soil Pollut. 2015, 226, 49. [Google Scholar] [CrossRef]
  33. Junta de Castilla y León. Mapa Geológico y Minero de Castilla y León, Escala 1:400.000; SIEMCALSA: Valladolid, Spain, 1997. [Google Scholar]
  34. IGME. Mapa Geológico de la Peninsula Ibérica, Baleares y Canarias a Escala 1:1.000.000; IGME: Madrid, Spain, 1995. [Google Scholar]
  35. Del Pozo Gómez, M. Mapa Litoestratigráfico, de Permeabilidad e Hidrogeológico βde España Continuo Digital a Escala 1:200.000. Convenio de Colaboración Entre el Ministerio de Medio Ambiente y el Instituto Geológico y Minero de España para la Realización de Trabajos Técnicos en Relación con la Aplicación de la Directiva Marco del Agua en Materia de Agua Subterránea; IGME: Madrid, Spain, 2009. [Google Scholar]
  36. Borrego-Alonso, D.; Quintana, B.; Lozano, J.C. Revisiting methods for the naturally-occurring radioactivity assessment in drinking waters. Appl. Radiat. Isot. 2022. submitted. [Google Scholar]
  37. García-Talavera, M.; Neder, H.; Daza, M.J.; Quintana, B. Towards a proper modelling of detector and source characteristics in Monte Carlo simulations. Appl. Radiat. Isot. 2000, 52, 777–783. [Google Scholar] [CrossRef]
  38. Daza, M.J.; Quintana, B.; García-Talavera, M.; Fernández, F. Efficiency calibration of an HPGe detector in the 46.54–2000 keV energy range for the measurement of environmental samples. Nucl. Instrum. Methods Phys. Res. A 2001, 470, 520–532. [Google Scholar] [CrossRef]
  39. Quintana, B.; Pedrosa, M.C.; Vázquez-Canelas, L.; Santamaría, R.; Sanjuán, M.A.; Puertas, F. A method for the complete analysis of NORM building materials by y-ray spectrometry using HPGe detectors. Appl. Radiat. Isot. 2018, 134, 470–476. [Google Scholar] [CrossRef] [PubMed]
  40. Quintana, B.; Fernández, F. Gamma-ray spectral analysis with the COSPAJ continuum fitting routine. Appl. Radiat. Isot. 1998, 49, 9–11. [Google Scholar] [CrossRef]
  41. LNHB. Nucléide-Lara, Library for Gamma and Alpha Emissions. 2020. Available online: http://www.nucleide.org/Laraweb/ (accessed on 11 February 2022).
  42. Hallstadius, L. A method for the electrodeposition of actinides. Nucl. Instrum. Methods Phys. Res. 1984, 223, 266–267. [Google Scholar] [CrossRef]
  43. Horwitz, E.P.; Dietz, M.L.; Chiarizia, R.; Diamond, H.; Essling, A.M.; Graczyk, D. Separation and preconcentration of uranium from acidic media by extraction chromatography. Anal. Chim. Acta 1998, 266, 25–37. [Google Scholar] [CrossRef]
  44. Flynn, W.W. The determination of low levels of polonium-210 in environmental materials. Anal. Chim. Acta 1968, 43, 221–227. [Google Scholar] [CrossRef]
  45. Férnandez, P.L.; Gómez, J.; Ródenas, C. Evaluation of uncertainty and detection limits in 210Pb and 210Po measurement in water by alpha spectrometry using 210Po spontaneous deposition onto silver disk. Appl. Radiat. Isot. 2012, 70, 758–764. [Google Scholar] [CrossRef]
  46. World Organization of Health. Guidelines for Drinking Water Quality: 4th ed Incorporating the First Addendum; World Organization of Health: Geneva, Switzerland, 2017. [Google Scholar]
  47. ESRI. Creating, Editing and Managing Geodatabases for ArcGis Desktop; Virtual Campus, ESRI Educational Service, Environmental Systems Research Institute, Inc.: Redlands, CA, USA, 2014. [Google Scholar]
  48. Li, J.; Heap, A.D. A review of comparative studies of spatial interpolation methods in environmental sciences: Performances and impact factors. Ecol. Inform. 2011, 6, 228–241. [Google Scholar] [CrossRef]
  49. Osmond, J.K.; Cowart, J.B. U-series nuclides as tracers in groundwater hydrology. In Environmental Tracers in Subsurface Hydrology; Cook, P.G., Herczeg, A.L., Eds.; Springer: Boston, MA, USA, 2000; pp. 145–173. [Google Scholar] [CrossRef]
  50. Giménez-Forcada, E.; Smedley, P.L. Geological factors controlling occurrence and distribution of arsenic in groundwaters from the southern margin of the Duero Basin, Spain. Environ. Geochem. Health 2014, 36, 1029–1047. [Google Scholar] [CrossRef] [Green Version]
  51. Sturchio, N.C.; Banner, J.L.; Binz, C.M.; Heraty, L.B.; Musgrove, M. Radium geochemistry of groundwaters in Palaeozoic carbonate aquifers, midcontinent, USA. Appl. Geochem. 2001, 16, 109–122. [Google Scholar] [CrossRef]
  52. Vengosh, A.; Coyte, R.M.; Podgorski, J.; Johnson, T.M. A critical review on the occurrence and distribution of the uranium- and thorium-decay nuclides and their effects on the quality of groundwater. Sci. Total Environ. 2022, 808, 151914. [Google Scholar] [CrossRef] [PubMed]
  53. Jurgens, B.C.; Parkhurst, D.L.; Belitz, K. Assessing the lead solubility potential of untreated groundwater of the United States. Environ. Sci. Technol. 2019, 53, 3095–3103. [Google Scholar] [CrossRef] [PubMed] [Green Version]
Figure 1. Map of the main lithologies and sampling sites (in black dots) of the studied groundwaters of Castilla y León (Spain), belonging to the centre of DHC.
Agronomy 12 02059 g001
Figure 2. Permeability map of the Castilla y León region according to the main lithologies. Black lines limit the 20 hydrogeological units of the DHC studied.
Agronomy 12 02059 g002
Figure 3. Geostatistical exploration corresponding to the aα analysis: (a) histogram; (b) log-transformed QQ normal plot; (c) trend analysis; (d) semivariogram.
Agronomy 12 02059 g003
Figure 4. Spatial distribution of the main natural radionuclides in groundwater and the ID. IDW interpolation technique was applied: (a) 238U activity concentration; (b) 234U activity concentration; (c) 226Ra activity concentration; (d) 228Ra activity concentration; (e) 210Pb activity concentration; (f) ID. The hydrogeological unit names corresponding to the numbers illustrated are referred to in Figure 2.
Agronomy 12 02059 g004
Figure 5. Spatial distribution of the gross alpha activity (a) and gross beta activity (b) screening levels for the hydraulically unconfined aquifer system of the Duero Basin. The hydrogeological unit names corresponding to the numbers illustrated are referred to in Figure 2.
Agronomy 12 02059 g005
Table 1. Derived concentrations corresponding to the main natural radionuclides present in the studied samples for ID calculation according to Annexe X of RD 314/2016.
Radionuclide210Pb226Ra228Ra234U238U
Derived concentration (Bq/L)0.20.50.22.83.0
Table 2. Statistical analysis of activity concentration of the main natural radionuclides and radioactivity parameters in the interconnected groundwaters of Castilla y León.
234U238U226Ra228Ra210PbIDaαaβ
Mean   ( x ¯ )13158.224.049.6216.120.8215228
Median (Me)51.421.85.304.104.8411.6108.0132
Minimum (min)0.070.040.130.030.370.330.671.83
Maximum (max)1616705116219651231824071547
Standard deviation (S)20891.186.8018.947.428.5323.3254
Kurtosis20.016.8101.0858.464.753.120.1849.45
Skewness3.573.259.166.597.145.723.642.35
Table 3. Minimum, maximum and median radioactivity values of the analysed samples according to their respective hydrogeological unit (HU). Results from HU nº 14 are not included because samples were not gathered from there.
HU 238U234U228Ra226Ra210PbIDaαaβ
mBq/LmBq/LmBq/LmBq/LmBq/LμSvmBq/LmBq/L
1Min–Max0.91–36.81.53–66.80.36–11.20.18–11.60.84–5.90.48–12.911.1–91.617.5–241
Median12.449.46.55.52.85.551.657.0
2Min–Max3.69–7.893.94–6.610.39–0.430.25–0.310.84–2.161.03–1.9214.3–19.521.7–35.0
Median5.795.280.410.281.501.4716.928.4
3Min–Max0.72–37.01.48–91.72.10–6.260.92–5.963.88–8.604.88–11.127.12–11530.1–150
Median12.528.33.822.954.397.3943.196.7
4Min–Max0.3–42.20.86–81.30.49–9.280.66–24.81.52–6.565.03–13.628.9–11750.4–175
Median24.433.94.573.864.0812.3112134
5Min–Max0.92–37.51.99–53.10.42–3.901.40–3.361.12–9.762.04–10.68.95–10746.0–136.0
Median18.620.71.21.955.36.5742.774.4
6Min–Max0.04–169.80.07–2470.17–1960.41–2511.16–1662.46–1726.68–81720.0–1547
Median21.644.65.211.84.5212.1127134
7Min–Max15.5–40019.9–7862.10–27.22.41–73.02.90–15.66.32–72.371.8–117482–1425
Median66.279.49.9245.26.3628.5157492
8Min–Max5.60–3217.94–4340.46–33.11.32–32.00.96–10.13.01–29.417.3–48120.9–909
Median29.149.73.427.202.446.9393.7160
9Min–Max0.13–1460.46–2510.31–18.80.17–25.20.88–24.12.05–74.519.8–43629.1–792
Median16.725.33.143.963.9810.1670.8100
10Min–Max1.20–31.31.05–1240.40–48.10.54–1220.85–51.80.89–76.724.7–67228.0–956
Median13.027.36.766.296.016.5441.280.3
11Min–Max4.97–50.322.1–3721.61–13.11.48–39.60.78–11.65.17–27.138.5–45252.0–1191
Median16.931.82.181.863.277.9681.95160
12Min–Max17.6–170108–4873.10–53.04.58–77.21.20–15.013.1–63.4174–681312–819
Median1522969.756.488.5630.8482600
13Min–Max12.1–18.414.9–72.31.85–2.924.36–7.131.44–10.75.95–12.228.8–65.037.0–141
Median16.615.82.094.861.7210.460.577.0
15Min–Max9.62–22.640.3–66.82.42–11.23.10–11.61.20–4.808.17–12.951.6–91.757.6–241
Median13.950.77.058.582.589.3774.0129
16Min–Max9.76–48.613.2–1060.88–27.10.48–16.91.45–24.02.39–23.126.5–12837.7–198
Median15.947.01.613.292.434.8992.6100
17Min–Max5.84–7057.52–16160.03–34.41.76–61.21.08–1226.73–94.970.8–240759.5–1325
Median94.32376.2815.16.3232.4300310
18Min–Max8.24–48511.0–11000.51–29.70.70–62.40.72–23.11.86–69.012.5–184749–781
Median18.545.43.842.323.688.8674.0112
19Min–Max1.76–1992.07–8910.37–1640.16–7381.76–1568.74–3186.07–122351.4–1015
Median43.613611.716.27.1223.2254189
20Min–Max0.21–48.20.48–69.40.26–4.450.13–17.51.92–6.080.33–10.60.67–1581.83–179
Median5.565.971.660.722.322.344.1025.8
Publisher’s Note: MDPI stays neutral with regard to jurisdictional claims in published maps and institutional affiliations.

