Article

Soil Biological Activity, Carbon and Nitrogen Dynamics in Modified Coffee Agroforestry Systems in Mexico

by
Diana Ayala-Montejo
1,2,
Eduardo Valdés-Velarde
3,
Gerardo Sergio Benedicto-Valdés
4,
Esteban Escamilla-Prado
5,
Rufo Sánchez-Hernández
6,
Juan Fernando Gallardo
7 and
Pablo Martínez-Zurimendi
2,8,*
1
CONACYT-El Colegio de la Frontera Sur, Av. Insurgentes Sur 1582, Col. Crédito Constructor, Alcaldía Benito Juárez, Mexico 03940, Mexico
2
Departamento de Agricultura, Sociedad y Ambiente, Unidad Villahermosa, El Colegio de la Frontera Sur, Carretera Villahermosa-Reforma Km 15.5, Ranchería Guineo II Sección, Villahermosa 86280, Mexico
3
Centro de Agroforestería para el Desarrollo Sostenible, Universidad Autónoma Chapingo, Carretera México-Texcoco Km 38.5, Chapingo, Texcoco 56230, Mexico
4
Colegio de Postgraduados, Postgrado Edafología, Campus Montecillo, Mexico 56230, Mexico
5
Centro Regional Universitario Oriente, Universidad Autónoma Chapingo, Carretera Huatusco-Jalapa Km 6, Huatusco, Veracruz 94100, Mexico
6
División Académica de Ciencias Agropecuarias, Universidad Juárez Autónoma de Tabasco, Carretera Villahermosa-Teapa Km 25.2 Rancheria la Huasteca II Sección, Villahermosa 86298, Mexico
7
Higher Council of Scientific Research (CSIC), IRNASa, 37008 Salamanca, Spain
8
Instituto de Gestión Forestal Sostenible (IUFOR), Universidad de Valladolid-INIA, Av. Madrid 44, 34004 Palencia, Spain
*
Author to whom correspondence should be addressed.
Agronomy 2022, 12(8), 1794; https://doi.org/10.3390/agronomy12081794
Submission received: 13 June 2022 / Revised: 20 July 2022 / Accepted: 22 July 2022 / Published: 29 July 2022

Abstract

:
(1) Background: Coffee agroforestry systems (CAFS) in Veracruz, Mexico, are being displaced by avocado monocultures due to their high economic value. This change can generate alterations in the type of organic residues produced and soil biological activity (SBA) which is sensitive to climatic variations, changes in floristic composition, and agronomic management. It can be evaluated through soil respiration and macrofauna, both related to soil carbon (C) and nitrogen (N) dynamics. The objective was to: (1) Analyze the variation of SBA as well as the C and N dynamics in modified coffee agroforestry systems; (2) Methods: Three CAFS (renewed, intensive pruning, and with the introduction of avocados) and an avocado plantation were compared. The evaluations were conducted during the period 2017–2019. Soil parameters (respiration, macrofauna, C and N contents) and C content of plant biomass were measured in plots of 25 × 25 m2 from three soil depths in triplicate. Spearman’s test and a principal component analysis were performed to determine the structural dependence on C and N dynamics; (3) Results: The introduction of avocado showed the lowest soil respiration values (with 193 g CO2 ha−1 h−1 at 0–10 cm depth), this system did not display soil macrofauna and increased soil organic carbon content. The soil C/N ratio was sensitive to the introduction of avocado. Correlation between soil respiration and litter-related parameters was positive, but it was negatively correlated with soil organic matter and total soil nitrogen, explaining 67.7% of the variation; (4) Conclusions: Modification of CAFS generated variations in the SBA and soil C and N contents.

Graphical Abstract

1. Introduction

Coffee agroforestry systems (CAFS) are characterized by high floristic diversity, bringing economic and social benefits for small farmers, and playing an important role in soil biological activity. In Mexico, rising costs of production, low coffee prices, and damages caused by rust (Hemileia vastatrix, Berkeley & Broome) affect the yield of coffee plantations, among others, leading to the incorporation of avocados, which is a crop that demands a high percentage of light and can provide shadow to the CFAS. These changes can affect the type of vegetation and interactions between plant species, generating different quantities and quality of organic residues (OR), affecting overall the soil biological activity [1,2].
The CAFS have a distribution of 730,011 ha in Mexico [3]. However, prices and the sanitary problems mainly caused by H. vastatrix [4,5] have significantly influenced coffee producers either to abandon the production itself, or to look for other agricultural products to improve their economic income. This is why new coffee plantation managements have been tried, including new varieties or different tree species, one of which is avocado, which is either intercropped in coffee plantations, or planted to replace the old CAFS, mainly due to its attractive international market price [6]. Consequently, avocado monocultures have generated the displacement of traditional CAFS. Currently, there are some studies on the effect of the introduction of avocados to increase the profitability of CAFS [7]; however, the effects on soils, as well as carbon (C) and nitrogen (N) dynamics, have not yet been fully studied.
Soil biological activity (SBA) can be studied through soil respiration (SR), as a second most important C flux to the atmosphere, being an important part of the C dynamic in terrestrial systems. SR is composed of autotrophic (roots) and heterotrophic (mycorrhizae and soil microorganisms) respiration [8], including the processes of decomposition and mineralization of organic residues, which release CO2. These processes are dependent on the nature and content of the OR generated by management, environmental temperature and humidity, and the nature of the soil organic matter (SOM).
Heterotrophic SR is associated with the respiration of microbial communities, taking OR as a source of energy to carry out metabolic processes [9]. Only 10% of OR escapes from mineralization and is transformed and converted slowly in recalcitrant C compounds, undergoing humification processes that transform them into biostable compounds [10]. Heterotrophic SR is linked to soil macrofauna, altering the OR fragments, reducing their sizes, and increasing their specific surface area, which allows microbial processes and later providing CO2 emissions [10]. Microbial transformations are associated with corresponding CO2 emissions during the processes of degradation, decomposition, or mineralization of the OR [11], contributing to the C cycle (i.e., returning CO2 to the atmosphere) and favoring the availability of inorganic nutrients (mainly N, therefore affecting the soil dynamics).
The SBA can be used as a parameter to monitor the C cycle [12] since there is a close correlation between SR and stored soil organic carbon (SOC). Also, the type of system, vegetation density, soil properties, and agronomic managements directly affect SR [13,14]. This is also related to the decomposition process of OR and, therefore, to its C/N ratio [10]; frequently, when soil respiration is low due to a generally high C/N (above 20) ratio of the OR associated with nutrient-deficient soils [15].
As stated, the C/N ratio of OR has an inverse relationship with the N mineralization process, which includes the OR integrated previously into the soil; consequently, a high C/N ratio of OR affects soil ammonium and nitrate concentration in soil. Production of soil inorganic N (SIN = [NH4+] + [NO3]) can vary due to the floristic composition of systems, climate, and management types; generally, higher SIN amounts are found in natural systems than in cropland [14].
Therefore, the objective of this study to evaluate the variation of soil biological activity, and its impact on C and dynamics in CAFS. To address the objective of this study, CAFS with renewed rust tolerant coffee plants, severe pruning and cleaning management practices, and intercropped avocados, as well as an avocado monoculture as control, were considered. Comparisons between CAFS were made considering the CO2 emissions and soil-macrofauna content as indicators of biological activity, in addition to the impacts of management on soil C and N contents.

2. Materials and Methods

The experiment was conducted in the municipality of Chicuellar Huatuso, State of Veracruz, México (19°10′25.00′′ NL and 96°57′30.00′′ WL), located at 1300 masl. Climate is semi-warm and humid with abundant rainfalls, with an average annual temperature of 16.4 °C and an annual rainfall of 2018 mm yr−1. The agroforestry systems (AFS) studied are generally located in undulating, mountainous, and humid environments. These AFS correspond to traditional coffee polycultures and commercial polycultures, according to the Escamilla [16] classification for AFS with coffee for Mexico. The dominant soils in the area studied have been classified as Andisols; soil profiles are characterized [16,17] by the accumulation of organo-mineral complexes, having black color, sandy loam texture, strongly acidic pH (4.7 on average), and high contents of SOM (5.9%) and total N (0.4%).
Four management systems were selected:
-
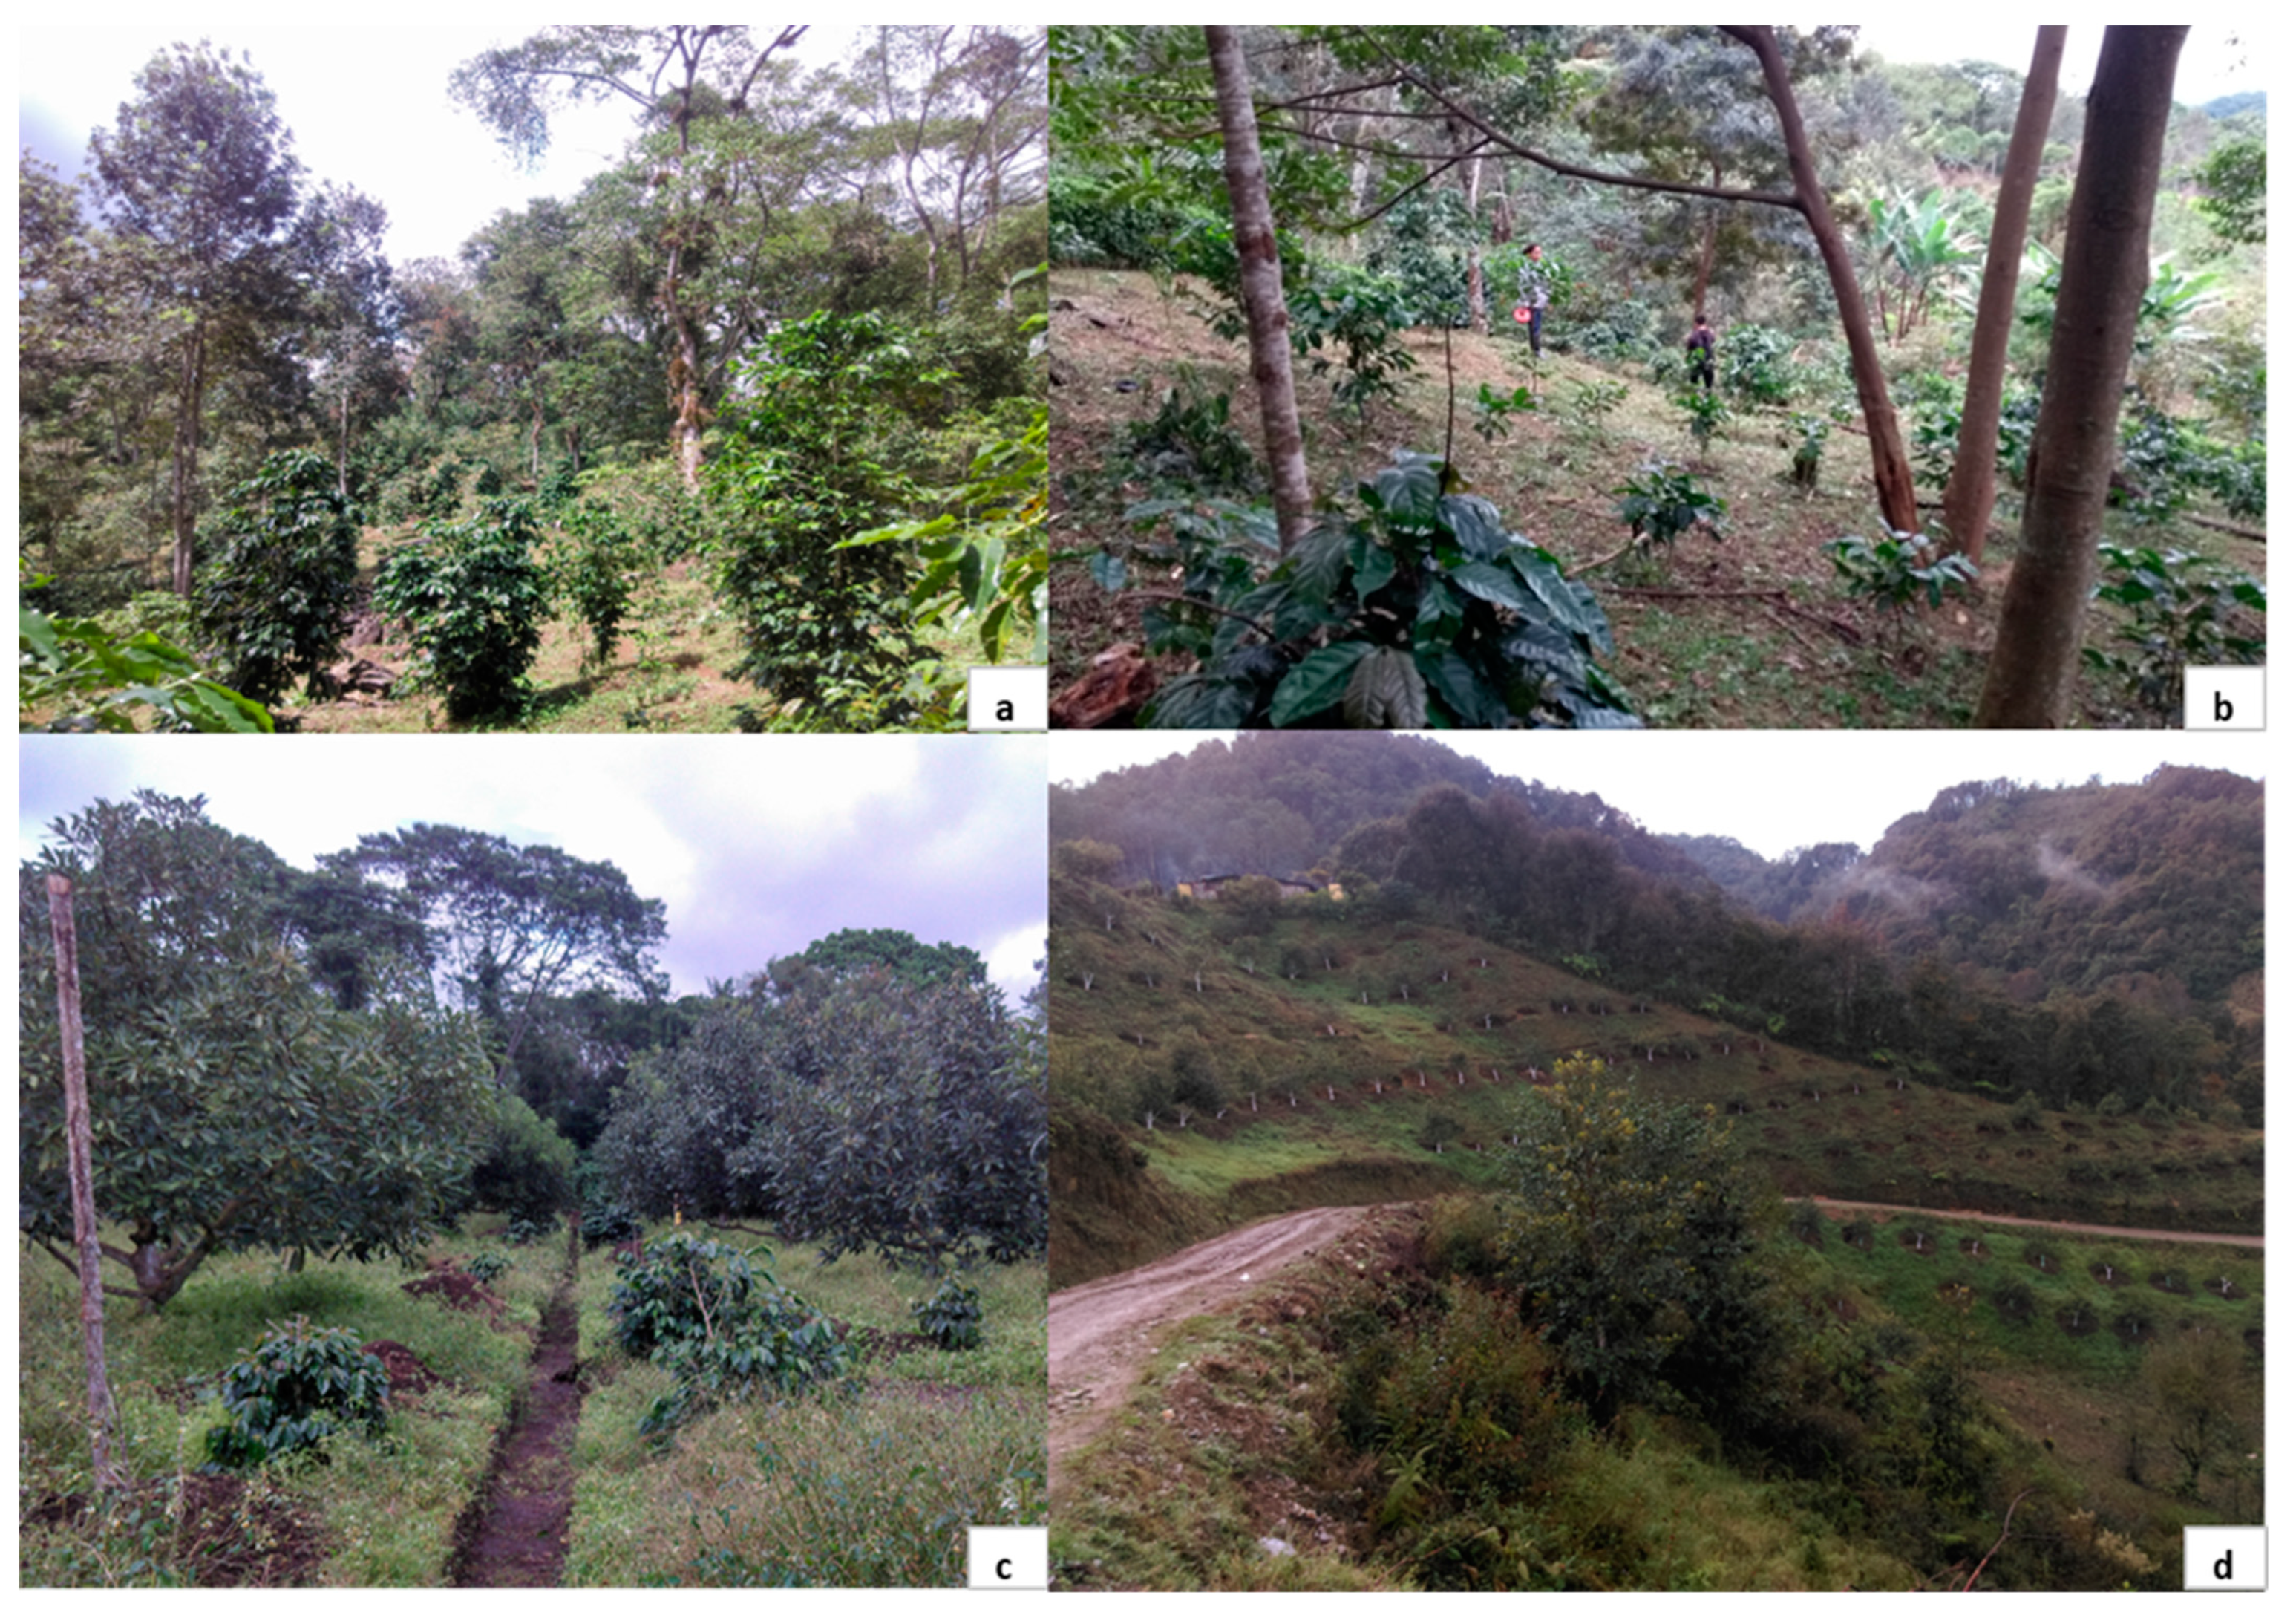
Renovated coffee agroforestry system (RCS). This is managed with 4000 coffee plants ha−1, newly planted, with an average height and diameter over 15 cm of 0.65 and 0.013 m, respectively, and 60 shade trees ha−1 from species of Juglans L. spp., Inga (Scop.) Mill. spp. and Grevillea robusta A. Cunn. ex R. Br., with an average height and diameter of 2.27 m and 0.985 m, respectively. Fertilization is carried out with 5 kg of compost (dry weight mass) per coffee plant. The compost is previously enriched with coffee pulp residues at a rate of 100 kg of pulp per ton of compost. Additionally, before and after renovation, 8 tons lime ha−1 is applied every three years. The system is 21 years old without any agrochemicals being added, either for soil nutrition, nor for pest or disease control. Weed control is done manually (Figure 1a).
-
Coffee agroforestry system with intensively pruned (IPCS). This is made up of 2400 coffee plants ha−1, having an average height and diameter of 2.85 m and 0.0251 m, respectively, 40 shade trees ha−1 of Juglans spp. and Inga spp., with an average diameter and height of 0.253 m and 11.89 m, respectively. Fertilization is carried out with 5 kg (dry weight mass) vermicompost (enriched with coffee pulp 10:1) and 1 kg of lime, annually, per coffee plant. Shade density is controlled with severe pruning. Pests and diseases are not controlled, and weed control is semi-mechanized, using a brush chopper and a hoe. This management was established 21 years ago (Figure 1b).
-
Coffee agroforestry system with the introduction of avocado (CAS). This is composed of 1800 coffee plants ha−1 and 100 avocado plants ha−1, with 5 shade trees per ha−1. Avocado trees average 3.0 m in height and 0.117 m in diameter; coffee plants have an average of 1.6 m in height and 1.0 cm in diameter. Fertilization consists of applying vermicompost enriched with mycorrhizae (1 kg of mycorrhizae and 500 kg of vermicompost), applied annually; the equivalent of 15 kg (dry weight mass) vermicompost and 5 kg (dry weight mass) mycorrhizae, per coffee plant. Additionally, “efficient microorganisms” ((EM) this amendment contains 4.2% humic acids and 5.0% fulvic acids) are incorporated; the additional composition is 1.3% N; 1.2% P; 2.4% K; 2.2% Ca; 1.7% Mg; 0.02% Mn; and 0.02% B. The EM is applied at the foliar level, monthly, at a rate of one liter of EM in 200 L water (this volume supplies 50 avocado plants and 900 coffee trees). The control of pests and diseases is carried out with night light traps, yellow traps, and applications of fungicide composed of Cu and hydrated lime (bordeaux broth) by 1 kg each in 100 L of water (for 100 avocado plants), and the applications are performed once a month; in coffee trees, inputs are not applied. Weed control is mechanized with a brush chopper. The management system was 8 years old (Figure 1c).
-
Conventional avocado orchard (CAO). This is considered as a control, made up of 210 avocado plants ha−1; the plants have an average height and diameter of 3.0 m and 0.185 m, respectively. Fertilization is carried out with agrochemicals containing N:P:K (17:17:17) and urea, 1.4 kg of each, per plant, three times a year. Control of pests and diseases is done with Metalaxy M + Mancozel (RIDONIL) and Thiamethoxan + Lambdacialothrin (ENGEO), applying 250 mL pesticides L−1 water every three months. Weed control is with a brush chopper. The management system was 8 years old (Figure 1d).
The four systems have coffee plants and trees managed with low heights, several cases are renewed trees, and for Inga and Grevillea the majority presented heights between 2 to 3 m.
Experimental design: Considering the soil properties, a factorial design composed of four systems and three soil depths was applied. In each management system, three square plots of 25 × 25 m2 were delimited as replicates. Soil samples were taken at three depths (0–10, 10–20, and 20–30 cm) and plant litter was collected in triplicate. As the distance between trees and bushes is variable, soil samples were taken in the alleys, considering the slope, according to the methodology recommended by Masuhara [18]. Soil respiration, soil macrofauna in situ, and SOC and total N content were performed on these samples. In each plot, dasometric evaluations (diameter and height) and identification of the species were used on all species of trees and coffee plants. Allometric equations of C estimates in plant biomass (PBM) were used, considering an arrangement of three randomly distributed plots in each management system. Sample collection and evaluations were conducted in October 2017, 2018, and 2019.
Determination of soil respiration (SR): Plant litter samples from each plot were separated into thin (less than 1 mm in diameter) and thick (more than 1 mm in diameter) plant tissues, and soil samples were taken from three depths. A triplicate sample of 10 g (dry weight mass) was taken and placed into a hermetic plastic container. The SR was determined in vitro for each sample, considering two sizes of plant litter samples and three soil depths.
The flux of CO2 emitted by soil microbial activity during incubation was carried out by a dynamic closed chamber method [19]. A portable EGM-4 device was used, with an SCR-1 camera and a non-dispersive infrared gas analyzer (IRGA). Measurements were made in the laboratory daily, at environment temperature (24 °C) for 30 days. Soil moisture content was kept at 50% dry weight basis. Water lost by evaporation was replenished every week.
Soil respiration was calculated according to the following formula:
R = b × P 1000 × 273 273 + T a × 40.01 22.41 × V A
where: R = CO2 flux in g m−2 h−1; b = CO2 concentration in mg L−1; V = System volume in m3; A = Chamber area in m2; P = Atmospheric pressure in mb; Ta = System volume temperature in °C.
Soil macrofauna biomass: This was made by counting the biomass content of visible organisms in the soil. Squares of 1 × 1 m were delimited, per triplicate, at three depths in the 25 × 25 m2 plots. All visible soil organisms were collected and weighed. Soil macrofauna biomass (SMB) was expressed as (kg DM ha−1), according to Anderson and Ingram [20]. When DM is dry weight mass.
Carbon and nitrogen evaluation: Soil sampling and dasometric evaluations (diameter and height) were carried out on the plant biomass to determine C and N contents.
Pits of −30 cm soil depth were made and bulk density (BD) was determined at three depths, using the cylinder method [21]. Soil organic matter (SOM) was determined according to Schulte and Hopkins [21], based on weight loss by ignition.
Soil organic C (SOC) and soil total N (STN) contents were measured using a Shimadzu TOC-L analyzer. The soil C/N relationship was calculated. Conversions of mg C or N g−1 soil to Mg C or N ha−1 were made using the equation proposed by Gallardo [10], this consisted of multiplying the relative contents of SOC or STN (mg g−1 soil) × BD (Mg m−3) × soil depth (m) × 10.
Plant tissue biomass included leaf litter, shade trees, fruit trees (coffee), and roots.
Necromass (litter and mulch or layer L and layer F) biomass was extracted from a 1.0 × 1.0 m2 square, in triplicate, according to [22]. From here on, the L sublayer will be referred to as litter fall and the F sublayer will be referred to as mulch, both corresponding to the O layer (i.e., organic layer). Biomass of the L and the F layers were separated and processed in the laboratory, where C determinations were made by dry combustion using a Shimadzu TOC-L analyzer and N by the Kjeldahl method [23], and biomass of each sample was expressed in kg DM ha−1.
Dry matter weight in fruit and non-fruit trees was determined by allometric equations (Table 1), including diameter and height of such plants. To get C values in biomass, it was considered the factor 0.5 [10].
The C contained in the roots biomass (RBC) was calculated using the biomass equation proposed by Cairns [27], considering the sum of trees and shrub biomass (TSB) in Mg DM ha−1, according to:
RB = exp[−1.0587 + 0.8836 × ln(TSB)]
where: RB = Root biomass (Mg MS ha−1), exp = exponent, ln = natural logarithm, TSB = tree and shrub biomass in dry matter (Mg DM ha−1). RBC = Root Biomass Carbon (Mg C ha−1) is RB multiplied by 0.5 to calculate the C content in the roots.
Statistical analysis: An analysis of variance (ANOVA) was performed on all variables (p < 0.05), with management systems and depths as dependent variables. Results were compared by Tukey’s HSD test for each variable. Spearman’s test was used for correlation analysis, and multivariate principal component analysis (PCA) was employed to evidence the dependence structure between soil respiration and all variables.
The analysis PCA consisted of a linear combination of the variables. The number of components was obtained following the rule of choosing those whose values were higher than the unit value. The first principal component (PCA) explains most of the variance of the data series, and each successive principal component adds smaller amounts of the remaining variance. Analyses were conducted using Info Stat version 2018-I and Stratigraphic Centurion XVI software.

3. Results

3.1. Biological Activity

Organic residues respiration: In the layer L, the coffee and avocado agroforestry system (CAS) showed lower values of plant residues than management systems with the renovation and severe pruning (RCS and IPCS), while avocado monoculture (CAO) had intermediate values of plant residues between the system with CAS and two other coffee plantations (Table 2). In two coffee systems where the F layer was found, values were similar. Significantly higher respiration values were found in the F layer than in the L layer.

3.2. Soil Respiration (SR)

The trend of SR (Table 2) tended to be higher at the soil surface (0–10 cm) with an average of 204 g CO2 ha−1 h−1, decreasing significantly as depth increased. Among the systems, IPCS showed the highest SR at 0–10 cm depth, followed by the CAO, while CAS and RCS registered the least CO2 emission produced by SR. At 10–20 cm soil depth, the average was 188 g CO2 ha−1 h−1, with no significant differences between managements; at 20–30 cm soil depth, the average was 183 g CO2 ha−1 h−1, and the trend was like 0–10 cm in depth. The accumulated SR of the three depths allows for generating the following order of soil activity among the systems: IPCS > CAO > RCS ≈ CAS.
Soil macrofauna biomass (SMB): The soil macrofauna biomass (SMB) was concentrated on the soil surface, i.e., in the 0–10 cm soil depth. Results suggest an oscillating range between 71.5 and 100% of SMB Mg DM ha−1 (Table 3), and decreases as soil depth increases. With CAS and CAO, both without F-layer, no macrofauna was noticed at depths of 10–20 and 20–30 cm. Total biomass of soil macrofauna was higher in the IPCS, followed by the RCS (with high planting density), while CAS and CAO (associated with avocados) showed significantly lower values.

3.3. Carbon and Nitrogen Dynamics

3.3.1. Soil Organic Carbon (SOC) and Soil Total Nitrogen (STN)

Values of SOC content stored in the soils of CAS significantly exceeded the other systems (Table 4); this trend was observed in all depths. Similarly, STN content in the coffee system with introduced avocado plants significantly exceeded such values, almost doubling at all depths.

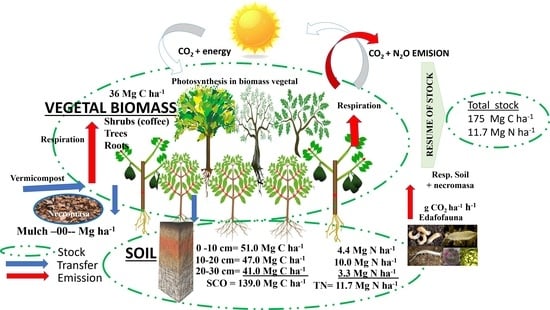
3.3.2. Carbon and Nitrogen in Vegetal Biomass

Strong mineralization of OR was observed in all systems studied, since the L layer had null or low C content (between 0.18 and 0.37 Mg C ha−1) values (Table 5).
The N contents in the litter (L) and mulch (F) layers showed the same trend as in the C contents. N values in the L layer showed no significant statistical difference, while the F layer of IPCS showed significantly higher value than the RCS. In coffee associated with avocado (CAS and CAO) there was no F layer.
Carbon content in trees (TBC) was significantly higher in CAO (31 Mg C ha−1) compare to trees in other studied systems. The C content in root biomass was related to pruning, since IPCS significantly showed the lowest value among the systems evaluated (Table 6).
Regarding the total C content in plant biomass, CAS generated similar values to RCS and the C content exceeds that of the IPCS by 55%. As a result, the order of biomass C accumulated in the studied systems was: RCS > CAO ≈ CAS > IPCS.

3.3.3. Soil Carbon and Nitrogen Ratio (C/N)

The C/N ratio of the L layers ranged from 22 to 27 (Table 7), showing no significant differences among the systems studied; these values were significantly higher than in F layers. The IPCS and RCS had a higher C/N ratio in the F layers than in the CAS; these values were significantly lower than in the L layer. In all systems studied, soil C/N ratios ranged from 11 to 14, with no significant statistical differences; the same trend was observed in all soil depths.

3.3.4. Carbon Stored in the AFS Studied

The carbon stored aboveground was similar in RCS, CAS y CAO; however, IPCS was between 60% and 56% less (Table 8). With carbon stored in stand litter (litter + mulch of L layer and F layer), the IPCS showed between 50% and 88% more carbon in this compartment than the other systems. In all the systems, SOC was found to have the highest values, and in the case of CAS it exceeded the other systems by 88% to 131%. CAS showed the highest potential for carbon storage with 74.93%, 97.49%, and 57.17% more than RCS, IPCS, and CAO, respectively. These factors justify the order of C stored found in the systems studied: CAS > CAO > RCS > IPCS.

4. Discussion

4.1. Effect of Modified Agroforestry Systems on the Soil Biological Activity

4.1.1. Organic Residues (OR)

The topological design of RCS and IPCS changed the floristic composition and the amount of OR, which could create variations obtained in soil respiration as the diversity of litter supply could increase microbial activity [28], and generate variations in the SOC content.

4.1.2. Soil Respiration (SR)

The abundance of SOM due to low CO2 emission generated in RCS (Supplementary, Table S1) shows an inverse relationship between SR and the amount of SOM. Additionally, the high C/N ratio indicates a poor humification process, which impacts soil properties and fertility. High planting density, up to 4000 coffee plants ha−1, had an impact on SR, due to organic C stocks on the AFS itself [29]. High planting density caused a direct relationship between tree biomass C, so tree cover can affect the direct insolation of the soil, lowering the temperature and, therefore, diminishing SR, as indicated by Aceñolaza and Gallardo [30]. On the other hand, SR can be regulated by temperature variation, which in turn impacts on the SOC and STN contents, similar to that analyzed by Gómez [31,32].
Higher SR under severe pruning (IPCS) could be attributed to the abundant contribution of OR by such practices; this is reflected in the existing inverse relationship of SR with SMB, tree biomass C, and C accumulated in the L layer (Supplementary, Table S2).
Under introduced avocados, SR was affected by PMC (because of the presence of avocado trees) and C/NlayerL (quality of organic residues), indicating that the soil activity in those systems where avocados are present, is linked to the contribution of OR from avocado trees because the quality of OR is a factor regulating SR [33]. Soil respiration in these conditions was negatively influenced by the amount of SOM20, ClayerL, NlayerL, C/N30 and C/N ratio (Supplementary, Table S3), showing that the quality of OR influences the quality of SOM, allowing activity of microorganisms that, in turn, depends on the amount of available C [34]. The high content of SOM (and SOC) might be attributed to the incorporation of enriched vermicompost, i.e., already processed or biostable material, which allows for explaining the inverse relationship between SR, SOC and STN contents.
With avocado monoculture, the intensity of SR seems to be conditioned by contents of NlayerL, and N10, indicating the presence of N generates mineralization of OR; then, soil SR is related to mineralization of OR [14], which influences N mineralization; however, C10, C20, C30, SOM10, and SOM20 have a negative impact on SR. This trend indicates there is a strong humification, i.e., a higher biostability of SOM, which generates lower SR [10]. In the remaining depths, a pattern of dependence between variables was not differentiated.
Soil respiration in AFS managed with high diversity and planting density could increase SR up to 1.5 times more than in coffee plantations managed as monocultures [35]. Low SR found with introduced avocados could be attributed to the nature of leaf litter produced by the avocados introduced into the coffee plantation, since the C/N relationship of the L layer tends to be lower than the rest of the coffee systems studied. Studies with coffee-forest litter reported indicated that it contains about 44% lignin [36], while the avocado litter contains only 34% [37]. This means that with the introduction of avocados, the litter initially produced is more vulnerable to be mineralized by microorganisms, and stabilized forming humic substances that slow down the mineralization process in soil [10]. Such interactions mean that SR decreases when there was no diversification in tree and shrub components of the systems studied [38,39]; however, total respiration values in CAFS with introduced avocado (CAS, 767 g CO2 ha−1 h−1; includes leaf litter, mulch, and soil) found that the accumulated total respiration emissions are similar to the average reported for CAFS in Andosol soils (950 g a 1250 g CO2 ha−1 h−1) [40].

4.1.3. Soil Macrofauna Biomass (SMB)

Tree density and type of vegetation cover are the factors which effect conditions for the activity of soil organisms. It also depends on the previous crushing and mixing carried out by soil macrofauna. However, this process is sensitive to variations in moisture content and temperature, and changes according to land use and agronomic management [41].
Values of soil macrofauna in RCS and IPCS contrasted with those associated with avocado trees, with a higher value in 0–10 cm depth in all management systems. The association with avocado trees, and no soil macrofauna, was found in the soil depths of 10–20 cm and 20–30 cm; this could indicate a dependence of L and F layers for such macrofauna activity, since in coffee with introduced avocados and avocado monoculture, only the top of the OR layer was maintained, mainly in the avocado plants. These results agree with Pardo [42], who found biomass of soil macrofauna develops according to the existing first centimeters of OR. Similarly, total soil macrofauna in RCS and IPCS exceeded the average of 500 kg DM ha−1 reported by Brown [43], which could be attributed to the diversification of shade trees and management of CAFS. Meanwhile, in CAS and CAO, low soil macrofauna biomass is attributed to intensive managements and resembles the average of 0.1 Mg DM ha−1 given by Brown [43]. The introduction of avocado trees generated changes in the OR production; moisture and temperature conditions of an area under study could impact the macrofauna activity, being sensitive to the variation of edaphoclimatic conditions generated by intensively managed crops [41].

4.1.4. Carbon and Nitrogen Dynamics

Impact of modified agroforestry systems on C sequestration: High PBC value in RCS is attributed to the shrub component (4000 coffee plants ha−1). Under such condition, a greater amount of C stored in plants suggests that the C amount included in plant biomass depends, to a great extent, on planting density, whose values are similar to that reported by Cristóbal [44] for traditional CAFS in Veracruz, Mexico. However, under IPCS (severe pruning), which has a higher planting density than the CAS, it had a low PBC value; therefore, the PBC also depends on the management, and in this case on the intensity of pruning. This is why the PBC in IPCS was lower than the average reported by Cristóbal [44] for CAFS with intensive agronomic management, while the CAS presented values of PBC similar to those reported by Vega [45] CAFS with fruit trees. The SOC values in all systems are higher than in the other compartments. This behavior of presenting greater SOC accumulation coincides with studies reported by Tumwebaze and Byakagaba [46] in AFSs, whose C stock in soils ranges from 51 to 214 Mg C ha−1. While the differences in total carbon content in CAFS are attributed to the fact that the introduction of avocado whose agronomic management consisted of adding vermicompost influenced the SOC contents, these values exceed those reported by Cristóbal [44] and Masuhara et al. [21] for CAFS.
Impact of modified agroforestry systems on soil total nitrogen content: The STN contents under CAS (Table 5) resemble average values of traditional coffee plantations (14.2 Mg N ha−1; [44]), while those found in CAO and commercial coffee systems (7.9 Mg N ha−1; [41]), with values of the remaining AFS studied, were significantly lower. Therefore, N content of OR produced by the introduction of avocados seems to set a difference between systems. Variations in STN can be attributed to a positive relationship of OR with microbial respiration, as they affect biogeochemical processes [47]. N dynamics, in turn, is related to the quality of SOM as well the C/N ratio, which is considered as a quality indicator. Soil C/N relationships varied between 11 and 14 in all the AFS studied; similar data of 11 to 15 were reported by [48]. Values lower than 11.0 correspond to fast tissue breakdown and subsequent fast mineralization, since the presence of N stimulates microbial activity [49], providing mobilization of nutrients generated.

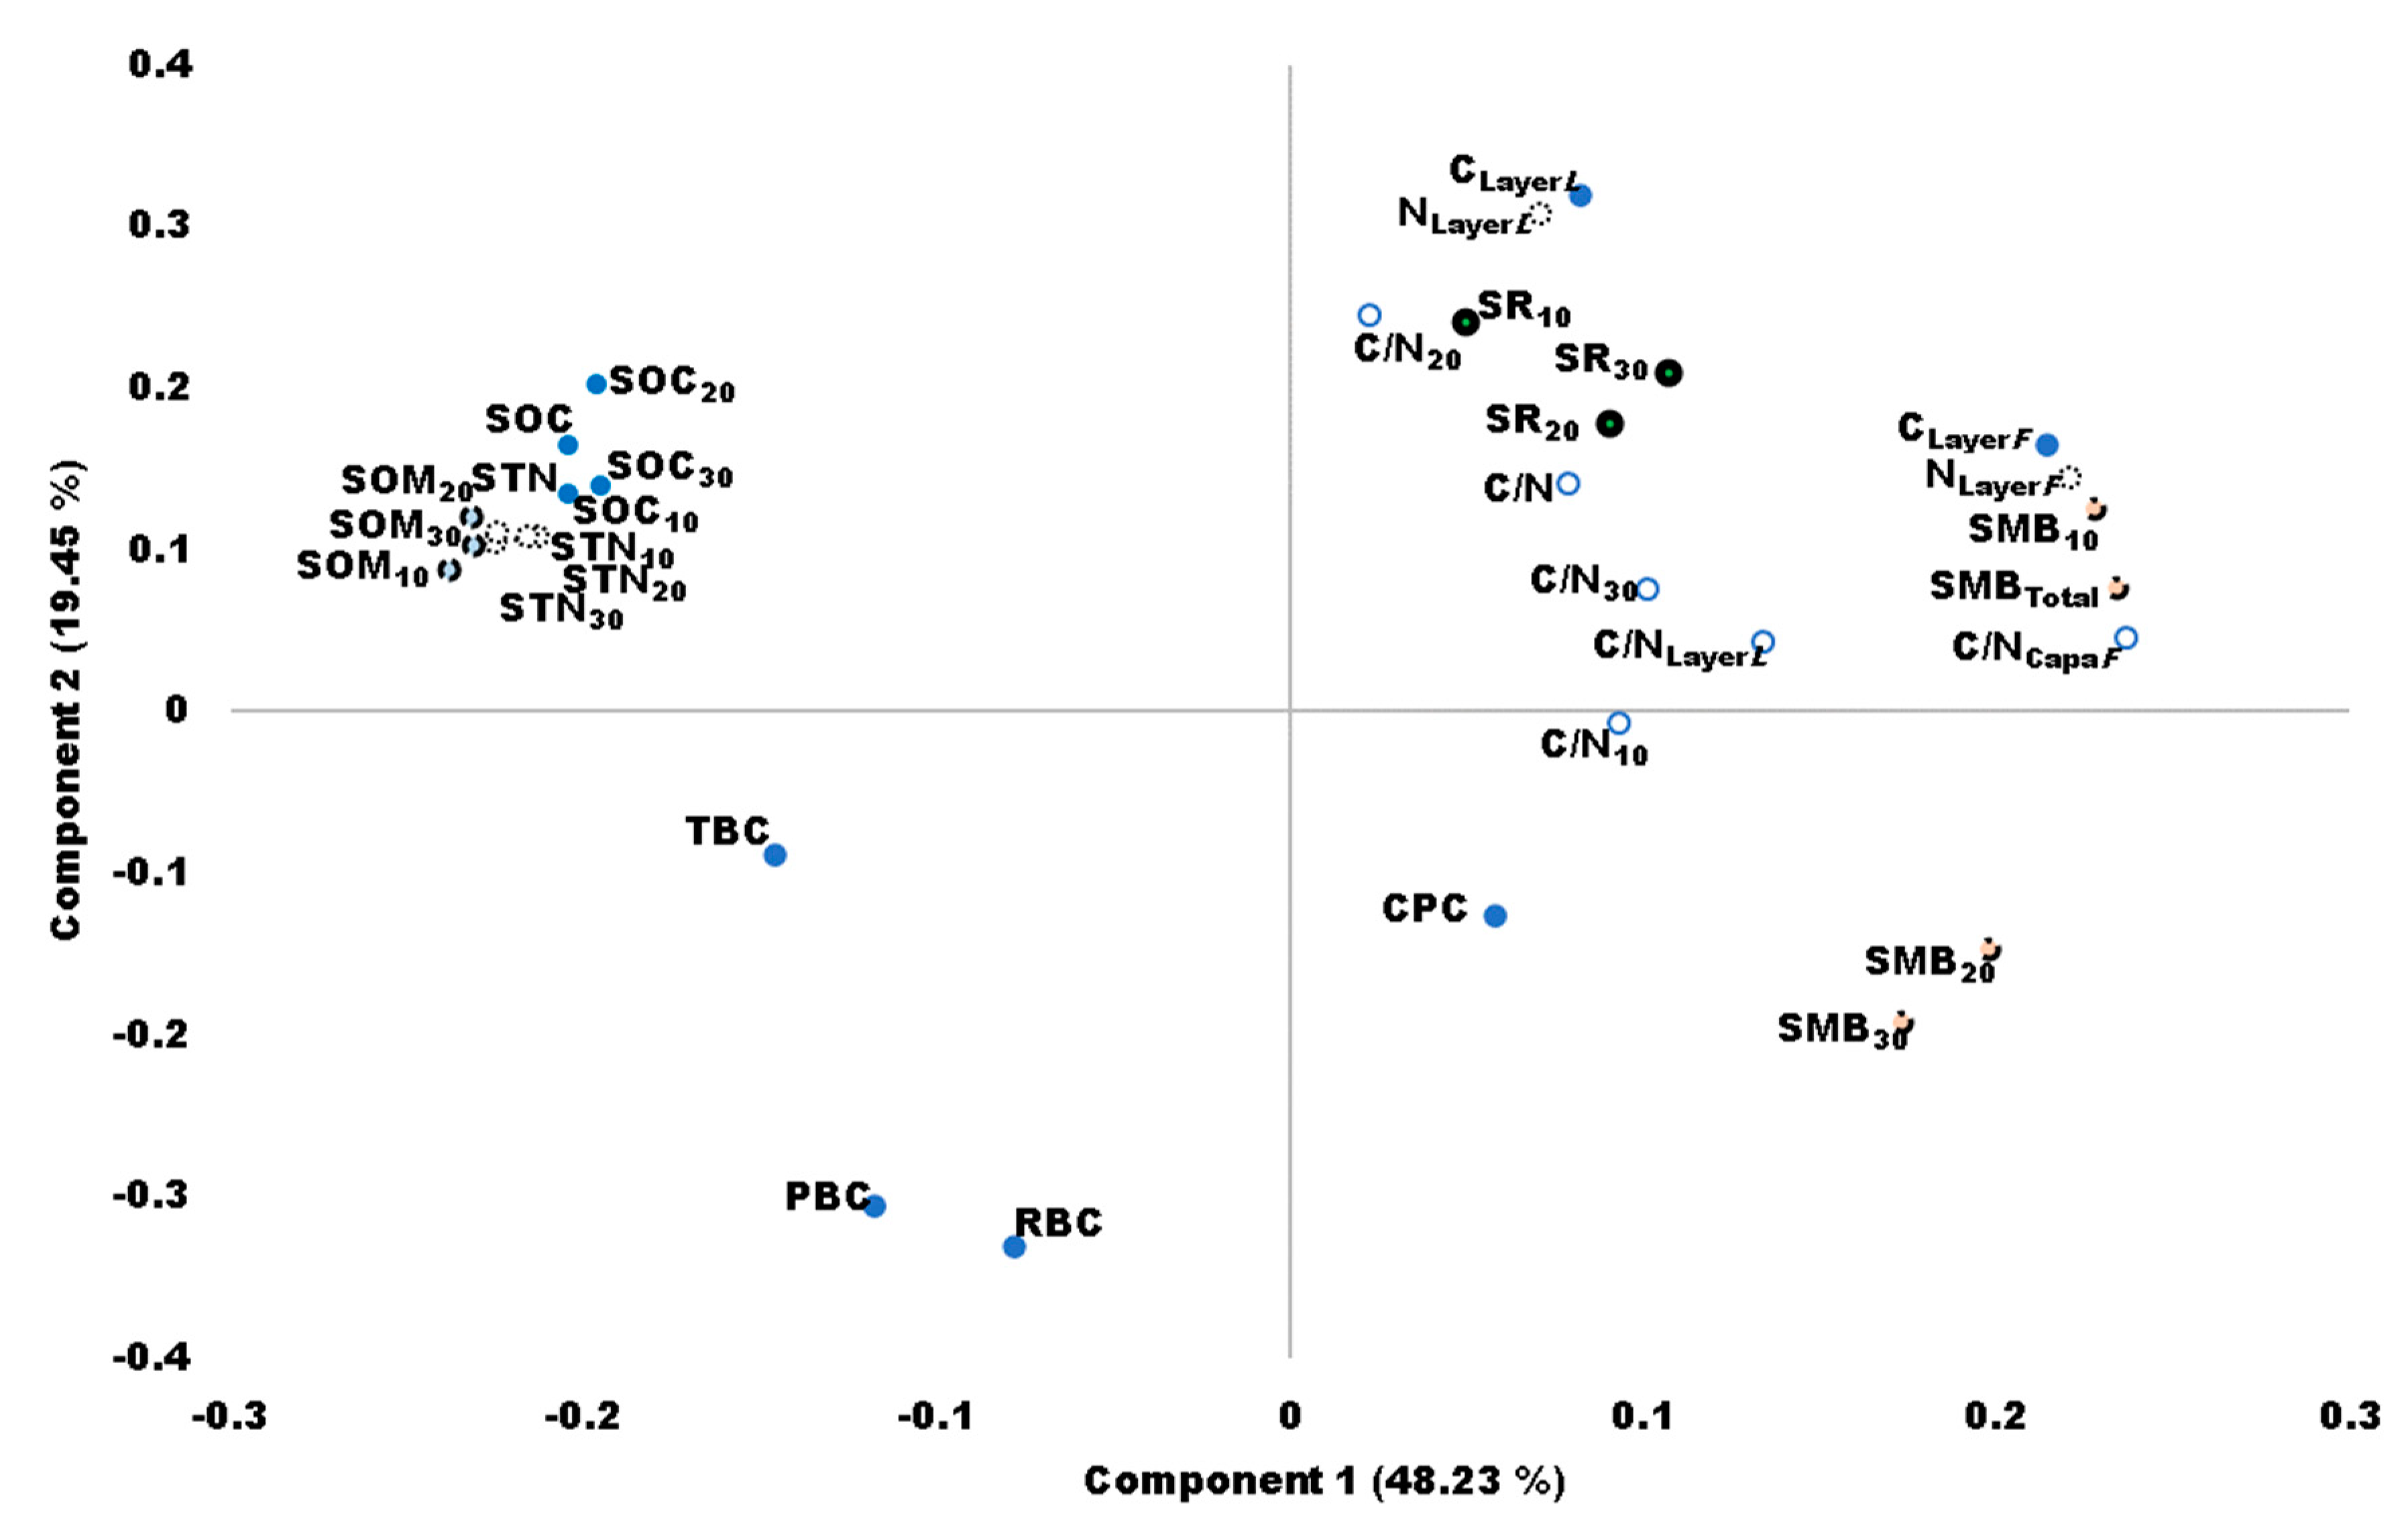
4.1.5. Principal Component Analysis (PCA)

The principal component analysis (Figure 2) shows the variation in C and N dynamics in most systems is explained by 67.7% in a positive relationship between respiration, C in coffee plants (CPC), CLayerL, CLayerF, NLayerL, NLayerF, all C/N ratios, and SMB, and a negative variation in SOC, STN, SOM, in all depths. Cumulative percent value in components 1 and 2 suggests that amounts and quality of OR affect CO2 emissions [14]. This was based on higher C and N contents in F and L layers, as well as a higher C/N ratio in the litter; which shows that soils with tree cover contribute to increasing SOC, and therefore influence the soil mineralization process [50]. Additionally, SMB promotes a positive effect on SR, being positive for the incorporation of N from OR into the soil [51]. Respiration of heterotrophic microorganisms is also stimulated by adding OR, affecting SOC content [41,52].
The existing inverse relationship between SOM, SOC, and STN with SR could indicate a eutrophic process (i.e., N richness). However, Iqbal [51,53] reported a positive relationship between SR and SOC contents, and could be attributed to incorporation of OR as compost or vermicompost. Similarly, Holatko [54] indicates the application of manure influences soil respiration.
Component 1 (with 48.2% elucidation) shows two groups: (a) that related to the OR (bad quality), having a positive relationship with SR and SMB; and (b) parameters than could generate eutrophic conditions, having an inverse relationship with SR.
On the other hand, Component 2 (19.5% elucidation) discriminates soil variables of PBC, C in tree biomass, and C in coffee plants, as opposed to variables related to SOM and SR; however, SMB and C/N ratios do not discriminate, as they are on both sides of the axes.

5. Conclusions

Variation in soil respiration is related to a change in the floristic composition of coffee plantation that generates variations in the functioning of each management system, related to the N supplied to soil with organic residues. Consequently, soil respiration is higher in renovated and severely cleaned coffee systems, and diminished when avocado trees are introduced.
Soil macrofauna is strongly dependent on the presence of permanent leaf litter; the disappearance of sub-layer F when avocado is introduced causes an impoverishment of soil macrofauna, so that a system with avocado introduced is seen as an intensively managed system.
Almost half of the variation in C and N dynamics depend directly upon a positive relationship between soil respiration, C and N contained in the stand litters (layers L and F), and having a negative relationship with the soil C and N contents.
The introduction of avocado trees in the CAFS increases the potential of C storage, affecting mostly the SOC content.

Supplementary Materials

The following supporting information can be downloaded at: https://www.mdpi.com/article/10.3390/agronomy12081794/s1, Table S1: Correlation between soil respiration (by depths) and evaluated variables (continues); Table S2: Correlation between soil respiration (by depths) and variables (continues); Table S3: Correlation between soil respiration (by depths) and evaluated variables (conclude).

Author Contributions

D.A.-M. formulated the hypothesis and objective, proposed the innovation of the article, systematized the information, and structured the article. He was in charge of writing and final editing of the article. E.V.-V. supported in the writing of the hypothesis, justification of the research scale, and supported the scientific technical writing of all sections. G.S.B.-V. raised and reviewed the discussion of integrating the importance of microbial activity in nitrogen dynamics. E.E.-P. supported the approach to the discussion of productive diversification and the management of agroforestry systems with coffee, and its effect on carbon and nitrogen dynamics. R.S.-H. raised and revised discussion of principal components analysis and correlations regarding soil carbon and nitrogen. J.F.G. directed the discussion, reviewed the results and the scientific technical writing of all sections. P.M.-Z. reviewed the structure and consistency of all sections and gave support in writing and directing structure, according to the guidelines of the journal. All authors have read and agreed to the published version of the manuscript.

Funding

Scholarship from the National Council of Science and Technology (CONACYT-México) awarded to the first author (CVU = 859157).

Data Availability Statement

The data is available from the first author ([email protected]), upon reasonable request.

Acknowledgments

The authors acknowledgments the Chapingo Autonomus University and National Council of Science and Technology (CONACYT-Mexico) for the PhD’s scholarship awarded to the first author. Extensive thanks to the community of Tlaxopa, Huatusco, Veracruz and to the coffee and avocado farmer, Luis Alvarado, for allowing this research to be carried out. We acknowledge the comments from three anonymous reviewers on an earlier version of the manuscript.

Conflicts of Interest

The authors declare no conflict of interest.

References

  1. Vallejo-Quintero, V.E. Importance and utility of microbial elements in evaluating soil quality: Case studies in silvopastoral systems. Colomb. For. 2013, 16, 83–99, (In Spanish, with English abstract). [Google Scholar] [CrossRef]
  2. Jezierska-Tys, S.; Wesolowska, S.; Galazka, A.; Joniec, J.; Bednarz, J.; Cierpiaba, R. Biological activity and functional diversity in soil in different cultivation systems. Int. J. Environ. Sci. Technol. 2020, 17, 4189–4204. [Google Scholar] [CrossRef]
  3. SAGARPA (Secretaría de Agricultura, Ganadería, Desarrollo Rural, Pesca y Alimentación). Planeación Agrícola Nacional 2017–2030; SAGARPA: Mexico City, Mexico, 2017; 63p. [Google Scholar]
  4. Villers, L.; Arizpe, N.; Orellana, R.; Conde, C.; Hernández, J. Impacts of climatic change on coffee flowering and fruit development in Veracruz, Mexico. Interciencia 2009, 34, 322–329, (In Spanish, with English abstract). [Google Scholar]
  5. FIRA (Fideicomisos Instituidos en Relación con la Agricultura). Panorama Agroalimentario. Dirección de Investigación y Evaluación Económica y Sectorial. Café. Documento Técnico de Fideicomisos Instituidos en Relación con la Agricultura; Gobierno de México: Mexico City, Mexico, 2016; 37p. [Google Scholar]
  6. Franco Sánchez, M.A.; Leos Rodríguez, J.A.; Salas González, J.M.; Acosta Ramos, M.; García Munguía, A. Analysis of costs and competitiveness in avocado production in Michoacán, Mexico. Rev. Mex. Cienc. Agrícolas. 2018, 9, 391–403. [Google Scholar]
  7. Montiel, G.; Krishnamurthy, L.; Vásquez, A.; Uribe, M. Agroforestry Options for Avocado Producers. Terra Latinoam. 2008, 26, 85–90, (In Spanish, with English abstract). [Google Scholar]
  8. Ryan, M.; Law, B.E. Interpreting, measuring and modelling soil respiration. Biogeochemistry 2005, 73, 3–27. [Google Scholar] [CrossRef]
  9. Giardina, C.P.; Binkley, D.; Ryan, M.G.; Fownes, J.H.; Senock, R.S. Belowground carbon cycling in a humid tropical forest decreases with fertilization. Oecologia 2004, 139, 545–550. [Google Scholar] [CrossRef]
  10. Gallardo, J.F. La Materia Orgánica del Suelo; Residuos Orgánicos, Humus, Compostaje y Captura de Carbono; Universidad Autónoma Chapingo: Texcoco, Mexico, 2017; 424p. [Google Scholar]
  11. Thiele-Bruhn, S.; Bloem, J.; de Vries, F.T.; Kalbitz, K.; Wagg, C. Linking soil biodiversity and agricultural soil management. Curr. Opin. Environ. Sustain. 2012, 4, 523–528. [Google Scholar] [CrossRef]
  12. Xu, X.; Shi, Z.; Chen, X.; Lin, Y.; Niu, S.; Jiang, L.; Luo, R.; Luo, Y. Unchanged carbon balance driven by equivalent responses of production and respiration to climate change in a mixed-grass prairie. Glob. Chang. Biol. 2016, 22, 1857–1866. [Google Scholar] [CrossRef]
  13. Sun, W.; Li, Z.; Lei, J.; Liu, X. Bacterial Communities of Forest Soils along Different Elevations: Diversity, Structure, and Functional Composition with Potential Impacts on CO2 Emission. Microorganisms 2022, 10, 766. [Google Scholar] [CrossRef]
  14. Zhou, Z.; Wang, C.; Luo, Y. Effects of forest degradation on microbial communities and soil carbon cycling: A global meta-analysis. Glob. Ecol. Biogeogr. 2018, 27, 110–124. [Google Scholar] [CrossRef]
  15. Hedo, J.; Lucas-Borja, M.E.; Wic, C.; Andrés-Abellán, M.; de Las Heras, J. Soil microbiological properties and enzymatic activities of long-term post-fire recovery in dry and semiarid Aleppo pine (Pinus halepensis M.) forest stands. Solid Earth 2015, 6, 243–252. [Google Scholar] [CrossRef] [Green Version]
  16. Escamilla, E.; Licona, A.L.; Díaz, S.; Sontoyo, H.V.; Sosa, R.; Rodríguez, L. Coffee production systems in central Veracruz, Mexico. A technological analysis. Rev. Hist. 1994, 30, 41–67. (In Spanish) [Google Scholar]
  17. Rosas, J.; Escamilla, E.; Ruiz, O. Relación de los nutrimientos del suelo con las características físicas y sensoriales del café orgánico. Terra Latinoam. 2008, 26, 375–384. [Google Scholar]
  18. Masuhara, A.; Valdés, E.; Pérez, J.; Gutiérrez, D.; Vázquez, J.C.; Salcedo, E.S.; Juárez, M.J.; Merino, A. Carbon stored in different coffee agroforestry systems in Huatusco, Veracruz, Mexico. Amaz. Cienc. Tecnol. 2015, 4, 66–93. [Google Scholar]
  19. Parkinson, K.J. An improved method for measuring soil respiration in the field. J. Appl. Ecol. 1981, 18, 221–228. [Google Scholar] [CrossRef]
  20. Anderson, J.M.; Ingram, J.S.I. Tropical Soil Biology and Fertility: A Handbook of Methods, 2nd ed.; CAB International: Wallingford, UK, 1994; 221p. [Google Scholar]
  21. Page, A.L.; Miller, R.H.; Keeney, D.R. Methods of Soil Analysis. Part 1. Physical Properties, 2nd ed.; American Soc. of Agronomy: Madison, WI, USA, 1982; 1159p. [Google Scholar] [CrossRef]
  22. Schulte, E.E.; Hopkins, B.G. Estimation of soil organic matter by weight loss-on-ignition. Soil Org. Matter Anal. Interpret. 1996, 46, 21–31. [Google Scholar] [CrossRef]
  23. Nelson, D.W.; Sommers, L.E. Determination of total nitrogen in plant material. Agron. J. 1973, 65, 109–112. [Google Scholar] [CrossRef]
  24. Segura, M.; Kanninen, M.; Suárez, D. Allometric models for estimating aboveground biomass of shade trees and coffee bushes grown together. Agrofor. Syst. 2006, 68, 143–150. [Google Scholar] [CrossRef]
  25. Begazo Curie, K.; Jave Nakayo, J. Estimation of the total aboveground biomass and by structural components in tree species from Lima, Peru. Rev. For. Perú 2018, 33, 76–90, (In Spanish, with English abstract). [Google Scholar] [CrossRef]
  26. Marín, Q.; Andrade, H.J.; Sandoval, A.P. Atmospheric carbon fixation in the total biomass within cocoa production systems in the department of TolimaColombia. Rev. UDCS Actual. Divulg. Científica 2016, 19, 351–360, (In Spanish, with English abstract). [Google Scholar] [CrossRef] [Green Version]
  27. Cairns, M.A.; Brown, S.; Helmer, E.H.; Baumgardner, G.A. Root biomass allocation in the world’s upland forests. Oecologia 1997, 111, 1–11. [Google Scholar] [CrossRef]
  28. Strickland, M.S.; Thomason, W.E.; Avera, B.; Franklin, J.; Minick, K.; Yamada, S.; Badgley, D. Short–term effects of cover crops on soil microbial characteristics and biogeochemical processes across actively managed farms. Agrosyst. Geosci. Environ. 2019, 2, 180064. [Google Scholar] [CrossRef] [Green Version]
  29. Lozano-García, B.; Parras-Alcántara, L.; Brevik, E.C. Impact of topographic aspect and vegetation (native and reforested areas) on soil organic carbon and nitrogen budgets in Mediterranean natural areas. Sci. Total Environ. 2016, 544, 963–970. [Google Scholar] [CrossRef]
  30. Aceñolaza, P.; Gallardo, J.F. Forest age influence on the evolution of Alnus acuminata litter dry wight lost in alder forest of Tucuman province (Argentina). For. Syst. 1995, 4, 177–188, (In Spanish, with English abstract). [Google Scholar]
  31. Gómez, L.; Cardoso, I.M.; Mendonça, E.; Fernandes, R.B.; Lopes, V.; Oliveira, T. Trees modify the dynamics of soil CO2 efflux in coffee agroforestry systems. Agric. For. Meteorol. 2016, 224, 30–39. [Google Scholar] [CrossRef]
  32. Yu, H.; Sui, Y.; Chen, Y.; Bao, T.; Jiao, X. Soil Organic Carbon Mineralization and Its Temperature Sensitivity under Different Substrate Levels in the Mollisols of Northeast China. Life 2022, 12, 712. [Google Scholar] [CrossRef] [PubMed]
  33. Scholze, M.; Knorr, W.; Heimann, M.M. Modelling terrestrial vegetation dynamics and carbon cycling for an abrupt climatic change event. Holocene 2003, 13, 327–333. [Google Scholar] [CrossRef]
  34. Acosta, Y.; Paolini, J. Microbial Biomass Dynamics (C and N) in Soils on the Paraguana Peninsula Treated with Organic Residues. Multiciencias 2006, 6, 180–187, (In Spanish, with English abstract). [Google Scholar]
  35. Souza, H.N.; de Goede, R.G.M.; Brussaard, L.; Cardoso, I.M.; Duarte, E.M.G.; Fernandes, R.B.A.; Gomes, L.C.; Pulleman, M.M. Protective shade, tree diversity and soil properties in coffee agroforestry systems in the Atlantic Rainforest biome. Agric. Ecosyst. Environ. 2012, 146, 179–196. [Google Scholar] [CrossRef]
  36. Munguía, R.; Beer, J.; Harmand, J.M.; Haggar, J. Decomposition and nutrient release rates of Eucalyptus deglupta and Coffea arabica litter and Erythrina poeppigiana green leaves, alone or mixed. Agroforestería Am. 2004, 41, 62–68, (In Spanish, with English abstract). [Google Scholar]
  37. Medina, R.; Salazar, S.; Bonilla, J.; Herrera, J.; Ibarra, M.; Álvarez, A. Secondary Metabolites and Lignin in ‘Hass’ Avocado Fruit Skin during Fruit Development in Three Producing Regions. HortScience 2017, 52, 852–858. [Google Scholar] [CrossRef]
  38. Xi, X.; Wang, L.; Tang, Y.; Fu, X.; Le, Y. Response of soil microbial respiration of tidal wetlands in the Yangtze River Estuary to increasing temperature and sea level: A simulative study. Ecol. Eng. 2012, 49, 104–111. [Google Scholar] [CrossRef]
  39. Zhang, J.; Li, Y.; Wang, J.; Chen, W.; Tian, D.; Niu, S. Different responses of soil respiration and its components to nitrogen and phosphorus addition in a subtropical secondary forest. For. Ecosyst. 2021, 8, 37. [Google Scholar] [CrossRef]
  40. Hergoualc’h, K.; Skiba, U.; Harmand, J.M.; Hénault, C. Fluxes of greenhouse gases from Andosols under coffee in monoculture or shaded by Inga densiflora in Costa Rica. Biogeochemistry 2008, 89, 329–345. [Google Scholar] [CrossRef]
  41. Paolini Gómez, J.E. Microbial activity and microbial biomass in coffee soils of the Venezuelan Andes. Terra Latinoam. 2018, 36, 13–22, (In Spanish, with English abstract). [Google Scholar] [CrossRef] [Green Version]
  42. Pardo, L.C.; Vélez, C.P.; Sevilla, F.; Madrid, O. Abundance and biomass of soil macroinvertabrates during the rainy season in three land use systems in the Colombian Andes. Acta Agronómica 2006, 55, 43–54, (In Spanish, with English abstract). [Google Scholar]
  43. Brown, G.G.; Fragoso, C.; Barois, I.; Rojas, P.; Patrón, J.C.; Bueno, J.; Moreno, G.; Lavelle, P.; Ordaz, V.; Rodríguez, C. Diversity and functional role of edaphic macrofauna in mexican tropical ecosystems. Acta Zool. Mex. 2001, 79–110, (In Spanish, with English abstract). [Google Scholar] [CrossRef]
  44. Cristóbal, D.; Tinoco, J.A.; Prado, J.V.; Hernández, E. Soil carbon and nitrogen in tropical montane cloud forest, agroforestry, and coffee monoculture systems. Rev. Chapingo Ser. Cienc. For. Ambiente 2019, 25, 169–184. [Google Scholar] [CrossRef]
  45. Vega Orozco, G.; Ordoñez Espinosa, C.M.; Suarez Salazar, J.C.; López Pantoja, C.F. Carbon storage in agroforestry arrangements associated with coffee (Coffea arabica) in the south of Colombia. Rev. Investig. Agrar. Ambient. 2014, 5, 213, (In Spanish, with English abstract). [Google Scholar] [CrossRef]
  46. Tumwebaze, S.B.; Byakagaba, P. Soil organic carbon stocks under coffee agroforestry systems and coffee monoculture in Uganda. Agric. Ecosyst. Environ. 2016, 216, 188–193. [Google Scholar] [CrossRef]
  47. Bardgett, R.D.; van der Putten, W.H. Belowground biodiversity and ecosystem functioning. Nature 2014, 7528, 505–511. [Google Scholar] [CrossRef]
  48. Payán, F.; Jones, D.; Harmand, M.; Muschler, R. Soil carbon and nitrogen concentrations below Erythrina poeppigiana in organic and conventional coffee plantations. Agroforestería Am. 2002, 9, 10–15, (In Spanish, with English abstract). [Google Scholar]
  49. Gamarra, C.C.; Díaz, M.I.; Vera, M.P.M.; Nicolás, A.J. Carbon/nitrogen ratio in soils of silvopastoral systems in the Paraguayan Chaco. Rev. Mex. Cienc. Forestales. 2018, 9, 4–26. [Google Scholar] [CrossRef]
  50. Cardinael, R.; Chevallier, T.; Barthés, B.G.; Saby, N.P.A.; Parent, T.; Dupraz, C.; Bernoux, M.; Chenu, C. Impact of alley cropping agroforestry on stocks, forms, and spatial distribution of soil organic carbon: A case study in a Mediterranean context. Geoderma 2015, 259–260, 288–299. [Google Scholar] [CrossRef] [Green Version]
  51. Luo, D.; Cheng, R.; Shi, Z.; Wang, W. Decomposition of Leaves and Fine Roots in Three Subtropical Plantations in China Affected by Litter Substrate Quality and Soil Microbial Community. Forests 2017, 8, 412. [Google Scholar] [CrossRef] [Green Version]
  52. Okur, N.; Kayikcioglu, H.H.; Ates, F.; Yagmur, B. A comparison of soil quality and yield parameters under organic and conventional vineyard systems in Mediterranean conditions (West Turkey). Biol. Agric. Hortic. 2015, 32, 73–84. [Google Scholar] [CrossRef]
  53. Iqbal, J.; Hu, R.; Feng, M.; Lin, S.; Malghani, S.; Ali, I.M. Microbial biomass, and dissolved organic carbon and nitrogen strongly affect soil respiration in different land uses: A case study at Three Gorges Reservoir Area, South China. Agric. Ecosyst. Environ. 2010, 137, 294–307. [Google Scholar] [CrossRef]
  54. Holatko, J.; Bielska, L.; Hammerschmiedt, T.; Kucerik, J.; Mustafa, A.; Radziemska, M.; Kintl, A.; Baltazar, T.; Latal, O.; Brtnicky, M. Cattle manure fermented with biochar and humic substances improve the crop biomass, microbiological properties and nutrient status of soil. Agronomy 2022, 12, 368. [Google Scholar] [CrossRef]
Figure 1. Agroforestry systems: (a) Renovated coffee agroforestry system (RCS); (b) Coffee agroforestry system with intensively pruned (IPCS); (c) Coffee agroforestry system with the introduction of avocado (CAS); (d) Conventional avocado orchard (CAO).
Agronomy 12 01794 g001
Figure 2. Principal Component Analysis (PCA) scatterplot with evaluated variables. SMB: total soil macrofauna (biomass of organisms accumulated at the depth of 0–30 cm); SOM: soil organic matter; TBC: C in trees; CPC: C in coffee plants; RBC: C in roots; PBC: C in plant biomass; C-LL: C in layer L or litter; C-LF: N in layer F or mulch; SOC: soil organic C (accumulated at the depth of 0–30 cm); N-LL: N in layer L or litter; N-LF: N in layer F or mulch; STN: soil total N; C/N: soil carbon/nitrogen ratio.
Agronomy 12 01794 g002
Table 1. Allometric equations used to assess the biomass of each type of tree or shrub vegetation.
Forest TypeAllometric Equation
AB of Juglans spp.Log10Y = −0.834 + 2.223 × Log10 (dbh)[24]
AB of Inga spp.Log10Y = −0.889 + 2.317 × Log10 (d15)[24]
AB of Grevillea robustaLnY = −2.0082 + 2.3293 × Ln(dbh)[25]
AB of coffee plantsLog10Y = −1.113 + 1.578 × Log10(d15) + 0.581 × Log10(h)[24]
AB of avocado plants Y = 10   ( 1.12 + 2.62 × Log 10 ( dap ) + 0.03 × Log 10 ( h ) ) [26]
AB: aboveground biomass, Y = Biomass (kg), Log10 = logarithm base 10, ln = natural logarithm, dbh = diameter at breast height or 1.30 m height (cm), d15 = diameter over 15 cm height (cm), h = total tree height (m).
Table 2. Soil respiration (g CO2 ha−1 h−1) at three depths, Layer L and Layer F.
SystemLayer LLayer FSoil
0–10 cm10–20 cm20–30 cm
RCS383 ± 22A653 ± 43A179 ± 7.7B180 ± 9.3A171 ± 3.9B
IPCS382 ± 22A589 ± 43A230 ± 7.7A205 ± 9.3A202 ± 3.9A
CAS219 ± 22BInexistentC193 ± 7.7B183 ± 9.3A172 ± 3.9B
CAO253 ± 38ABInexistentC212 ± 7.7AB183 ± 9.3A186 ± 3.9AB
p-value0.00450.00010.00810.28000.0016
LSD131.48257.5534.7742.260.1769
RCS: renovated coffee agroforestry system; IPCS: coffee agroforestry system with intensive pruning; CAS: Coffee agroforestry system with the introduction of avocado; CAO: Avocado orchard system; Tukey’s test (p ≤ 0.05) different letters indicate significant statistical differences; p-value: probability value; LSD: Least significant difference.
Table 3. Soil macrofauna biomass (Mg DM ha−1) by depths and system type.
SystemSMB 0–10 cm
Mg DM ha−1%
SMB 10–20 cm
Mg DM ha−1%
SMB 20–30 cm
Mg DM ha−1%
Total SMB
Mg DM ha−1
RCS0.88 ± 0.07B 71.50.30 ± 0.01A 24.40.044 ± 0.004A 3.21.23 ± 0.07B
IPCS1.46 ± 0.07A 90.10.14 ± 0.01A 8.60.017 ± 0.004B 1.031.62 ± 0.07A
CAS0.02 ± 0.11C 100.0Non- existentNon- existent0.02 ± 0.12C
CAO0.01 ± 0.11C 100.0Non- existentNon- existent0.01 ± 0.12C
p-value0.00010.00010.00010.0001
LSD0.3640.07140.02220.3919
SMB: soil macrofauna biomass; RCS: renovated coffee agroforestry system; IPCS: coffee agroforestry system with intensive pruning; CAS: coffee agroforestry system with the introduction of avocado; CAO: avocado orchard system; Tukey’s test (p ≤ 0.05); different letters indicate significant statistical differences; p-value: probability value; LSD: least significant difference.
Table 4. Soil organic carbon (Mg C ha−1) and soil total nitrogen (Mg N ha−1), in three depths.
SystemSOCSoilSTNSoil
0–10 cm0–20 cm0–30 cm0–10 cm0–20 cm0–30 cm
RCS60 ± 3.9B28 ± 2.0B17 ± 1.5B15 ± 1.6B4.9 ±0.37C2.0 ± 0.15B1.8 ± 0.18B1.1 ± 0.13C
IPCS71 ± 3.9B29 ± 2.0B25 ± 1.5B17 ± 1.6B5.6 ±0.37BC2.3 ± 0.15B2.1 ± 0.18B1.3 ± 0.13BC
CAS139 ± 6.1A51 ± 3.4A47 ± 2.6A41 ± 2.8A11.7 ± 0.65A4.4 ± 0.26A4.0 ± 0.32A3.3 ± 0.22A
CAO74 ± 6.8B32 ± 3.4B24 ± 2.6B18 ± 2.8B7.2 ±0.65B2.7 ± 0.26B2.5 ± 0.32B2.0 ± 0.22B
p-value0.00010.00010.00010.00010.00010.00010.00010.0001
LSD22.02010.96498.52019.07682.09500.82491.02080.7187
RCS: renovated coffee agroforestry system; IPCS: coffee agroforestry system with intensive pruning; CAS: coffee agroforestry system with the introduction of avocado; CAO: avocado orchard system; different letters indicate significant statistical differences; Tukey’s test (p ≤ 0.05); different letters indicate significant statistical differences; p-value: probability value; LSD: least significant difference.
Table 5. Carbon (Mg C ha−1) and Nitrogen (Mg N ha−1) in litter (Layer L) and mulch (Layer F).
SystemCarbonNitrogen
Layer LLayer FLayer LLayer F
RCS0.19 ± 0.06A0.57 ± 0.09B0.007 ± 0.003A0.026 ± 0.004B
IPCS0.37 ± 0.06A1.12 ± 0.09A0.014 ± 0.01A0.047 ± 0.004A
CAS0.26 ± 0.11AInexistentC0.010 ± 0.01AInexistentC
CAO0.18 ± 0.11AInexistentC0.007 ± 0.003AInexistentC
p-value0.24660.00010.37620.0016
LSD0.363780.468320.01170.8249
RCS: renovated coffee agroforestry system; IPCS: coffee agroforestry system with intensive pruning; CAS: coffee agroforestry system with the introduction of avocado; CAO: avocado orchard system; Tukey’s test (p ≤ 0.05); different letters indicate significant statistical differences; p-value: probability value; LSD: least significant difference.
Table 6. Carbon in plant biomass (Mg C ha−1).
SystemC/N
Layer L
C/N
Layer F
C/N
0–10 cm
C/N
10–20 cm
C/N
20–30 cm
C/N
(SOC/STN)
RCS27 ± 1.5A21.0 ± 0.84B14 ± 1.2A9 ± 1.2A15 ± 2.0A12 ± 1.1A
IPCS27 ± 1.5A23.8 ±0.84A14 ± 1.2A13 ± 1.2A15 ± 2.0A14 ± 1.1A
CAS25 ± 2.6AInexistentC12 ± 2.1A12 ± 2.1A13 ± 3.4A12 ± 2.0A
CAO22 ± 2.6AInexistentC13 ± 2.1A10 ± 2.1A10 ± 3.4A11 ± 2.0A
p-value0.51920.02870.75110.15240.56390.6268
LSD10.5482.5186.8196.77311.1136.346
RCS: renovated coffee agroforestry system; IPCS: coffee agroforestry system with intensive pruning; CAS: coffee agroforestry system with the introduction of avocado; CAO: avocado orchard system; Tukey’s test (p ≤ 0.05); different letters indicate significant statistical differences; p-value: probability value; LSD: least significant difference; PBC: total C in plant biomass.
Table 7. Carbon/Nitrogen ratios in litter (layer L), mulch (layer F), and soils.
SystemTreesShrubsRootsPBC
RCS0.8 ± 1.6C32 ± 1.7A6.7 ± 0.4A40 ± 2.6A
IPCS2.3 ± 1.6C11 ± 1.7C3.1 ± 0.4B16 ± 2.6B
CAS11 ± 1.6B19 ± 1.7B5.4 ± 0.4A36 ± 2.6A
CAO31 ± 1.6AInexistentD6.1 ± 0.4A37 ± 2.6A
p-value0.00010.00010.00010.0007
LSD7.417.671.9011.68
RCS: renovated coffee agroforestry system; IPCS: coffee agroforestry system with intensive pruning; CAS: coffee agroforestry system with the introduction of avocado; CAO: avocado orchard system; Tukey’s test (p ≤ 0.05); different letters indicate significant statistical differences; p-value: probability value; LSD: least significant difference; C/N: carbon and nitrogen ratio.
Table 8. Carbon stored (Mg C ha−1) in the AFS studied.
SystemAboveground
(Trees + Shrubs) + Roots
Stand-Litter
(Litter + Mulch)
SOCTotal C
RCS40 ± 2.6A0.76 ± 0.14B60 ± 3.9B100.07 ± 6B
IPCS16 ± 2.6B1.51 ± 0.14A71 ± 3.9B88.64 ± 6B
CAS36 ± 2.6A0.26 ± 0.14B139 ± 6.1A175.06 ± 6A
CAO37 ± 2.6A0.17 ± 0.14B74 ± 6.8B111.38 ± 6B
p-value0.00070.00040.00010.0001
LSD11.680.61522.02027.172
RCS: renovated coffee agroforestry system; IPCS: coffee agroforestry system with intensive pruning; CAS: coffee agroforestry system with the introduction of avocado; CAO: avocado orchard system; Tukey’s test (p ≤ 0.05); different letters indicate significant statistical differences; p-value: probability value; LSD: least significant difference; SOC: soil organic carbon; Total C: total carbon sequestered for AFS.
Publisher’s Note: MDPI stays neutral with regard to jurisdictional claims in published maps and institutional affiliations.

