
Variations in Soil Organic Carbon Fractions and Microbial Community in Rice Fields under an Integrated Cropping System
1
School of Resources and Planning, Guangzhou Xinhua University, Guangzhou 510520, China
2
Institute of South China Urban-Rural Economic and Social Development, Guangzhou 510642, China
3
China College of Natural Resources and Environment, South China Agricultural University, Guangzhou 510642, China
*
Author to whom correspondence should be addressed.
Agronomy 2024, 14(1), 81; https://doi.org/10.3390/agronomy14010081
Submission received: 5 December 2023
/
Revised: 20 December 2023
/
Accepted: 26 December 2023
/
Published: 28 December 2023
(This article belongs to the Special Issue Sustainable Development of Rice Cultivation and Soil Nutrient Management)
Abstract
:Combining rice cultivation and aquaculture into an integrated cropping system is a management approach that enhances the sustainability of rice fields. However, how soil characteristics influence soil microbial community characteristics following implementation of such an integrated system, particularly in the waterlogged paddies of the Pearl River Delta, is poorly understood. An integrated cropping system (rice–fish–duck integrated cropping system, RFD) and a rice–pepper rotation system (RPS) were compared using a conventional rice cropping system (CRS) as a reference. We used phospholipid-derived fatty acid (PLFA) analysis to assess soil microbial community structure and function and measured soil nutrient content and organic carbon fractions. Our results indicated that the soil nutrient content, organic carbon fractions, and C-hydrolyzing activities differed among the cropping systems. The RFD resulted in higher microbial PLFA concentrations and a lower ratio of Gram-positive to Gram-negative bacteria than CRS. Additionally, the integrated system reduced microbial nutrient stress by increasing soil pH. Further analysis revealed that active soil organic carbon significantly affected the soil microbial community. Thus, the RFD integrated cropping systems that alter the combined actions of pH and active organic carbon fractions can be used to improve soil microbial communities.
1. Introduction
Waterlogged paddies in southern China are mainly distributed in polder areas along river plains, lakeside areas, areas near the sea, deltas, and ridges in hilly areas. The area of waterlogged paddies in the Pearl River Delta is approximately 783,000 hm2, accounting for 15.2% of the arable land [1]. High groundwater levels and poor drainage lead to excessive soil moisture, which is characterized by a heavy clay texture, insufficient permeability, pronounced reducibility, and slow organic matter decomposition [2,3]. Consequently, waterlogged paddies experience imbalances in water, nutrients, air, and temperature within the topsoil. In particular, the massive application of chemical fertilizers and pesticides in recent decades has increased food production at the cost of enormous environmental pollution [4].
The traditional system is usually a single rice planting in a waterlogged paddy field. This system requires huge external investment to maintain high productivity and efficiency [5]. Moreover, continuous monoculture rice planting will lead to soil degradation and nutrient loss with runoff, further causing groundwater pollution and biodiversity loss [6,7]. An integrated cropping system in rice fields is an ecologically and environmentally friendly agricultural development technology that combines crop cultivation and aquaculture [8,9]. Compared to the traditional system, such a system artificially combines rice (Oryza sativa) cultivation and aquaculture in the same ecosystem, using the three-dimensional space of the paddy field to achieve full use of light, heat, water, and biological resources and to obtain high material production and economic benefits [8]. Simultaneously, such a system can prevent declines in soil fertility, reduce environmental pollution, maintain ecological balance, and maintain the agroecosystem in a virtuous cycle.
Soil microbes are important for improving soil fertility and maintaining material cycles in the soil ecosystem [10]. Changes in the concentrations and diversity of soil microbes directly reflect trends in soil fertility and quality, making them sensitive indicators of short- and long-term variations in soil conditions [11,12]. Many studies have demonstrated that integrated rice–aquatic animal systems increase soil microbial diversity [9,13]. Afri et al. [14] found that a rice–fish system changed the community composition of soil bacteria, increasing species richness and diversity. Comparable findings were observed in soil fungi, where the abundance and diversity of fungi exhibited a positive correlation with soil nutrients [12]. In integrated cropping systems within paddy fields, aquatic animals affect the material and energy cycles in the plow layer through crawling, disturbing, feeding, and defecating activities, which may improve surface soil fertility, increase microbial activities, and alter the microbial community composition [14,15]. Integrated cropping systems also enhance soil ecosystems by improving organic matter content, total nutrients, available nutrients, and pH [16]. Additionally, numerous studies have demonstrated that these systems significantly increase the content and availability of soil NPK and organic carbon (OC) in different soil layers of paddy fields [17,18]. Compared to the continuous rice cropping system, introducing fish into the rice field could reduce N and P loss from runoff and N2O emission, thereby maintaining soil fertility [19]. Sun et al. [20] reported that rice and aquatic animal co-culture systems proved to be a highly efficient cultivation approach to enhance carbon sequestration in the paddy field. When integrated cropping systems are employed, soil microbial communities may change over time in response to altered physicochemical properties. However, few studies have examined changes in the internal characteristics of waterlogged paddy soils after long-term adoption of ecologically integrated farming models, and there is a lack of research regarding the relationship between alterations in the soil environment and microbial communities in different plow layers.
Our study aimed to compare alterations in soil microbes in an integrated rice–fish–duck (RFD) system to those in rice–pepper (RPS) rotation and conventional rice cropping (CRS) systems, with a particular focus on identifying the primary drivers of alterations in the microbial community. The RFD system, which introduced animal manure into paddy fields, increased soil OC and nutrient (NPK) levels following decomposition. Previous studies have reported that changes in soil microbial communities are inextricably associated with variations in soil nutrients and OC. We hypothesized that (1) the RFD system would significantly enhance soil NPK levels and OC availability; (2) soil organic carbon would be more sensitive to NPK levels after cropping system changes, thus making it a determining factor in soil microbial proliferation; and (3) transformation from CRS to the RFD system would reduce microbial nutrient stress, which varies with soil pH and OC availability.
2. Materials and Methods
2.1. Experiment Design
The experiment was conducted at Zengcheng District Agro-ecological Environment Field Station, Guangdong Province, China (23°17′25′′ N, 113°43′3′′ E). The climate is a subtropical marine monsoon climate with an average annual temperature of 22.1 ℃ and annual precipitation of 1746.7 mm. Soil type in this area is identified as a Hydragric Anthrosol (FAO–UNESCO, 1974) with a loamy clay texture (29% sand, 42% silt, and 29% clay). Prior to the experiment, the topsoil physicochemical properties were as follows: pH: 5.03; total nitrogen: 0.75 g·kg−1; total phosphorus: 0.91 g·kg−1; total potassium: 14.38 g·kg−1; bulk density: 1.32 g·cm−3.
The experiment was carried out from June 2017 to September 2021, based on the CRS. Three cropping systems were devised: RFD, RPS, and CRS as the control. Each cropping system was repeated three times with a random distribution for each repetition, and the plot area was 667 m2. Field ridges (30 cm height × 60 cm width) were built to separate the plots. In RFD, 300 fish and 25 ducklings were introduced into the rice field during the rice growth period, following the implementation steps described by Wang et al. [21]. We did not feed the fish during the growth period. They only fed on insects, grasses, and plankton in rice fields. High nets were laid around the fields in RFD to prevent ducks from escaping. We set up duck sheds on the field ridge and fed ducks with maize kernels (N 1.11–1.49%, P 0.24–0.27% and K 0.28–0.30%). In RPS, three pepper crops were annually planted during the first half of each year, and then rice was planted. The rice and pepper varieties for the experiment were “Zengcheng Simiao Rice” and Capsicum annuum var. conoides, which were developed by the Agricultural Science Research Institute of Zengcheng District (Guangzhou, China). Consistent field management practices, following local farming convention, were applied to each crop annually. Following harvesting, the rice straw was not incorporated back into the field, leaving only the rice stubble. In this experiment, furrow irrigation was carried out. Except during the stages of seedling establishment, booting, and heading, a shallow water layer of 3 cm was maintained in the field, and the soil was mainly kept moist during the other stages. Compound fertilizer (150 kg·hm−2; N:P2O5:K2O = 17:6:12) (Fuli Long Compound Fertilizer Co., Ltd., Guangzhou, China) was applied in each cropping system before transplanting the seedlings. In addition to no fertilization during the subsequent rice growth process in RFD, 150 kg·hm−2 of urea was applied in RPS and CRS fields during the tillering and heading stages.
2.2. Soil Collection and Analysis
In 2021 September, the depth of the plow layer (0–20 cm) was determined by excavating soil profiles in accordance with the “Guidelines for Soil Description and Sampling in the Field” [22]. Five random soil (topsoil (0–10 cm) and subsoil (10–20 cm)) samples were collected from each soil layer at every site. The five samples were then combined to form a composite. These soil samples were divided into three subsamples for separate analyses of soil chemical properties (at 25 °C), enzyme activity (at 4 °C), and soil microbial communities (at −80 °C).
Soil properties, such as pH and total and available nitrogen, phosphorus, and potassium, as well as OC fractions, including total organic carbon, easily oxidized organic carbon (EOC), dissolved organic carbon (DOC), microbial biomass carbon (MBC), and humic acid, were analyzed following published procedures [23] (Table 1). BG (β-1,4-glucosidase, EC 3.2.1.21), CBH (β-D-cellobiohydrolase, EC 3.2.1.91), and BX (xylosidase, EC 3.2.1.37) were determined using the 96-well microplate fluorescence assay method [24]. Briefly, 1.0 g of soil was homogenized with 125 mL buffer (50 mM sodium acetate buffer) to extract the enzymes. Soil slurries (200 μL) and 50 μL of 200 μM fluorometric substrate proxies specific to each enzyme were added to a 96-well microplate. Three analytical replicates and one control (sample without the substrate) were conducted for each sample. Finally, the intensity of fluorescence was determined by a microplate reader (Spectra Max M5, Molecular Devices, Sunnyvale, CA, USA). The enzyme substrates for BG, CBH, and BX were 4-MUB-β-D-glucoside, 4-MUB-β-D-cellobioside, and 4-MUB-β-D-xyloside, respectively, with 4-methylumbelliferone as the reference standard.
2.3. Microbial Community Composition
We determined soil microbial community composition via phospholipid-derived fatty acids (PLFAs) [25]. Extraction of PLFAs was performed using 8 g freeze-dried soil, and each PLFA concentration was determined using an internal standard concentration of non-adecanoic acid methyl ester (19:0). The concentration of PLFAs for microbial groups was calculated [26,27]: for Gram-positive bacteria (GP), sum of i14:0, a15:0, i15:0, i16:0, a17:0, and i17:0; for Gram-negative bacteria (GN), sum of 16:1ω7c, cy17:0, 18:1ω7c, and cy19:0; for total bacteria (BAC), apart from GP and GN, 17:0 and 18:0 were also included; for total fungi, sum of 18:1ω9c and 18:2ω 6,9c. For arbuscular mycorrhizal fungi, 16:1ω5c was calculated. In addition, the proportions of the three PLFA functional groups were calculated as follows: ratio of GP/GN, ratio of fungi to bacteria (F/B), and cy/pre ((cy17:0 + cy19:0)/(16:1ω7c + 18:1ω7c)) [28].
2.4. Statistical Analysis
Blair et al. [29] posited that the instability of OC can be defined as the ratio of stable OC and the difference between total OC and stable OC. We define a stability index for OC as the difference between 1 and the instability of OC, calculated as follows [30]:
where EOC is easily oxidized OC (g·kg−1) and SOC is total OC (g·kg−1).
SOC = 1 − [EOC/(SOC − EOC)]
Soil C—hydrolyzing enzyme activity was evaluated using the geometric mean index (GMEA) and integrated total enzyme activity index (TEI) [10,31]. The calculation formulas are as follows:
where represents enzyme i activity and represents the mean value of enzyme i activity for all soil samples.
One-way analysis of variance and least significant difference test were used to analyze differences in soil variables under different cropping systems (p < 0.05). The processing effect was expressed as the increment of each variable in RFD relative to that in CRS and RPS, and the t-test was used for difference analysis. Statistical analyses were performed using SPSS version 24.0 (IBM, Chicago, IL, USA). Principal component analysis was used to explore differences in soil PLFAs among the different cropping systems. A correlation matrix of soil variables and soil PLFAs was plotted using Origin 2020 (OriginLab Corp., Northampton, MA, USA). Structural equation modeling (SEM) was used to investigate how soil variables affected soil microbial community characteristics using R 4.2.1 software.
3. Results
3.1. Soil Nutrients
Cropping system choice significantly influenced the pH and soil nutrient content throughout the plow layer (Table 2). Total NP and available NP were 29.55–91.24% and 70.33–202.43% higher, respectively, after RFD than after CRS. No significant changes were found in K between RFD and RPS, except for available K, which differed in the topsoil. Total and available nutrient content in the entire plow layer was 33.72–109.14% and 41.83–357.03% higher, respectively, after RFD than after RPS. Notably, the RFD subsoil had a lower pH and available K content than RPS subsoil.
3.2. Soil Organic Carbon Fractions
RFD and CRS (RPS) showed noticeable differences in soil OC fractions (Table 3). The soil OC fractions of the entire plow layer were 31.72–233.99% higher after RFD than after CRS, with the highest increases found in the topsoil and subsoil for MBC and EOC, respectively. Similarly, the soil OC fractions of the entire plow layer, except for DOC in the subsoil, were 11.36–485.13% higher after RFD than after RPS, with the highest increases found in the topsoil and subsoil for humic acid and EOC. Furthermore, RFD exhibited the lowest OC stability, 8.79% lower than that of RPS (Figure 1).
3.3. Soil C-Hydrolyzing Enzyme Activity
The responses of soil C-hydrolyzing enzymes to the cropping systems varied. BG and BX activities were 30.53–49.52% and 28.08–38.33% higher, respectively, after RFD than after RPS and CRS; however, CBH activity remained unchanged (Figure 2a–c). The mean GMEA values for RFD, RPS, and CRS were 211.64, 170.59, and 165.44 RFD, respectively (Figure 2d). GMEA was 22.83–25.18% and 23.94–31.69% higher after RFD than after RPS and CRS, respectively. The mean TEI values of RFD, RPS, and CRS were 3.48, 2.80, and 2.72, respectively (Figure 2e). Significantly, TEI was 22.97–25.62% and 23.34–32.08% higher after RFD than after RPS and CRS, respectively.
3.4. Soil Microbial Community Characteristics
Comparisons between cropping systems showed similar trends in the concentrations of total PLFAs and PLFA groups (Figure 3). The highest concentration of each PLFA group in the topsoil was observed in RFD, followed by RPS and CRS. Furthermore, the concentration of each PLFA group in RFD was significantly higher than those in RPS and CRS throughout the topsoil. In the subsoil, the concentration of each PLFA group was significantly improved after converting from CRS to RFD, but there was no significant difference in concentrations between RFD and RPS. Cropping systems significantly affected GP/GN and cy/pre but had a limited impact on soil F/B (Figure 4). Soil GP/GN was significantly lower after RFD than after CRS, whereas GP/GN was higher to varying degrees after RFD than after RPS (Figure 4a). The ratio of cy/pre was 21.36–58.74% and 55.52–73.48%, lower after RFD than after RPS and CRS, respectively (Figure 4c).
3.5. Relationship between Soil Microbial Community and Soil Variables
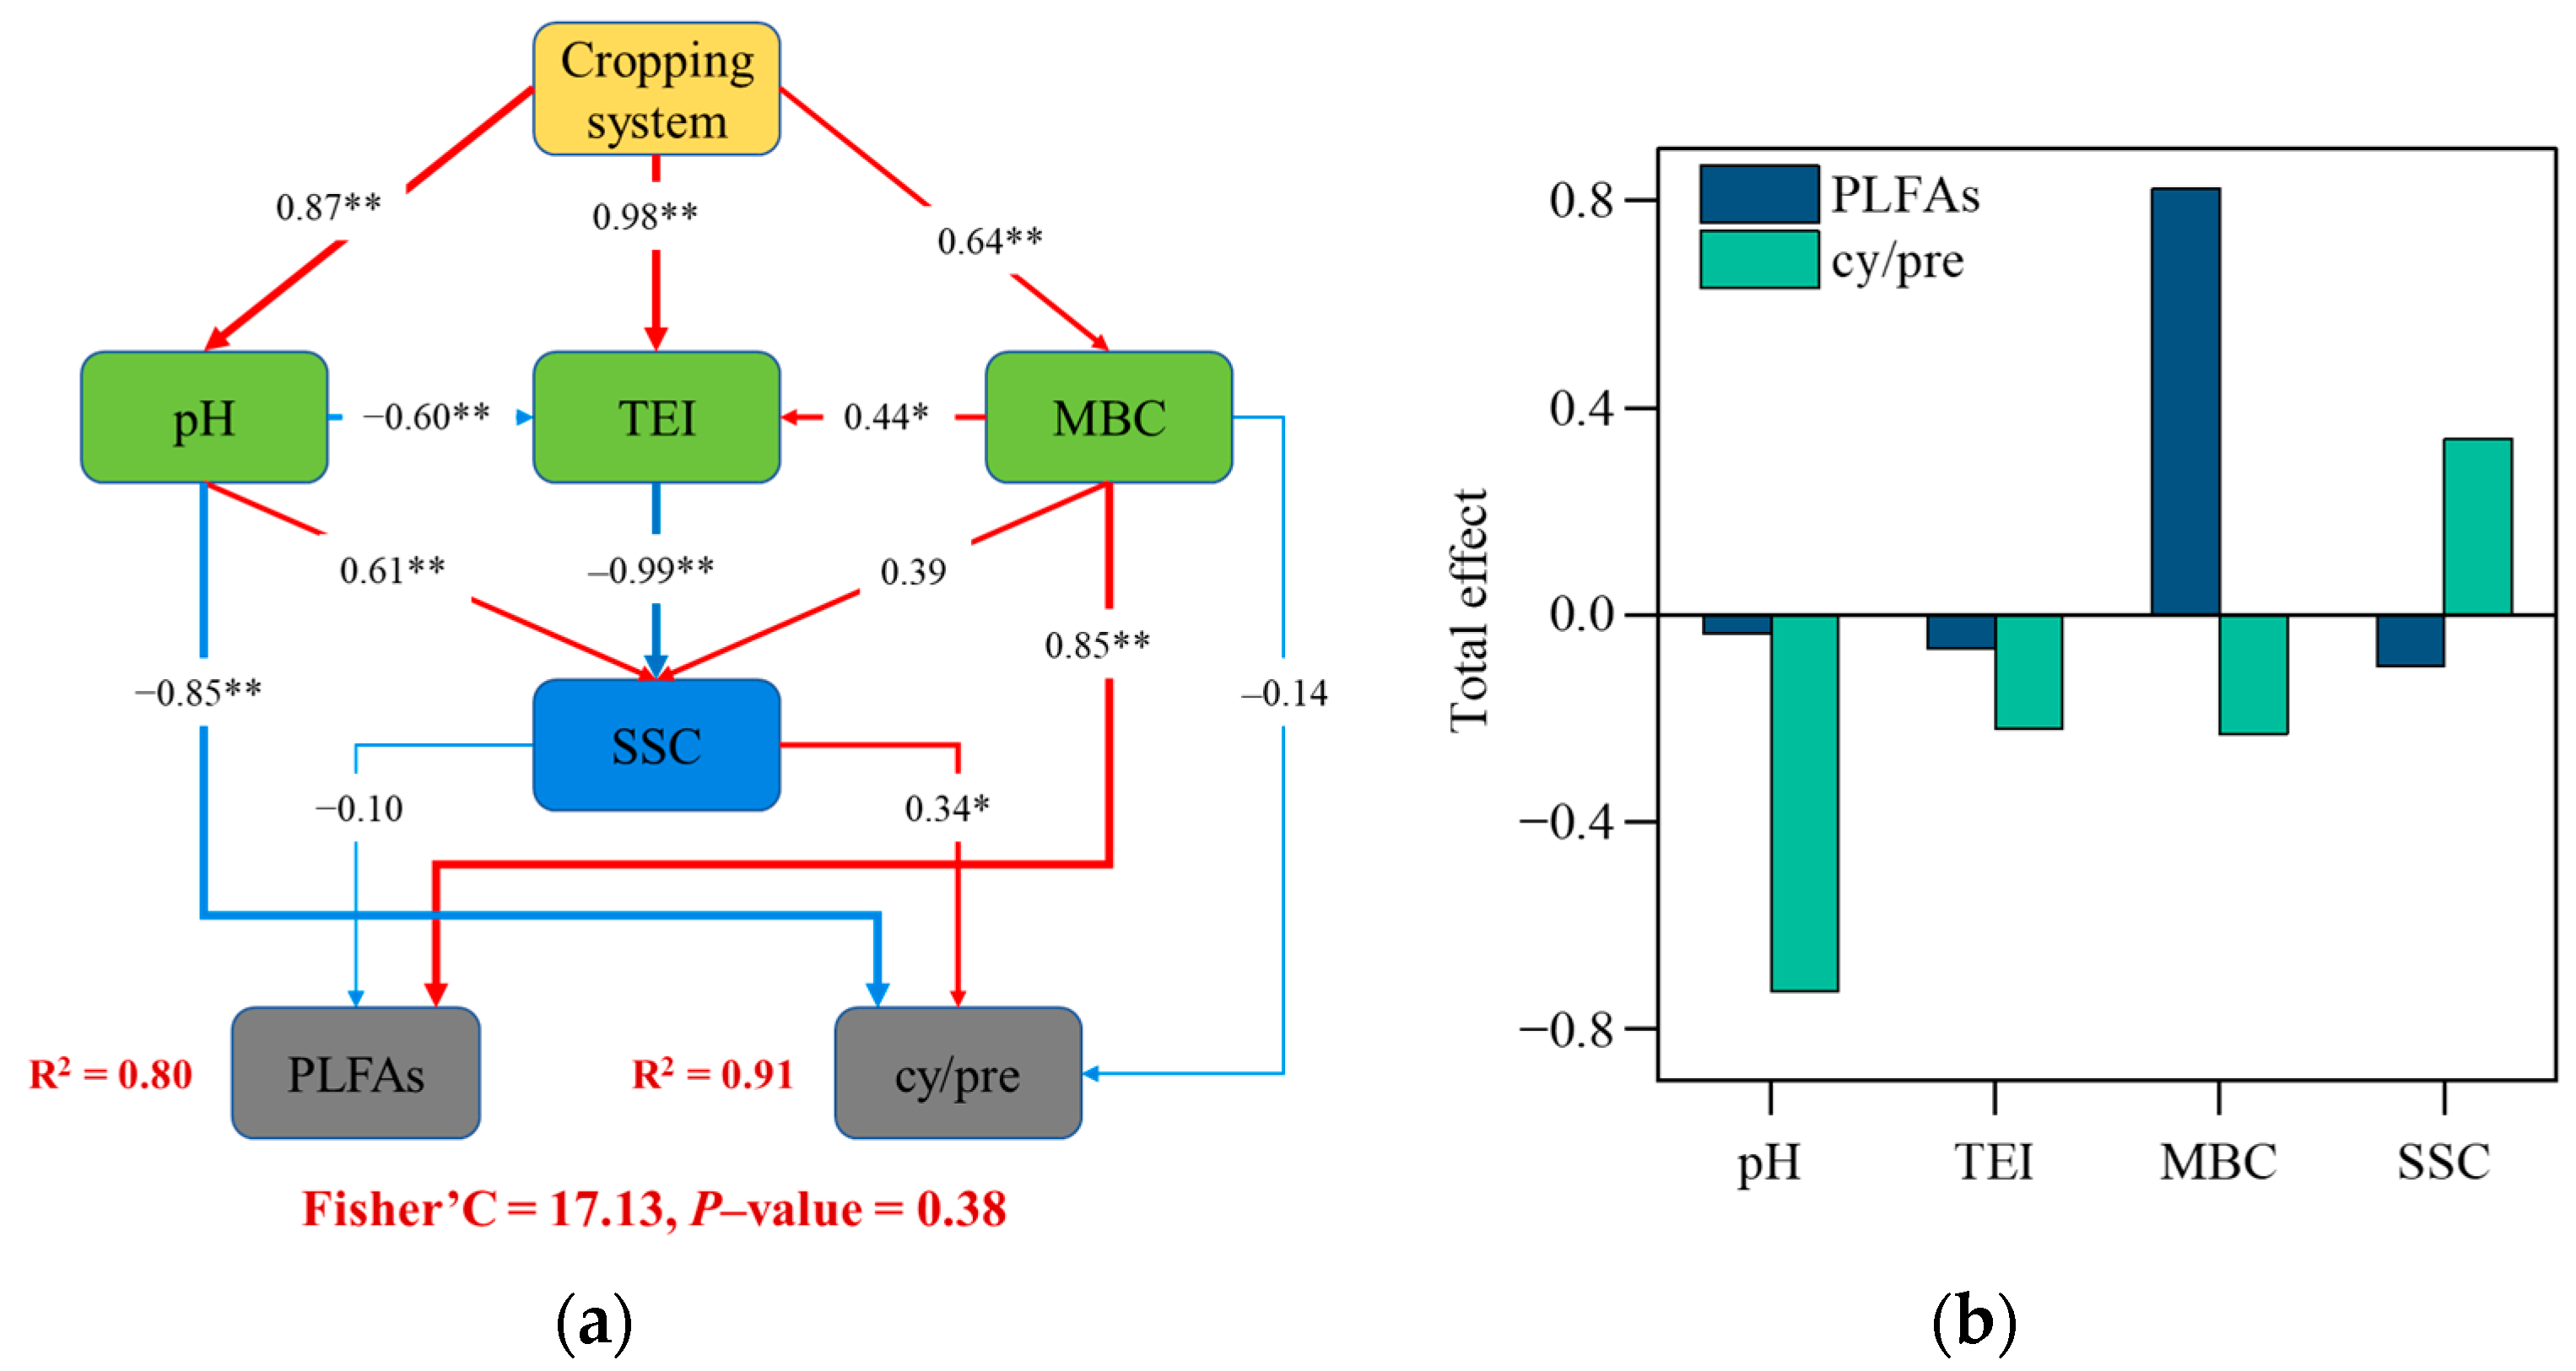
PC1 represented 74.30% and 75.71% of soil microbial community in the topsoil and subsoil, respectively (Figure 5). Soil microbial communities were significantly impacted by the cropping system, with most soil microbial indicators pointing toward RFD throughout the plow layer, indicating its benefits to soil microbes. Soil nutrients, OC fractions, and C-hydrolyzing enzyme activity varied under the different cropping systems (Figure S1), affecting the composition and functional characteristics of soil microbes (Figure S2). SEM revealed how the cropping system affected soil microbial abundance and functional characteristics, and 80% of PLFA and 91% of cy/pre variations were explained by soil nutrients, OC fractions, and C-hydrolyzing enzyme activity (Figure 6a). Higher MBC was the most significant influencing factor increasing overall soil microbial abundance (Figure 6b). pH had a significant negative impact on the cy/pre ratio, whereas the stability of soil OC had a positive impact. pH can directly or indirectly affect the cy/pre ratio by changing the C-hydrolyzing enzyme activity and OC stability.
4. Discussion
4.1. Response of Soil Organic Carbon Fractions to Cropping Systems
Cropping systems can alter the cycling of matter and energy conversion in paddy ecosystems, and OC plays a crucial role in determining the biological and physicochemical characteristics of soil [32]. The four-year field experiments revealed a notable rise in the OC of plow-layer soil when implementing RFD compared with that under RPS and CRS (Table 3). These findings align with the results obtained in prior studies [21,33]. Introducing aquatic animal manure enriched with OC and NPK nutrients (Table S2) was beneficial for humus formation (Table 3), thereby compensating for the OC loss caused by intensive cultivation. Bowles et al. [34] suggested that BG activity is a critical factor in the initial stages of organic matter decomposition. CRS and RPS relied only on the decomposition of residual rice roots to compensate for soil OC losses, resulting in inadequate BG enzyme activity (Figure 2) and long-term soil OC deprivation. Conversely, RFD introduced aquatic animal manure as a C source to support microbial growth and reproduction, leading to improved soil C turnover (Table 2 and Figure 2).
Notably, paddy soil OC is derived from various sources, including residual rice roots, insects, grasses, and plankton in the paddy fields. Nevertheless, weed removal can result in nutrient loss in RPS and CRS. In RFD, aquatic animals consume certain biological resources, such as plankton, rice pests, and snails, transforming them into soil-available nutrients [17]. Therefore, aquatic animals play a vital role in nutrient cycling and efficient utilization in paddy fields [35]. Aquatic animals serve the crucial intermediate purpose of improving soil aeration and contributing to weed suppression by trampling, both of which lead to organic matter decomposition [36]. These activities enhance soil fertility, promote soil–fertilizer interactions, and expedite microbial decomposition of residual organic materials, thereby increasing soil OC content. Under waterlogged conditions, paddy soils accumulate organic acids that impede rice root development and stifle growth. Additionally, these acids serve as potent carbon sources for microorganisms, leading to the formation of gases such as CO2 and CH4 [37]. Soil bioturbation by fish and ducks effectively inhibits this process. In summary, OC accumulation is directly linked to the difference between C input and decomposition loss induced by the cropping system [38].
The cropping system substantially influences soil C pools, particularly active OC pools, which exhibit high responsiveness to field management practices [33,39]. Active OC (e.g., DOC and MBC) exhibits solubility within the soil and is characterized by a fast migration rate and instability, making it readily mineralized by microorganisms [40,41]. Generally, DOC is produced via direct leaching of organic matter or extracellular depolymerization of enzymes [42]. Remarkably, DOC plays a significant role as an available C source in maintaining soil microbial metabolic activity [43], despite accounting for only 2.36–3.53% of OC in soil (Figure S1). MBC directly participates in soil C cycling, represents soil microbial metabolism intensity, and reflects soil microbial activity [44].
The active OC balance was significantly affected by OC decomposition and alteration, and these changes corresponded to the cropping system. Animal manure generally contains easily decomposable OC and provides fresh C resources to accelerate microbial proliferation; therefore, RFD significantly enhances soil active OC [45]. Furthermore, RFD implementation increased water-dissolved oxygen content via the consumption of plankton by fish and ducks [13,36] and facilitated active OC production by accelerating mineralization of stable soil-based OC. Previous studies reported that aquatic animals stimulate rice root growth, increase the volume of organic secretions from the roots, and hasten conversion of stable to labile humus [9,35]. Overall, RFD markedly enhanced the content and proportion of active OC (Figure S1). The introduction of aquatic animal manure and the subsequent increase in microbial biomass provided the necessary basis for active OC formation (Figure 3). Additionally, bioturbation by aquatic animals improved the nearby soil environment, creating ideal external conditions for OC mineralization. We found that active OC content decreased as soil depth increased, indicating that soil active OC distribution was influenced by notable biological enrichment and surface aggregation [39]. This may be due to the richly developed rice roots in the topsoil accumulating more OC and nutrients, leading to varying active OC content in the various soil layers. Moreover, active OC exhibited strong fluidity and small-molecule characteristics [39], which made it easily leached down by water, resulting in similar active OC content in the plow layers across the different cropping systems.
4.2. Response of Soil Microbial Community Characteristics to Cropping Systems
The present study found that RFD produced significantly higher total PLFAs than did CRS, which was linked to bioturbation by fish and ducks. Soil redox potential is a critical factor affecting soil microbes [46]. Because bioturbation breaks the redox layer and changes receptor electron effectiveness, RFD affected microbial community composition and metabolic function. Similar to plowing’s effect on dryland farming systems, bioturbation stimulates rice root growth and amplifies nutrient uptake and root immobilization efficiency [16,47]. Further analysis revealed that the impact of the cropping system on C resources exceeded its influence on other nutrients (Table S3). The increase in both total PLFAs and OC was significantly associated with the cropping system (Figure S3). This finding aligns with previous research suggesting that soil C resources drive microbial development [32]. SEM demonstrated that MBC, rather than OC, significantly explained variations in the soil microbial community (Figure 6b). Research has demonstrated that soil microbes respond differently to soil C, which modifies the composition of their membrane fatty acids based on OC availability [46]. RFD increased active OC input through fish and duck manure, thereby augmenting the MBC essential for soil microbes. Overall, OC availability, rather than quantity, changed the soil microbial community following cropping system implementation.
Fungi and bacteria both serve as decomposers of soil organic matter. Nevertheless, their varying preferences for C substrates result in different environmental responses [12]. Bacteria respond positively and rapidly to high C availability, whereas fungi grow slowly and adopt a conservative resource-utilization strategy, causing delayed responses [48]. Soil microbes in RFD had the potential to propagate quickly using aquatic animal manure and promote decomposition of soil C substrates. The decomposition of exogenous C can be divided into two stages. Initially, non-structured compounds present in the organic matter are assimilated into the microbial biomass at a relatively high rate [49]. The utilization of easily decomposable and unstable C resources is prioritized by r-strategist microbes (bacteria), which play a crucial role [50]. After depletion of easily decomposable and unstable C, fungi propagate using recalcitrant or structured C, and are considered oligotrophic K-strategist microbes [51]. We found that the relative abundance of bacteria and fungi was 22.34–34.22% and 4.01–7.03%, respectively (Figure S2), confirming the dominance of bacteria among the overall soil microbes. Interestingly, although increases in both bacteria and fungi were detected in this study, the soil F/B ratio remained unchanged owing to synchronized increases. Recent research indicated that fungi were capable of decomposing recalcitrant C and effectively utilizing unstable C [52]. The significant association between increased active OC and fungal concentration supports this conclusion. GP and GN utilized substrates with strategies similar to those of fungi and bacteria, respectively, with corresponding variations in abundance consistent with those observed for fungi and bacteria. Our study found that GP/GN and GN were significantly correlated with active OC [53], indicating that the decline in the GP/GN ratio and heightened GN proliferation may be attributed to abundant C substrates. Thus, the soil microbes in RFD were dominated by GN and bacteria that made good use of organic C, implying that organic matter decomposition in RFD occurred in the r-strategy stage (Figure S2) due to their ability to recycle and allocate nutrients from older hyphae for nascent growth [54], which makes them less susceptible to C substrates.
The cy/pre ratio indicates microbial nutrient stress and changes in microbial community structure [11,28]. Compared to RPS and CRS, RFD soil had a lower cy/pre ratio, indicating that soil microbes exist in a relatively relaxed state. This may be attributable to the decomposition of fish and duck manure, which released active OC and available nutrients to meet substrate requirements for microbial growth, thereby altering microbial metabolic characteristics. In addition, soil pH considerably affects soil microbial communities [55]. Soil pH showed significant positive correlations with each microbial PLFA group and a negative correlation with the cy/pre ratio throughout our study. Notably, RFD increased soil pH over CRS levels to a range of 5.79–5.88, accompanied by a considerable increase in soil active OC and its instability. Therefore, pH may positively and indirectly affect soil microbial communities via substrate effectiveness (Figure 6a). These results suggest that RFD could alleviate the environmental stress caused by CRS, ultimately creating a more conducive environment for soil microbe proliferation.
5. Conclusions
Our study provides insights into the impact of soil environment on soil microbial communities across different cropping systems in a waterlogged paddy field on the Pearl Delta River. During a four-year field experiment, soil nutrients, organic carbon fractions, and microbial communities were all affected by the cropping system. Moreover, soil organic carbon displayed greater sensitivity to cropping systems than to soil nutrients. Despite the responses of the different organic carbon fractions and individual microbial PLFAs to different cropping systems, RFD produced greater active organic carbon content and microbial PLFA concentration, suggesting that active organic carbon contributed to improved microbial activity. Furthermore, significant changes in soil microbial community characteristics are induced by soil pH. Simultaneously, a significant correlation between soil pH and active organic carbon was displayed, which further indicated that the combined actions of pH and active organic carbon affected the soil microbial community. Active organic carbon is a valuable indicator of soil microbial reproduction following cropping system changes. Our research suggests that the increased organic carbon levels and OC availability induced by integrated cropping systems will greatly improve the soil microbial community in agricultural fields of the Pearl Delta River.
Supplementary Materials
The following supporting information can be downloaded at: https://www.mdpi.com/article/10.3390/agronomy14010081/s1, Figure S1. Proportion of soil microbial biomass carbon (MBC, a), easily-oxidation organic carbon (EOC, b), dissolved organic carbon (DOC, c), humic acid (HA, d), and fluvic acid (FA, e) under cropping systems. RFD, rice–fish–duck integrated cropping system; RPS, rice–pepper rotation system; CRS, conventional rice cropping system. Different letters indicate significant differences between cropping systems at p < 0.05 level. Figure S2. Relative abundances of bacteria (a), fungi (b), gram-positive bacteria (c), gram-negative bacteria (d), and arbuscular mycorrhizal fungi (e), and fungi: bacteria (i) under different cropping systems. BAC, bacteria; GP, gram-positive bacteria; GN, gram-negative bacteria; arbuscular mycorrhizal fungi. RFD, rice–fish–duck integrated cropping system; RPS, rice–pepper rotation system; CRS, conventional rice cropping system. “*” means significant difference at p < 0.05 among different cropping systems. Figure S3. Relationship between soil nutrient, organic carbon fractions, C-hydrolyzing enzyme activities, and each individual PLFAs. TN, total nitrogen; TP, total phosphorus; TK, total potassium; AN, available nitrogen; AP, available phosphorus; AK, available potassium; OC, organic carbon; EOC, easily oxidized organic carbon; DOC, dissolved organic carbon; MBC, microbial biomass carbon; HA, humic acid; FA, fulvic acid; HA/FA, ratio of HA to FA; BG, β-1,4-glucosidase; CBH, β-Dcellobiohydrolase; BX, Xylosidase; TEI, total enzyme activity index. BAC, bacteria, FUN, fungi; GP, gram-positive bacteria; GN, gram-negative bacteria; AMF, arbuscular mycorrhizal fungi; GP/GN, gram-positive bacteria to gram-negative bacteria; F/B, the ratio of fungi to bacteria; cy/pre: the ratio of cyclopropyl to precursors PLFAs. *, p < 0.05; **, p < 0.01; ***, p < 0.001. Table S1. Soil nutrient, soil carbon indicators and C-related enzyme activities under different cropping systems. Table S2. Nutrient content of duck manure. Table S3. Sensitivity index of soil chemical properties and soil carbon fractions to copping systems [56].
Author Contributions
Conceptualization, C.W., Q.Y. and K.L.; methodology, C.W. and J.C.; writing—original draft preparation, C.W.; writing—review and editing, C.Z. and K.L. All authors have read and agreed to the published version of the manuscript.
Funding
This work was supported by the Natural Science Foundation of Guangdong (2021A1515011543), Guangdong Education Science 13th Five-Year Plan Project (2020GXJK116), and Key Project of Natural Science of Guangzhou Xinhua University (2020KYZD02).
Data Availability Statement
Data are contained within the article and supplementary materials.
Conflicts of Interest
The authors declare that the research was conducted in the absence of any commercial or financial relationships that could be construed as potential conflicts of interest.
References
- Xie, K.Z.; Xu, P.Z.; Yang, S.H.; Lu, Y.S.; Jiang, R.P.; Gu, W.J.; Li, W.Y.; Sun, L.L. Effects of supplementary composts on microbial communities and rice productivity in cold water paddy fields. J. Microbiol. Biotechnol. 2015, 25, 569–578. [Google Scholar] [CrossRef]
- Matin, N.H.; Jalali, M. The effect of waterlogging on electrochemical properties and soluble nutrients in paddy soils. Paddy Water Environ. 2017, 15, 443–455. [Google Scholar] [CrossRef]
- Xie, X.L.; Wang, W.; Tian, W.W.; Xie, K.J. Waterlogging accelerates the loss of soil organic carbon from abandoned paddy fields in the hilly terrain in subtropical China. Sci. Rep. 2017, 7, 14549. [Google Scholar] [CrossRef]
- Kong, F.L.; Wu, Y.W.; Cui, S.L.; Wang, X.L.; Wei, G.; Liu, Q.L.; Lan, T.Q.; Liu, F.; Zhao, B.; Feng, D.J.; et al. Effect of chemical fertilizer application on maize production in China over the past 15 Years: A meta-analysis. Agronomy 2022, 12, 3005. [Google Scholar] [CrossRef]
- Macedo, I.; Terra, J.A.; Siri-Prieto, G.; Velazco, J.I.; Carrasco-Letelier, L. Rice-pasture agroe-cosystem intensification affects energy use efficiency. J. Clean. Prod. 2021, 278, 123771. [Google Scholar] [CrossRef]
- Cogle, A.L.; Rao, K.P.C.; Yule, D.F.; Smith, G.D.; George, P.J.; Srinivasan, S.T.; Jangawad, L. Soil management for Alfisols in the semiarid tropics: Erosion, enrichment ratios and run-off. Soil Use Manag. 2006, 18, 10–17. [Google Scholar] [CrossRef]
- Wang, J.X.; Lu, X.N.; Zhang, J.E.; Wei, H.; Li, M.J.; Lan, N.; Luo, H. Intercropping perennial aquatic plants with rice improved paddy field soil microbial biomass, biomass carbon and biomass nitrogen to facilitate soil sustainability. Soil Tillage Res. 2021, 208, 104908. [Google Scholar] [CrossRef]
- Wan, N.F.; Li, S.X.; Li, T.; Cavalieri, A.; Weiner, J.; Zheng, X.Q.; Ji, X.Y.; Zhang, J.Q.; Zhang, H.L.; Zhang, H.; et al. Ecological intensification of rice production through rice-fish co-culture. J. Clean. Prod. 2019, 234, 1002–1012. [Google Scholar] [CrossRef]
- Ambus, J.V.; Awe, G.O.; Carvalho, P.C.D.F.; Reichert, J.M. Integrated crop-livestock systems in lowlands with rice cultivation improve root environment and maintain soil structure and functioning. Soil Tillage Res. 2023, 227, 105592. [Google Scholar] [CrossRef]
- Hinojosa, M.B.; García-Ruíz, R.; Egla, B.V.; Carreira, J.A. Microbiological rates and enzyme activities as indicators of functionality in soils affected by the Aznalcóllar toxic spill. Soil Biol. Biochem. 2004, 36, 1637–1644. [Google Scholar] [CrossRef]
- Moore-Kucera, J.; Dick, R.P. PLFA profiling of microbial community structure and seasonal shifts in soils of a douglas−fir chronosequence. Microb. Ecol. 2008, 55, 500–511. [Google Scholar] [CrossRef]
- Manzoni, S.; Schimel, J.P.; Porporato, A. Responses of soil microbial communities to water stress: Results from a meta-analysis. Ecology 2012, 93, 930–938. [Google Scholar] [CrossRef]
- Fang, K.K.; Chen, H.Y.; Dai, W.; Wang, J.; Cao, L.K.; Sha, Z.M. Microbe-mediated reduction of methane emission in rice-frog crop ecosystem. Appl. Soil Ecol. 2022, 174, 104415. [Google Scholar] [CrossRef]
- Afri, H.; Murwantoko, M.; Indah, I. Dynamic change in bacterial communities in the integrated rice-fish farming system in Sleman, Yogyakarta, Indonesia. Aquac. Res. 2021, 52, 5566–5578. [Google Scholar]
- Cai, S.M.; Lv, W.G.; Zhu, H.T.; Zhang, D.S.; Fu, Z.S.; Zhang, H.L.; Xu, S.X. Effect of nitrogen application rate on soil fungi community structure in a rice-fish mutualistic system. Sci. Rep. 2019, 9, 16188. [Google Scholar] [CrossRef]
- Li, W.B.; He, Z.F.; Wu, L.P.; Liu, S.J.; Luo, L.C.; Ye, X.X.; Gao, H.J.; Ma, C. Impacts of co-culture of rice and aquatic animals on rice yield and quality: A meta-analysis of field trials. Field Crops Res. 2022, 280, 108468. [Google Scholar] [CrossRef]
- Teng, Q.; Hu, X.F.; Cheng, C.; Luo, Z.Q.; Luo, F.; Xue, Y.; Jiang, Y.J.; Mu, Z.; Liu, L.M.; Yang, M.Y. Ecological effects of rice-duck integrated farming on soil fertility and weed and pest control. J. Soils Sediments 2016, 16, 2395–2407. [Google Scholar] [CrossRef]
- Bashir, M.A.; Wang, H.Y.; Pan, J.T.; Khoshnevisan, B.; Sun, W.T.; Zhai, L.M.; Zhang, X.S.; Wang, N.; Rehim, A.; Liu, H.B. Variations in soil nutrient dynamics and their composition in rice under integrated rice-crab co-culture system. J. Clean. Prod. 2021, 281, 125222. [Google Scholar] [CrossRef]
- Ge, L.; Sun, Y.; Wang, L.Y.; Guo, G.Q.; Song, L.L.; Wang, C.; Wu, G.G.; Zang, X.Y.; Cai, X.M.; Li, S.X.; et al. Ecosystem sustainability of rice and aquatic animal co-culture systems and a synthesis of its underlying mechanisms. Sci. Total Environ. 2023, 880, 163314. [Google Scholar] [CrossRef]
- Sun, G.; Sun, M.; Zhang, Z.; Wang, Z.C.; Zhang, G.B.; Nie, S.A.; Xu, H.Q.; Wang, H. Ecological rice-cropping systems mitigate global warming—A meta-analysis. Sci. Total Environ. 2021, 789, 147900. [Google Scholar] [CrossRef]
- Wang, C.; Yang, Q.N.; Zhang, C.; Li, X.D.; Chen, J.; Zhang, X.L.; Chen, J.J.; Liu, K.X. Rice-fish-duck system regulation of soil phosphorus fraction conversion and availability through organic carbon and phosphatase activity. Front. Environ. Sci. 2022, 10, 979234. [Google Scholar] [CrossRef]
- Zhang, G.L.; Li, D.C. Field Guidelines for Describing and Sampling Soils; Science Press: Beijing, China, 2016. [Google Scholar]
- Lu, R.K. Methods for Soil Agrochemical Analysis; China Agricultural Science and Technology Press: Beijing, China, 2000. [Google Scholar]
- Saiya-Cork, K.R.; Sinsabaugh, R.L.; Zak, D.R. The effects of long term nitrogen deposition on extracellular enzyme activity in an Acer saccharum forest soil. Soil Biol. Biochem. 2002, 34, 1309–1315. [Google Scholar] [CrossRef]
- Bossio, D.A.; Scow, K.M. Impacts of carbon and flooding on soil microbial communities: Phospholipid fatty acid profiles and substrate utilization patterns. Microb. Ecol. 1998, 35, 265–278. [Google Scholar] [CrossRef] [PubMed]
- Frostegard, A.; Baath, E. The use of phospholipid fatty acid analysis to estimate bacterial and fungal biomass in soil. Biol. Fertil. Soils 1996, 22, 59–65. [Google Scholar] [CrossRef]
- Kourtev, P.S.; Ehrenfeld, J.G.; Haggblom, M. Exotic plant species alter the microbial community structure and function in the soil. Ecology 2002, 83, 3152–3166. [Google Scholar] [CrossRef]
- Liu, X.; Peng, C.; Zhang, W.J.; Li, S.Y.; An, T.T.; Xu, Y.D.; Ge, Z.; Xie, N.H.; Wang, J.K. Subsoiling tillage with straw incorporation improves soil microbial community characteristics in the whole cultivated layers: A one-year study. Soil Till. Res. 2022, 215, 105188. [Google Scholar] [CrossRef]
- Blair, G.J.; Lefroy, R.D.; Lisle, L. Soil carbon fractions based on their degree of oxidation, and the development of a carbon management index for agricultural systems. Aust. J. Agric. Res. 1995, 46, 1459–1466. [Google Scholar] [CrossRef]
- Yu, P.J.; Li, Y.X.; Liu, S.W.; Liu, J.L.; Ding, Z.; Ma, M.G.; Tang, X.G. Afforestation influences soil organic carbon and its fractions associated with aggregates in a karst region of Southwest China. Sci. Total Environ. 2022, 814, 152710. [Google Scholar] [CrossRef]
- Zhang, Y.; Wu, C.F.; Deng, S.P.; Zhang, J.L.; Hou, J.Y.; Wang, C.; Fu, Z.C. Effect of different washing solutions on soil enzyme activity and microbial community in agricultural soil severely contaminated with cadmium. Environ. Sci. Pollut. Res. 2022, 29, 54641–54651. [Google Scholar] [CrossRef]
- Esmaeilzadeh-Salestani, K.; Bahram, M.; Seraj, R.G.M.; Gohar, D.; Tohidfar, M.; Eremeev, V.; Talgre, L.; Khaleghdoust, B.; Mirmajlessi, S.M.; Luik, A.; et al. Cropping systems with higher organic carbon promote soil microbial diversity. Agric. Ecosyst. Environ. 2021, 319, 107521. [Google Scholar] [CrossRef]
- Si, G.H.; Peng, C.L.; Yuan, J.F.; Xu, X.Y.; Zhao, S.J.; Xu, D.B.; Wu, J.S. Changes in soil microbial community composition and organic carbon fractions in an integrated rice–crayfish farming system in subtropical China. Sci. Rep. 2017, 7, 2856. [Google Scholar] [CrossRef] [PubMed]
- Bowles, T.M.; Acosta-Martinez, V.; Calderon, F.; Jackson, L.E. Soil enzyme activities, microbial communities, and carbon and nitrogen availability in organic agroecosystems across an intensively-managed agricultural landscape. Soil. Biol. Biochem. 2014, 68, 252–262. [Google Scholar] [CrossRef]
- Fanjul, E.; Escapa, M.; Montemayor, D.; Addino, M.; Alvarez, M.F.; Grela, M.A.; Iribarne, O. Effect of crab bioturbation on organic matter processing in South West Atlantic intertidal sediments. J. Sea Res. 2015, 95, 206–216. [Google Scholar] [CrossRef]
- Booth, M.T.; Urbanic, M.; Wang, X.; Beaulieu, J.J. Bioturbation frequency alters methane emissions from reservoir sediments. Sci. Total Environ. 2021, 789, 148033. [Google Scholar] [CrossRef] [PubMed]
- Girkin, N.T.; Turner, B.L.; Ostle, N.; Craigon, J.; Sjogersten, S. Root exudate analogues accelerate CO2 and CH4 production in tropical peat. Soil Biol. Biochem. 2018, 117, 48–55. [Google Scholar] [CrossRef]
- Chen, Q.Y.; Liu, Z.J.; Zhou, J.B.; Xu, X.P.; Zhu, Y.J. Long-term straw mulching with nitrogen fertilization increases nutrient and microbial determinants of soil quality in a maize–wheat rotation on China’s Loess Plateau. Sci. Total Environ. 2021, 775, 145930. [Google Scholar] [CrossRef]
- Buchi, L.; Walder, F.; Banerjee, S.; Colombi, T.; van der Heijden, M.G.A.; Keller, T.; Charles, R.; Six, J. Pedoclimatic factors and management determine soil organic carbon and aggregation in farmer fields at a regional scale. Geoderma 2022, 409, 115632. [Google Scholar] [CrossRef]
- Kalbitz, K.; Solinger, S.; Park, J.H.; Michalzik, B.; Matzner, E. Controls on the dynamics of dissolved organic matter in soils: A review. Soil Sci. 2000, 165, 277–304. [Google Scholar] [CrossRef]
- Ren, C.; Wang, T.; Xu, Y.; Deng, J.; Zhao, F.; Yang, G.; Han, X.; Feng, Y.; Ren, G. Differential soil microbial community responses to the linkage of soil organic carbon fractions with respiration across land-use changes. For. Ecol. Manag. 2018, 409, 170–178. [Google Scholar] [CrossRef]
- Zsolnay, A.; Gorlitz, H. Water extractable organic matter in arable soils: Effects of drought and long-term fertilization. Soil Biol. Biochem. 1994, 26, 1257–1261. [Google Scholar] [CrossRef]
- Marschner, B.; Kalbitz, K. Controls of bioavailability and biodegradability of dissolved organic matter in soils. Geoderma 2003, 113, 211–235. [Google Scholar] [CrossRef]
- Gunina, A.; Dippold, M.; Glaser, B.; Kuzyakov, Y. Turnover of microbial groups and cell components in soil: 13C analysis of cellular biomarkers. Biogeosciences 2017, 14, 271–283. [Google Scholar] [CrossRef]
- Datta, A.; Nayak, D.R.; Sinhababu, D.P.; Adhya, T.K. Methane and nitrous oxide emissions from an integrated rainfed rice–fish farming system of Eastern India. Agric. Ecosyst. Environ. 2009, 129, 228–237. [Google Scholar] [CrossRef]
- Qiu, H.; Ge, T.; Liu, J.; Chen, X.; Hu, Y.; Wu, J.; Su, Y.; Kuzyakov, Y. Effects of biotic and abiotic factors on soil organic matter mineralization: Experiments and structural modeling analysis. Eur. J. Soil Biol. 2018, 84, 27–34. [Google Scholar] [CrossRef]
- Gautreau, E.; Volatier, L.; Nogaro, G.; Gouze, E.; Mermillod-Blondin, F. The influence of bioturbation and water column oxygenation on nutrient recycling in reservoir sediments. Hydrobiologia 2020, 847, 1027–1040. [Google Scholar] [CrossRef]
- Piton, G.; Legay, N.; Arnoldi, C.; Lavorel, S.; Clément, J.C.; Foulquier, A. Using proxies of microbial community weighted means traits to explain the cascading effect of management intensity, soil and plant traits on ecosystem resilience in mountain grasslands. J. Ecol. 2019, 108, 876–893. [Google Scholar] [CrossRef]
- Cotrufo, M.F.; Soong, J.L.; Horton, A.J.; Campbell, E.E.; Haddix, M.L.; Wall, D.H.; Parton, W.J. Formation of soil organic matter via biochemical and physical pathways of litter mass loss. Nat. Geosci. 2015, 8, 776–779. [Google Scholar] [CrossRef]
- Paterson, E.; Sim, A.; Osborne, S.M.; Murray, P. Long-term exclusion of plantinputs to soil reduces the functional capacity of microbial communities to mineralise recalcitrant root-derived carbon sources. Soil Biol. Biochem. 2011, 43, 1873–1880. [Google Scholar] [CrossRef]
- de Boer, W.; Folman, L.; Summerbell, R.C.; Boddy, L. Living in a fungal world: Impact of fungi on soil bacterial niche development. FEMS Microbiol. Rev. 2005, 29, 795–811. [Google Scholar] [CrossRef]
- Ren, G.C.; Zhang, X.F.; Xin, X.L.; Yang, W.L.; Zhu, A.N.; Yang, J. Soil organic carbon and nitrogen fractions as affected by straw and nitrogen management on the North China Plain. Agric. Ecosyst. Environ. 2023, 342, 108248. [Google Scholar] [CrossRef]
- Fanin, N.; Kardol, P.; Farrell, M.; Nilsson, M.C.; Gundale, M.J.; Wardle, D.A. The ratio of Gram-positive to Gram-negative bacterial PLFA markers as an indicator of carbon availability in organic soils. Soil Biol. Biochem. 2019, 128, 111–114. [Google Scholar] [CrossRef]
- Genre, A.; Lanfranco, L.; Perotto, S.; Bonfante, P. Unique and common traits in mycorrhizal symbioses. Nat. Rev. Microbiol. 2020, 18, 649–660. [Google Scholar] [CrossRef] [PubMed]
- Li, Q.; Feng, J.; Wu, J.; Jia, W.; Zhang, Q.; Chen, Q.; Zhang, D.; Cheng, X. Spatial variation in soil microbial community structure and its relation to plant distribution and local environments following afforestation in central China. Soil Tillage Res. 2019, 193, 8–16. [Google Scholar] [CrossRef]
- Bremer, E.; Janzen, H.H.; Johnston, A.M. Sensitivity of total, light fraction and mineralizable organic matter to management practices in a Lethbridge soil. Can. J. Soil Sci. 1994, 74, 131–138. [Google Scholar] [CrossRef]
Figure 1.
Stability of soil organic carbon under different cropping systems. * Indicates significant differences at p < 0.05; NS, not significant. RPS, rice–pepper rotation system; CRS, conventional rice cropping system.
Figure 1.
Stability of soil organic carbon under different cropping systems. * Indicates significant differences at p < 0.05; NS, not significant. RPS, rice–pepper rotation system; CRS, conventional rice cropping system.
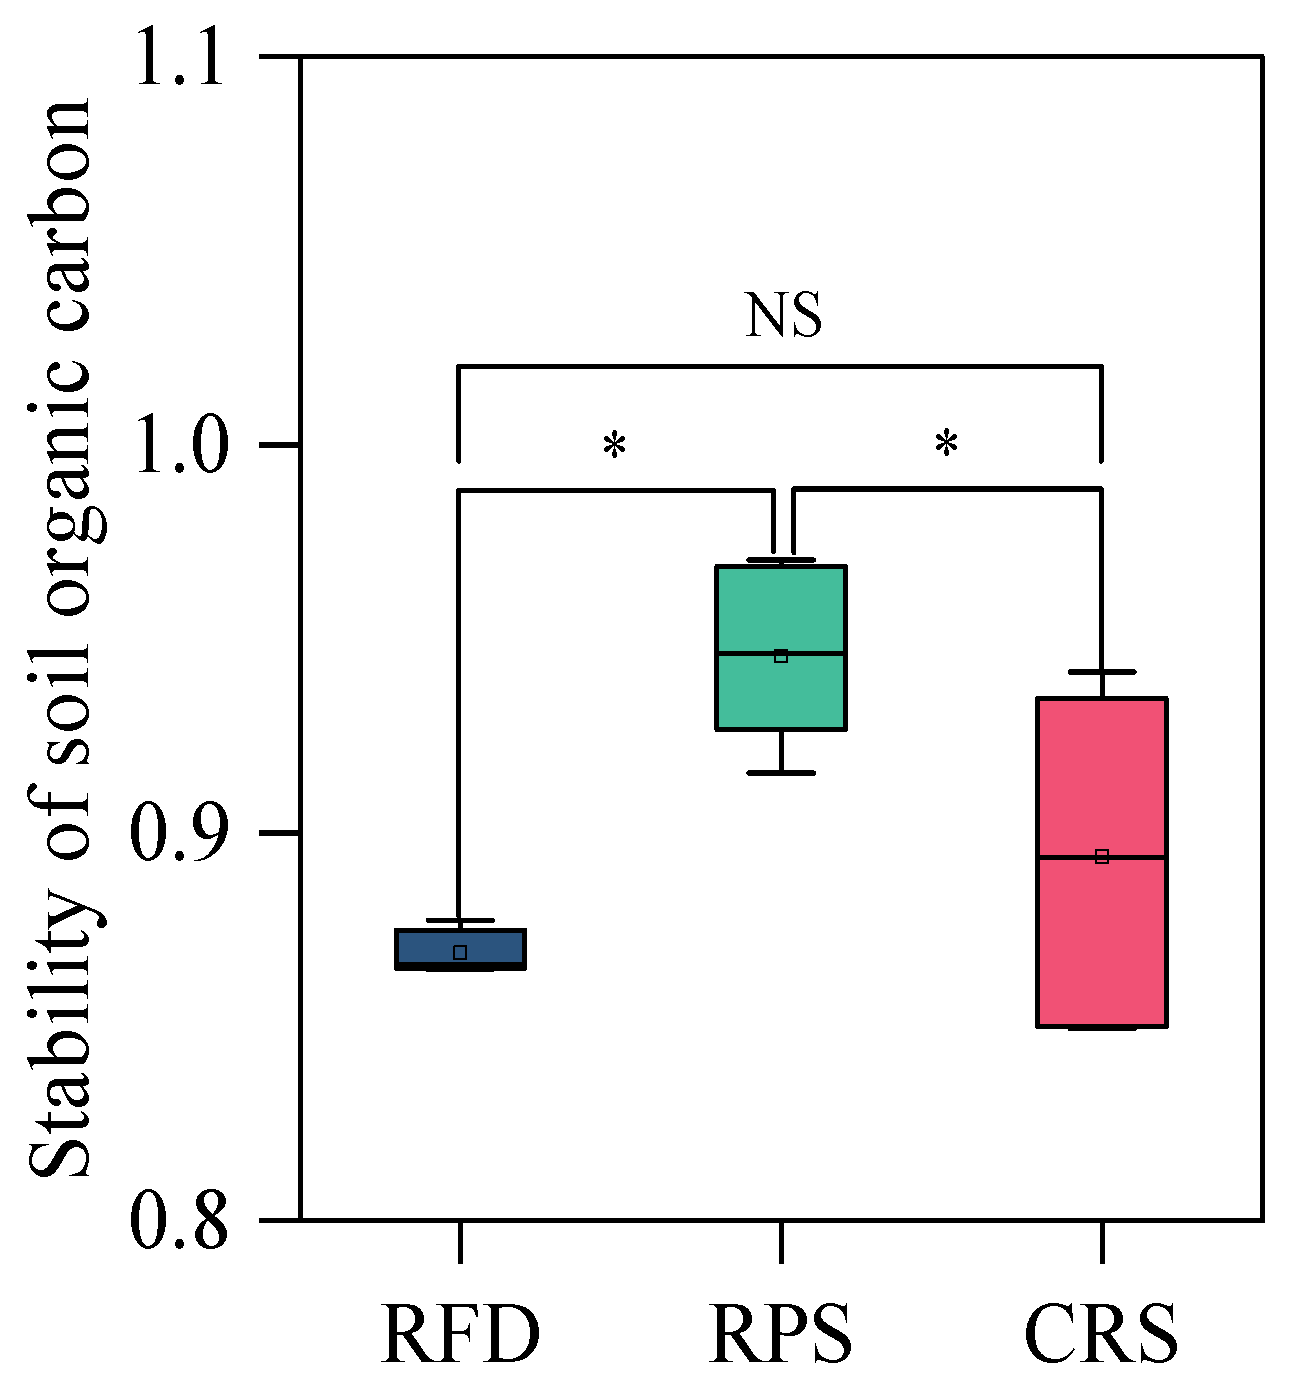
Figure 2.
Soil C-hydrolyzing enzyme activities: (a) BG; (b) CBH; (c) BX, geometric mean index (GMEA) (d); and total enzyme activity index (TEI) (e) under different cropping systems (mean ± SE). Different letters indicate significant differences between cropping systems at p < 0.05 level. RPS, rice–pepper rotation system; CRS, conventional rice cropping system. BG, β–1,4–glucosidase; CBH, Cellobiohydrolase; BX, Xylosidase.

Figure 3.
Soil individual PLFAs under different cropping systems (mean ± SE). (a) total PLFAs; (b) GP; (c) GN; (d) bacteria; (e) fungi; (f). Different letters indicate significant differences between cropping systems at p < 0.05 level. RPS, rice–pepper rotation system; CRS, conventional rice cropping system. GP, Gram–positive bacteria; GN, Gram–negative bacteria; AMF, arbuscular mycorrhizal fungi.
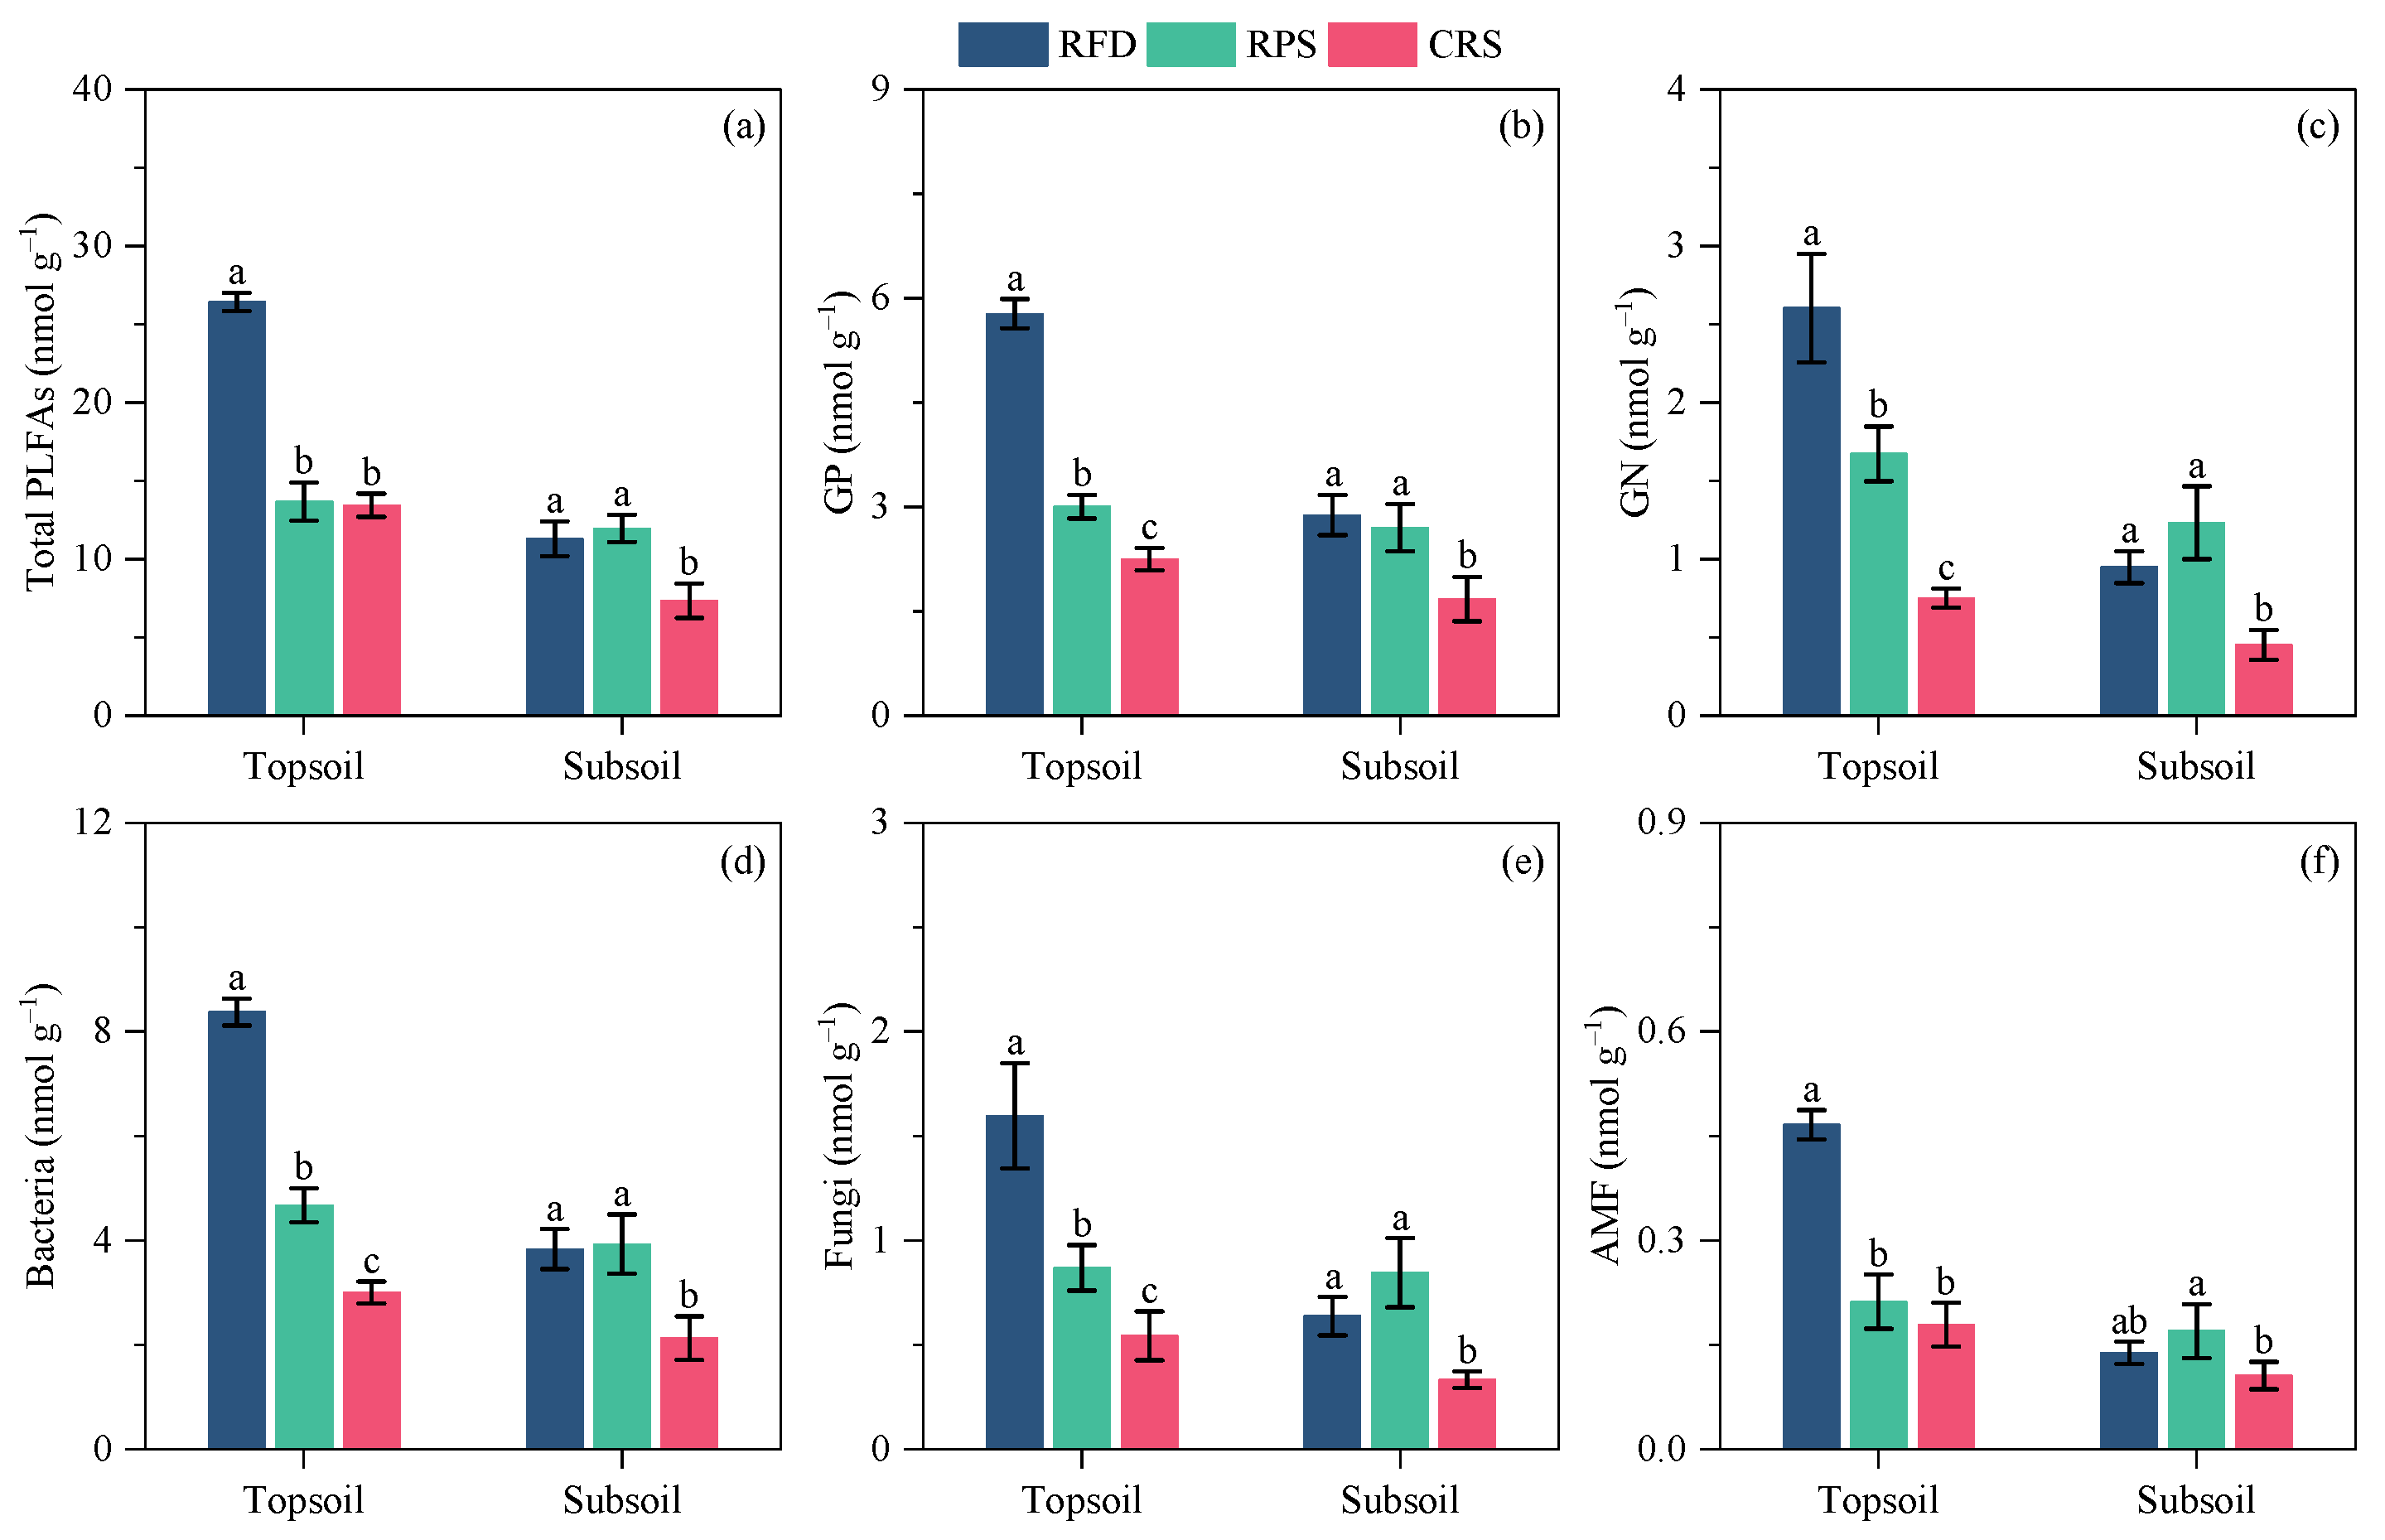
Figure 4.
Soil microbial PLFA ratios under different cropping systems. (a) GP/GN; (b) F/B; (c) cy/pre. Different letters indicate significant differences between cropping systems at p < 0.05 level. RPS, rice–pepper rotation system; CRS, conventional rice cropping system. GP/GN, ratio of Gram–positive bacteria to Gram–negative bacteria; F/B, ratio of fungi to bacteria; cy/pre, cyclopropyl PLFAs to precursors PLFAs.
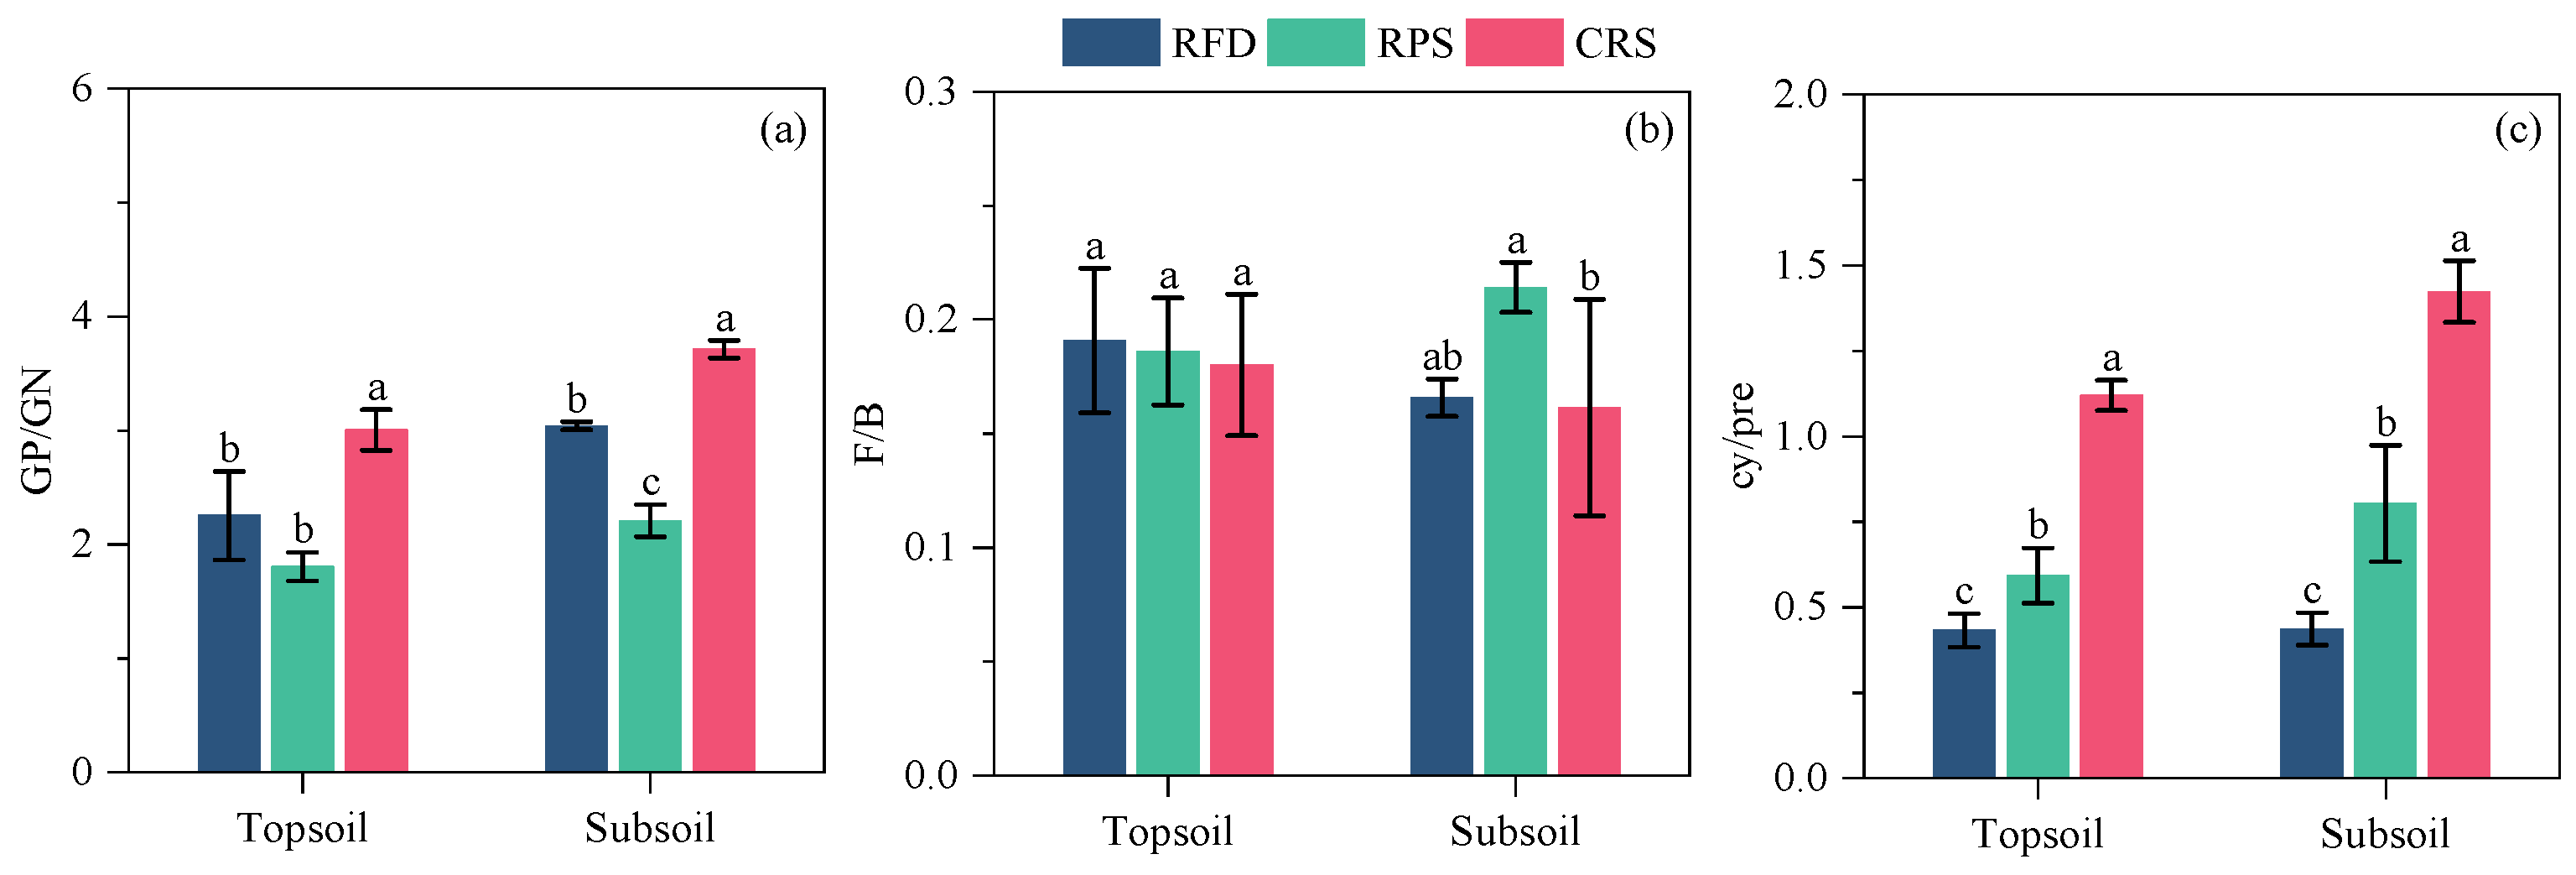
Figure 5.
Principal component analysis of soil microbial community characteristics: (a) topsoil; (b) subsoil of different cropping systems. RPS, rice–pepper rotation system; CRS, conventional rice cropping system. GP, Gram–positive bacteria; GN, Gram–negative bacteria; AMF, arbuscular mycorrhizal fungi. GP/GN, ratio of Gram–positive bacteria to Gram–negative bacteria; F/B, ratio of fungi to bacteria; cy/pre, cyclopropyl PLFAs to precursors PLFAs.
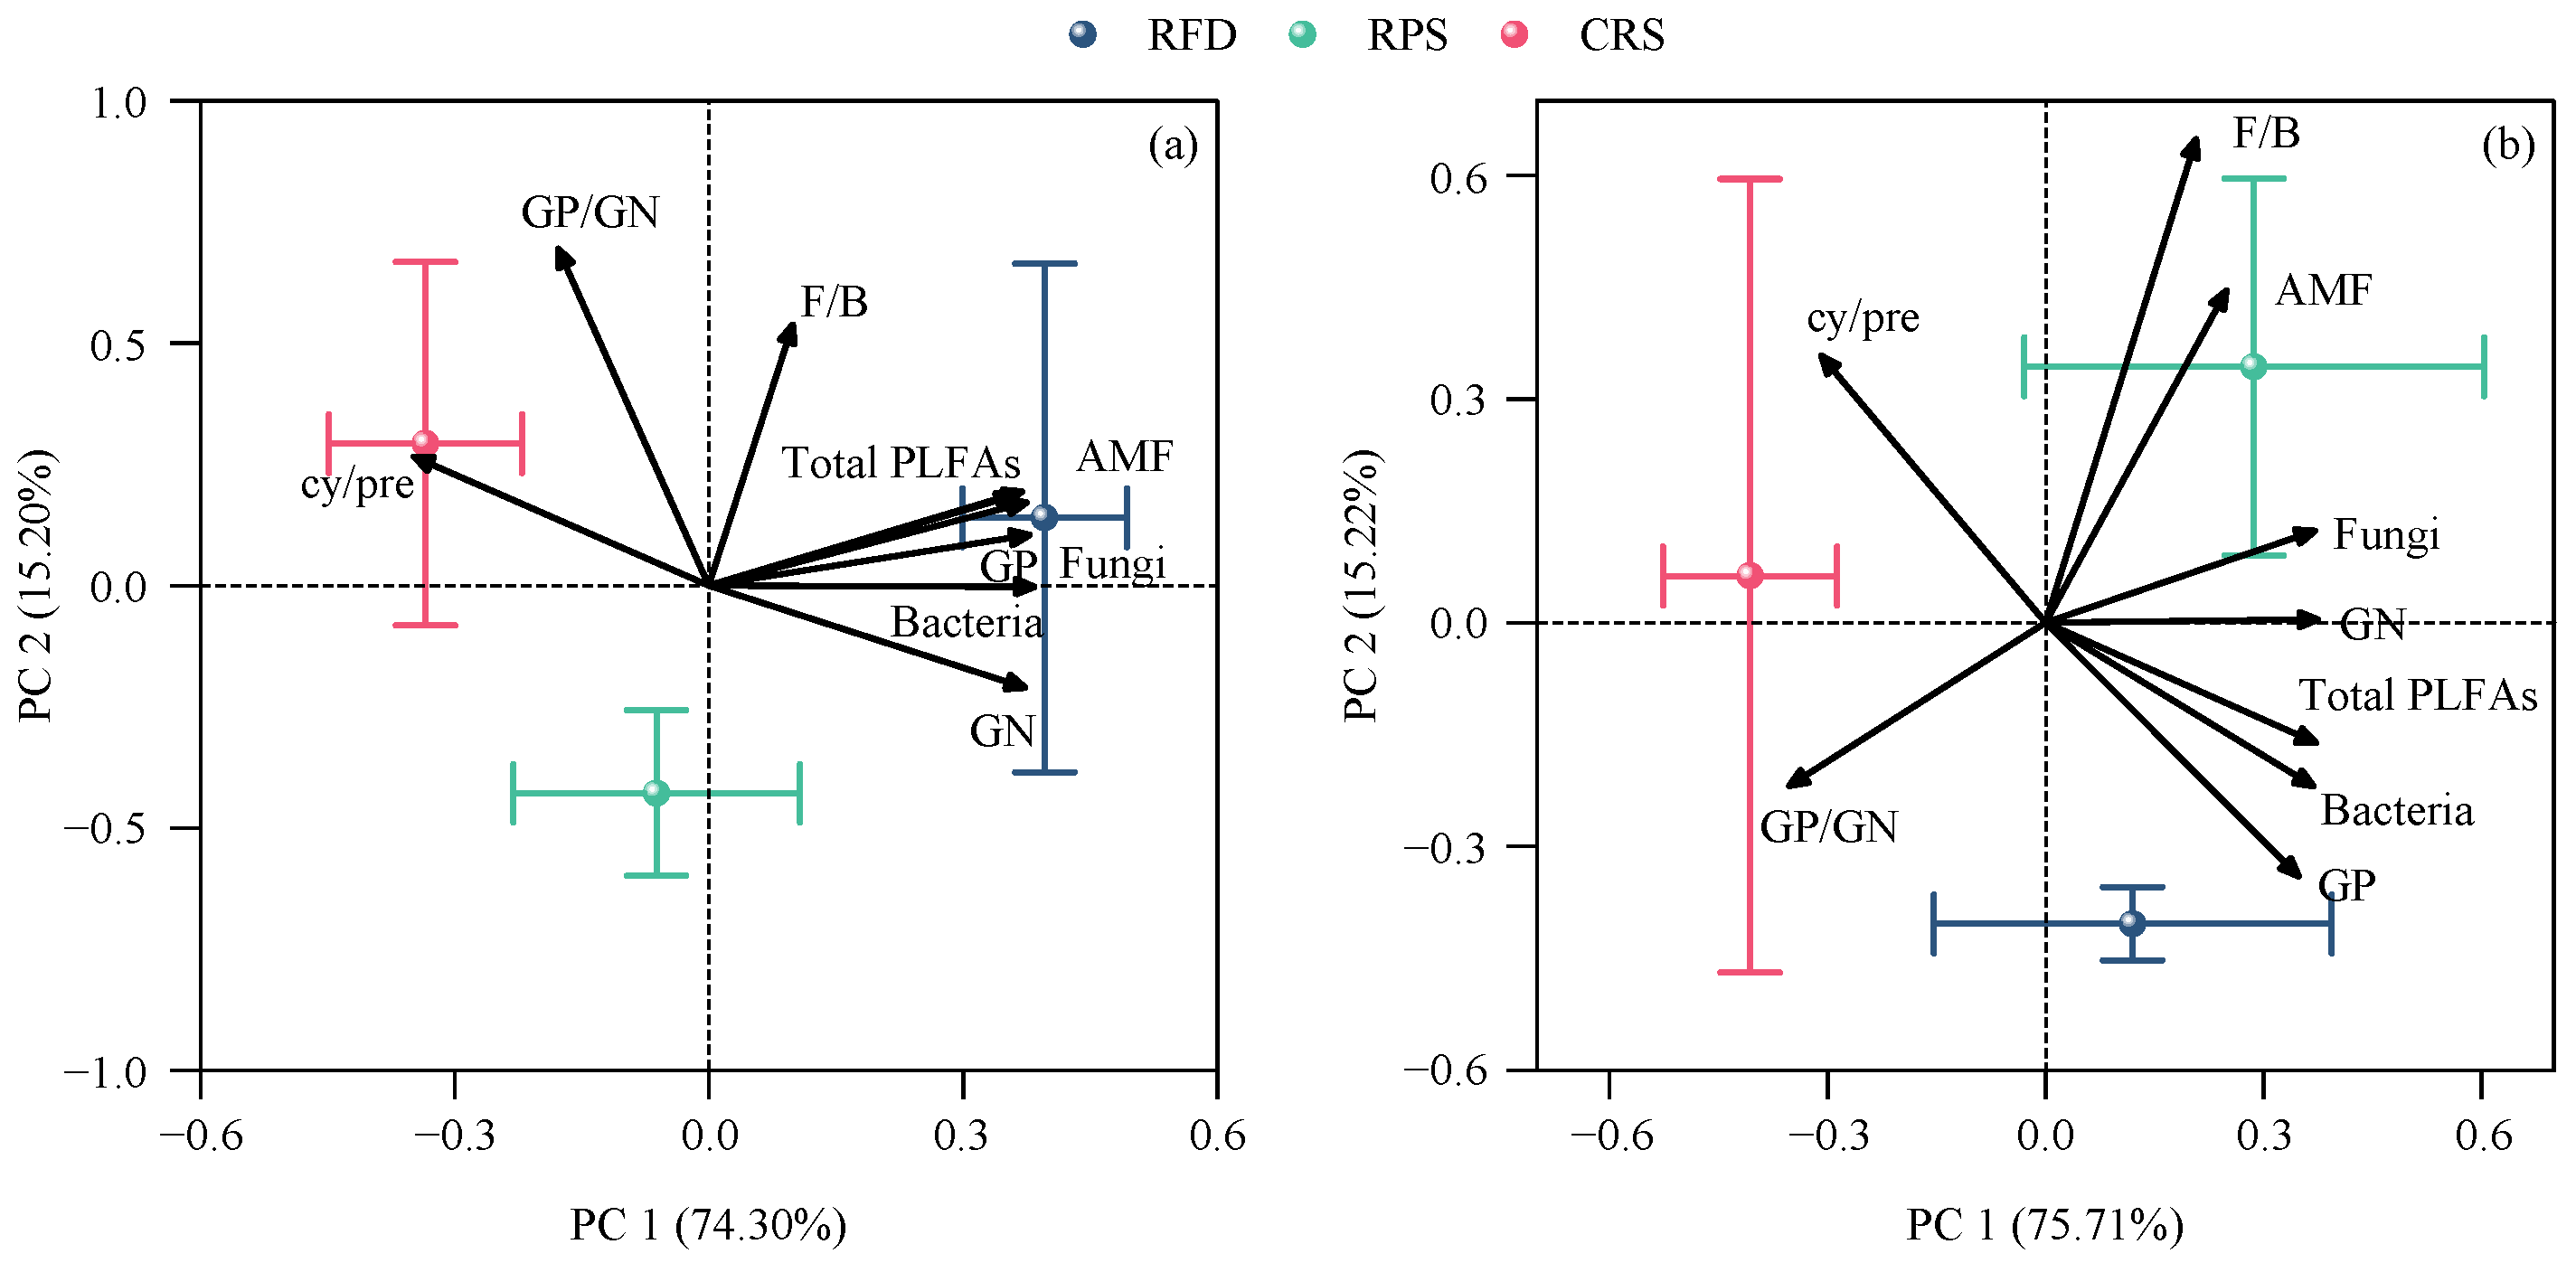
Figure 6.
Structural equation model revealing relationship soil chemical properties, soil carbon fractions, C-related enzyme activities, and soil microbial community characteristics (a), and their total effects derived from structural equation model (b). MBC, microbial biomass carbon; TEI, total enzyme activity index; SSC, stability of soil organic carbon; cy/pre, cyclopropyl PLFAs to precursors PLFAs. *, p < 0.05; **, p < 0.01.

Table 1.
The abbreviations and assay method.
| Abbreviations | Full Name | Assay Method |
|---|---|---|
| pH | Potentiometer method | |
| TN | Total nitrogen | Semi-micro Kjeldahl method |
| TP | Total phosphorus | HF–HClO4–HNO3 digestion |
| TK | Total potassium | HF–HClO4–HNO3 digestion |
| AN | Available nitrogen | Alkalolysis diffusion method |
| AP | Available phosphorus | NaHCO3 leaching-spectrophotometer (V2200, Sunny Hengping instrument Co., Ltd., Shanghai, China) |
| AK | Available potassium | CH3COONH4 leaching-flamephotometer |
| OC | Soil organic carbon | H2SO4–K2Cr2O7 external heating method |
| DOC | Dissolved organic carbon | Deionization leaching-elemental analyzer (CE–440, DHJ Analysis Co., Ltd., Beijing, China) |
| EOC | Easily oxidized organic carbon | KMnO4 oxidation method |
| MBC | Microbial biomass carbon | Chloroform fumigation-potassium sulphate leaching-elemental analyzer |
| HA | Humic acid | Na4P2O7–NaOH leaching and H2SO4 digestion |
| FA | Fulvic acid | |
| BG | β-1,4-glucosidase | A 96-well fluorometric plate reader method |
| CBH | Cellobiohydrolase | |
| BX | Xylosidase | |
| Total PLFAs | Total phospholipid fatty acids | Bossio and Scow [18] |
| GP | Gram-positive bacteria | |
| GN | Gram-negative bacteria | |
| BAC | Bacteria | |
| FUN | Fungi | |
| AMF | Arbuscular mycorrhizal fungi | |
| GP/GN | Ratio of Gram-positive bacteria to Gram-negative bacteria | |
| F/B | Ratio of fungi to bacteria | |
| cy/pre | Ratio of cyclopropyl PLFAs to precursors PLFAs |
Table 2.
Magnitude of the effects of rice–fish–duck system (RFD) on soil nutrients with respect to rice–pepper rotation system (RPS) and conventional rice cropping system (CRS).
Table 2.
Magnitude of the effects of rice–fish–duck system (RFD) on soil nutrients with respect to rice–pepper rotation system (RPS) and conventional rice cropping system (CRS).
| Variables | RFD vs. CRS | RFD vs. RPS | ||
|---|---|---|---|---|
| Topsoil | Subsoil | Topsoil | Subsoil | |
| pH | 16.43 ± 1.54 * | 16.94 ± 2.36 * | 2.65 ± 0.36 * | −0.72 ± 1.91 ns |
| TN | 41.69 ± 10.53 * | 41.33 ± 4.98 * | 36.24 ± 2.19 * | 63.11 ± 2.33 * |
| TP | 88.07 ± 2.80 * | 81.91 ± 1.94 * | 69.21 ± 4.48 * | 54.71 ± 2.01 * |
| TK | 5.44 ± 5.74 ns | −7.79 ± 3.47 ns | 104.64 ± 6.19 * | 90.19 ± 9.67 * |
| AN | 76.26 ± 5.34 * | 73.38 ± 2.42 * | 53.93 ± 4.37 * | 76.06 ± 0.45 * |
| AP | 197.46 ± 5.33 * | 187.04 ± 9.87 * | 274.01 ± 9.23 * | 359.31 ± 9.50 * |
| AK | 112.30 ± 7.41 * | 15.42 ± 10.37 ns | 41.83 ± 4.58 * | −24.26 ± 4.84 * |
For each variable, t-tests were used to detect significant differences between RFD and CRS (RPS): ns, p > 0.05; *, p < 0.05. RFD, rice–fish–duck integrated cropping system; RPS, rice–pepper rotation system; CRS, conventional rice cropping system. TN, total nitrogen; TP, total phosphorus; TK, total potassium; AN, available nitrogen; AP, available phosphorus; AK, available potassium.
Table 3.
Magnitude of the effects of rice–fish–duck system (RFD) on soil organic carbon fractions with respect to rice–pepper rotation system (RPS) and conventional rice cropping system (CRS).
Table 3.
Magnitude of the effects of rice–fish–duck system (RFD) on soil organic carbon fractions with respect to rice–pepper rotation system (RPS) and conventional rice cropping system (CRS).
| Variables | RFD vs. CRS | RFD vs. RPS | ||
|---|---|---|---|---|
| Topsoil | Subsoil | Topsoil | Subsoil | |
| OC | 38.39 ± 3.04 * | 35.55 ± 1.42 * | 21.36 ± 0.35 * | 32.54 ± 3.38 * |
| EOC | 22.31 ± 5.96 * | 178.41 ± 3.89 * | 107.77 ± 14.97 * | 444.35 ± 43.18 * |
| DOC | 33.28 ± 2.45 * | 55.23 ± 2.90 * | 12.25 ± 1.07 * | 6.11 ± 3.36 * |
| MBC | 216.44 ± 15.75 * | 51.87 ± 10.95 * | 58.02 ± 14.18 * | 78.39 ± 6.35 ns |
| HA | 57.15 ± 7.59 * | 84.87 ± 13.21 * | 126.74 ±4.09 * | 113.80 ± 12.46 * |
| FA | 66.82 ± 4.45 * | 55.36 ± 1.73 * | 20.20 ± 5.18 * | 23.21 ± 5.18 * |
| HA/FA | −5.82 ± 3.08 ns | 18.98 ± 8.10 ns | 88.85 ± 8.17 * | 73.44 ± 3.16 * |
For each variable, t-tests were used to detect significant differences between RFD and CRS (RPS): ns, p > 0.05; *, p < 0.05. RFD, rice–fish–duck integrated cropping system; RPS, rice–pepper rotation system; CRS, conventional rice cropping system. OC, organic carbon; EOC, easily oxidized organic carbon; DOC, dissolved organic carbon; MBC, microbial biomass carbon; HA, humic acid; FA, fulvic acid; HA/FA, ratio of humic acid to fulvic acid.
Disclaimer/Publisher’s Note: The statements, opinions and data contained in all publications are solely those of the individual author(s) and contributor(s) and not of MDPI and/or the editor(s). MDPI and/or the editor(s) disclaim responsibility for any injury to people or property resulting from any ideas, methods, instructions or products referred to in the content. |
© 2023 by the authors. Licensee MDPI, Basel, Switzerland. This article is an open access article distributed under the terms and conditions of the Creative Commons Attribution (CC BY) license (https://creativecommons.org/licenses/by/4.0/).
Share and Cite
MDPI and ACS Style
Wang, C.; Yang, Q.; Chen, J.; Zhang, C.; Liu, K. Variations in Soil Organic Carbon Fractions and Microbial Community in Rice Fields under an Integrated Cropping System. Agronomy 2024, 14, 81. https://doi.org/10.3390/agronomy14010081
AMA Style
Wang C, Yang Q, Chen J, Zhang C, Liu K. Variations in Soil Organic Carbon Fractions and Microbial Community in Rice Fields under an Integrated Cropping System. Agronomy. 2024; 14(1):81. https://doi.org/10.3390/agronomy14010081
Chicago/Turabian StyleWang, Chao, Qiannan Yang, Jing Chen, Chi Zhang, and Kexue Liu. 2024. "Variations in Soil Organic Carbon Fractions and Microbial Community in Rice Fields under an Integrated Cropping System" Agronomy 14, no. 1: 81. https://doi.org/10.3390/agronomy14010081
Note that from the first issue of 2016, this journal uses article numbers instead of page numbers. See further details here.