
The Effects of Various Long-Term Fertilizer Applications on Soil Carbon Fractions in a Winter Wheat Monoculture Area
1
College of Resources and Environment, Shanxi Agricultural University, Jinzhong 030801, China
2
Ministerial and Provincial Co-Innovation Centre for Endemic Crops Production with High-Quality and Efficiency in Loess Plateau, Shanxi Agricultural University, Jinzhong 030801, China
*
Authors to whom correspondence should be addressed.
Agronomy 2024, 14(1), 82; https://doi.org/10.3390/agronomy14010082
Submission received: 6 December 2023
/
Revised: 23 December 2023
/
Accepted: 27 December 2023
/
Published: 29 December 2023
(This article belongs to the Topic Carbon and Nitrogen Cycling in Agro-Ecosystems and Other Anthropogenically Maintained Ecosystems)
Abstract
:The Loess Plateau in China has long grappled with issues such as chronic soil erosion, poor soil structure, and diminished organic matter. Soil organic carbon plays a crucial role in enhancing soil fertility, and fertilization is a key tool that influences it. In a comprehensive field experiment, we examined five fertilization methods: no fertilization (CK); traditional fertilization used by local farmers (FP); nutrient-balanced fertilization with nitrogen, phosphorus, and potassium (OF); chemical fertilizers used in conjunction with organic fertilizers (OFM); and chemical fertilizers paired with bio-organic fertilizers (OFB). Our findings revealed that the OFM and OFB treatments were the most effective, explaining 84.35% and 81.26% of the variation in soil carbon sequestration, respectively. Further, the OF, OFM, and OFB treatments demonstrated superior effectiveness compared with the FP treatment in enhancing the soil carbon fractions. However, these fertilization patterns did not significantly alter the active-to-inert carbon ratio of the soil. OF, OFM, and OFB treatments enhanced the stability of soil carbon pools more than FP treatment. In structural equation modeling, factors such as microbial biomass nitrogen and phosphorus, soil pH, and β-N-acetyl glucosidase indirectly exhibited a limiting effect on the carbon pool stability index (CPSI), while β-glucosidase displayed an indirect positive correlation with the carbon fractions. In contrast, dissolved organic carbon, low-molecular-weight organic carbon, high-molecular-weight organic carbon, and crop yield demonstrated direct positive correlations with the CPSI. Consequently, both a balanced application of chemical fertilizers and the combination of organic and chemical fertilizers were effective in enhancing and sustaining the soil’s organic carbon content, thereby contributing to soil fertility stability. To this end, this study can inform the efficient selection and use of fertilizers, improving crop yield and soil carbon content.
1. Introduction
Soil serves as the largest organic carbon reservoir in terrestrial ecosystems [1]. Soil organic carbon (SOC) is a broad term encompassing the carbon resulting from humus, plant and animal remnants, and microbial processes [2], which are crucial for enhancing soil fertility, upholding ecosystem sustainability, and mitigating climate change [3,4]. SOC is delineated into reactive and inert organic carbon. Microbial biomass carbon (MBC), easily oxidizable organic carbon (EOC), light-family organic carbon (LFOC), and particulate organic carbon (POC) are pivotal reactive organic carbon fractions that are responsive to soil management practices, intricately linked to intrinsic soil productivity [2], and instrumental in soil nutrient cycling and carbon sequestration [5,6,7]. MBC reflects subtle alterations at the soil ecosystem level [8], while EOC variations indicate early shifts in the SOC pool, with the proportion of organic carbon directly affecting the SOC pool stability [9]. POC characterizes the transformation of difficult-to-decompose carbon fractions and serves as a primary indicator of metamorphosis and fixation of soil-perishable organic carbon [10]. Soil mineral-bound organic carbon (MOC), recombinant organic carbon (HFOC), and other inert carbon components exhibit sluggish turnover rates and possess steadfast physicochemical properties, thereby functioning as evaluative indices for the storage capacity and alteration traits of soil carbon pools [11].
Accumulation of SOC depends on the equilibrium between carbon inputs and outputs within a system. This equilibrium is influenced by plant biomass inputs, SOC formation, and decomposition processes, in which soil microorganisms play pivotal roles. Soil microorganisms channel most plant-derived carbon into energy production or biomass augmentation, and microbial carcasses contribute to the soil carbon pool [12]. The conversion of MBC to abiotic SOC ranges from 40% to 80% [13,14]. Enzymes generated by microorganisms act as key drivers in the biochemical conversion of SOC, and their activities reflect the role of microorganisms in soil systems. Extracellular enzymes break down organic compounds into smaller reaction products such as sugars, phenolic compounds, and amino acids [15]. For instance, β-glucosidase (β-G) hydrolyzes cellulose to obtain carbon, and β-N-acetyl glucosidase (NAG) breaks down N-acetyl-β-D-glucosaminoglucose to obtain carbon and nitrogen [16]. Therefore, metabolites resulting from microbial activity are essential components of the SOC pool.
The Loess Plateau region, which constitutes 40% of China’s dryland crop area [17], is a rain-fed agricultural zone that faces long-term soil erosion, drought, and low rainfall challenges, leading to poor soil structure and diminished organic matter [18]. The burgeoning fertilizer industry and increasing food demand have driven farmers to rely heavily on inorganic fertilizers, neglecting the use of organic fertilizers [19]. This practice has detrimentally affected the soil structure in arable drylands, resulting in severe environmental issues. SOC in arable land plays a critical role in soil fertility and crop yield. Augmenting the SOC content not only enhances soil health and quality but also mitigates carbon dioxide emissions [20,21,22,23]. Numerous studies have underlined the various factors influencing the relationship between carbon inputs and SOC content changes, including the climate, soil properties, tillage practices, fertilizer application methods, and crop types, with fertilizer application emerging as particularly crucial [24,25]. Fertilizer application is a key method for increasing grain yield, and the use of either single chemical or organic fertilizers is less effective in enhancing yields compared to the combination of organic and inorganic fertilizers [26,27,28]. Yan et al. [29] discovered that replacing nitrogen in certain chemical fertilizers with manure and other fertilizers increased crop yields by 5.2% through a comprehensive global analysis. Our earlier study demonstrated that a combination of organic and inorganic fertilization could markedly enhance wheat grain yield by 6.0–9.8%. Fertilizer application is also one of the most direct ways soil SOC content can be artificially regulated. Incorporating exogenous organic matter is effective in elevating SOC levels, enhancing turnover capacity, maintaining and increasing soil organic matter levels, and improving soil fertility [30]. Research emphasizes a substantial increase in SOC content after prolonged organic fertilizer application or combined organic and inorganic fertilizer use [31]. Liu et al. [32] reported positive linear correlations between long-term organic fertilizer application and increased total organic carbon content in farmlands. Upon entering the soil, organic fertilizers proficiently enhance soil physicochemical properties, regulate the nitrogen, phosphorus, and potassium contents, and elevate the SOC content. Moreover, substantial carbon and nitrogen sources provided by organic fertilizers foster microbial biomass growth, facilitating root-microbe interactions. In summary, different fertilizer applications have other effects on SOC content. We expect that organic–inorganic fertilizer application will achieve better results than other fertilizer applications.
Consequently, we assessed the long-term impacts (10 years) of various fertilizer application methods on the SOC content at an in situ experimental site located in the wheat-growing area of the Loess Plateau, aiming to screen for appropriate fertilizer application, enhance arable land quality, promote sustainable agriculture, and achieve consistently high crop yields.
2. Materials and Methods
2.1. Study Site
From 2013 to 2023, we conducted an in situ field experiment in Dongliang, Hongtong County, Shanxi Province, China (36°22′ N, 111°35′ E; altitude: 648 m). This area represents a typical Loess dryland plateau region characterized by a temperate monsoon climate. The average annual temperature is 12.6 °C, with a total cumulative temperature of 3326.90 °C; annual rainfall is 500 mm, with the precipitation from June to September constituting approximately 60–70% (Figure 1). The frost-free period spans 180–210 days. The soil texture is loamy soil (based on U.S. soil texture classifications). The soil type is classified as Chromic Cambisols (based on FAO Soil Map), with a pH of 7.61; the soil has a bulk density of 1.21 g·cm−3, an organic matter content of 15.13 g·kg−1, and a total nitrogen content of 0.78 g·kg−1. Additionally, the nitrate nitrogen, quick-acting phosphorus, and quick-acting potassium contents are 8.51 mg·kg−1, 11.61 mg·kg−1, and 200.76 mg·kg−1, respectively.
2.2. Experimental Design
Five fertilizer treatments were assessed: no fertilization (CK); traditional fertilization used by local farmers (FP); a balanced fertilization pattern involving nitrogen, phosphorus, and potassium (OF); organic and chemical fertilizers (OFM); and bio-organic fertilizers used in combination with chemical fertilizers (OFB). Table 1 details the ten-year cumulative fertilizer application of each treatment.
Local farmers apply fertilizers with only N and P elements but not K because local soils are relatively rich in K elements. Balanced fertilization is the balanced application of mineral fertilizers. The application rates of N, P, and K nutrients are determined by the yield of the previous crop, as well as the nitrate nitrogen content of the 0–100 cm soil layer and the quick-acting phosphorus and quick-acting potassium content of the 0–40 cm soil layer prior to sowing the wheat together.
The fertilizers used were urea (46.0% N), calcium superphosphate (12% P2O5), and potassium chloride (60% K2O). The bio-organic fertilizer was a mixed bacterial solution consisting of Lahn-type bacteria and Pseudomonas 1 and 2, blended with rotted chicken manure at a ratio of 1:9, ensuring a viable bacteria count of ≥0.5 × 10⁸ CFU·g−1. The organic and bio-organic fertilizers used the same carriers, maintaining identical nutrient contents. All fertilizers are commercial fertilizers manufactured and supplied by Shanxi Jinnongkang Biotechnology Co., Ltd. (Xi’an, China).
Each treatment included three replicates organized into randomized blocks. The seeding techniques involved utilizing machinery covering the ridges with mulch and sowing the furrows between the mulch. All fertilizers were uniformly applied to the corresponding plots once per growing season before sowing. Sowing occurred annually in late September at a rate of 150 kg·hm−2. Crops were harvested in early June of the following year, and the idle summer period spanned from mid-June to mid-September. Throughout the experimental period, irrigation was omitted, relying solely on natural precipitation.
2.3. Sample Collection and Analysis
After harvesting wheat in June 2023, topsoil was collected from five sample sites in three replicate plots for each treatment. The soil samples were mixed and removed from impurities and then divided into two portions, one of which was stored at 4 °C, and the other portion of the soil was dried naturally.
We used a pH meter to measure the soil suspension to obtain the data of soil pH, a flame photometer to measure the filtered soil supernatant to obtain the data of soil fast-acting potassium (SAK) (mg·kg−1), the chloroform fumigation extraction method to obtain the data of microbial biomass carbon (MBC), microbial biomass phosphorus (MBP), and microbial biomass nitrogen (MBN) (mg·kg−1), the fluorescence spectrophotometry to obtain the data of β-1,4-glucosidase (β-G) and β-1,4-N-acetylaminoglucosidase (NAG) (nmol·g−1·h−1).
We used potassium dichromate volumetric method for the data of soil organic carbon (SOC) (g·kg−1), a spectrophotometer to measure the soil filtrate with Mn (III)-pyrophosphoric acid solution and concentrated sulfuric acid to obtain the data of soil soluble organic carbon (DOC) (g·kg−1), the proportion separation method to obtain the data of recombinant organic carbon (HFOC) (g·kg−1), and the potassium permanganate oxidation method to obtain the data of easily oxidizable organic carbon (EOC) (g·kg−1).
Determination of particulate organic carbon (POC): We dispersed the soil with 5 g·L−1 sodium hexametaphosphate solution, washed the distributed solution into an aluminum box through a 53 μm sieve, dried and weighed at 60 °C, calculated the percentage of the soil, which is the mass fraction of the particulate state, and determined the organic carbon content of the dried soil sample (g·kg−1).
Determination of mineral-bound organic carbon (MOC) [33], light-family organic carbon (LFOC), and steady-state carbon (SC): The content of SOC was used to subtract the content of POC, HFOC, and EOC, respectively (g·kg−1).
2.4. Calculation of Soil Carbon Pool-Related Indicators and the Farmland Carbon Input
The carbon pool stability index (CPSI) [33] was calculated as follows:
CPSI = MOC/POC
The carbon pool management index (CPMI) was calculated using Equation (2):
CPMI = CPI × AI × 100
Where CPI is the carbon pool index, and AI is the carbon pool activity index. The equation for the carbon pool index (CPI) was the following:
where SOCi is the organic carbon content after different treatments (g·kg−1), and SOC0 is the SOC content after treatment CK (g·kg−1). In turn, the carbon pool activity index (AI) was calculated as follows:
where Ai is the carbon pool activity after different treatments, and A0 is the carbon pool activity after treatment CK. Finally, carbon pool activity (A) was calculated using Equation (5):
CPI = SOCi/SOC0
AI = Ai/A0
A = EOC/SC
In this study, soil exogenous organic carbon sources were categorized into four components: wheat straw, roots, root secretions, and organic matter input. Belowground wheat biomass accounted for 23% of the straw biomass, and the carbon input from root secretion was approximately equal to the belowground carbon input [34,35].
2.5. Data Analysis
Microsoft Excel 2019 (Microsoft, Redmond, WA, USA) was used for data management, and all analysis was conducted in SPSS v.26 (IBM, Armonk, NY, USA). Further, Duncan’s New Complex Polar Deviation method was further used for one-way ANOVA (p < 0.05), and the homogeneity of variance test was performed. Origin 2021 (OriginLab, Northampton, PA, USA) was used to plot all data, and AMOS v.26 (IBM, Armonk, NY, USA) was used for structural equation modeling (SEM). Before constructing the structural equation model, we analyzed all the indicators using least squares regression combined with ridge regression, which ultimately resulted in 10 eligible indicators, including soil pH,β-G, NAG, MBN, MBP, wheat grain yield (GY), DOC, LFOC, HFOC, and SAK on carbon pool stability (Table 2).
3. Results
3.1. Effect of Carbon Inputs on SOC after Different Fertilizer Treatments
Figure 2a illustrates the cumulative carbon inputs and proportions of various exogenous carbon inputs after each fertilization treatment. The CK, FP, and OF treatments had three exogenous carbon inputs, namely, straw, root system, and root secretion inputs. In contrast, the OFM and OFB treatments included carbon inputs from organic materials in addition to these three sources. The cumulative carbon inputs after OFM treatment were the highest (42.5 t·hm−2), followed by those after OFB, OF, and FP treatment, with 41.2 t·hm−2, 33.7 t·hm−2, and 31.5 t·hm−2, respectively; CK treatment resulted in the lowest carbon input (21.6 t·hm−2). Across all treatments, the carbon input from straw constituted the most significant proportion of the total carbon input. Figure 2b–e show that changes in the SOC content after each treatment were significantly and positively correlated with the year-by-year carbon input. Notably, the year-to-year carbon input resulting from OFM treatment explained 84.35% of the variation in the corresponding SOC increase, with the OF and OFB treatments closely following at 81.26% and 78.65%, respectively. With 62.24%, FP treatment exhibited the lowest correlation.
3.2. Effects of Different Fertilization Practices on the SOC Fractions
Figure 3a shows the SOC content and its components after different fertilization treatments. Analysis of the active and inert carbon fractions provided insight into the fertilization mechanism by which the SOC content is enhanced. OFB treatment significantly increased the EOC content by 33.9%, reaching 4.538 g·kg−1, compared to CK treatment, whereas the others did not show a significant increase. However, all fertilization treatments showed a significantly increased POC compared with the CK treatment, with OFB having the highest content (3.637 g·kg−1), followed by the OFM and OF treatments with 3.571 g·kg−1 and 3.444 g·kg−1, respectively, while the FP treatment showed the lowest POC of 3.342 g·kg−1. LFOC significantly increased after OFB treatment compared to CK treatment, with the increase ranging from 34.5% to 65.0%. Soil carbon significantly increased after OFM, OF, and OFB treatment relative to CK treatment, whereas FP treatment showed only a slight increase. Additionally, FP decreased the MOC content relative to CK treatment, whereas the other treatments led to an increase. Both FP and OFB treatments decreased the HFOC content compared to CK treatment, whereas the others did not result in a significant change. Figure 3b shows the percentage of the active and inert carbon fractions after each treatment under different grouping methods; the proportions of the active and inert carbon fractions did not change significantly after any fertilization treatments relative to CK treatment.
These results show that fertilization enhanced the content of most carbon fractions in the soil but did not significantly change the proportion of the carbon fractions, highlighting the nuanced effects of different fertilization strategies on the soil carbon fractions and providing valuable insights for sustainable soil management.
3.3. Effects of Various Fertilization Practices on Soil Carbon Pools
Table 3 outlines the correlation indices of the carbon pools across the different fertilization treatments. In terms of A, FP and OFM treatment led to significant differences, with values of 0.704 and 0.499, respectively. However, these two treatments did not reflect significant differences from the other treatments. Regarding the AI, there was a significant decrease in OF and OFM compared to FP. FP treatment had the highest index of 1.158, followed by OF treatment with 0.873; OFM treatment had the lowest of 0.829. Similarly, in terms of the CPI, OFM, OF, and OFB treatments led to a significant increase compared to CK or FP treatments, with OFM treatment leading to the highest value of 1.342, followed by OF treatment with 1.231; OFB treatment resulted in the lowest value of 1.121. In turn, no significant differences existed between all treatments, and the highest CPMI value was observed after FP treatment (126). Lastly, compared to CK treatment, all fertilizer treatments led to notably lower CPSI values, with OF treatment having the highest value of 2.219, followed by the OFB and OFM treatments with 2.172 and 2.102, respectively; FP treatment led to the lowest value of 1.939.
3.4. Effect of Different Fertilization Practices on Soil Characteristics
Figure 4a presents the enzyme activities of β-G and NAG after different fertilization treatments. Regarding β-G, OFM treatment led to the highest activity, with 22.822 nmol·g−1·h−1, which was a significant increase compared to CK treatment. However, the other fertilizer treatments did not show a significant increase, with activity ranging from 18.729 to 21.194 nmol·g−1·h−1. In contrast, no significant differences existed between all treatments; compared to CK treatment, all fertilizer treatments led to a decrease in NAG, with reductions ranging from 11.0% to 23.2%.
Figure 4b shows the microbial biomass carbon (MBC), nitrogen (MBN), and phosphorus (MBP) contents after the different fertilization treatments. All treatments demonstrated a significant increase in the MBC, ranging from 7.8% to 22.2%, compared to CK treatment. Specifically, the OF treatment had the highest content of 97.030 mg·kg−1, followed by the OFM and OFB treatments, while the FP treatment had the lowest (85.579 mg·kg−1). In contrast, OFB treatment led to the highest MBN content of 9.339 mg·kg−1, which was significantly higher than that after CK treatment; the MBN content after the other treatments ranged from 6.966 mg·kg−1 to 8.222 mg·kg−1. Finally, all fertilization treatments showed no significant differences but exhibited a slight increase in the MBP content, ranging from 5.861 mg·kg−1 to 6.696 mg·kg−1 or 5.0% to 22.2% compared to CK treatment. These results suggest that different fertilization strategies influence soil enzyme activity and microbial biomass to varying extents, emphasizing the importance of selecting appropriate fertilization practices for ensuring sustainable soil health.
3.5. Effect of Fertilizer Application on Soil Carbon Pool Stability
The SEM results revealed that dissolved organic carbon (DOC), HFOC, and LFOC had significant positive effects on the CPSI, with LFOC demonstrating a particularly substantial influence. Concurrently, β-G exerted an indirect effect on the CPSI by influencing the three aforementioned carbon fractions. Further, soil pH had a significant adverse effect on the CPSI by influencing MBP, HFOC, DOC, and NAG. Notably, MBN also demonstrated a significant adverse effect on the CPSI, indicating that increased microbial activity may be detrimental to carbon sequestration. Furthermore, NAG exhibited significant adverse effects on MBP, HFOC, DOC, and NAG, thus indirectly influencing the CPSI.
The normalized total, direct, and indirect effects of each indicator on the CPSI are illustrated in Figure 5. While soil pH, MBN, MBP, and NAG had negative effects on the CPSI, soil-available potassium, β-G, HFOC, LFOC, DOC, and grain yield had a positive influence. Specifically, LFOC exhibited the strongest total and direct effects, whereas soil pH and NAG displayed the strongest indirect effects.
4. Discussion
4.1. Effect of Fertilizer Application on Soil Carbon Pools
This study investigated the impact of different fertilization treatments on SOC content over one decade. Notably, OFM and OFB treatment demonstrated a pronounced carbon sequestration effect, albeit with a fluctuating trend that initially decreased and subsequently increased (Figure 2). This trend may be attributed to the substantial input of exogenous carbon during the initial years, leading to soil carbon mineralization until saturation, followed by a gradual increase in SOC. Insights from previous research conducted by Mary et al. [36] and Duong et al. [37] are consistent with our results. The mechanism of this counteracting is mentioned in the study of Perveen et al. [38], i.e., a possible priming effect (PE) due to adding fresh organic matter. Several studies [39,40,41] demonstrated that PE increases with carbon input until reaching a saturation level. Moreover, our study indicated that the enhanced soil microbial population and activity following OFM or OFB treatments could directly influence the priming effect. The intricate dynamics involved in this process were highlighted by Fontaine et al. [42], showcasing the importance of the energy available to soil microbes and microbial competition in soil carbon decomposition.
Examination of different fertilization treatments revealed varied impacts on the soil fractions. While the majority led to an increase in the SOC content compared to CK treatment, exceptions, such as a decrease in MOC after FP treatment and a reduction in HFOC after OFB, were observed. These deviations were probably attributed to the unhealthy fertilization pattern of local farmers reflected in the FP treatment, as well as the unique characteristics of the OFB treatment favoring an increase in the active rather than inert carbon fractions. Surprisingly, this study found no significant differences in the carbon fractions after OF, OFM, and OFB treatment, which did not align with expectations. Temporal differences in the organic carbon content after these treatments may account for this discrepancy, suggesting the need for continued experimentation to unravel the intricacies of combined organic and chemical fertilizer application.
In agroecosystems, the CPMI, amalgamated CPI, and AI serve as crucial tools for evaluating the potential impacts of diverse agroecosystem management practices on soil carbon sequestration. This facilitates long-term monitoring of SOC, with larger CPMI values indicating improved ecosystem recovery, enhancement, and sustainability [43,44]. As stressed by Blair et al. [45], specific variations in the CPMI among different farm management practices may be less critical than the insights gained from comparative analyses. In our study, all fertilizer treatments contributed to enhancing the soil CPMI, with the OFB and OFM treatments notably surpassing the OF treatment in improving the CPMI, which was consistent with our expectations. Additionally, this aligns with an extensive 13-year experiment conducted by Zhang et al. [46], in which the soil CPMI was higher after treatment with organic and organic–inorganic fertilizer blends than with chemical fertilizers. Similarly, Tang et al. [30] found that the CPMI was higher after treatment with organic fertilizer and straw return than with none or chemical fertilizers. Interestingly, FP treatment yielded counterintuitive results, resulting in the highest CPMI values of all treatments. This may be attributed to other fertilizer treatments increasing the SOC content by altering the carbon components and ratios. However, FP exhibiting the highest CPMI values was also noted by Ghosh et al. [47]. Lastly, regarding the soil CPSI, the decreasing trend observed after fertilizer treatments compared to CK treatment may be attributed to fertilizer application, one of the most direct field management measures, artificially disturbing the soil carbon pool, resulting in the observed phenomenon.
4.2. Soil Microbial Biomass Carbon, Nitrogen, and Phosphorus and Two Enzymes
Soil enzymes play a pivotal role in the soil ecosystem [48], and their activities serve as indicators of the impact of fertilization on soil fertility and quality [49,50]. β-G, crucial for organic matter degradation, and β-1,4-N-acetylaminoglucosidase (NAG), involved in converting organic carbon and nitrogen, were the focus of this study. Our findings align with those of Zhao et al. [43] and Qi et al. [51], indicating that both organic and inorganic fertilizers enhance soil enzyme activity. Further, we observed that OFM treatment significantly increased β-G activity compared to CK treatment because OFM introduces a higher amount of exogenous organic matter, leading to increased β-G secretion, while all fertilizer treatments, including OFM, led to a decrease in NAG activity. This trend is consistent with the findings of Li et al. [52], suggesting a potential negative correlation between NAG activity and soil pH (alterations in soil pH can lead to modifications in the spatial conformation of NAG, consequently hindering its catalytic activity), and the observations of Zheng et al. [53].
In examining the soil microbial components, it was noted that long-term organic fertilization with chemical fertilizers increased the MBN, which is consistent with the results of Zhu et al. [54] and Kumar et al. [55]. However, MBC did not show similar changes, with balanced fertilizer application resulting in a significantly higher MBC compared to other treatments. This contrasts with the results of Li et al. [56], who indicated that balanced fertilizer application promotes the synthesis of microbial cellular fractions, suggesting that nuanced interactions influence the effectiveness of different fertilization approaches.
The MBP was enhanced after all fertilizer treatments when compared to no fertilization; however, an unexpected outcome was observed after OFM treatment, where the MBP was lower than that after OF and FP treatment. This discrepancy may be attributed to the stoichiometric relationship between carbon and phosphorus, potentially indicating that exogenous organic matter inputs resulting from OFM treatment slowed microbial biomass carbon limitation and exacerbated microbial biomass phosphorus limitation [57]. These findings resonate with those of Zheng et al. [53], in which nitrogen, phosphorus, and potassium application intensified microbial biomass carbon limitation, consequently weakening microbial phosphorus limitation.
4.3. Effects of Various Environmental Factors on Differently Fertilized Soil Carbon Pools
Understanding the mechanisms underlying soil carbon pool stability is pivotal for rationalizing soil utilization, implementing effective controls, regulating the soil carbon sequestration potential, and enhancing environmental conditions. Considering the correlations between various factors and employing SEM, we identified significant contributors to soil carbon pool stability, including crop yield, MBP, MBC, soil pH, NAG, β-G, DOC, LFOC, and HFOC. This aligns with the findings of Stark et al. [58], which emphasized that pH is a primary factor influencing soil extracellular enzyme activity. Similarly, Guo et al. [59] revealed a noteworthy negative correlation between SOC fractions and soil pH. Our study further highlighted that soil pH indirectly affected the CPSI by inhibiting MBP, NAG, DOC, and HFOC. Li et al. similarly showed a negative correlation between soil pH and soil MBP [60]. Further, NAG and β-G, identified as soil carbon-associated enzymes, significantly influenced the three carbon fractions, thereby also indirectly affecting the CPSI. In line with other research [61], it has been observed that MBN plays a promoting role in MBP, and they both have emerged as crucial elements associated with soil carbon pool stability, demonstrating a significant negative correlation with the CPSI. Lastly, crop yield, which serves as a direct indicator of agricultural soil productivity [62], exhibited a substantial positive correlation with the CPSI, which signifies that enhancing the overall nutrient status of the soil contributes to the stabilization of the soil carbon pool.
5. Conclusions
This study examined the effects of long-term fertilization of experimental sites in a wheat-growing area of the Loess Plateau. Our results showed that fertilization with exogenous carbon inputs over ten consecutive years enhanced the SOC content. When combined with inorganic fertilizers, the carbon sequestration potential of organic fertilizers was much greater than that of chemical fertilizers. Moreover, fertilization, one of the most direct field management measures, significantly increased the content of the soil carbon fractions. Organic and inorganic fertilizer combination with balanced fertilization was superior to the fertilization techniques used by local farmers. However, the different fertilization methods did not significantly alter the active-to-inert carbon fraction ratio. Both the combination of organic and inorganic fertilizers and the balanced application of chemical fertilizers increased the stability of soil carbon pools compared to farmers’ fertilizer uses. This had a positive effect on the increase in soil enzyme activity and microbial biomass carbon, nitrogen, and phosphorus. After screening and constructing a structural equation model with 10 soil indicators, we found that microbial biomass nitrogen and phosphorus, soil pH, and NAG had indirect, limiting effects on the CPSI. In contrast, β-G exhibited an indirect positive correlation with the carbon fractions, while DOC, LFOC, and HFOC were directly positively correlated with the CPSI. A high crop yield indicated a high exogenous carbon input, thus contributing to a certain degree of carbon pool stability and, to some extent, a positive effect on the CPSI. Ensuring soil carbon stability should thus involve stabilizing soil pH through fertilization, increasing crop yields, and enhancing the content of SOC fractions and their associated enzyme activities.
In conclusion, our findings indicate that both the balanced application of chemical fertilizers and the combined use of organic and chemical fertilizers contribute to the enhancement and preservation of the SOC content. Moreover, the effectiveness of the combination of organic and chemical fertilizers surpassed that of balanced chemical fertilization alone. Given the challenging environmental conditions of the Loess Plateau, we suggest that farmers incorporate judicious amounts of organic fertilizers while maintaining a balance in the application of nitrogen, phosphorus, and potassium. This approach is crucial for stabilizing soil fertility and ensuring the long-term sustainability of the Loess Plateau ecosystem.
Author Contributions
Conceptualization, T.L. and L.L.; data curation, L.Y.; funding acquisition, T.L.; methodology, T.L. and L.L.; project administration, T.L.; software, L.Y.; supervision, T.L. and L.L.; validation, L.Y., X.H., Z.C. and H.S.; visualization, L.Y.; writing—original draft, L.Y.; writing—review and editing, T.L. and L.L. All authors have read and agreed to the published version of the manuscript.
Funding
This work was supported by the National Natural Science Foundation of China (42377356), the special fund for Science and Technology Innovation Teams of Shanxi Province (202304051001042), the National Key Research and Development Program of China (2021YFD1900700), Doctor Workstation Project of Jinzhong Agri-cultural High-tech Zone (JZNGQBSGZZ002) and Ministerial and Provincial Co-Innovation Centre for Endemic Crops Production with High-quality and Efficiency in Loess Plateau (SBGJXTZX-25).
Data Availability Statement
The data presented in this study are available on request from the corresponding author. The data are not publicly available because the first authors are still conducting their research.
Conflicts of Interest
The authors declare no conflicts of interest.
References
- Batjes, N.H. Total carbon and nitrogen in the soils of the world. Eur. J. Soil Sci. 2014, 65, 10–21. [Google Scholar] [CrossRef]
- Huang, C.; Cheng, C.; Wang, Z.; Zhao, X.; Yang, Y.; Hu, L.; Li, Y.; Ma, J.; Wang, L.; Chang, L.; et al. Straw Strip Mulching Increased Soil Organic Carbon Components of a Wheat Field in Dry Farming Regions of the Loess Plateau. Water 2022, 14, 2645. [Google Scholar] [CrossRef]
- Schimel, J.P.; Schaeffer, S.M. Microbial control over carbon cycling in soil. Front. Microbiol. 2012, 3, 348. [Google Scholar] [CrossRef] [PubMed]
- Keenan, T.; Williams, C.J. The terrestrial carbon sink. Annu. Rev. Environ. Resour. 2018, 43, 219–243. [Google Scholar] [CrossRef]
- Oladele, S.O.; Adetunji, A.T. Agro-residue biochar and N fertilizer addition mitigates CO2-C emission and stabilized soil organic carbon pools in a rain-fed agricultural cropland. Int. Soil Water Conserv. Res. 2021, 9, 76–86. [Google Scholar] [CrossRef]
- Benbi, D.K.; Kiranvir, B.; Sharma, S. Sensitivity of labile soil organic carbon pools to long-term fertilizer, straw and manure management in rice-wheat system. Pedosphere 2015, 25, 534–545. [Google Scholar] [CrossRef]
- Bongiorno, G.; Bünemann, E.K.; Oguejiofor, C.U.; Meier, J.; Gort, G.; Comans, R.; Mäder, P.; Brussaard, L.; de Goede, R. Sensitivity of labile carbon fractions to tillage and organic matter management and their potential as comprehensive soil quality indicators across pedoclimatic conditions in Europe. Ecol. Indic. 2019, 99, 38–50. [Google Scholar] [CrossRef]
- Yagi, K.; Minami, K. Effect of organic matter application on methane emission from some Japanese paddy fields. Soil Sci. Plant Nutr. 1990, 36, 599–610. [Google Scholar] [CrossRef]
- Xiang, H.M.; Wen, D.Z.; Zhang, L.L.; Li, J. Altitudinal changes in active and recalcitrant soil carbon pools of forests in the Dinghu Mountains. Acta Ecol. Sin. 2015, 18, 6089–6099. (In Chinese) [Google Scholar]
- Xu, M.; Lou, Y.; Sun, X.; Wang, W.; Baniyamuddin, M.; Zhao, K. Soil organic carbon active fractions as early indicators for total carbon change under straw incorporation. Biol. Fertil. Soils 2011, 47, 745–752. [Google Scholar] [CrossRef]
- Luo, S.-S.; Luo, B.-Z.; Wei, S.-J.; Hu, H.-Q.; Li, X.-C.; Wu, Z.-P.; Wang, Z.-S.; Zhou, Y.-F.; Zhong, Y.-X. Effects of moderate forest fires on soil organic carbon density in secondary forests of Pinus massoniana. Chin. J. Plant Ecol. 2020, 44, 1073. (In Chinese) [Google Scholar] [CrossRef]
- Miltner, A.; Bombach, P.; Schmidt-Brücken, B.; Kästner, M. SOM genesis: Microbial biomass as a significant source. Biogeochemistry 2012, 111, 41–55. [Google Scholar] [CrossRef]
- Kindler, R.; Miltner, A.; Richnow, H.-H.; Kästner, M. Fate of gram-negative bacterial biomass in soil—Mineralization and contribution to SOM. Soil Biol. Biochem. 2006, 38, 2860–2870. [Google Scholar] [CrossRef]
- Liang, C.; Balser, T.C. Microbial production of recalcitrant organic matter in global soils: Implications for productivity and climate policy. Nat. Rev. Microbiol. 2011, 9, 75. [Google Scholar] [CrossRef] [PubMed]
- Basile-Doelsch, I.; Balesdent, J.; Pellerin, S. Reviews and syntheses: The mechanisms underlying carbon storage in soil. Biogeosciences 2020, 17, 5223–5242. [Google Scholar] [CrossRef]
- Li, Y.; Nie, C.; Liu, Y.; Du, W.; He, P. Soil microbial community composition closely associates with specific enzyme activities and soil carbon chemistry in a long-term nitrogen fertilized grassland. Sci. Total Environ. 2019, 654, 264–274. [Google Scholar] [CrossRef] [PubMed]
- Li, S.X. Dryland Agriculture in China 2007; Science Press: Beijing, China, 2007. (In Chinese) [Google Scholar]
- Tang, K.L. Soil Erosion in China; Science and Technology Press: Beijing, China, 2004; p. 845. (In Chinese) [Google Scholar]
- Gwon, H.S.; Khan, M.I.; Yoon, Y.E.; Lee, Y.B.; Kim, P.J.; Hwang, H.Y. Unexpected higher decomposition of soil organic matter during cold fallow season in temperate rice paddy. Soil Tillage Res. 2019, 192, 250–257. [Google Scholar] [CrossRef]
- Duiker, S.; Lal, R. Crop residue and tillage effects on carbon sequestration in a Luvisol in central Ohio. Soil Tillage Res. 1999, 52, 73–81. [Google Scholar] [CrossRef]
- Chen, H.; Hou, R.; Gong, Y.; Li, H.; Fan, M.; Kuzyakov, Y. Effects of 11 years of conservation tillage on soil organic matter fractions in wheat monoculture in Loess Plateau of China. Soil Tillage Res. 2009, 106, 85–94. [Google Scholar] [CrossRef]
- Lal, R. Soil carbon sequestration impacts on global climate change and food security. Science 2004, 304, 1623–1627. [Google Scholar] [CrossRef]
- Zhao, Y.; Wang, M.; Hu, S.; Zhang, X.; Ouyang, Z.; Zhang, G.; Huang, B.; Zhao, S.; Wu, J.; Xie, D.; et al. Economics-and policy-driven organic carbon input enhancement dominates soil organic carbon accumulation in Chinese croplands. Proc. Natl. Acad. Sci. USA 2018, 115, 4045–4050. [Google Scholar] [CrossRef] [PubMed]
- Benbi, D.K.; Dar, R.A.; Toor, A.S. Improving soil organic carbon and microbial functionality through different rice straw management approaches in rice–wheat cropping sequence. Biomass Convers. Biorefinery 2021, 13, 15659–15669. [Google Scholar] [CrossRef]
- Tian, K.; Zhao, Y.; Xu, X.; Hai, N.; Huang, B.; Deng, W. Effects of long-term fertilization and residue management on soil organic carbon changes in paddy soils of China: A meta-analysis. Agric. Ecosyst. Environ. 2015, 204, 40–50. [Google Scholar] [CrossRef]
- Miao, Y.; Stewart, B.A.; Zhang, F. Long-term experiments for sustainable nutrient management in China. A review. Agron. Sustain. Dev. 2011, 31, 397–414. [Google Scholar] [CrossRef]
- Ninh, H.; Grandy, A.; Wickings, K.; Snapp, S.; Kirk, W.; Hao, J. Organic amendment effects on potato productivity and quality are related to soil microbial activity. Plant Soil 2015, 386, 223–236. [Google Scholar] [CrossRef]
- Wei, W.; Yan, Y.; Cao, J.; Christie, P.; Zhang, F.; Fan, M. Effects of combined application of organic amendments and fertilizers on crop yield and soil organic matter: An integrated analysis of long-term experiments. Agric. Ecosyst. Environ. 2016, 225, 86–92. [Google Scholar] [CrossRef]
- Xia, L.; Lam, S.K.; Yan, X.; Chen, D. How Does Recycling of Livestock Manure in Agroecosystems Affect Crop Productivity, Reactive Nitrogen Losses, and Soil Carbon Balance? Environ. Sci. Technol. 2017, 51, 7450–7457. [Google Scholar] [CrossRef] [PubMed]
- Tang, H.; Xiao, X.; Tang, W.; Li, C.; Wang, K.; Li, W.; Cheng, K.; Pan, X. Long-term effects of NPK fertilizers and organic manures on soil organic carbon and carbon management index under a double-cropping rice system in Southern China. Commun. Soil Sci. Plant Anal. 2018, 49, 1976–1989. [Google Scholar] [CrossRef]
- Tang, H.; Cheng, K.; Shi, L.; Li, C.; Wen, L.; Li, W.; Sun, M.; Sun, G.; Long, Z. Effects of long-term organic matter application on soil carbon accumulation and nitrogen use efficiency in a double-cropping rice field. Environ. Res. 2022, 213, 113700. [Google Scholar] [CrossRef]
- Li, S.; Su, J.; Liu, W.; Lang, X.; Huang, X.; Jia, C.; Tong, Q.; Tang, H. Changes in soil organic carbon and nitrogen stocks in Pinus kesiya var. langbiannesis plantation. For. Res. 2015, 28, 810–817. [Google Scholar]
- Xiaojiao, W. Study on Ecosystem Carbon Balance and Stability of Soil Organic Carbon Pool in Dryland Corn Farmland of the Loess Plateau of Central Gansu Province under Different Fertilization Measures. Ph.D. Thesis, Gansu Agricultural University, Lanzhou, China, 2021. (In Chinese). [Google Scholar]
- Liu, Y.; Qian, X. The Single Season Wheat Straw Returning to Promote the Synergistic Improvement of Carbon Efficiency and Economic Benefit in Wheat-Maize Double Cropping System. Sci. Agric. Sin. 2022, 55, 350–364. (In Chinese) [Google Scholar]
- Bolinder, M.; Angers, D.; Giroux, M.; Laverdiere, M. Estimating C inputs retained as soil organic matter from corn (Zea mays L.). Plant Soil 1999, 215, 85–91. [Google Scholar] [CrossRef]
- Mary, B.; Clivot, H.; Blaszczyk, N.; Labreuche, J.; Ferchaud, F. Soil carbon storage and mineralization rates are affected by carbon inputs rather than physical disturbance: Evidence from a 47-year tillage experiment. Agric. Ecosyst. Environ. 2020, 299, 106972. [Google Scholar] [CrossRef]
- Duong, T.; Baumann, K.; Marschner, P. Frequent addition of wheat straw residues to soil enhances carbon mineralization rate. Soil Biol. Biochem. 2009, 41, 1475–1482. [Google Scholar] [CrossRef]
- Perveen, N.; Barot, S.; Maire, V.; Cotrufo, M.F.; Shahzad, T.; Blagodatskaya, E.; Stewart, C.E.; Ding, W.; Siddiq, M.R.; Dimassi, B.; et al. Universality of priming effect: An analysis using thirty five soils with contrasted properties sampled from five continents. Soil Biol. Biochem. 2019, 134, 162–171. [Google Scholar] [CrossRef]
- Liu, X.-J.A.; Sun, J.; Mau, R.L.; Finley, B.K.; Compson, Z.G.; Van Gestel, N.; Brown, J.R.; Schwartz, E.; Dijkstra, P.; Hungate, B.A. Labile carbon input determines the direction and magnitude of the priming effect. Appl. Soil Ecol. 2017, 109, 7–13. [Google Scholar] [CrossRef]
- Fang, Y.; Nazaries, L.; Singh, B.K.; Singh, B.P. Microbial mechanisms of carbon priming effects revealed during the interaction of crop residue and nutrient inputs in contrasting soils. Glob. Chang. Biol. 2018, 24, 2775–2790. [Google Scholar] [CrossRef]
- Shahzad, T.; Anwar, F.; Hussain, S.; Mahmood, F.; Arif, M.S.; Sahar, A.; Nawaz, M.F.; Perveen, N.; Sanaullah, M.; Rehman, K.; et al. Carbon dynamics in surface and deep soil in response to increasing litter addition rates in an agro-ecosystem. Geoderma 2019, 333, 1–9. [Google Scholar] [CrossRef]
- Fontaine, S.; Bardoux, G.; Abbadie, L.; Mariotti, A. Carbon input to soil may decrease soil carbon content. Ecol. Lett. 2004, 7, 314–320. [Google Scholar] [CrossRef]
- Na, Z.; Xiao-li, W.; Jin, H.; Sheng-mei, Y.; Qin-wen, Z.; Ming-rui, L. Effects of Replacing Chemical Nitrogen Fertilizer with Organic Fertilizer on Active OrganicCarbon Fractions, Enzyme Activities, and Crop Yield in Yellow Soil. Environ. Sci. 2023, 1–21. (In Chinese) [Google Scholar] [CrossRef]
- Kalambukattu, J.G.; Singh, R.; Patra, A.K.; Arunkumar, K. Soil carbon pools and carbon management index under different land use systems in the Central Himalayan region. Acta Agric. Scand. Sect. B—Soil Plant Sci. 2013, 63, 200–205. [Google Scholar] [CrossRef]
- Blair, G.J.; Lefroy, R.D.; Lisle, L. Soil carbon fractions based on their degree of oxidation, and the development of a carbon management index for agricultural systems. Aust. J. Agric. Res. 1995, 46, 1459–1466. [Google Scholar] [CrossRef]
- Zhang, A.; Zheng, Z.X.; Zhao, Z.Y.; Feng, T.Y.; Zheng, W.; Zhai, B.N. Effects of Long-term Combined Application of Organic and lnorganic Fertilizers on Soil CarbonPool and Greenhouse Gas Emissions in Orchards. Environ. Sci. 2023, 44, 5823–5831. [Google Scholar]
- Ghosh, S.; Wilson, B.; Ghoshal, S.; Senapati, N.; Mandal, B. Organic amendments influence soil quality and carbon sequestration in the Indo-Gangetic plains of India. Agric. Ecosyst. Environ. 2012, 156, 134–141. [Google Scholar] [CrossRef]
- Wu, Y.; Dong, W.; Li, X.; Gu, Z.; Liu, Z.; Deng, S.; Wei, S.; Li, L.; Wang, C.; Yang, T. Research progress on the response of soil enzyme activity to changes in soil environment. South China Agric. 2023, 17, 42–46+52. (In Chinese) [Google Scholar]
- Jiang, Y.; Liang, W.J.; Wen, D. Effects of No-Tillage on Soil Biological Properties in Farmlands: A Review. Chin. J. Soil Sci. 2004, 35, 347–351. (In Chinese) [Google Scholar]
- Liu, S.J.; Xia, X.; Chen, G.M.; Mao, D.; Che, S.G.; Li, Y.X. Study Progress on Functions and Affecting Factors of Soil Enzymes. Chin. Agric. Sci. Bull. 2011, 27, 1–7. (In Chinese) [Google Scholar]
- Qi, R.; Li, J.; Lin, Z.; Li, Z.; Li, Y.; Yang, X.; Zhang, J.; Zhao, B. Temperature effects on soil organic carbon, soil labile organic carbon fractions, and soil enzyme activities under long-term fertilization regimes. Appl. Soil Ecol. 2016, 102, 36–45. [Google Scholar] [CrossRef]
- Li, H.R.; Zhu, Y.; Tian, J.H.; Wei, K.; Chen, Z.H.; Chen, L.J. Effects of carbon and nitrogen additions on soil organic C, N, P contents and their catalyzed enzyme activities in a grassland. Chin. J. Appl. Ecol. 2018, 29, 2470–2476. (In Chinese) [Google Scholar]
- Zheng, L.; Chen, H.; Wang, Y.; Mao, Q.; Zheng, M.; Su, Y.; Xiao, K.; Wang, K.; Li, D. Responses of soil microbial resource limitation to multiple fertilization strategies. Soil Tillage Res. 2020, 196, 104474. [Google Scholar] [CrossRef]
- Zhu, Z.; Bai, Y.; Lv, M.; Tian, G.; Zhang, X.; Li, L.; Jiang, Y.; Ge, S. Soil fertility, microbial biomass, and microbial functional diversity responses to four years fertilization in an apple orchard in North China. Hortic. Plant J. 2020, 6, 223–230. [Google Scholar] [CrossRef]
- Kumar, U.; Shahid, M.; Tripathi, R.; Mohanty, S.; Kumar, A.; Bhattacharyya, P.; Lal, B.; Gautam, P.; Raja, R.; Panda, B.B.; et al. Variation of functional diversity of soil microbial community in sub-humid tropical rice-rice cropping system under long-term organic and inorganic fertilization. Ecol. Indic. 2017, 73, 536–543. [Google Scholar] [CrossRef]
- Li, X.; Zhao, B.; Li, X.; Li, Y.; Sun, R.; Zhu, L.; Xu, J.; Wang, L.; Li, X.; Zhang, F. Effects of Different Fertilization Systems on Soil Microbe and Its Relation to Soil Fertility. Sci. Agric. Sin. 2005, 38, 1591–1599. (In Chinese) [Google Scholar]
- Kamble, P.N.; Bååth, E. Induced N-limitation of bacterial growth in soil: Effect of carbon loading and N status in soil. Soil Biol. Biochem. 2014, 74, 11–20. [Google Scholar] [CrossRef]
- Stark, S.; Männistö, M.K.; Eskelinen, A. Nutrient availability and pH jointly constrain microbial extracellular enzyme activities in nutrient-poor tundra soils. Plant Soil 2014, 383, 373–385. [Google Scholar] [CrossRef]
- Zhang, Y.; Hong, M.; Wen, X.; Pei, Z.; Zhao, H.; Chen, C.; Wen, X. Effect of Different Organic Amendments on Soil Organic Carbon Pool and Chemical Properties in Soda Alkaline Soil. J. Soil Water Conserv. 2022, 36, 311–318. (In Chinese) [Google Scholar]
- Li, C.Y.; Wang, Y.; Brookes, P.; Dang, T.H.; Wang, W.Z. Effect of Soil pH on Soil Microbial Carbon Phosphorus Ratio. Sci. Agric. Sin. 2013, 46, 2709–2716. [Google Scholar]
- Li, C.; Hao, Y.; Xue, Y.; Wang, Y.; Dang, Y. Effects of long-term fertilization on soil microbial biomass carbon, nitrogen, and phosphorus in the farmland of the Loess Plateau, China. J. Agro-Environ. Sci. 2020, 39, 1783–1791. (In Chinese) [Google Scholar]
- Cao, H.; Xie, J.; Ciren, Q.; Guo, L.; Hong, J.; Jing, Y.; Meng, H. Effects of fertilization regimes on carbon and nitrogen contents of aggregates and maize yield in reclaimed soils. Trans. Chin. Soc. Agric. Eng. 2020, 36, 135–143. [Google Scholar]
Figure 1.
Average monthly rainfall from 2013 to 2023.

Figure 2.
(a) Ten-year cumulative carbon inputs per treatment. (b) Relationship between treatment FP year-to-year carbon inputs and soil organic carbon. (c) Relationship between treatment OF year-to-year carbon inputs and soil organic carbon. (d) Relationship between treatment OFM year-to-year carbon inputs and soil organic carbon. (e) Relationship between treatment OFB year-to-year carbon inputs and soil organic carbon.
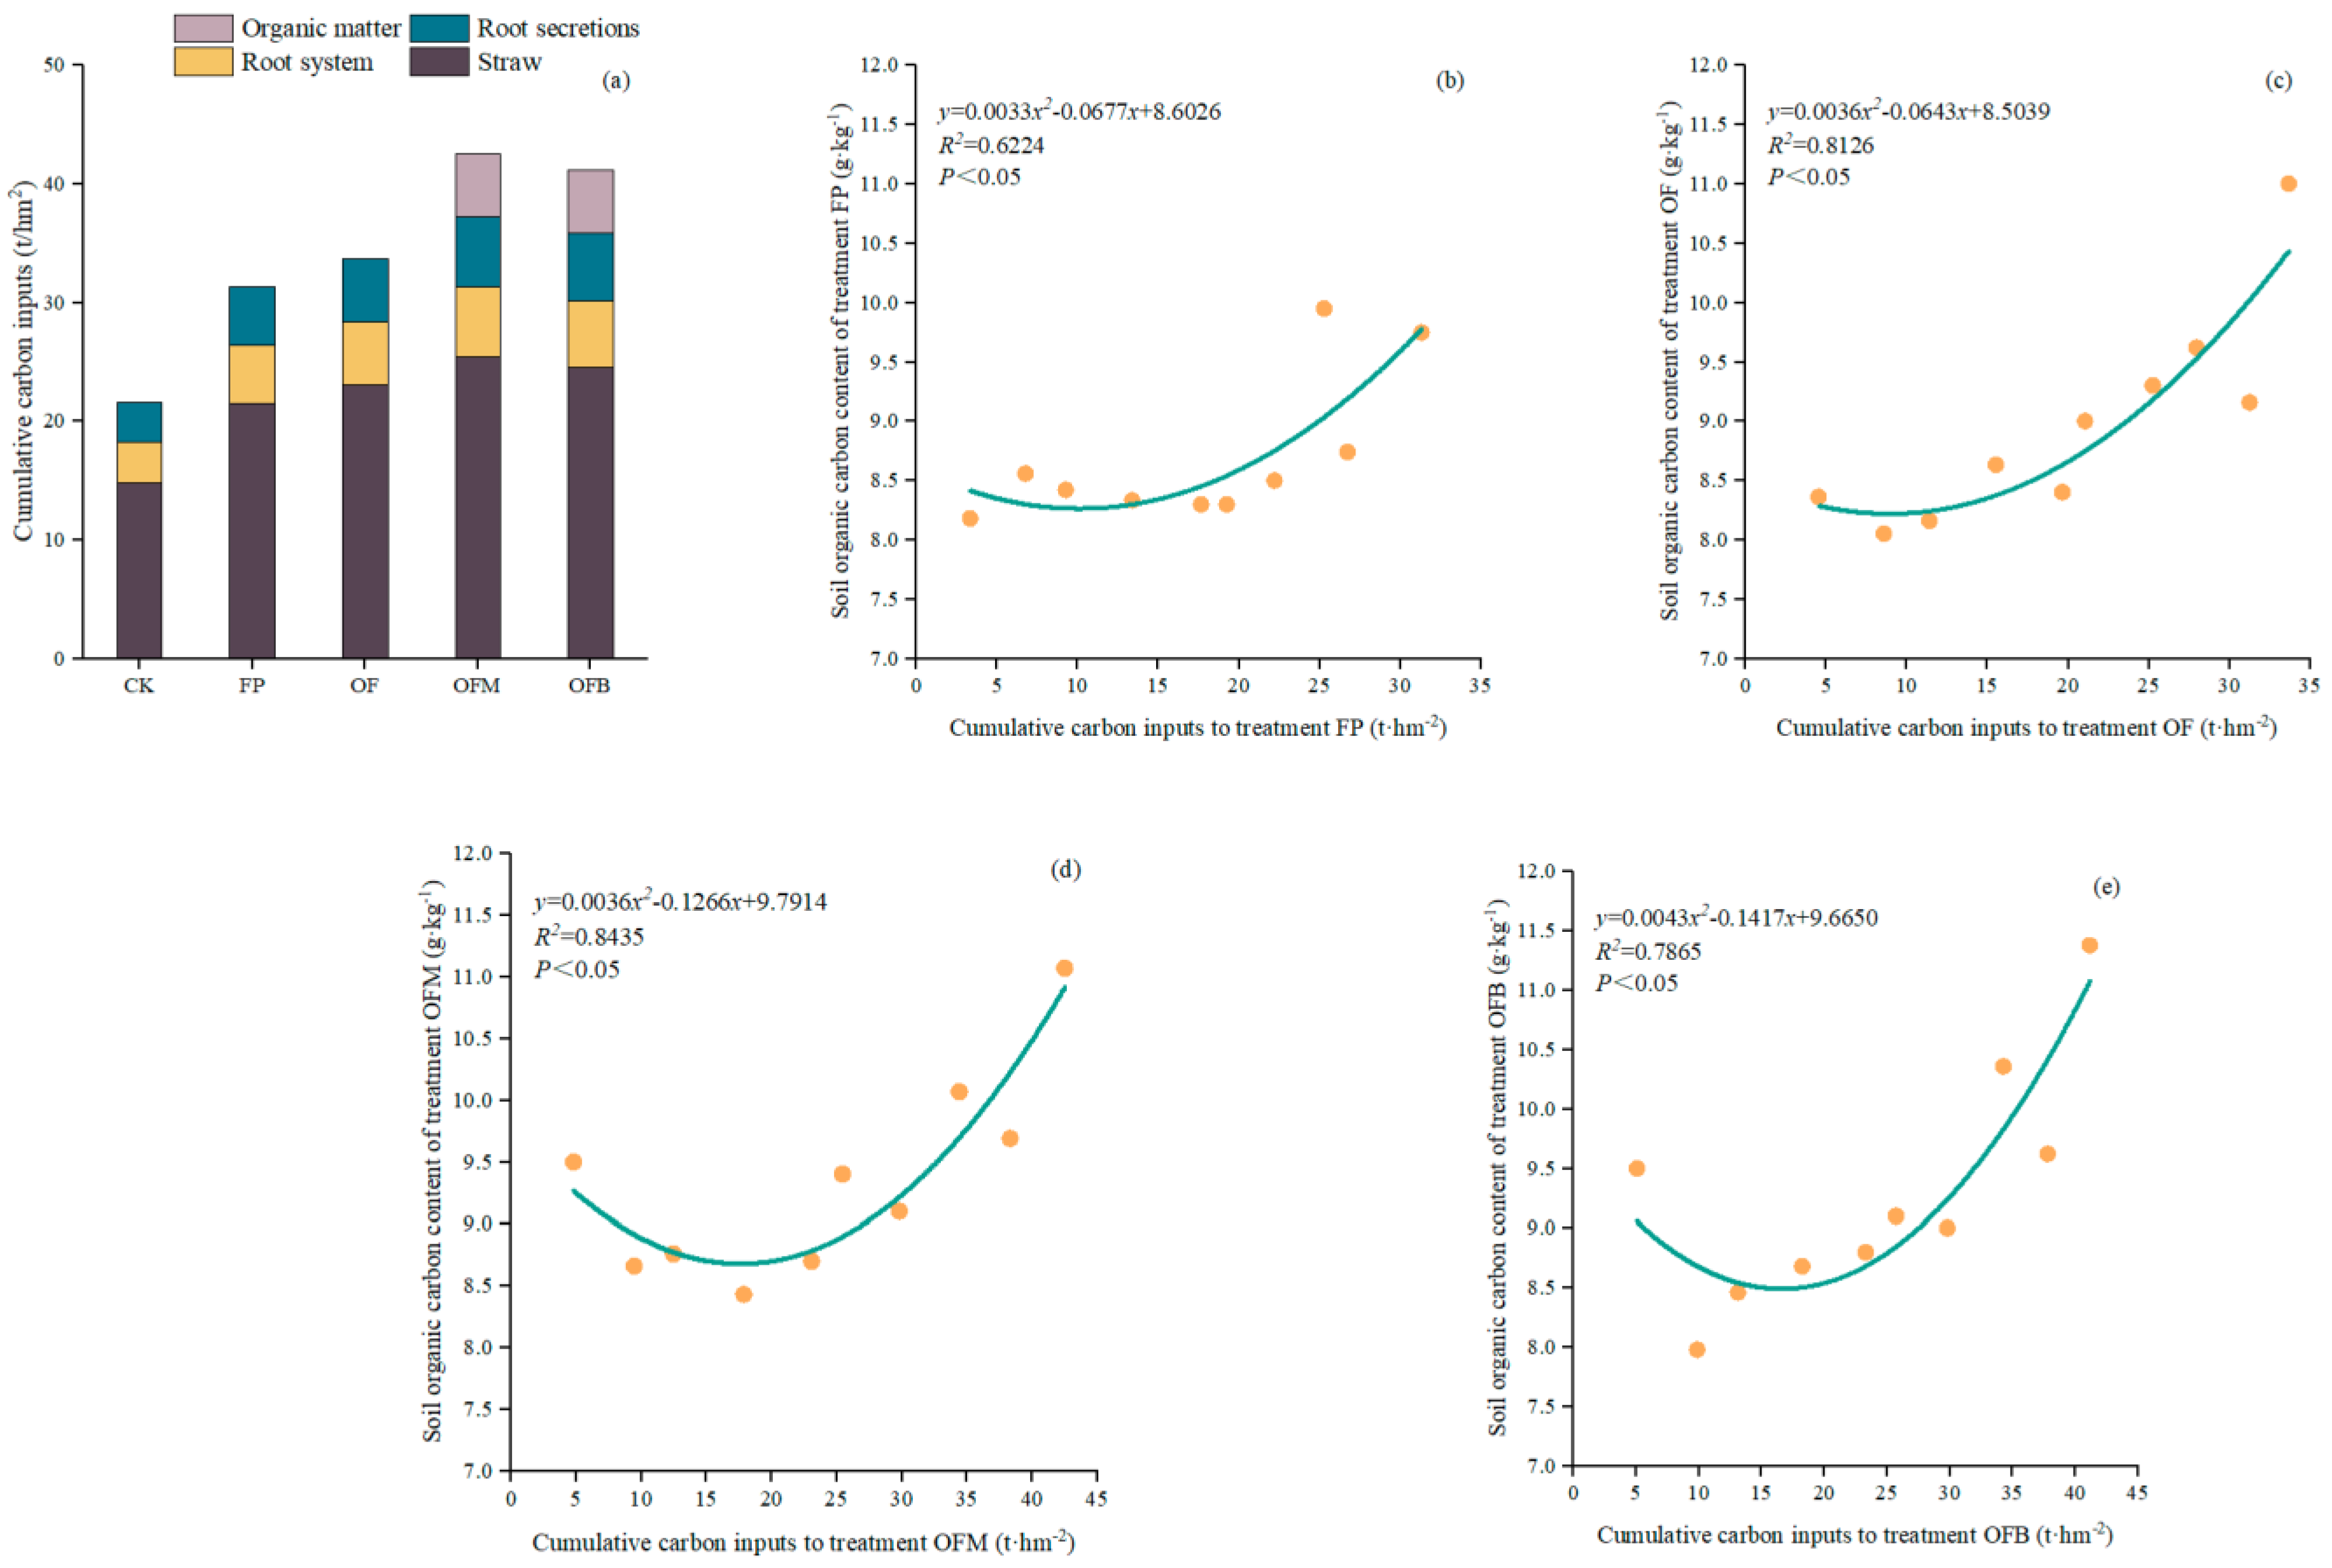
Figure 3.
(a) Content of soil carbon fractions under different fertilization treatments. (b) Proportion of soil carbon fractions under different fertilization treatments. Error bars represent the standard deviations from the mean (n = 3), and different lowercase letters indicate significant differences between different treatments (p < 0.05).
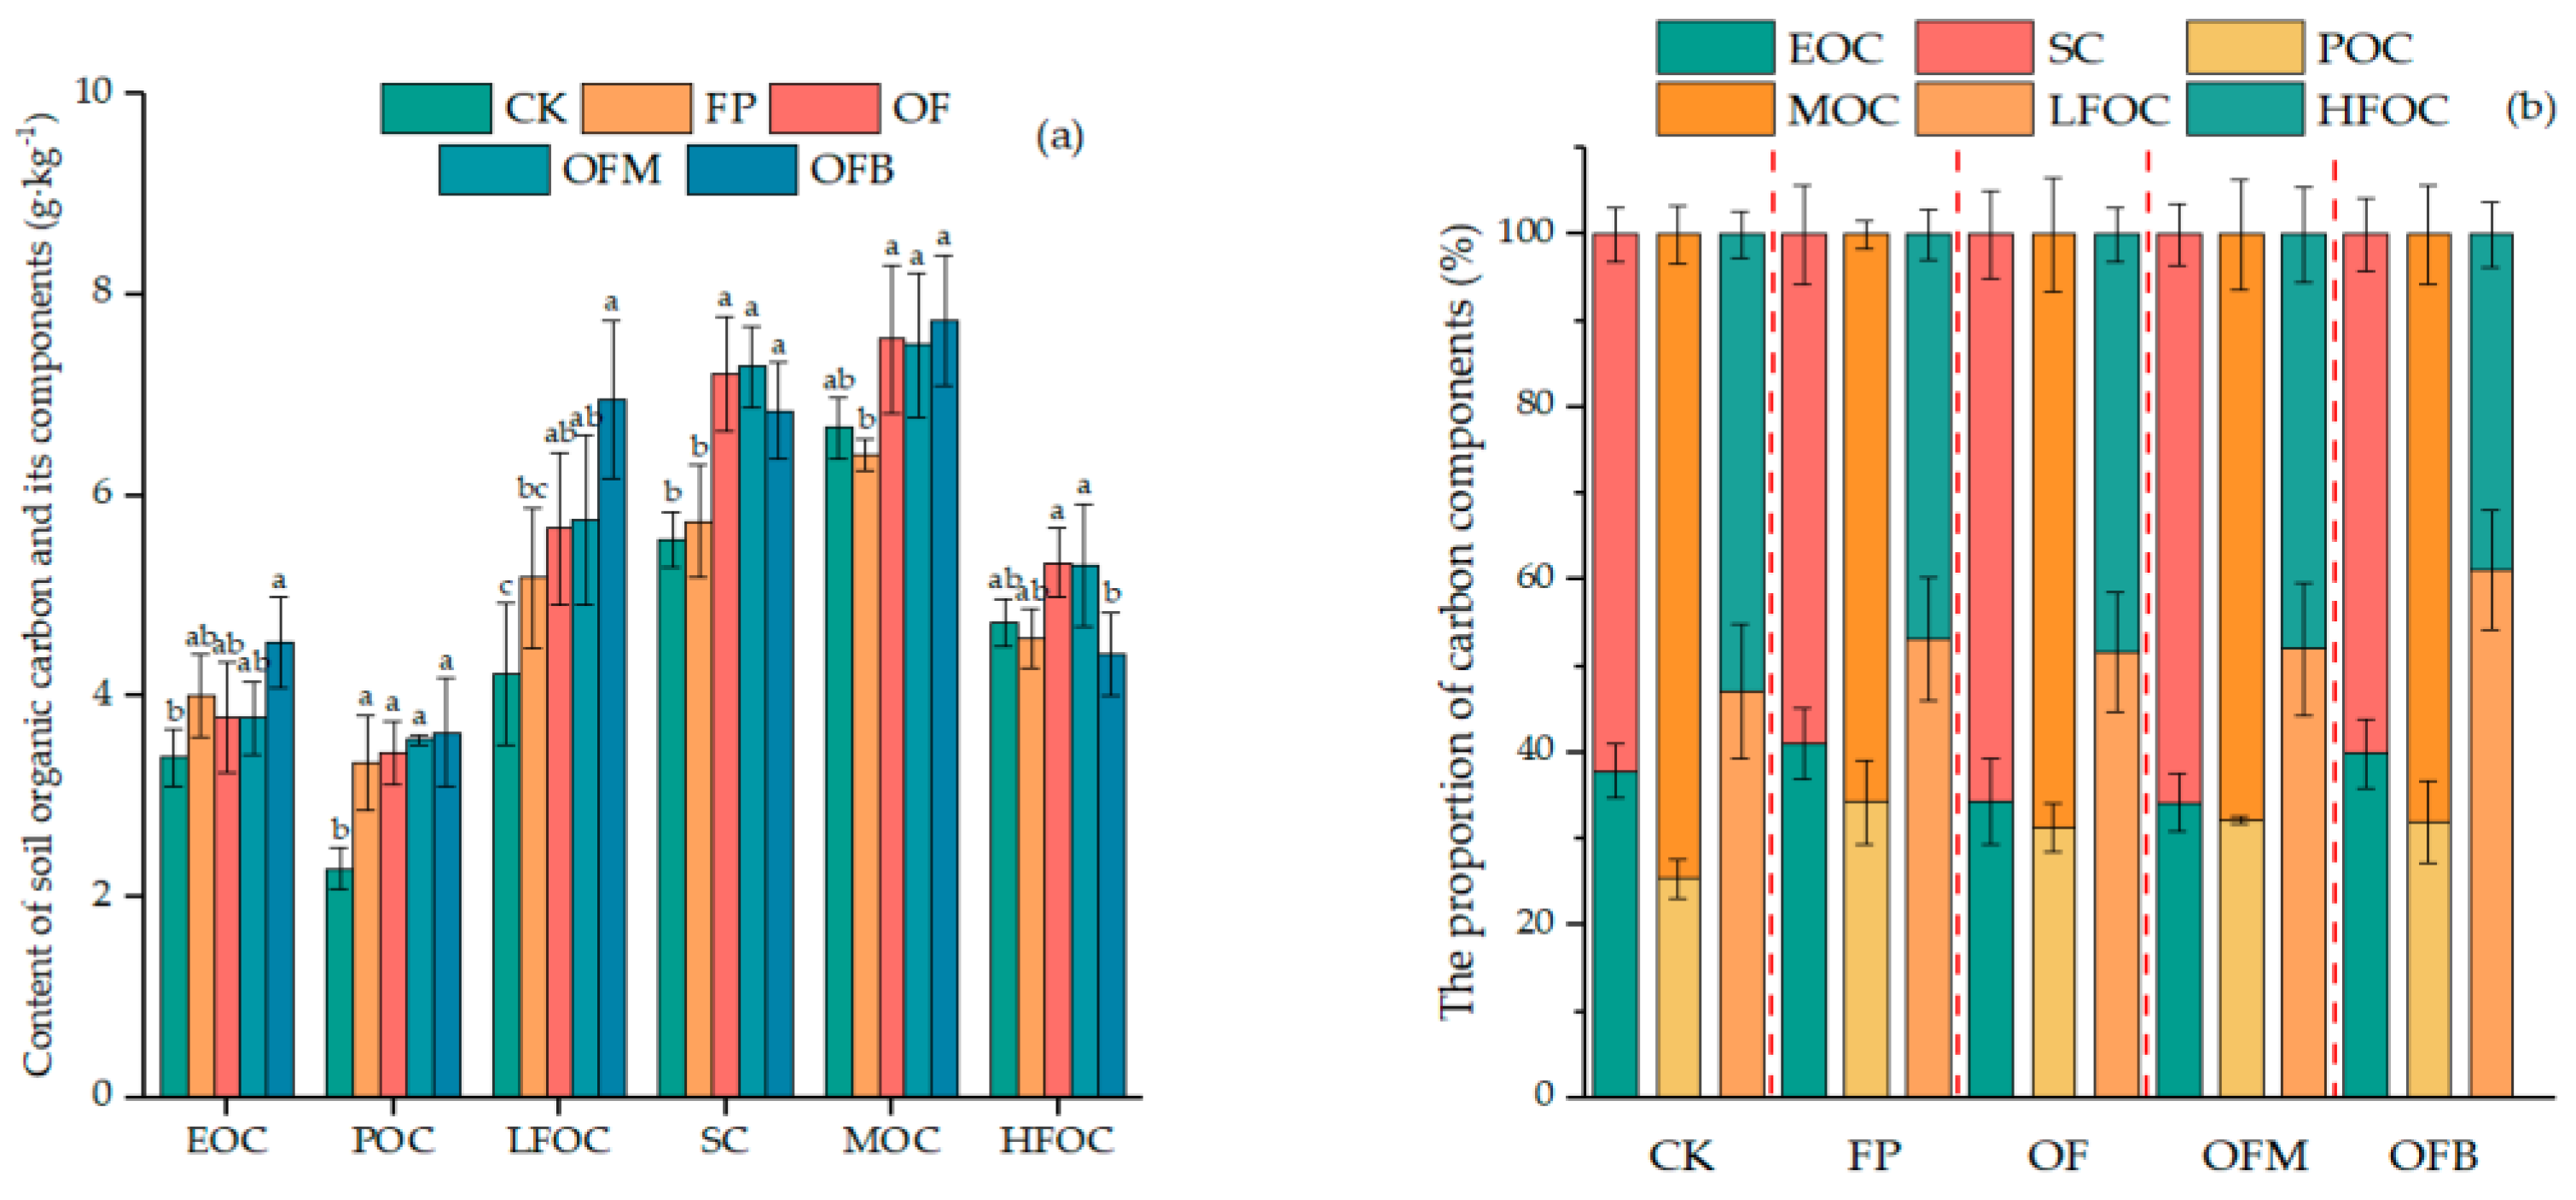
Figure 4.
(a) Content of β-1,4-glucosidase (β-G) and β-1,4-N-acetylaminoglucosidase (NAG) under different fertilization treatments. (b) Content of microbial biomass carbon (MBC), microbial biomass phosphorus (MBP), and microbial biomass nitrogen (MBN) under different fertilization treatments. Error bars represent the standard deviations from the mean (n = 3), and different lowercase letters indicate significant differences between different treatments (p < 0.05).
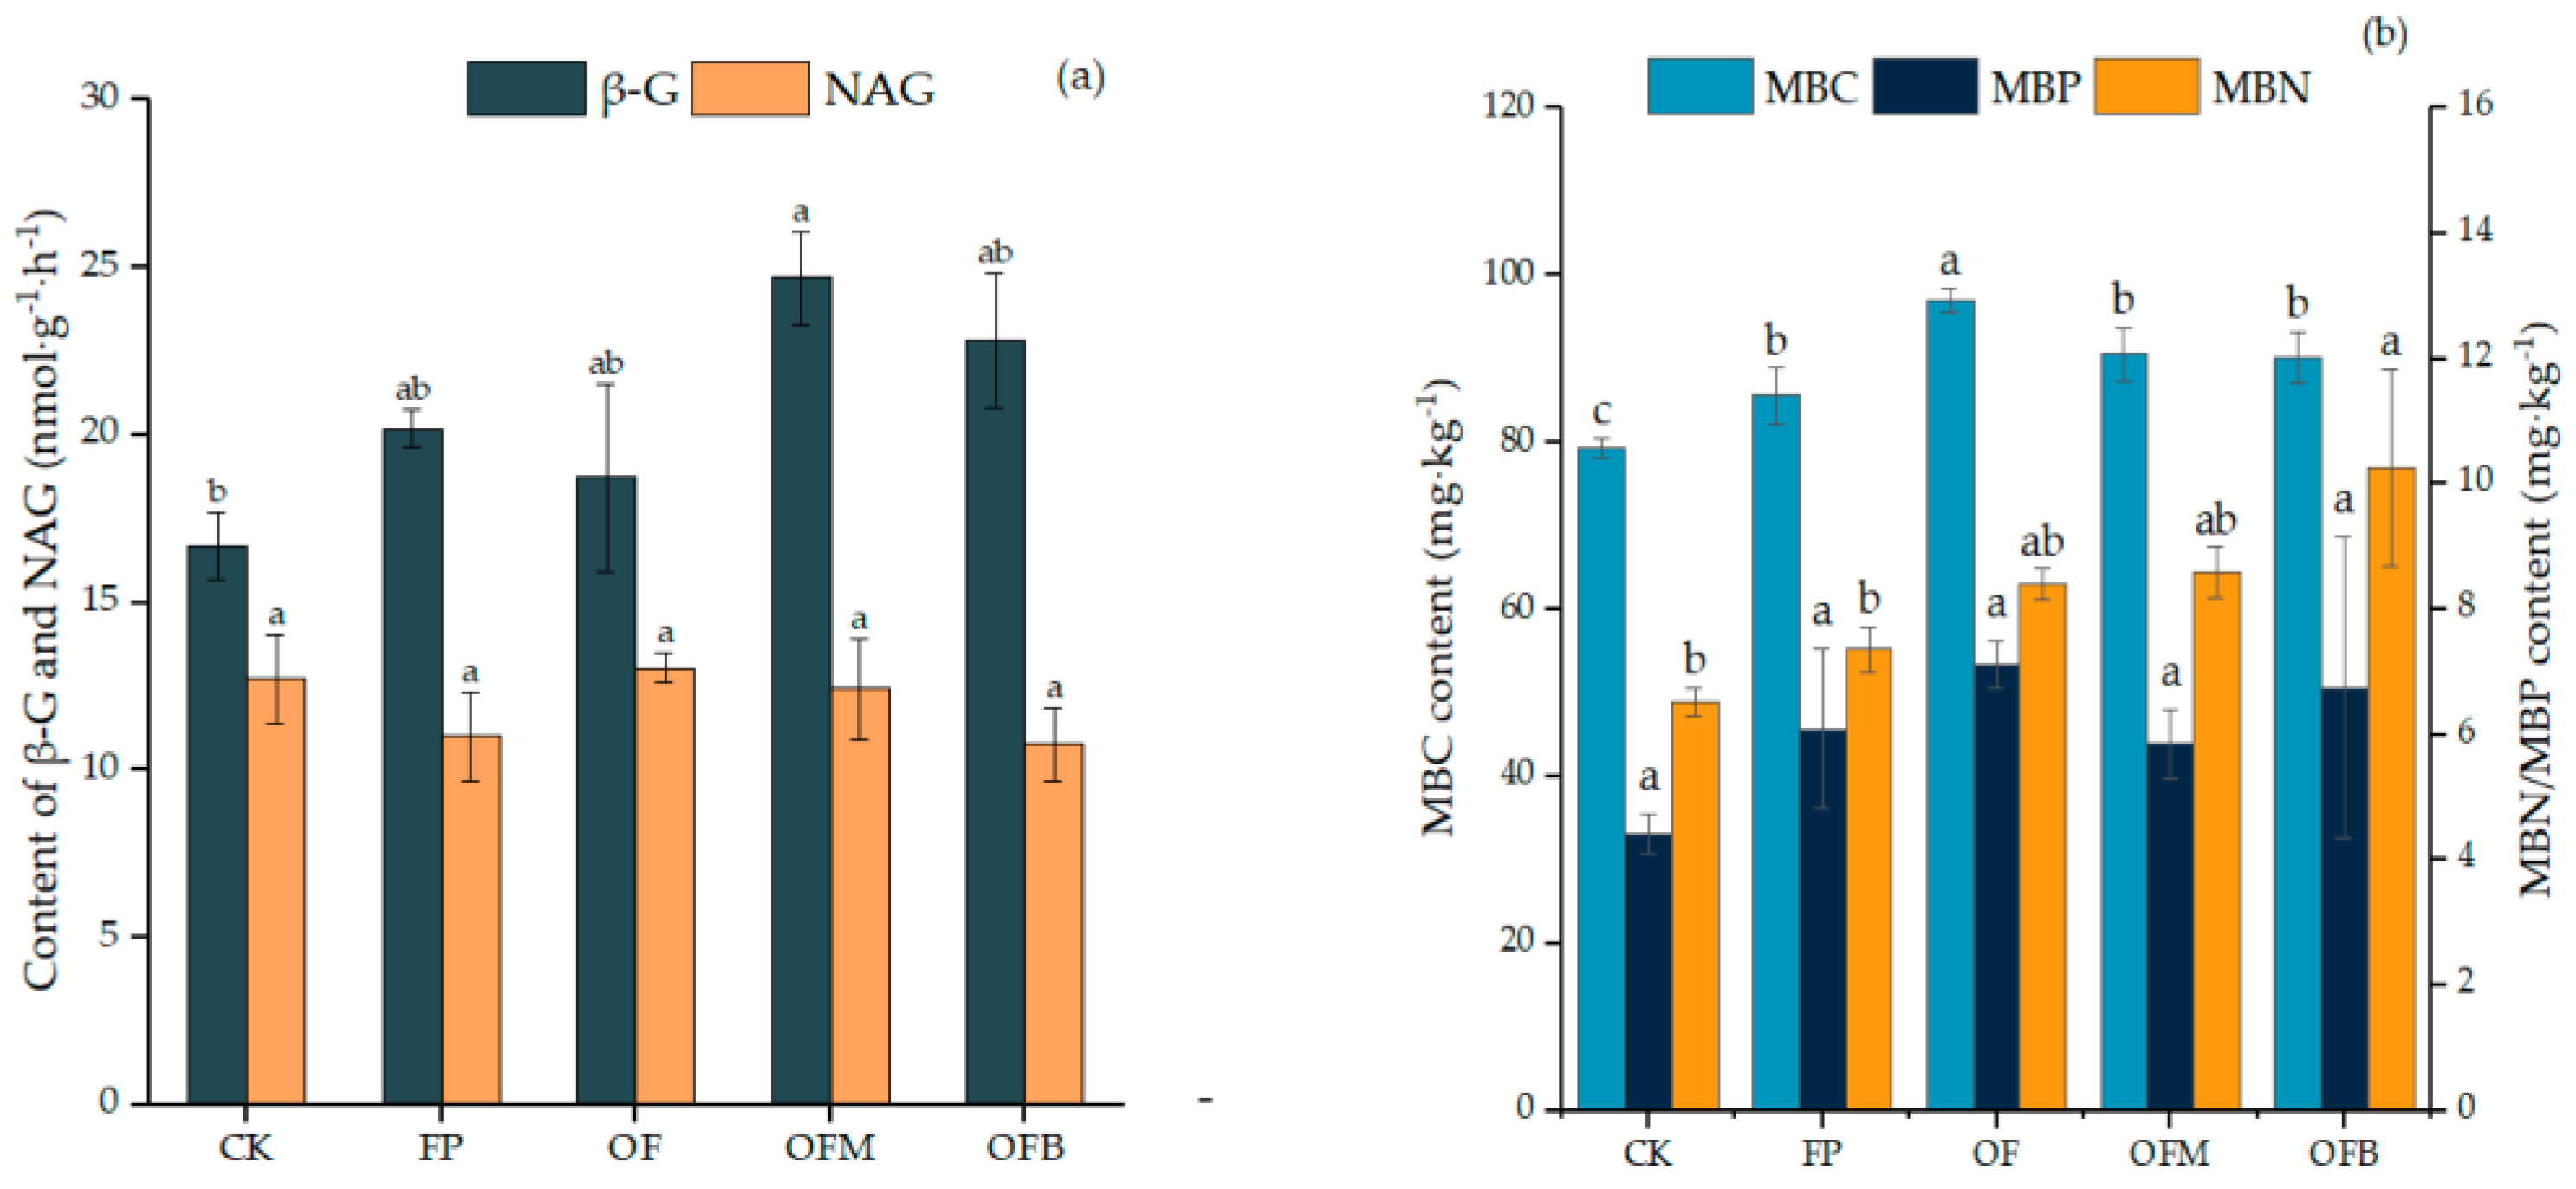
Figure 5.
(a) Soil pH, β-1,4-glucosidase (β-G), β-1,4-N-acetylaminoglucosidase (NAG), microbial biomass nitrogen (MBN), microbial biomass phosphorus (MBP), wheat grain yield (GY), soil soluble organic carbon (DOC), soil light-family organic carbon (LFOC), soil recombinant organic carbon (HFOC), and soil fast-acting potassium (SAK) are used as independent variables and carbon pool stability index (CPSI) as dependent variable for structural equation modeling (red arrow indicates positive correlation, and blue colored arrow indicates negative correlation; for instance, when A points to B, it signifies that A has an impact on B). (b) The standardized overall effect values, direct effect values, and indirect effect values of some indicators (χ2/df = 1.017; CFI = 0.988; RMSEA = 0.040; significant level: *** p < 0.001; ** p < 0.01; * p < 0.05).


Table 1.
Cumulative fertilizer application for each treatment.
| Treatment | Cumulative Fertilizer Application (kg·hm−2) | Cumulative Organic Fertilizer Application (kg·hm−2) | ||
|---|---|---|---|---|
| N | P | K | ||
| CK | 0 | 0 | 0 | 0 |
| FP | 1500.0 | 261.0 | 0.0 | 0.0 |
| OF | 899.3 | 284.6 | 236.1 | 0.0 |
| OFM | 567.8 | 158.6 | 32.0 | 19,991 |
| OFB | 567.8 | 158.6 | 32.0 | 19,991 |
Table 2.
p-values and means of these metrics in SEM.
| MBN (mg·kg−1) | SAK (mg·kg−1) | MBP (mg·kg−1) | Dissolved Organic Carbon (g·kg−1) | LFOC (g·kg−1) | |
|---|---|---|---|---|---|
| p | 0.0002 | 0.0009 | 0.0002 | 0.0006 | 0.0002 |
| Mean | 8.129 | 169.6 | 6.352 | 0.182 | 5.892 |
| HFOC (g·kg−1) | β-G (nmol·g−1·h−1) | NAG (nmol·g−1·h−1) | Soil pH | GY (exp (kg·hm−2)) | |
| p | 0.0003 | 0.0013 | 0.0001 | 0.0002 | 0.0002 |
| Mean | 4.909 | 20.729 | 10.813 | 7.748 | 8.104 |
Significance level: p < 0.05.
Table 3.
Effect of different fertilization measures on the soil carbon pool index.
| A | AI | CPI | CPMI | CPSI | |
|---|---|---|---|---|---|
| CK | 0.609 ab | 1.000 ab | 1.000 b | 100.000 a | 2.938 a |
| FP | 0.704 a | 1.158 a | 1.092 b | 126.454 a | 1.939 b |
| OF | 0.529 ab | 0.873 b | 1.231 a | 107.466 a | 2.219 b |
| OFM | 0.499 b | 0.829 b | 1.342 a | 111.252 a | 2.102 b |
| OFB | 0.609 ab | 0.992 ab | 1.121 a | 111.203 a | 2.172 b |
Different lowercase letters indicate significant differences between different treatments (p < 0.05).
Disclaimer/Publisher’s Note: The statements, opinions and data contained in all publications are solely those of the individual author(s) and contributor(s) and not of MDPI and/or the editor(s). MDPI and/or the editor(s) disclaim responsibility for any injury to people or property resulting from any ideas, methods, instructions or products referred to in the content. |
© 2023 by the authors. Licensee MDPI, Basel, Switzerland. This article is an open access article distributed under the terms and conditions of the Creative Commons Attribution (CC BY) license (https://creativecommons.org/licenses/by/4.0/).
Share and Cite
MDPI and ACS Style
Yang, L.; Hu, X.; Chang, Z.; Song, H.; Li, T.; Li, L. The Effects of Various Long-Term Fertilizer Applications on Soil Carbon Fractions in a Winter Wheat Monoculture Area. Agronomy 2024, 14, 82. https://doi.org/10.3390/agronomy14010082
AMA Style
Yang L, Hu X, Chang Z, Song H, Li T, Li L. The Effects of Various Long-Term Fertilizer Applications on Soil Carbon Fractions in a Winter Wheat Monoculture Area. Agronomy. 2024; 14(1):82. https://doi.org/10.3390/agronomy14010082
Chicago/Turabian StyleYang, Lifan, Xuan Hu, Zixuan Chang, Hongmei Song, Tingliang Li, and Li Li. 2024. "The Effects of Various Long-Term Fertilizer Applications on Soil Carbon Fractions in a Winter Wheat Monoculture Area" Agronomy 14, no. 1: 82. https://doi.org/10.3390/agronomy14010082
Note that from the first issue of 2016, this journal uses article numbers instead of page numbers. See further details here.