
TeaViTNet: Tea Disease and Pest Detection Model Based on Fused Multiscale Attention


1
College of Information Science and Technology, Nanjing Forestry University, Nanjing 210037, China
2
College of Information Management, Nanjing Agricultural University, Nanjing 210037, China
*
Author to whom correspondence should be addressed.
Agronomy 2024, 14(3), 633; https://doi.org/10.3390/agronomy14030633
Submission received: 21 February 2024
/
Revised: 16 March 2024
/
Accepted: 18 March 2024
/
Published: 21 March 2024
(This article belongs to the Section Precision and Digital Agriculture)
Abstract
:The tea industry, as one of the most globally important agricultural products, is characterized by pests and diseases that pose a serious threat to yield and quality. These diseases and pests often present different scales and morphologies, and some pest and disease target sizes can be tiny and difficult to detect. To solve these problems, we propose TeaViTNet, a multi-scale attention-based tea pest and disease detection model that combines CNNs and Transformers. First, MobileViT is used as the feature extraction backbone network. MobileViT captures and analyzes the tiny pest and disease features in the image via a self-attention mechanism and global feature extraction. Second, the EMA-PANet network is introduced to optimize the model’s learning and attention to the Apolygus lucorum and leaf blight regions via an efficient multi-scale attention module with cross-space learning, which improves the model’s ability to understand multi-scale information. In addition, RFBNet is embedded in the module to further expand the perceptual range and effectively capture the information of tiny features in tea leaf images. Finally, the ODCSPLayer convolutional block is introduced, aiming to focus on acquiring richer gradient flow information. The experimental results show that the TeaViTNet model proposed in this paper has an average accuracy of 89.1%, which is a significant improvement over the baseline network MobileViT and is capable of accurately detecting Apolygus lucorum and leaf blight of different scales and complexities.
1. Introduction
Tea, a beverage steeped in rich cultural heritage and history, assumes a pivotal global role. Its significance within agriculture and the economy is unequivocal. However, the planting and growing process of tea is frequently threatened by various diseases and pests, which seriously affect the quality and yield of tea and pose a serious challenge to the sustainable development of the tea industry. According to statistics, China’s tea gardens have recorded over 100 types of tea diseases, including tea anthracnose, tea white star disease, tea cake disease, and leaf blight, which may trigger the premature shedding of tea tree leaves and drying up of branches, directly weakening the growth momentum of tea trees, thus leading to a significant reduction in tea production. Meanwhile, more than 400 species of tea tree pests have been recognized, such as tea geometrid, little green leafhopper, tea aphid, and Apolygus lucorum. These pests can seriously damage the leaves and shoots of tea trees, leading to a drastic decline in tea quality and even problems such as mottling and deformation, which seriously affect the appearance and taste characteristics of tea. In the case of severe pests and diseases, the tea plantation may have a large area of dieback, and even young tea trees are not immune to suffering from the condition of total plant dieback. Therefore, research on how to accurately detect and recognize tea pests and diseases is essential to reduce tea production losses and increase the income of tea farmers.
Currently, the identification of pests and diseases in tea cultivation primarily relies on manual detection [1]. This traditional method typically requires agricultural experts or staff to inspect tea gardens in the field and visually observe the growth of tea trees or collect samples to detect and identify tea diseases and pests. However, this approach is time-consuming and labor-intensive. It is highly influenced by the level of experience and expertise of the detector, which may introduce subjectivity and uncertainty. Manual testing has been effective in identifying diseases and pests in tea gardens. However, it has limitations in efficiently covering a wide range of tea gardens, especially those planted on a large scale. Additionally, manual testing cannot meet the demand for timely and accurate detection. Therefore, the development of the current tea industry urgently requires more efficient and accurate automated or semi-automated identification methods.
With the continuous development of computer technology, image processing and machine learning techniques play an increasingly important role in agriculture, especially in identifying and detecting crop pests and diseases. These techniques are particularly useful in identifying and detecting crop pests and diseases, providing new tools and methods to respond to these problems more quickly and accurately. Selim Hossain et al. [2] proposed a system based on image processing and support vector machine classifiers to identify and classify brown wilt and phytophthora, which improves the efficiency of early identification and treatment of diseases. Zhao et al. [3] proposed a multistep approach based on hyperspectral imaging and continuous wavelet analysis (CWA), which successfully distinguished tea leaves under the influence of different stresses and provided a feasible way to analyze the characteristics of plant pests and diseases after infection. Sun et al. [4] proposed a new algorithm that combines Simple Linear Iterative Cluster (SLIC) with Support Vector Machine (SVM) to achieve the high-quality extraction of leaf disease maps of tea trees in a complex background. Billah et al. [5] were able to accurately identify images of tea leaves affected by pests and diseases by extracting colored wavelet features of the images and combining them with the type of disease. Somnath Mukhopadhyay et al. [6] proposed a new method for automatic detection of tea diseases based on image processing techniques, which employs a non-dominated sequential genetic algorithm (NSGA-II) based on image clustering to locate the diseased regions in the tea leaves and uses Principal Component Analysis (PCA) and multi-class SVM for feature approximation and disease identification. However, the recognition of tea pests and diseases based on image processing and machine learning requires the manual extraction of many pest and disease features, and the manually extracted features may not be able to capture the full picture of the pests and diseases.
With the continuous development of deep learning technology, it has shown great application potential in several fields. Its applications have been extended to IoT security detection, management of traffic congestion problems at urban intersections [7], supply chain management procurement, inventory control, Wi-Fi channel state information to recognize human activities [8], tomato identification and localization [9], real-time detection of crop pests and diseases [10,11,12], forest fire smoke detection to optimize the efficiency of agricultural operations, classification of sonar images [13], and effects of electromagnetic hydrodynamics on nano-viscous fluid flow [14]. These studies not only highlight the promise of deep learning techniques in various fields but also demonstrate the value of their wide range of applications in the agricultural industry. Therefore, research based on deep learning techniques is increasingly focusing on the detection of tea pests and diseases.
Deep learning, with its powerful ability to process complex image data with convolutional neural networks (CNNs), offers researchers the opportunity to explore more accurate and efficient pest detection methods, opening new possibilities for crop protection and sustainable agricultural production. Lin et al. [15] proposed an improved tea disease detection model of TSBA-YOLO, which utilizes techniques such as self-attention, feature fusion networks, and transfer learning to improve the model’s ability to acquire global information, multi-scale feature fusion, and small target recognition for tea diseases, significantly improving the detection accuracy and reaching real-time detection. Xue et al. [16] proposed an improved model named YOLO-Tea, based on the YOLOv5 architecture, which incorporates self-attention, convolutional block-attention module, sensory wild blocks, and global contextual networks to improve the performance of recognizing tea leaf pests and diseases. Wang et al. [17] processed the results based on the weakly supervised model of YOLOv5, the Global Attention Mechanism (GAM), and Convolutional Block Attention Module (CBAM) attention mechanisms and combined them with the weighted box fusion (WBF) algorithm. This integrated model achieved an average accuracy of 79.3% in complex environments, which is an improvement of 8.7% and 9.6%, respectively, compared to a single model, indicating that it possesses a more accurate pest and disease identification capability in tea garden environments.
Hu et al. [18] processed leaf blight (TLB) images using the Retinex algorithm, which facilitated the analysis of disease severity by using a more efficient region-based convolutional neural network for TLB detection and a trained VGG16 network for TLB severity grading. Wang et al. [19] proposed a learning framework based on supervised data clustering, which was able to accurately and simultaneously obtain 2D top views of trees with high accuracy in terms of canopy color, shape, and overlap by using pixel-level classifiers and supervised clustering methods. Zhang et al. [20] introduced an information entropy masked visual transform (IEM-ViT) model using the information entropy weighting (IEW) method with a masked autoencoder (MAE) combined with an asymmetric encoder-decoder architecture, which is able to quickly recognize seven types of tea diseases with 93.78% accuracy. Compared with common image recognition algorithms such as ResNet18, VGG16, and VGG19, the recognition accuracy is improved by nearly 20%. Bao et al. [21] proposed an uncrewed remote sensing method based on DDMA-YOLO, which is able to efficiently detect and monitor tea leaf blight (TLB). Using ultra-high-resolution image reconstruction and Retinex image enhancement, combined with the DDMA-YOLO model, improved the detection accuracy. These research results focus on the rapid progress and broad application prospects of CNNs in the field of tea pests and disease recognition.
However, although the above algorithms can realize pest detection, the models are not able to recognize small-sized or dense pests well, while the above methods make it difficult to achieve a good balance between detection accuracy and real-time performance.
CNNs cannot fully capture the global information of leaves when processing tea pest and disease images, especially for small-sized or densely diseased parts. Local feature extraction is the focus of CNNs, which may not be able to express these features adequately for dense or small-sized infestations. Some of the tiny or dense tea pests and diseases may be distorted or ignored in the processing due to the size problem, thus affecting the accuracy of recognition. In addition, CNNs have limitations in feature fusion for diseases of different scales, morphologies, and complexities, making it difficult to effectively integrate global and local information. The Transformer, via the self-attention mechanism, can better understand the contextual information of the target object, capture long-range dependencies, and obtain global information, thus improving the accuracy of detection. Therefore, many researchers have proposed the strategy of combining CNNs with Transformers to achieve the goal of exploiting the local feature extraction capability of CNNs and combining the advantages of Transformers in modeling global information.
Li et al. [22] proposed a lightweight Transformer model named PMVT, which is improved based on MobileViT and is used for plant disease recognition. The model has a small number of parameters and computational effort and is suitable for plant disease identification on mobile devices. Hu et al. [23] proposed a tomato pest and disease detection method based on improved YOLOv5n and proposed the use of EfficientViT to replace the backbone network, which maintains high accuracy with low computational and memory costs. These studies have achieved significant results in improving the accuracy of pest and disease detection.
Hence, this paper proposes a detection model, TeaVitNet, which combines a lightweight CNN with Vision Transformer [24]; TeaVitNet is a lightweight, generalized, responsive, as well as more friendly, network model for mobile. The model consists of the input, backbone, neck, and head. First, the Transformer module is integrated into the backbone network, which enables the CNN to capture local information and acquire global information with the help of the Transformer at the same time to improve the understanding of complex pests and diseases. Secondly, for the multi-scale and resolution pests and diseases in tea leaf images, Feature Pyramid Network (FPN) [25] and Path Aggregation Network (PAN) [26] are introduced into the neck to improve the model’s ability to learn multi-scale features and better adapt to different sizes and shapes of pests and diseases in the complex environment of tea leaves, which enhances the accuracy and robustness of the detection of pests and diseases in tea leaves. In addition, a receptive field module is embedded in the neck to capture local and global features in tea leaf images more comprehensively, which helps to recognize complex minute features on the leaves. Subsequently, to enhance the focus on different features, the model introduces the Efficient Multiscale Attention Module EMA [27] attention mechanism to enhance the extraction of important features in tea leaf pest and disease regions. Meanwhile, the ODCSPLayer structure is used in the neck layer to obtain richer gradient flow information while maintaining lightweight. Finally, this paper employs a series of data augmentation strategies to improve the generalization ability and robustness of the model.
2. Materials and Methods
2.1. Tea Pests and Diseases Dataset
In this study, we conducted detailed field research on Maoshan Tea Factory in Jurong City, Jiangsu Province, China, in which the staff of the tea factory pointed out that leaf blight and Apolygus lucorum are two common challenges in tea growth. Of note, leaf blight is a disease, while Apolygus lucorum is an insect pest. These hazards have significant adverse effects on the quality of tea, so this paper takes these two pests and diseases as the research object.
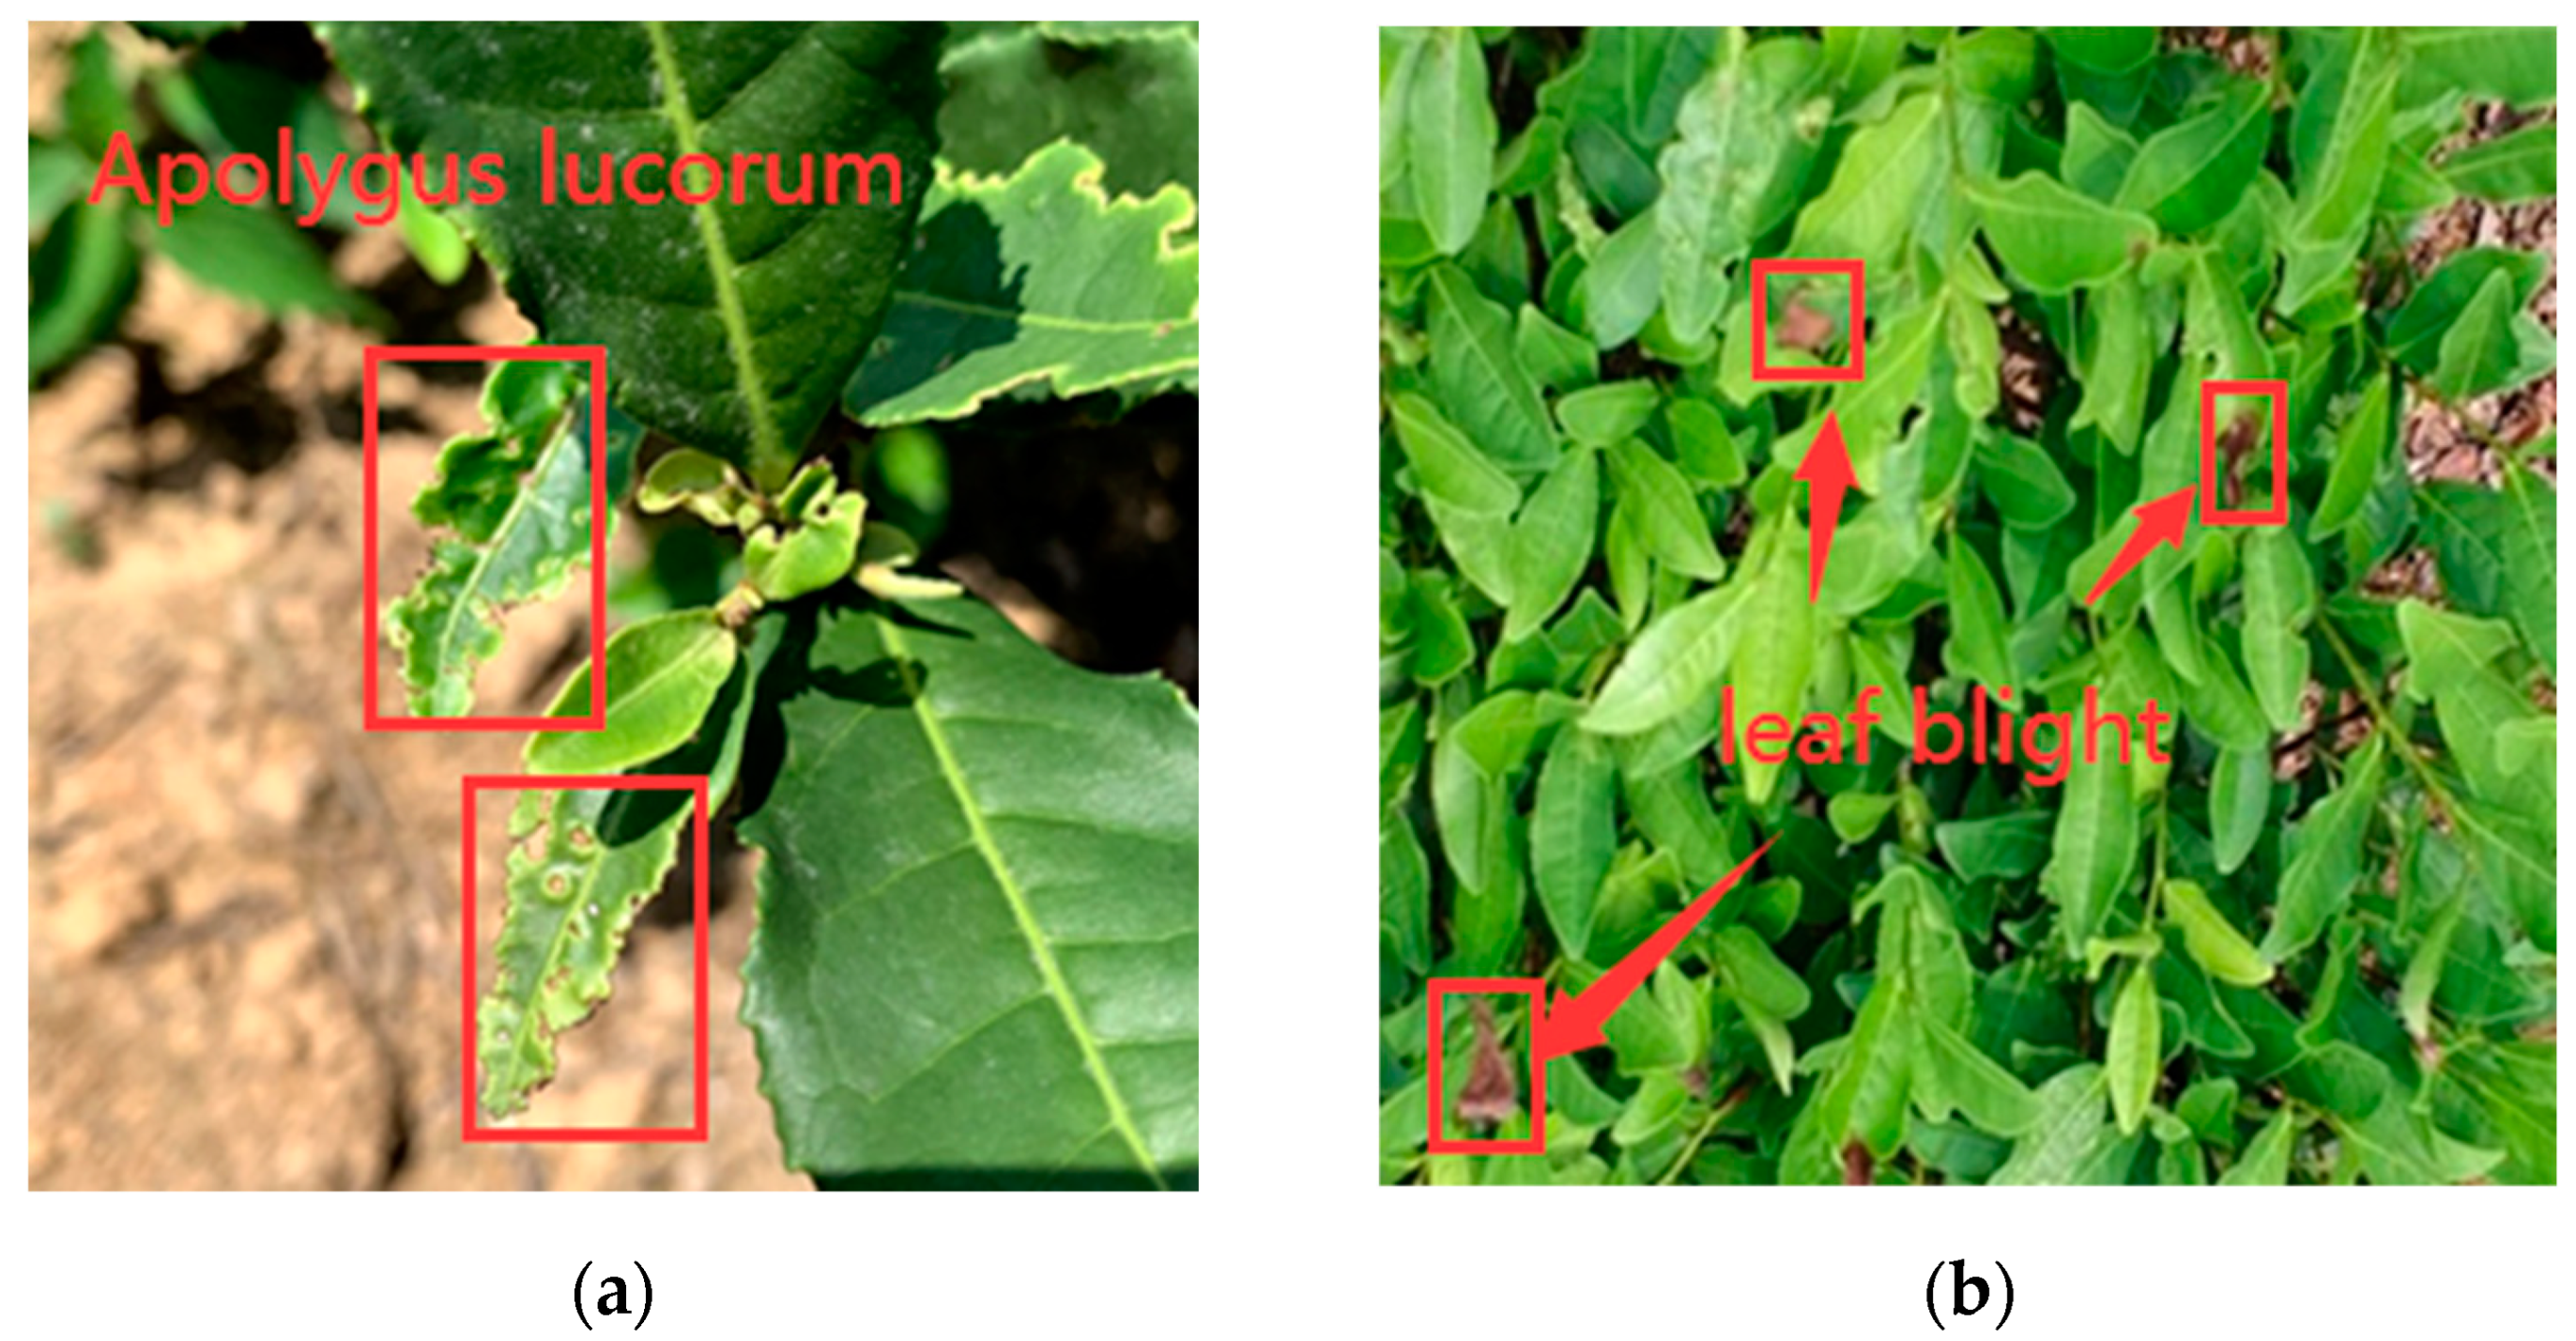
In this study, we used both a DJI Mavic 3T drone and a cell phone to collect images of tea pests and diseases. The drone collected images of tea trees at a height of 2 m to ensure the clarity and detail of the images. In this way, we collected drone images with a resolution of 1920 × 1080, while we also used a smartphone for image collection from a ground perspective. The smartphone has an image resolution of 3024 × 4032, which provides a higher resolution image that helps to capture more detailed pest and disease characteristics. By combining these two approaches, we screened 450 high-quality images of tea pests and diseases. These images cover pest and disease conditions from different viewpoints from the air and ground, providing a rich and diverse dataset for our study. A representative sample of these tea pests and diseases is shown in Figure 1a,b.
Figure 1a shows Apolygus lucorum, which usually feed on the young leaves of tea trees and live by sucking the plant sap by stinging, especially in the early stage of tea tree growth. Their sucking action may lead to deformation, yellowing, and deflation of tea tree leaves. In Figure 1b, symptoms of leaf blight usually appear as brown spots of varying sizes and irregular shapes on the leaves of tea trees, which may gradually spread with the development of the disease and lead to yellowing and wilting of the leaves in severe cases, or even cause the leaves to fall off.
2.2. Data Augmentation
The sample size of the dataset obtained above is small, which is not enough to support the effective training and evaluation of deep learning models. To solve the problem of a small sample size, this paper uses three image enhancement methods based on random rotation, brightness adjustment, and adding noise. Random rotation can increase the sample diversity, simulate the same sample taken from different angles, and allow the model to learn that the features of pests and diseases can still be recognized even from different viewpoints. Brightness adjustments can simulate the actual lighting variations, improve the accuracy of the model in real applications, and enhance the feature saliency at the same time. Adding noise improves the robustness of the model, making it more resistant to noise and less dependent on clean data. These enhancement methods aim to generate more diverse image samples, thus improving the robustness and accuracy of the model in different scenes. Specific data augmentation examples are shown in Figure 2.
The dataset after data augmentation contains 2100 images. We used the annotation software: LabelImg 1.8.6 [28] to annotate the expanded dataset, in which the number of labels of Apolygus lucorum and leaf blight in the pre-expansion dataset was 1583 and 1962, and the number of labels of Apolygus lucorum and leaf blight in the post-expansion dataset was 9629 and 13,260. The distribution of labeled data is shown in Table 1. In the experimental phase, we divided the dataset into training and validation sets according to the ratio of 8:2. The information on the number of images and labels in the training and validation sets is shown in Table 2.
2.3. TeaVitNet
In this paper, we propose a detection model, TeaVitNet, which combines CNNs with Transformers. The model network structure diagram is shown in Figure 3 and consists of an input, backbone, neck, and head.
- (1)
- Backbone: MobileViT [29] is used as the feature extraction network of the model; the network module inherits the advantages of lightweight CNNs with fewer numbers of parameters and less computation and adopts a visual Transformer based on the mechanism of multi-head self-attention to encode the global information to construct a lightweight feature extraction network, which can sufficiently extract the information of the local and global samples, and generate the feature maps of different scales to the neck network.
- (2)
- Neck: Multiscale attention EMA-PANet [27] is used as a neck feature fusion network; EMA-PANet has three feature fusion branches and a fusion feature enhancement module. An efficient multi-scale attention mechanism is added to the output nodes of the network to effectively capture cross-dimensional interactions and establish inter-dimensional dependencies, and the fusion of multi-scale contextual information makes the network pay more attention to useful information. Its network structure mainly consists of RFBNet [30], ODCSPLayer [31], and EMA [27].
- (3)
- Head: The feature maps generated by the neck are used to predict target bounding boxes, category probabilities, and confidence levels for the bounding boxes. Multiple bounding boxes are predicted for each anchor location, while the network also predicts the category probability and object confidence of the targets contained within each bounding box.
2.4. MobileViT: Lightweight Feature Extraction Network
In tea pest and disease identification, models need to be run on mobile or edge devices. These devices usually have limited resources and require models that are lightweight and of high performance. MobileViT [29] is designed to achieve lightweight but high performance visual recognition and processing on mobile devices. Traditional Vision Transformer models (ViT) usually have many parameters, which makes it difficult to achieve efficient computation in resource-limited environments such as mobile devices. For this reason, MobileViT synthesizes the advantages of Vision Transformer (ViT) and the design concepts of lightweight CNN models to reduce the number of parameters and the computational complexity of the model to adapt to the computational and storage resource limitations of mobile devices. Therefore, MobileViT is used as the feature extraction backbone network of the model in this paper. Table 3 lists the parameters of the MobileViT network structure in this paper.
MobileViT is mainly composed of the MV2 [32] module and MobileViT block; Figure 3 illustrates the backbone network structure in this paper. The MobileViT block of the backbone network elicits three feature maps, denoted C1, C2, and C3. MV2 is a linear bottleneck inverted residual block proposed in MobileNetV2; its structure is shown in Figure 4; the MV2 module realizes feature expansion, depth separable convolution [33], and compression via the bottleneck block, combined with the inverted residual connection, which makes the inputs and outputs add up directly, and promotes the direct transfer of information. The reduced number of parameters and computational load makes the model more suitable for running in resource-constrained environments such as mobile devices.
The MobileViT block consists of three main components: a local information coding module, a global information coding module and a feature fusion module, and its structure is shown in Figure 5.
- (1)
- Local information coding module
For a given input feature vector , an standard convolution is first used to capture the local spatial information, and then a 1 × 1 linear combination of the learned input channels is used to generate the output tensor , which projects the tensor to a higher-dimensional space.
- (2)
- Global information coding module
In order to enable MobileViT to acquire global information, the authors expand the output tensor after local information encoding into non-overlapping flat blocks , where , is the number of flat blocks, and h and w are the height and width of each flat block, respectively. The relationship between each flat block is then encoded by the Transformer to obtain .
- (3)
- Feature fusion module
For obtained by the global information coding module, it is collapsed into , and then is projected into the low C-dimensional space by 1 × 1 convolution and combined with by tandem operation. The convolution is then used to fuse these connected features, resulting in an output tensor of . Since uses convolution to encode local information in the region, and encodes global information for the position of the flat block, each pixel in can encode information from all pixels in . The output tensor is the same as that in . Therefore, the overall effective perceptual field of MobileViT is .
The local information coding module adopts a CNN-like structure for down sampling operations in the network, specializing in local features of the image, aiming at capturing the details and local texture information of the image. The global information encoding module acts as a Transformer encoder for MobileViT and is responsible for encoding the whole image by introducing the Transformer architecture to help the model understand the overall semantic information of the image. The feature fusion module, on the other hand, is responsible for organically combining the features extracted from the local and global information encoding modules, aiming to produce a more representational image representation. These three key modules work together to form the core of the MobileViT model. Its strength lies in the fact that by processing both local and global information and fusing them effectively, the model can efficiently process visual tasks on resource-constrained devices.
2.5. ODCSPLayer
ODConv [31] is a dynamic convolutional method designed to dynamically adjust the convolutional kernel based on the features of the input data to better capture the correlation and spatial structure among objects. It introduces four types of dynamic convolution kernel attention, namely spatial, channel, filter, and kernel attention, for adjusting the weights of convolution kernels in different dimensions. Using a parallel attention strategy, each convolutional layer applies all four types of attention simultaneously, ensuring that all spatial locations, channels, filters, and kernels have different effects on each input sample. This mechanism of dynamically adjusting the convolutional kernels enhances the feature representation capability of the network, making it more adaptable to different input data distributions and task requirements, thus improving target capture and task performance.
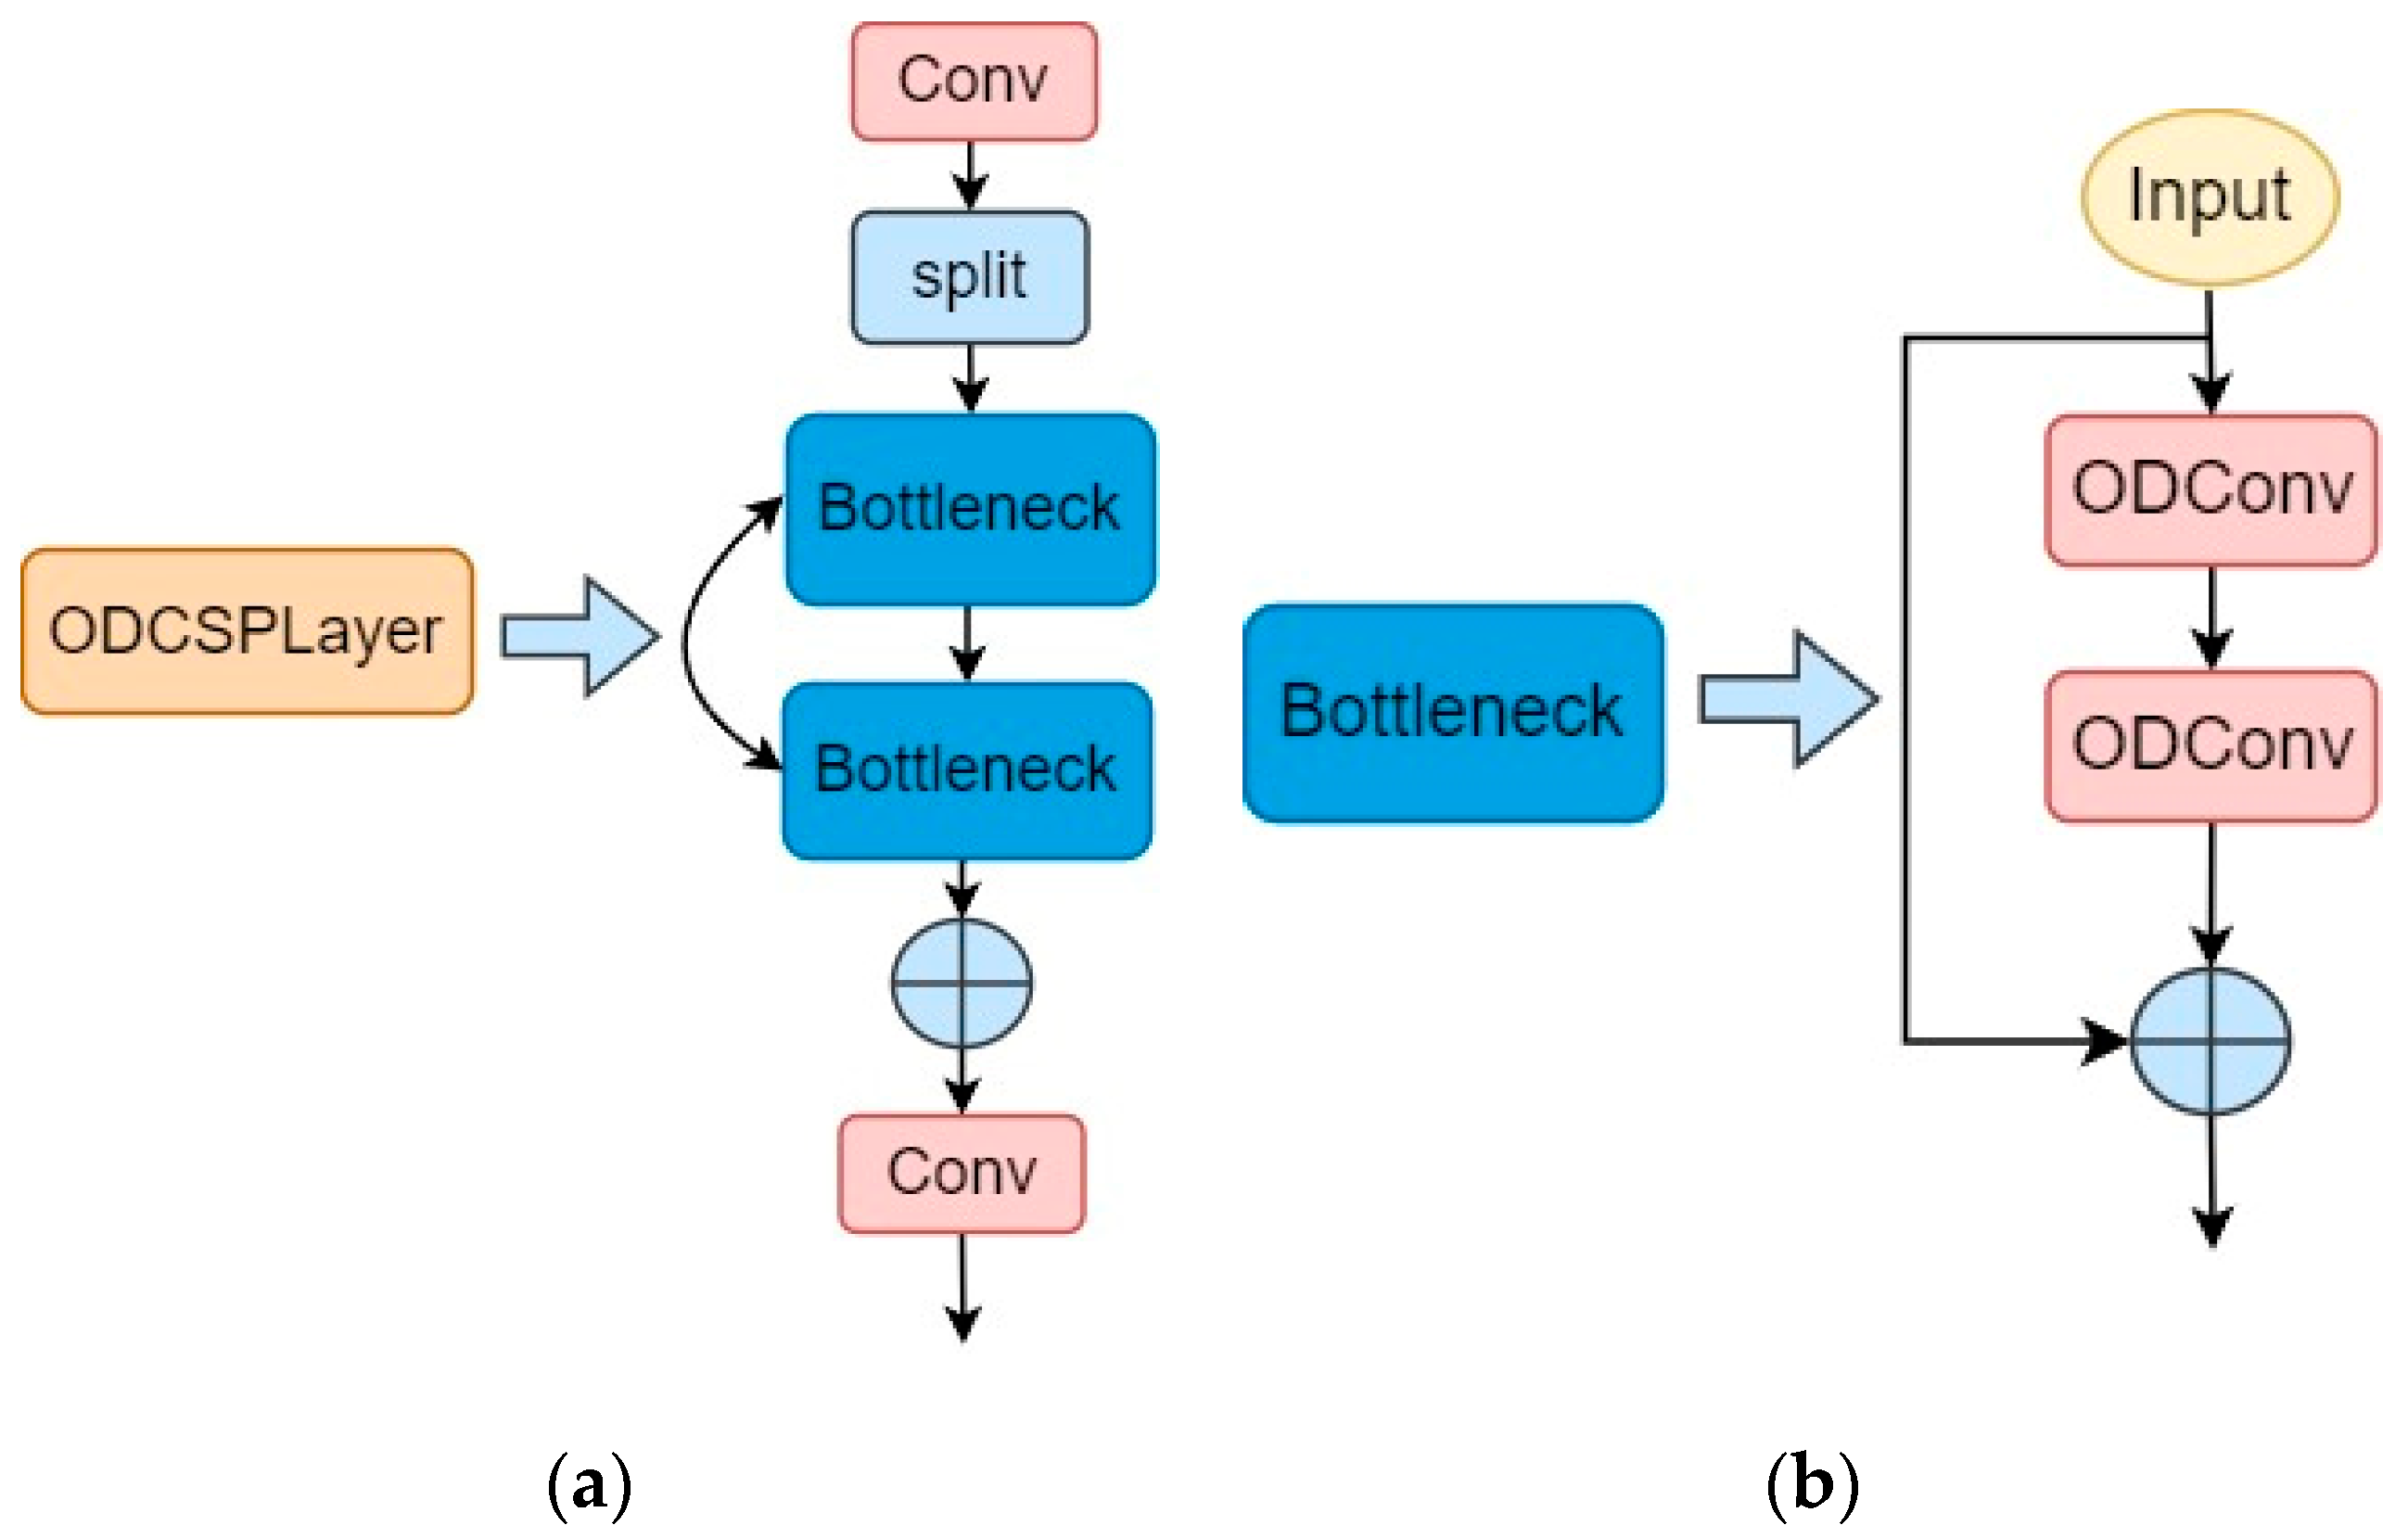
In this paper, we introduce the ODCSPLayer module in EMA-PANet to address the challenges in the task of tea pests and disease detection. The ODCSPLayer module aims to obtain richer information about the gradient flow and further reduce the number of parameters in the model. Its design is inspired by the residual linkage structure in ResNet and the design concept of ELAN [34], and combines the features of ODConv, which can dynamically adjust the convolution kernel to capture the correlation and spatial structure between objects better. The structure of the bottleneck is shown in Figure 6b, which includes a 1 × 1 convolutional layer for feature map dimensionality reduction, a full dimensional dynamic convolutional layer ODConv, a 1 × 1 convolutional layer for dimensionality upgrading, and a residual join. In the residual join, the input features are added to the output features that have been downscaled by convolution and then upscaled by convolution, thus preserving important information and effectively reducing the number of parameters. This design allows the ODCSPLayer module to obtain richer information about the gradient flow while keeping the model lightweight.
2.6. Multiscale Attention EMA-PANet
Due to the presence of different sizes of Apolygus lucorum and leaf blight in tea pest and disease images, to effectively capture multi-scale features in the images and fuse global and local information, this paper adopts EMA-PANet as the neck network of the model. The EMA-PANet network structure is shown in Figure 3. PANet adopts top-down and bottom-up feature extraction, which helps obtain the feature information at different scales and makes the network capable of better perceiving and recognizing diseases and pests in tea images. However, tea leaf disease and pest images may contain various scales and complex features, while Apolygus lucorum and leaf blight may exist at very small scales or localized areas, which poses a challenge for the model to capture and understand these tiny features. To address this problem, this study introduces an Efficient Multiscale Attention (EMA) [27] mechanism after the three output branches of PANet. The EMA mechanism takes full advantage of the hierarchical structure and multi-branch output of PANet to help the model better detect and utilize the feature information at different scales while enhancing the attention to the global semantic information and local details.
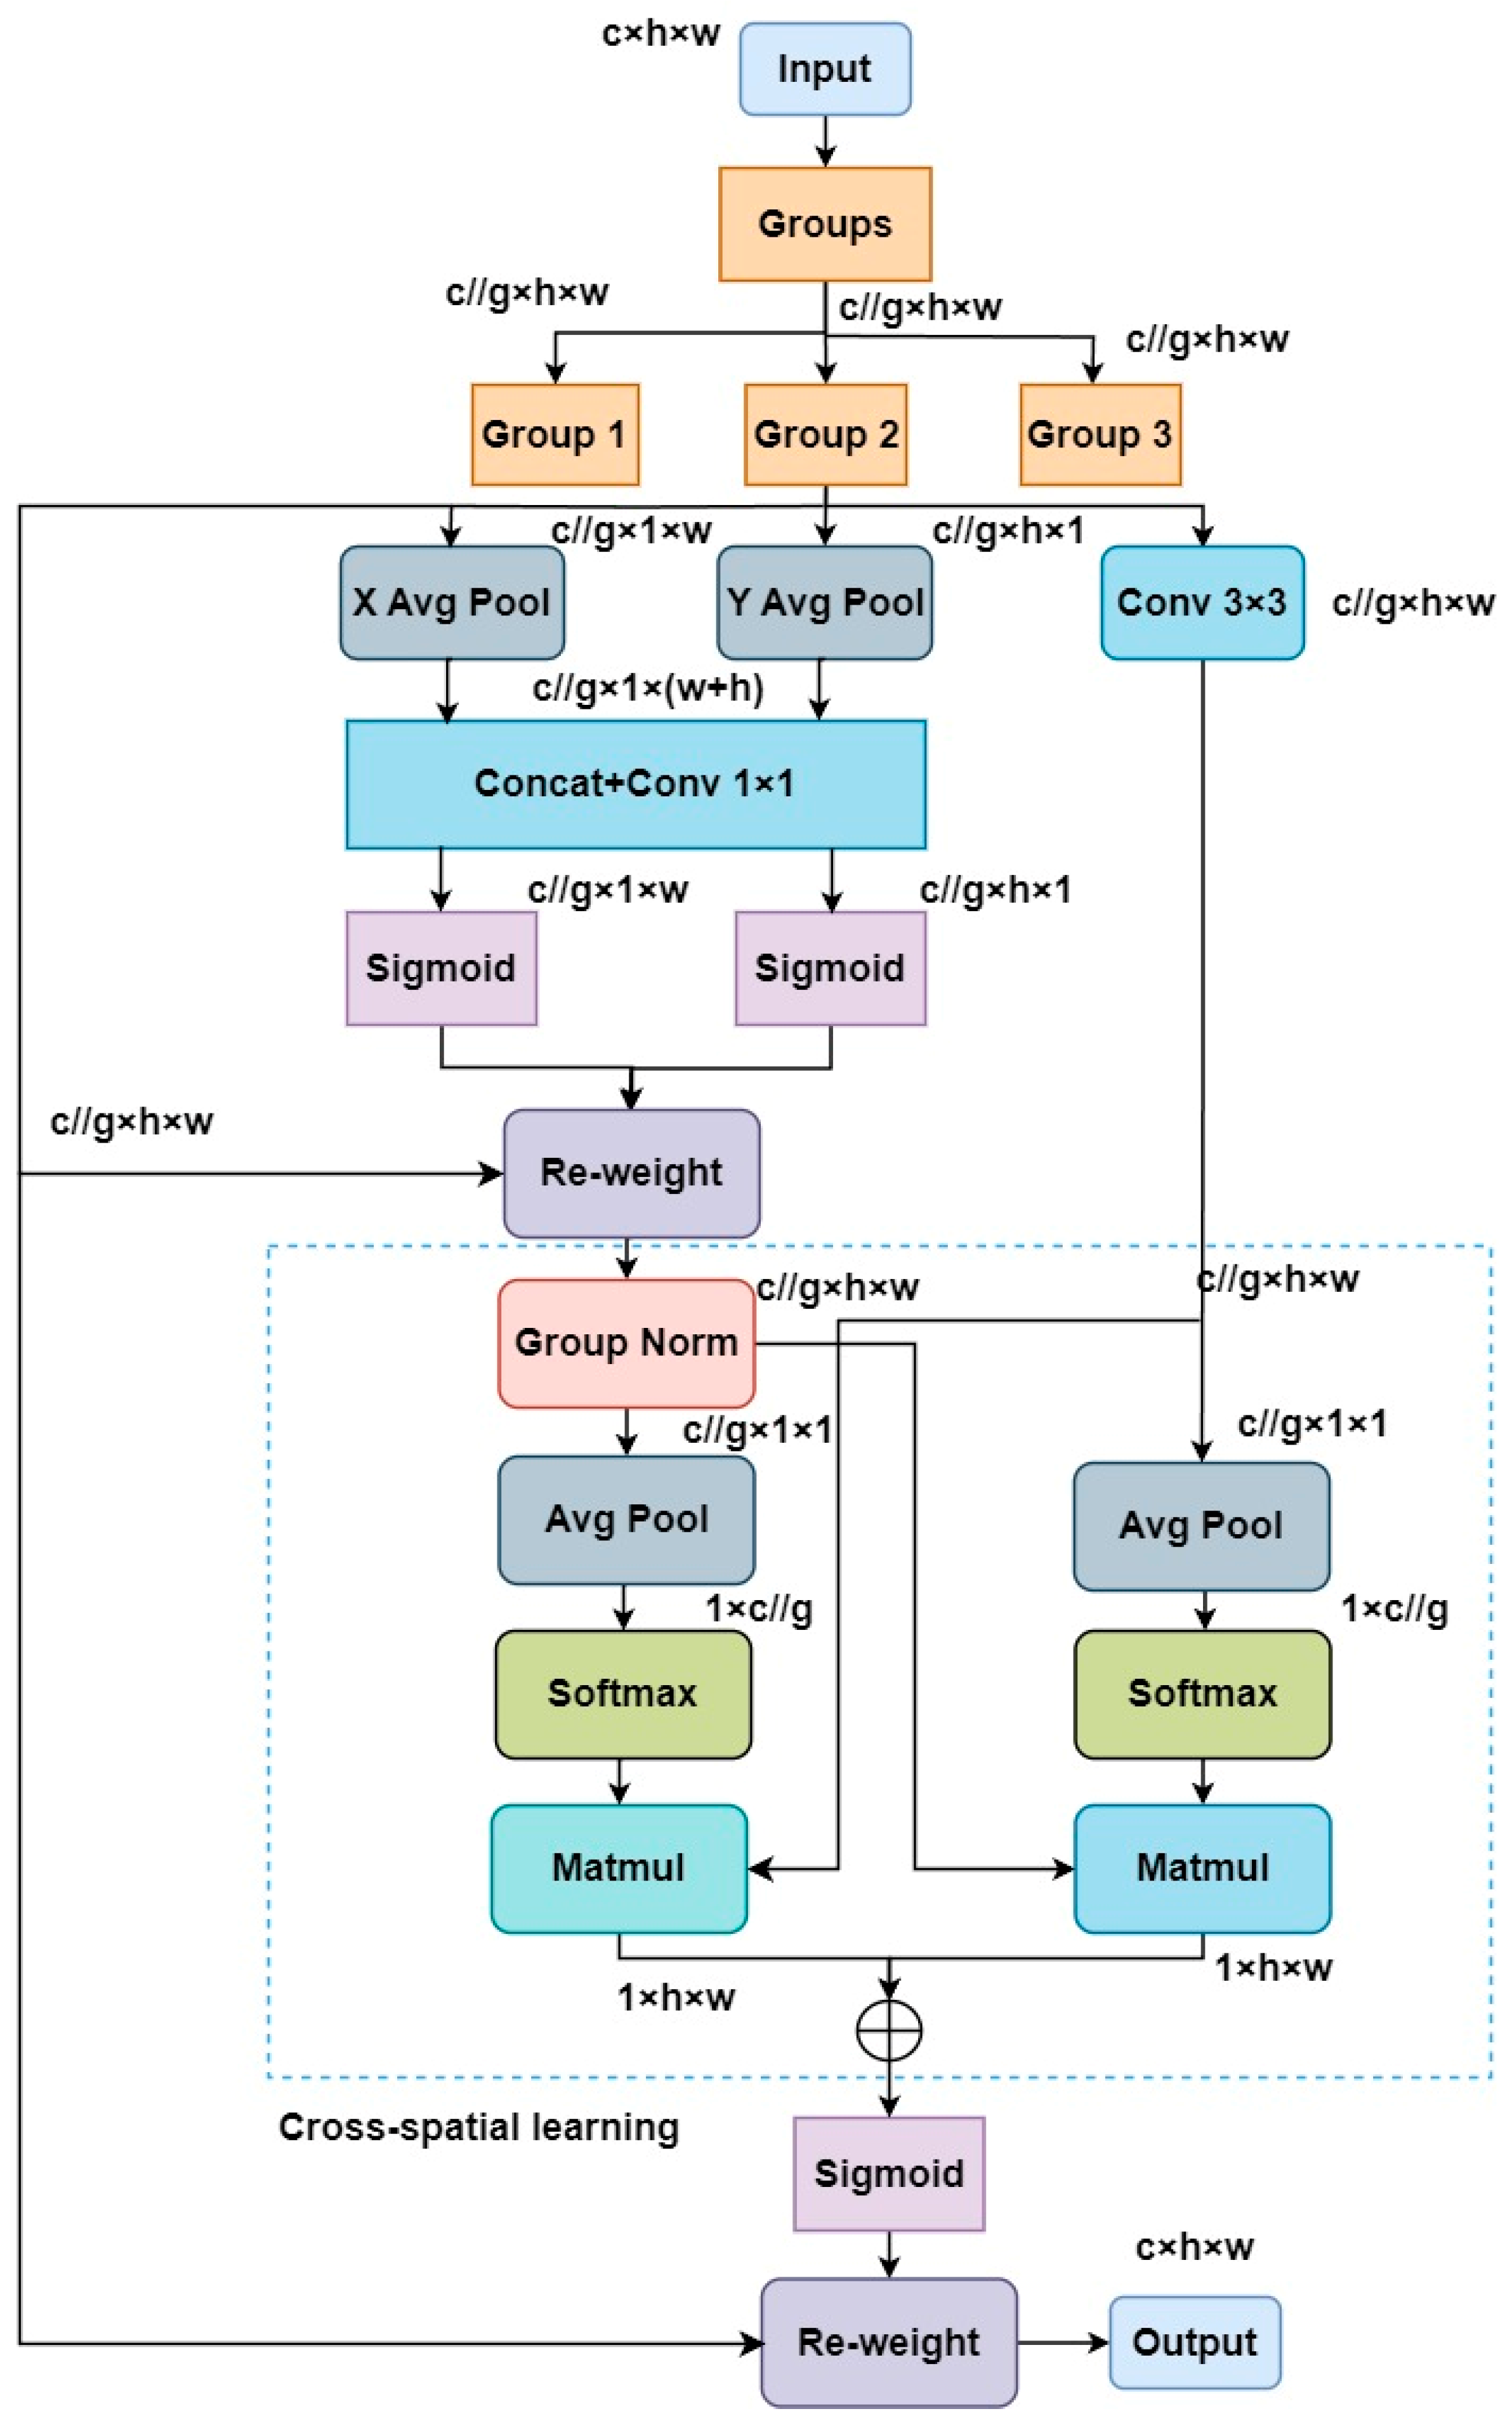
The structure of the Efficient Multiscale Attention Module (EMA) based on cross-space learning is shown in Figure 7. This module efficiently handles multi-scale features via feature grouping, parallel sub-networks, and cross-space learning mechanisms. First, it decomposes the channel dimension into multiple sub-feature groups and extracts the attention weight descriptors via parallel paths while applying cross-space learning methods to capture the dependencies between the channels and spatial locations. This design encodes the network output with a global average pooling operation, captures spatial information and models long-range dependencies, and utilizes spatial attention maps to integrate the output feature maps for pixel-level correlation and global contextual information capture, thus enhancing the performance and expressive capability of neural networks in pixel-level task processing. In addition, the method can handle both short-term and long-term dependencies, allowing the network to utilize contextual information more efficiently, which in turn improves the overall performance level.
2.7. RFBNet
RFBNet utilizes the Receptive Field Block (RFB) [30] mechanism to enhance the feature characterization of convolutional neural networks in target detection tasks, which is inspired by the receptive field in the human visual system and improves the effectiveness and robustness of feature extraction by adjusting the network structure.
The structure of RFBNet is shown in Figure 8. It adopts a multi-branch small convolutional kernel layer containing 3 × 3, 1 × 3, and 3 × 1 convolutional layers, which effectively reduces the parameters and computation of the model. It also combines regular convolutional branches and dilated convolutional branches, with each dilated convolutional layer using a different dilation rate. These dilation convolutional layers simulate and regulate the effect of the eccentricity of the sensory field in human vision, which helps the network to better understand the detailed information of the image. Finally, the RFBNet connects and integrates the feature maps of all branches into one convolutional array, further enhancing the feature characterization capability of the model.
2.8. Training
2.9. Evaluation Metrics
In this paper, model performance is measured in terms of two evaluation criteria: average precision () and number of parameters.
evaluates the performance of the model by calculating the average precision across all categories. Precision is used to measure the proportion of samples predicted as positive by the model that are truly positive, and recall is used to indicate the ratio of the number of positive samples successfully identified by the model to the number of all positive samples in the dataset. The accuracy and recall are shown in Equations (2) and (3) as follows:
is the number of positive samples predicted, is the number of positive samples predicted incorrectly, and is the number of negative samples predicted incorrectly. The model uses as a metric to assess the accuracy of the model, denoting the value of when the IoU threshold is taken as 50%, which is obtained by averaging the APs of each category, calculated as shown in Equations (4) and (5). The specific computational procedure of AP is as follows: First, the TeaViTNet model is used to predict the test set and obtain the predicted bounding boxes and corresponding confidence levels for each image. Then, non-maximum suppression (NMS) processing is applied to these bounding boxes to eliminate overlapping bounding boxes and retain the ones with the highest confidence level. Subsequently, the IoU (intersection and concurrency ratio) value between each predicted bounding box and the true bounding box is calculated. Subsequently, all predicted bounding boxes are sorted in descending order of confidence. For each confidence threshold, precision and recall are computed, and the precision and recall under all confidence thresholds are plotted as PR (precision–recall) curves. Finally, the average precision () is calculated by numerically integrating the area under the PR curve.
where is the total number of categories and is the average precision () of the category. In this paper, the total average precision of the model is denoted as , the average precision of Apolygus lucorum is denoted as APTAL, and the average precision of leaf blight is denoted as .
The model parameter quantity is the number of parameters to be learned in the model, a metric used to assess the spatial complexity and size of the model, and thus an important metric for assessing model lightweighting. Controlling the size of the parameter quantity is crucial for model lightweighting because a lower parameter quantity usually means a leaner model that requires less storage space and computational resources. In resource-constrained environments, optimizing the number of parameters helps to improve the operational efficiency of the model, speeds up inference, and facilitates the rapid deployment and adaptation of the model to various real-world application scenarios.
3. Results
3.1. Training Results
To visualize the performance of the model proposed in this paper during the training phase, this section visualizes the [email protected] metrics by visualizing the model during the training process, and the visualization results are shown in Figure 9. From the figure, it can be observed that in the first 75 epochs of training, the growth rate of the model’s metrics is relatively fast, followed by a relative slowdown in the convergence of the model between 75 and 200 epochs, but still maintains steady growth. After more than 200 epochs, the model’s performance metrics basically remain stable, with no obvious improvement trend, indicating that the model has reached a high performance level during the training process.
To obtain a clear picture of the predictive performance of the TeaVitNet model on different categories, in this section, the confusion matrix is plotted by testing and plotting the validation set, in which the number of labels for Apolygus lucorum is 1926, and the number of labels for leaf blight is 2652, and the results of the confusion matrix are shown in Figure 10.
3.2. Comparison Experiments
3.2.1. Performance Comparison of Different Backbone Networks
To verify the effectiveness of MobileViT selected as the backbone network in this paper, a series of experiments are conducted to compare different types of CNN models. Among them, the lightweight CNN models include MobileNetV1 [33], MobileNetV2 [32], MobileNetV3 [35], ShuffleNet [36], and ShuffleNetV2 [37], and the heavyweight models include VGG [38] and ResNet50 [39].The experimental results of the models are shown in Table 6. In the experiments, the VGG model achieves the highest AP0.5, but at the same time, its number of parameters is also the largest, so it is not suitable for the deployment of mobile devices. Considering the trade-off between the combined accuracy and the number of parameters, MobileViT was finally chosen as the backbone network of the model.
3.2.2. Performance Comparison of Different Attention Mechanisms
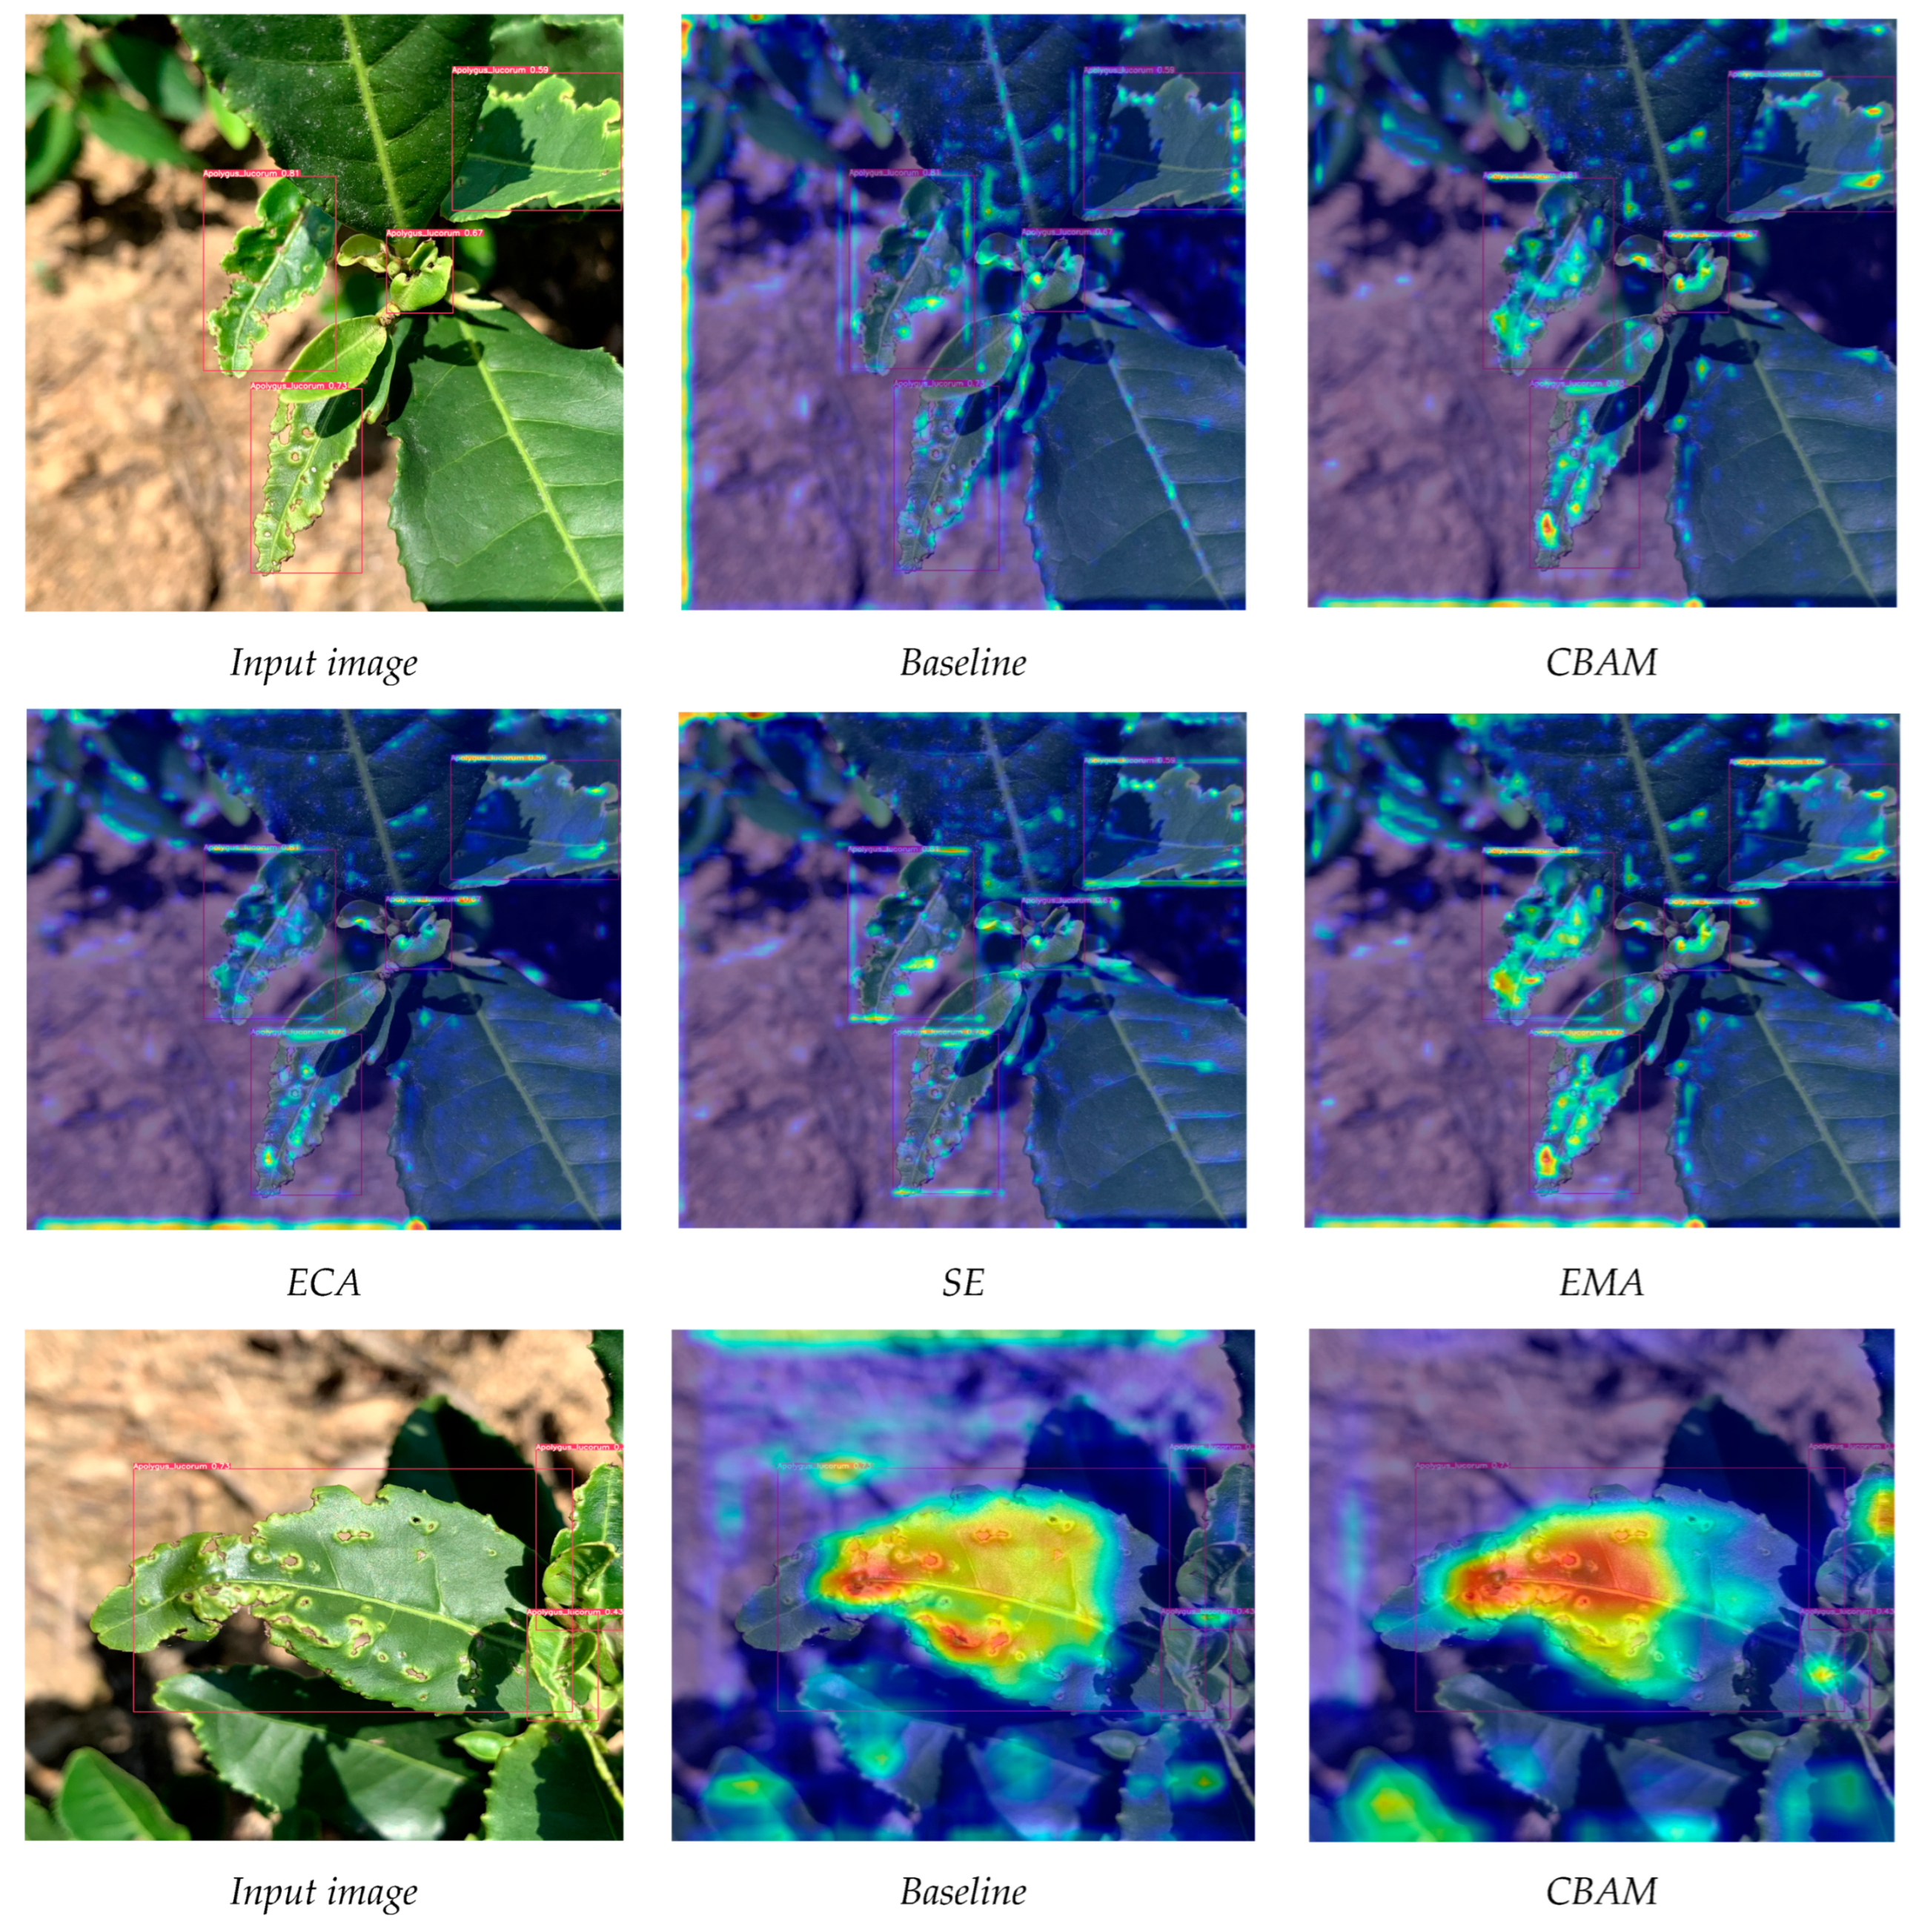
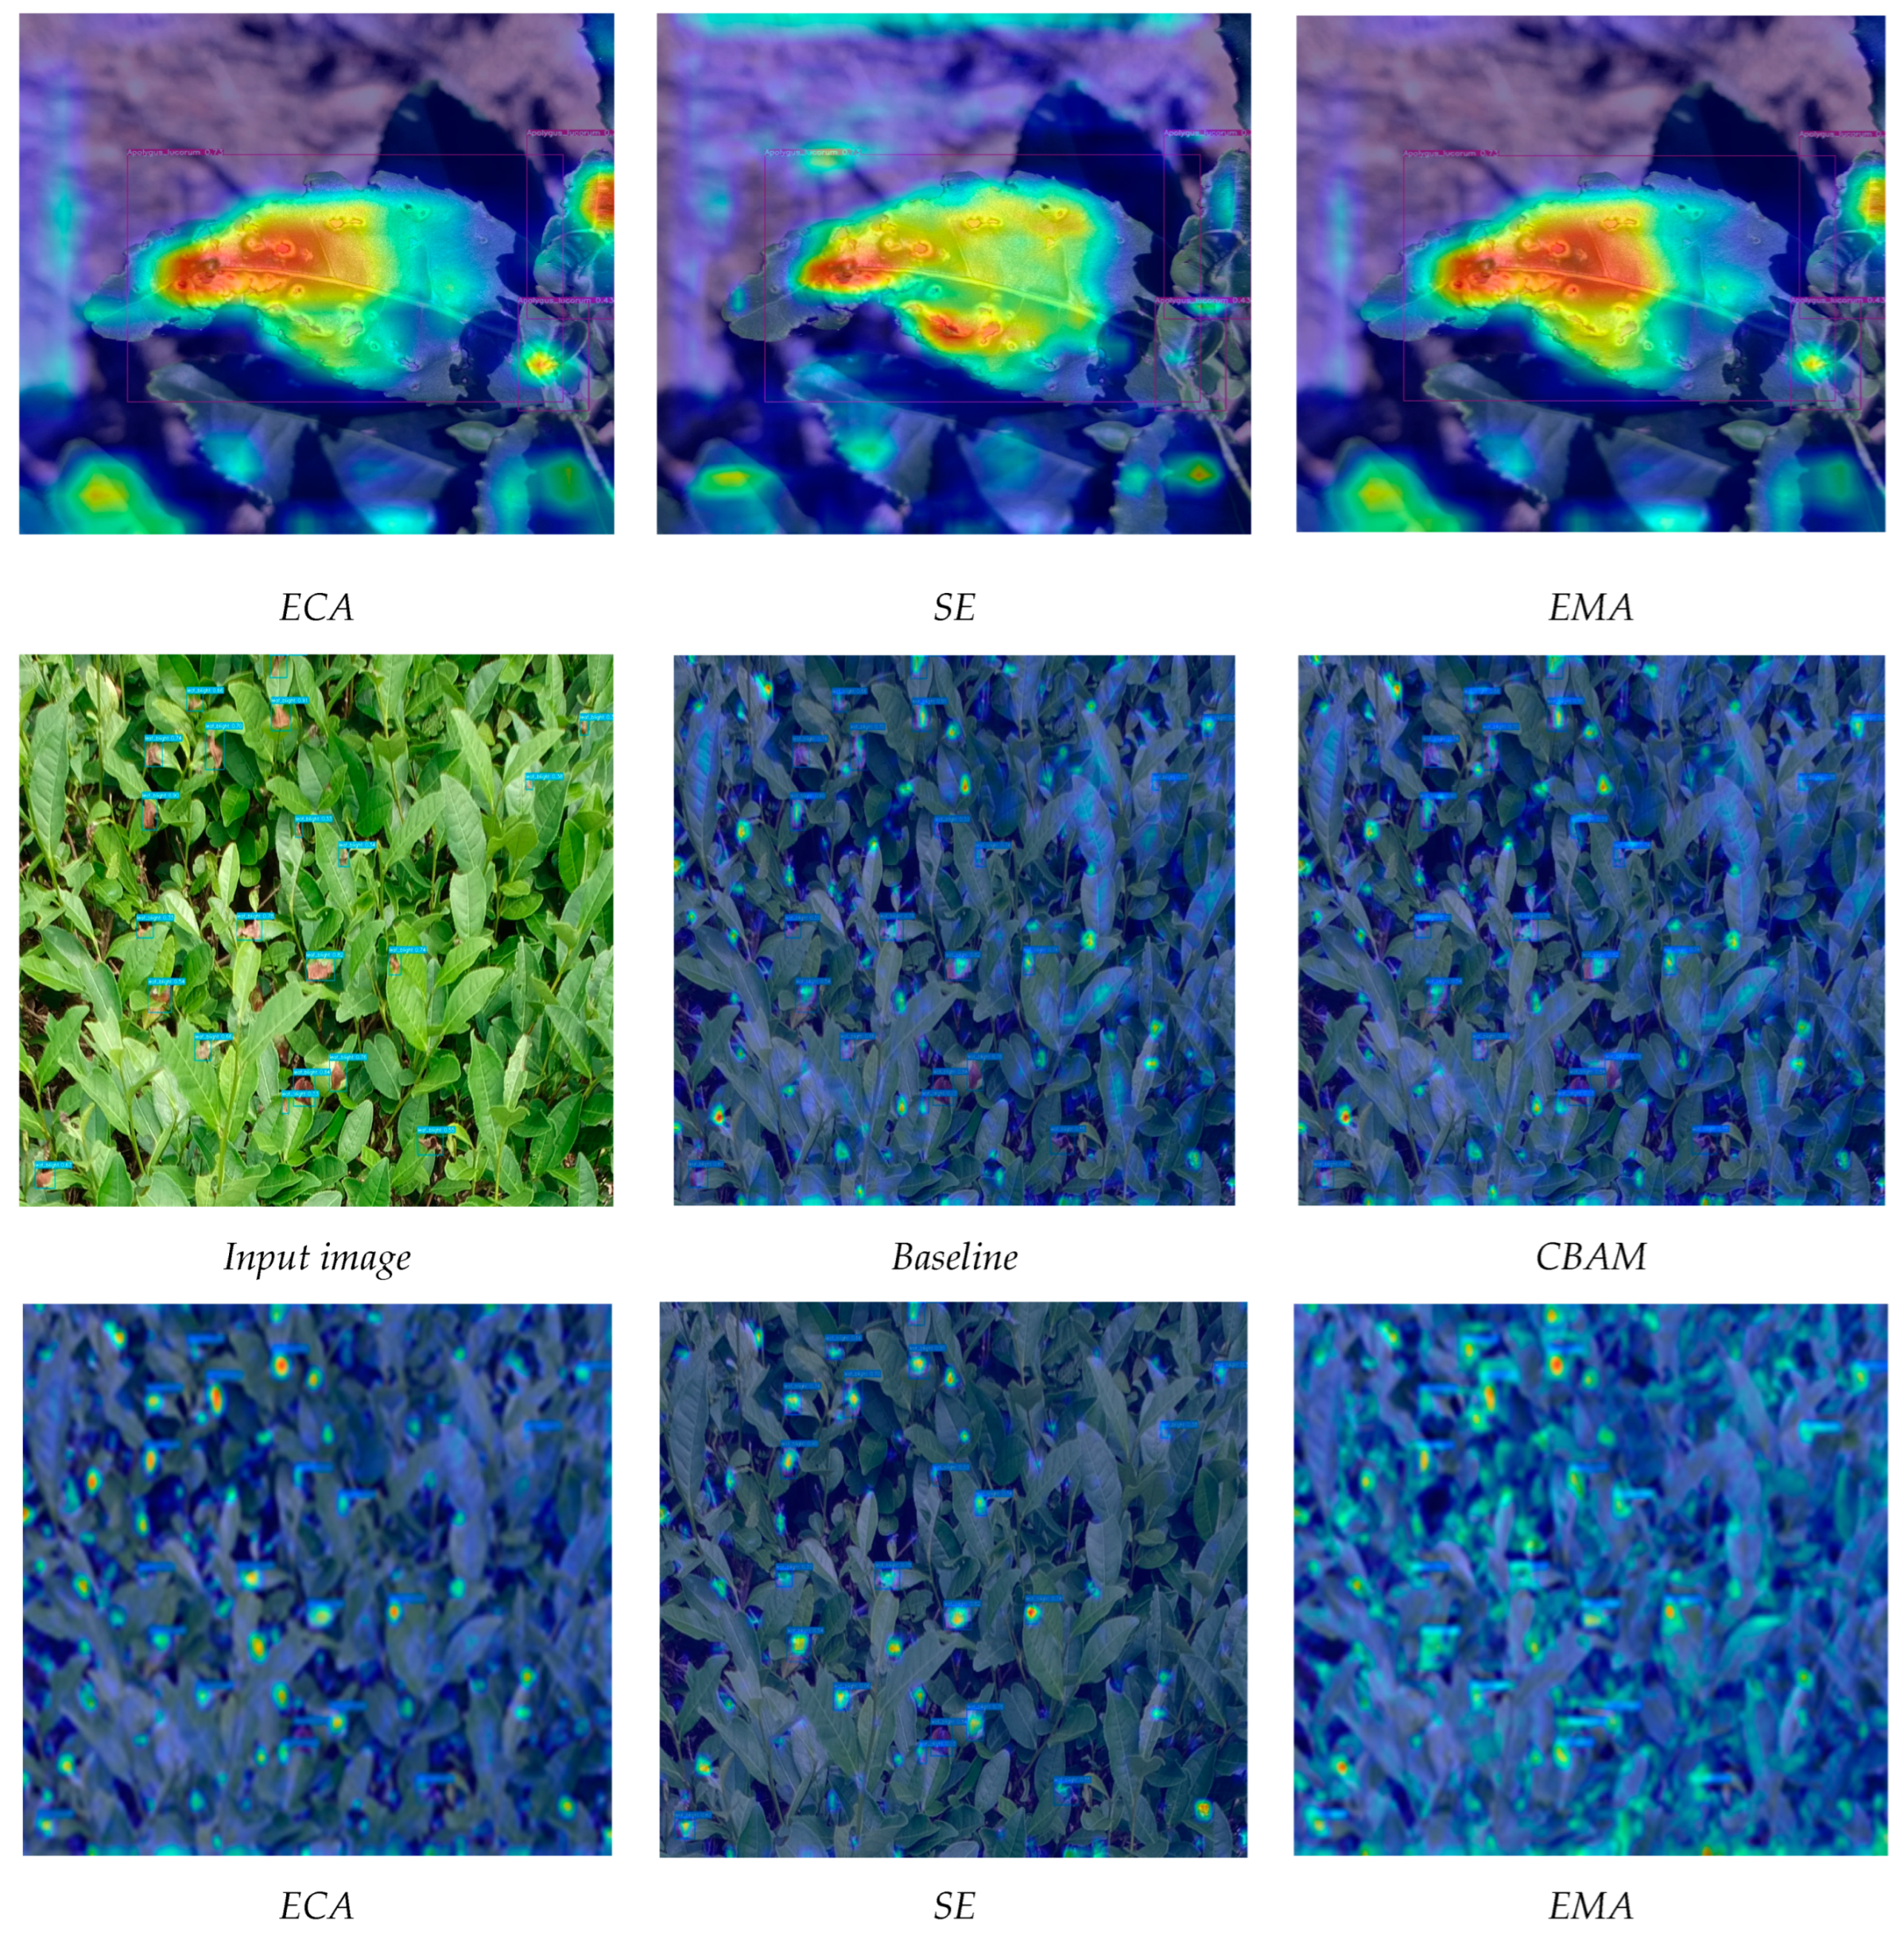
To deeply verify the influence of the attention mechanism in the MobileViT model on the fusion of global and local information, as well as the extent of the model’s attention to the feature information at different scales, this section generates the corresponding feature maps using the MobileViT baseline network using several different attention methods (CBAM [40], ECA [41], SE [42], and EMA) and transforms them into heat maps for visualization, which are shown in Figure 11. Meanwhile, the effects of four different attention mechanisms on model accuracy are shown in Table 7.
3.2.3. Comparison of Different Models
To verify the superiority of the proposed model in this paper with other mainstream models, we conducted experiments comparing TeaViTNet with SSD [43], Faster R-CNN [44], YOLOv5n, and YOLOv7tiny [45]. By comparing the performance of different models on the same dataset, we can evaluate the superiority and applicability of the proposed model. The results of the comparison experiments are shown in Table 8.
As shown in Table 7, the SSD model has a parameter count of 26.1 M, but its AP0.5 is only 87.9, indicating relatively low performance and a larger number of parameters. In contrast, the Faster R-CNN model has a parameter count of 40 M, and its AP0.5 is 89.3, which not only has better performance than SSD but also has a larger number of parameters. The YOLOv5n model has a parameter count of 7.1 M and an AP0.5 of 87.4, which shows a balance between higher performance and a smaller model size. The YOLOv7tiny model has a parameter count of 7.2 M and an AP0.5 of 87.8, with slightly better performance than YOLOv5n but with a similar model size. In contrast, our TeaViTNet model has a parameter count of 4.5 M and an AP0.5 of 89.1, and although the performance is slightly lower than that of the Faster R-CNN, the model has the lowest parameter count, showing an advantage in lightweight target detection.
3.3. Ablation Experiments
To verify the effectiveness of the TeaViTNet model proposed in this paper, MobileViT is used as the baseline network in the ablation experiments, and the PANet, RFB, EMA, and ODCSPLayer modules are gradually introduced to explore their effects on the performance of the TeaViTNet model, and the results are shown in Table 9.
Table 9 presents the significant impact of the gradual introduction of the modules on the model performance. The introduction of the PANet module brings a slight enhancement to the detection of Apolygus lucorum, highlighting its role in multi-scale contextual feature fusion. This suggests that the introduction of PANet enhances the model’s ability to perceive and recognize Apolygus lucorum at multiple scales, thus improving detection accuracy. Subsequently, the introduction of the RFBNet module improved the accuracy of Apolygus lucorum and leaf blight. Their 0.9% and 0.4% enhancements reflect the RFB module’s more accurate capture of the characteristic information of these two diseases, respectively. This implies that the RFBNet module effectively enhances the model’s recognition ability by effectively capturing the minute feature information of these diseases. The introduction of the EMA module further improves the model’s performance. The attention mechanism helps the model to pay more attention to important areas, optimizes the learning and attention of the model for specific target areas, and helps to improve the model’s recognition accuracy for specific targets. Finally, the introduction of the ODCSPLayer further improves the detection accuracy of the model. The ODCSPLayer serves to express the image features of tea leaves more comprehensively and accurately, which enhances the model’s ability to recognize tea pests and diseases. In summary, these experimental results clearly demonstrate the positive impact of the introduction of each module on the model performance, revealing their importance in enhancing the model’s recognition of tea leaf pests and diseases.
3.4. Model Detection Effect
To visualize the performance of the TeaViTNet model proposed in this paper, we selected some images from the test set for detection, and the results are shown in Figure 12a–f. Figure 12a–d show images captured from a cell phone viewpoint, while Figure 12e,f show images captured from a drone viewpoint. In Figure 12a,b, we can clearly observe the large-size Apolygus lucorum infestations, which can be completely detected by our model. In Figure 12c,d, although large-sized Apolygus lucorum infestations are still present, they are also interspersed with tiny leaf blights, and the model can effectively detect these small-sized leaf blights while detecting Apolygus lucorum. In Figure 12e,f, the model is even able to detect smaller Apolygus lucorum and leaf blight diseases in tea bushes. The above detection results show that the TeaViTNet proposed in this paper has a good detection effect.
3.5. Comparison of Different Model Deployment
In this study, the TeaViTNet model is deployed to Raspberry Pi 3B+. Raspberry Pi 3B+ assumes the function of edge computing with Broadcom BCM2837B0 SoC processor, a 64-bit processor based on ARMv8 core (Cortex-A53) operating at 1.4 GHz. It is equipped with 1 GB LPDDR2 SDRAM memory. The Raspberry Pi 3B+ supports 2.4 GHz wireless networking, as well as Bluetooth, and comes with a Gigabit Ethernet card. In addition, it offers a full-size HDMI port, four USB 2.0 ports, a CSI camera port, a DSI screen port, 4-pin stereo out and composite video ports, as well as a micro-SD port. These features make the Raspberry Pi 3B+ ideal for a wide range of computing and multimedia tasks, especially in embedded systems.
In this section, the different models in Section 3.2.3 are deployed to Raspberry Pi 3B+, respectively, and the processing time per image after the deployment of the five models is compared in Table 10.
Based on the experimental data in Table 10, we can observe the processing time of different models on the Raspberry Pi 3B+. The SSD model has a processing time of 6.4 s, the Faster R-CNN model has a processing time of 8.3 s, the YOLOv5n model has a processing time of 4.7 s, the YOLOv7tiny model has a processing time of 4.2 s, and our model TeaViTNet has a processing time of only 3.1 s. These data show that the TeaViTNet model runs most efficiently on the Raspberry Pi 3B+, followed by the YOLOv7tiny and YOLOv5n models. The SSD and Faster R-CNN models have longer processed times, which is because they are of higher complexity and require more computational resources. Therefore, the TeaViTNet model proposed in this paper meets the requirements of practical scenarios.
4. Discussion
This paper presents the TeaViTNet model designed to be applied to the detection of tea pests and diseases. The model is based on MobileViT, which takes advantage of the Transformer architecture to extract multi-scale features in tea leaf images. MobileViT helps to capture and analyze tiny pest and disease features via the self-attention mechanism and global feature extraction and adapts to scenarios with limited mobile device resources. To further enhance the model performance, a multi-scale attention EMA-PANet network is introduced, in which the EMA module optimizes the model’s learning and attention to specific targets, and the PANet module improves the model’s ability to perceive multi-scale information. In addition, the RFBNet module was added to effectively capture the information of tiny features and improve the accuracy of pest and disease features. The introduction of the ODCSPLayer convolutional block in the PANet network aims to improve the network efficiency and understand tea garden images more comprehensively. These improvements resulted in significant improvements and superior performance of the TeaViTNet model in the tea pest and disease recognition task. In summary, TeaViTNet demonstrates excellent robustness and performance in tea garden image analysis. The detection results presented in Figure 12 clearly validate the reliability and adaptability of TeaViTNet for pest and disease identification at different scales and complexities. These results fully demonstrate the importance of TeaViTNet as an effective and reliable disease-recognition tool in tea agriculture.
Compared with the existing literature, this study has made some innovations and contributions in the field of tea pests and disease recognition. Compared to traditional deep learning-based approaches, the TeaViTNet model takes advantage of the Transformer architecture and improves model performance by gradually introducing multiple modules. Despite the results achieved in this study, there are still some limitations to be considered. First, model performance may be affected by dataset bias, especially under specific tea plantation environments and climatic conditions. Therefore, future studies could collect more samples and construct a wider dataset to validate the generalization ability of the model. Second, model deployment to real tea garden environments may face some technical challenges, such as model size and inference speed. To address the challenge of model size, we will further adopt techniques such as model pruning and quantization in the future. By removing redundant parameters, we can further reduce the computational complexity and memory consumption of the model, thus improving the deployment efficiency of the model. For the deployment problem, we will focus on edge computing and distributed reasoning in the future. Utilizing edge computing technology to perform partial model inference on offline or edge devices can reduce communication delay and bandwidth consumption with the cloud. Meanwhile, distributed reasoning strategies are used to assign model reasoning tasks to multiple edge devices for parallel processing to improve reasoning efficiency and concurrent processing capability. These measures will help to improve the deployment efficiency and performance of the model in real tea garden environments. Therefore, future research could focus on solving these problems and further optimizing the model.
This study is of great significance to the field of tea pests and disease identification. First, the proposed TeaViTNet model provides a new solution for the automatic identification of tea pests and diseases, which helps to improve the efficiency and quality of tea cultivation. The model combines the efficient feature extraction capability of MobileViT with the advantages of components such as PANet and RFBNet, enabling real-time accurate detection even on mobile devices. This is important for the timely control of pests and diseases and the reduction in losses. Secondly, the modules and techniques introduced in this study can provide lessons and references for pest and disease identification tasks in other crops.
5. Conclusions
In this study, an innovative visual Transformer model, TeaViTNet, is proposed, which cleverly combines the powerful feature extraction capability of deep learning and the Transformer’s self-attention mechanism and achieves remarkable high-precision recognition results in the recognition of pests and diseases in tea images. Experimental results show that the TeaViTNet model not only surpasses the current mainstream models in recognition accuracy but also exhibits significant advantages in model size. Although the current study is mainly limited to the laboratory environment, and the stability and generalization ability of the model in real complex environments still need to be further verified, the potential of the TeaViTNet model has been initially demonstrated.
In the future, the TeaViTNet model can continue to be refined and optimized. For example, the TeaViTNet model pre-trained in the identification of tea pests and diseases can be used for migration learning to identify pests and diseases of other crops, thus promoting the development and progress of the agricultural field. Meanwhile, real-world application tests are conducted to deploy the model into real agricultural scenarios and conduct field tests to verify its stability and reliability in complex environments.
Overall, this study provides a valuable direction for exploration in the field of tea pests and disease identification. Future research will not only continue to improve the model but also expand its application scope, provide technical support for intelligent monitoring of agricultural pests and diseases, and promote the development of agricultural automation and intelligence.
Author Contributions
Z.C. was responsible for program design and drafting the initial manuscript. H.Z. assisted with data collection and analysis. H.L. and D.B. designed the project and revised the manuscript. All authors have read and agreed to the published version of the manuscript.
Funding
This work was funded by the Jiangsu Modern Agricultural Machinery Equipment and Technology Demonstration and Promotion Project (NJ2021-19) and the Nanjing Modern Agricultural Machinery Equipment and Technological Innovation Demonstration Projects (NJ [2022]09).
Data Availability Statement
Data is contained within the article.
Conflicts of Interest
The authors declare no conflicts of interest.
References
- Bao, W.; Fan, T.; Hu, G.; Liang, D.; Li, H. Detection and identification of tea leaf diseases based on AX-RetinaNet. Sci. Rep. 2022, 12, 2183. [Google Scholar] [CrossRef]
- Hossain, M.S.; Mou, R.M.; Hasan, M.M.; Chakraborty, S.; Razzak, M.A. Recognition and detection of tea leaf’s diseases using support vector machine. In Proceedings of the IEEE International Colloquium on Signal Processing & Its Applications, Penang, Malaysia, 9–10 March 2018. [Google Scholar]
- Zhao, X.; Zhang, J.; Huang, Y.; Tian, Y.; Yuan, L. Detection and discrimination of disease and insect stress of tea plants using hyperspectral imaging combined with wavelet analysis. Comput. Electron. Agric. 2022, 193, 106717. [Google Scholar] [CrossRef]
- Sun, Y.; Jiang, Z.; Zhang, L.; Dong, W.; Rao, Y. SLIC_SVM based leaf diseases saliency map extraction of tea plant. Comput. Electron. Agric. 2019, 157, 102–109. [Google Scholar] [CrossRef]
- Billah, M.; Badrul, M.; Hanifa, A.; Ruhul, M. Adaptive Neuro Fuzzy Inference System based Tea Leaf Disease Recognition using Color Wavelet Features. Commun. Appl. Electron. 2015, 3, 1–4. [Google Scholar] [CrossRef]
- Mukhopadhyay, S.; Paul, M.; Pal, R.; De, D. Tea leaf disease detection using multi-objective image segmentation. Multimed. Tools Appl. 2021, 80, 753–771. [Google Scholar] [CrossRef]
- Lin, H.; Han, Y.; Cai, W.; Jin, B. Traffic signal optimization based on fuzzy control and differential evolution algorithm. IEEE Trans. Intell. Transp. Syst. 2022, 24, 8555–8566. [Google Scholar] [CrossRef]
- Jiao, W.; Zhang, C. An Efficient Human Activity Recognition System Using WiFi Channel State Information. IEEE Syst. J. 2023, 17, 6687–6690. [Google Scholar] [CrossRef]
- Zheng, S.; Liu, Y.; Weng, W.; Jia, X.; Yu, S.; Wu, Z. Tomato recognition and localization method based on improved YOLOv5n-seg model and binocular stereo vision. Agronomy 2023, 13, 2339. [Google Scholar] [CrossRef]
- Zhang, J.; Wang, J.; Zhao, M. A Lightweight Crop Pest Detection Algorithm Based on Improved Yolov5s. Agronomy 2023, 13, 1779. [Google Scholar] [CrossRef]
- Bi, C.; Xu, S.; Hu, N.; Zhang, S.; Zhu, Z.; Yu, H. Identification method of corn leaf disease based on improved Mobilenetv3 model. Agronomy 2023, 13, 300. [Google Scholar] [CrossRef]
- Cai, L.; Liang, J.; Xu, X.; Duan, J.; Yang, Z. Banana pseudostem visual detection method based on improved YOLOV7 detection algorithm. Agronomy 2023, 13, 999. [Google Scholar] [CrossRef]
- Połap, D.; Jaszcz, A.; Wawrzyniak, N.; Zaniewicz, G. Bilinear pooling with poisoning detection module for automatic side scan sonar data analysis. IEEE Access 2023, 11, 72477–72484. [Google Scholar] [CrossRef]
- Butt, Z.I.; Ahmad, I.; Raja, M.A.Z.; Hussain, S.I.; Shoaib, M.; Ilyas, H. Neuro-Heuristic Computational Intelligence Approach for Optimization of Electro-Magneto-Hydrodynamic Influence on a Nano Viscous Fluid Flow. Int. J. Intell. Syst. 2023, 2023, 7626478. [Google Scholar] [CrossRef]
- Lin, J.; Bai, D.; Xu, R.; Lin, H. TSBA-YOLO: An improved tea diseases detection model based on attention mechanisms and feature fusion. Forests 2023, 14, 619. [Google Scholar] [CrossRef]
- Xue, Z.; Xu, R.; Bai, D.; Lin, H. YOLO-tea: A tea disease detection model improved by YOLOv5. Forests 2023, 14, 415. [Google Scholar] [CrossRef]
- Wang, Y.; Xu, R.; Bai, D.; Lin, H. Integrated Learning-Based Pest and Disease Detection Method for Tea Leaves. Forests 2023, 14, 1012. [Google Scholar] [CrossRef]
- Hu, G.; Wang, H.; Zhang, Y.; Wan, M. Detection and severity analysis of tea leaf blight based on deep learning. Comput. Electr. Eng. 2021, 90, 107023. [Google Scholar] [CrossRef]
- Wang, Y.; Yang, X.; Zhang, L.; Fan, X.; Ye, Q.; Fu, L. Individual tree segmentation and tree-counting using supervised clustering. Comput. Electron. Agric. 2023, 205, 107629. [Google Scholar] [CrossRef]
- Zhang, J.; Guo, H.; Guo, J.; Zhang, J. An Information Entropy Masked Vision Transformer (IEM-ViT) Model for Recognition of Tea Diseases. Agronomy 2023, 13, 1156. [Google Scholar] [CrossRef]
- Bao, W.; Zhu, Z.; Hu, G.; Zhou, X.; Zhang, D.; Yang, X. UAV remote sensing detection of tea leaf blight based on DDMA-YOLO. Comput. Electron. Agric. 2023, 205, 107637. [Google Scholar] [CrossRef]
- Li, G.; Wang, Y.; Zhao, Q.; Chang, B. PMVT: A lightweight vision transformer for plant disease identification on mobile devices. Front. Plant Sci. 2023, 14, 1256773. [Google Scholar] [CrossRef]
- Hu, W.; Hong, W.; Wang, H.; Liu, M.; Liu, S. A Study on Tomato Disease and Pest Detection Method. Appl. Sci. 2023, 13, 10063. [Google Scholar] [CrossRef]
- Vaswani, A.; Shazeer, N.; Parmar, N.; Uszkoreit, J.; Jones, L.; Gomez, A.N.; Kaiser, Ł.; Polosukhin, I. Attention is all you need. In Advances in Neural Information Processing Systems; NeurIPS: Long Beach, CA, USA, 2017; Volume 30. [Google Scholar]
- Lin, T.-Y.; Dollár, P.; Girshick, R.; He, K.; Hariharan, B.; Belongie, S. Feature pyramid networks for object detection. In Proceedings of the IEEE Conference on Computer Vision and Pattern Recognition, Honolulu, HI, USA, 21–26 July 2017; pp. 2117–2125. [Google Scholar]
- Liu, S.; Qi, L.; Qin, H.; Shi, J.; Jia, J. Path aggregation network for instance segmentation. In Proceedings of the IEEE Conference on Computer Vision and Pattern Recognition, Salt Lake City, UT, USA, 18–23 June 2018; pp. 8759–8768. [Google Scholar]
- Ouyang, D.; He, S.; Zhang, G.; Luo, M.; Guo, H.; Zhan, J.; Huang, Z. Efficient Multi-Scale Attention Module with Cross-Spatial Learning. In Proceedings of the ICASSP 2023—2023 IEEE International Conference on Acoustics, Speech and Signal Processing (ICASSP), Rhodes Island, Greece, 4–10 June 2023; pp. 1–5. [Google Scholar]
- labelImg: LabelImg Is a graphical Image Annotation Tool and Label Object Bounding Boxes in Images. Available online: https://github.com/tzutalin/labelImg (accessed on 20 February 2024).
- Mehta, S.; Rastegari, M. Mobilevit: Light-weight, general-purpose, and mobile-friendly vision transformer. arXiv 2021, arXiv:2110.02178. [Google Scholar]
- Liu, S.; Huang, D. Receptive field block net for accurate and fast object detection. In Proceedings of the European Conference on Computer Vision (ECCV), Munich, Germany, 8–14 September 2018; pp. 385–400. [Google Scholar]
- Li, C.; Zhou, A.; Yao, A. Omni-dimensional dynamic convolution. arXiv 2022, arXiv:2209.07947. [Google Scholar]
- Sandler, M.; Howard, A.; Zhu, M.; Zhmoginov, A.; Chen, L.-C. Mobilenetv2: Inverted residuals and linear bottlenecks. In Proceedings of the IEEE Conference on Computer Vision and Pattern Recognition, Salt Lake City, UT, USA, 18–23 June 2018; pp. 4510–4520. [Google Scholar]
- Howard, A.G.; Zhu, M.; Chen, B.; Kalenichenko, D.; Wang, W.; Weyand, T.; Andreetto, M.; Adam, H. Mobilenets: Efficient convolutional neural networks for mobile vision applications. arXiv 2017, arXiv:1704.04861. [Google Scholar]
- Wang, C.-Y.; Liao, H.-Y.M.; Yeh, I.-H. Designing network design strategies through gradient path analysis. arXiv 2022, arXiv:2211.04800. [Google Scholar]
- Howard, A.; Sandler, M.; Chu, G.; Chen, L.-C.; Chen, B.; Tan, M.; Wang, W.; Zhu, Y.; Pang, R.; Vasudevan, V. Searching for mobilenetv3. In Proceedings of the IEEE/CVF International Conference on Computer Vision, Seoul, Republic of Korea, 27–28 October 2019; pp. 1314–1324. [Google Scholar]
- Zhang, X.; Zhou, X.; Lin, M.; Sun, J. Shufflenet: An extremely efficient convolutional neural network for mobile devices. In Proceedings of the IEEE Conference on Computer Vision and Pattern Recognition, Salt Lake City, UT, USA, 18–23 June 2018; pp. 6848–6856. [Google Scholar]
- Ma, N.; Zhang, X.; Zheng, H.-T.; Sun, J. Shufflenet v2: Practical guidelines for efficient cnn architecture design. In Proceedings of the European Conference on Computer Vision (ECCV), Munich, Germany, 8–14 September 2018; pp. 116–131. [Google Scholar]
- Simonyan, K.; Zisserman, A. Very deep convolutional networks for large-scale image recognition. arXiv 2014, arXiv:1409.1556. [Google Scholar]
- He, K.; Zhang, X.; Ren, S.; Sun, J. Deep residual learning for image recognition. In Proceedings of the IEEE Conference on Computer Vision and Pattern Recognition, Las Vegas, NV, USA, 27–30 June 2016; pp. 770–778. [Google Scholar]
- Woo, S.; Park, J.; Lee, J.-Y.; Kweon, I.S. Cbam: Convolutional block attention module. In Proceedings of the European Conference on Computer Vision (ECCV), Munich, Germany, 8–14 September 2018; pp. 3–19. [Google Scholar]
- Wang, Q.; Wu, B.; Zhu, P.; Li, P.; Zuo, W.; Hu, Q. ECA-Net: Efficient channel attention for deep convolutional neural networks. In Proceedings of the IEEE/CVF Conference on Computer Vision and Pattern Recognition, Seattle, WA, USA, 13–19 June 2020; pp. 11534–11542. [Google Scholar]
- Hu, J.; Shen, L.; Sun, G. Squeeze-and-excitation networks. In Proceedings of the IEEE Conference on Computer Vision and Pattern Recognition, Salt Lake City, UT, USA, 18–23 June 2018; pp. 7132–7141. [Google Scholar]
- Liu, W.; Anguelov, D.; Erhan, D.; Szegedy, C.; Reed, S.; Fu, C.-Y.; Berg, A.C. Ssd: Single shot multibox detector. In Proceedings of the Computer Vision–ECCV 2016: 14th European Conference, Amsterdam, The Netherlands, 11–14 October 2016; Proceedings, Part I 14. pp. 21–37. [Google Scholar]
- Ren, S.; He, K.; Girshick, R.; Sun, J. Faster r-cnn: Towards real-time object detection with region proposal networks. Adv. Neural Inf. Process. Syst. 2015, 28, 1–9. [Google Scholar] [CrossRef]
- Wang, C.-Y.; Bochkovskiy, A.; Liao, H.-Y.M. YOLOv7: Trainable bag-of-freebies sets new state-of-the-art for real-time object detectors. In Proceedings of the IEEE/CVF Conference on Computer Vision and Pattern Recognition, Vancouver, BC, Canada, 17–24 June 2023; pp. 7464–7475. [Google Scholar]
Figure 1.
Representative samples of tea pests and diseases: (a) Apolygus lucorum; (b) leaf blight.

Figure 2.
Sample data augmentation for tea pests and diseases: (a) original image; (b) random rotation; (c) brightness adjustment; (d) adding noise.
Figure 2.
Sample data augmentation for tea pests and diseases: (a) original image; (b) random rotation; (c) brightness adjustment; (d) adding noise.


Figure 3.
Diagram of the model network structure.

Figure 4.
MV2 block.

Figure 5.
MobileViT Block.

Figure 6.
(a) ODCSPLayer module; (b) bottleneck.

Figure 7.
Diagram of EMA module.

Figure 8.
Structure of RFBNet.

Figure 9.
Model training results.

Figure 10.
Confusion matrix.

Figure 11.
Visualization of feature maps generated based on the MobileViT baseline network, with the EMA module focusing more on the details of specific Apolygus lucorum and leaf blight related areas.
Figure 11.
Visualization of feature maps generated based on the MobileViT baseline network, with the EMA module focusing more on the details of specific Apolygus lucorum and leaf blight related areas.


Figure 12.
Detection effect of TeaViTNet model under different angles. (a–d) Cell phone viewpoint; (e,f) Drone viewpoint.
Figure 12.
Detection effect of TeaViTNet model under different angles. (a–d) Cell phone viewpoint; (e,f) Drone viewpoint.


Table 1.
Distribution of dataset labels.
| Distribution | Before Data Augmentation | After Data Augmentation |
|---|---|---|
| Images | 450 | 2100 |
| Apolygus lucorum | 1583 | 9629 |
| Leaf blight | 1962 | 13,260 |
Table 2.
Target numbers in dataset.
| Distribution | Training | Validation |
|---|---|---|
| Images | 1680 | 420 |
| Apolygus lucorum | 7703 | 1926 |
| Leaf blight | 10,608 | 2652 |
Table 3.
Network structure parameters of MobileViT.
| Input Layer | Output Size | Stride | Repeat |
|---|---|---|---|
| Image | 640 × 640 | ||
| Conv | 320 × 320 | 2 | 1 |
| MV2 | 320 × 320 | 1 | 1 |
| MV2 | 160 × 160 | 2 | 1 |
| MV2 | 160 × 160 | 1 | 2 |
| MV2 | 80 × 80 | 2 | 1 |
| MobileViT Block | 80 × 80 | 1 | 1 |
| MV2 | 40 × 40 | 2 | 1 |
| MobileViT Block | 40 × 40 | 1 | 1 |
| MV2 | 20 × 20 | 2 | 1 |
| MobileViT Block | 20 × 20 | 1 | 1 |
Table 4.
Experimental conditions.
| Experimental Environment | Details |
|---|---|
| Programming language | Python 3.9 |
| Operating system | Windows 11 |
| Deep learning framework | PyTorch 2.0.1 |
| GPU | NVIDIA GeForce RTX 3060 |
Table 5.
Training parameters.
| Training Parameters | Details |
|---|---|
| Epochs | 300 |
| batch-size | 4 |
| Img-size | 640 × 640 |
| Learning rate | 0.01 |
| Optimizers | Adam |
Table 6.
Performance comparison of different backbone networks.
| Model | AP0.5 | APTAL | APTLB | Params (M) |
|---|---|---|---|---|
| MobileNetV1 | 85.1 | 84.3 | 85.8 | 5.1 |
| MobileNetV2 | 85.2 | 84.2 | 86.2 | 4.3 |
| MobileNetV3 | 85.4 | 85.3 | 85.5 | 4.9 |
| ShuffleNet | 84.6 | 84.7 | 84.5 | 3.4 |
| ShuffleNetV2 | 84.9 | 84.9 | 84.9 | 3.3 |
| VGG | 89.3 | 88.7 | 89.9 | 35.6 |
| ResNet50 | 85.9 | 86.7 | 85.1 | 22.9 |
| MobileViT | 87.6 | 86.6 | 88.7 | 2.7 |
Table 7.
Performance comparison of different attention mechanisms.
| Model | AP0.5 | APTAL | APTLB |
|---|---|---|---|
| CBAM | 88.4 | 88.4 | 88.3 |
| ECA | 87.7 | 87.2 | 88.2 |
| SE | 87.9 | 88.5 | 87.2 |
| EMA | 88.9 | 88.6 | 89.2 |
Table 8.
Results of the comparison experiments.
| Model | AP0.5 | APTAL | APTLB | Params (M) |
|---|---|---|---|---|
| SSD | 87.9 | 87.1 | 88.7 | 26.1 |
| Faster R-CNN | 89.3 | 89.2 | 89.4 | 40 |
| YOLOv5n | 87.4 | 87.5 | 87.3 | 7.1 |
| YOLOv7tiny | 87.8 | 87.4 | 88.1 | 7.2 |
| TeaViTNet (Ours) | 89.1 | 88.6 | 89.6 | 4.5 |
Table 9.
Ablation experiments results.
| Model | AP0.5 | APTAL | APTLB | Params (M) |
|---|---|---|---|---|
| MobileViT | 87.6 | 86.6 | 88.7 | 2.7 |
| MobileViT+PANet | 87.8 | 86.9 | 88.7 | 3.9 |
| MobileViT+PANet+RFBNet | 88.3 | 87.8 | 89.1 | 4.3 |
| MobileViT+PANet+RFBNet+EMA | 88.9 | 88.6 | 89.2 | 4.5 |
| MobileViT+PANet+RFBNet+EMA+ODCSPLayer (Ours) | 89.1 | 88.6 | 89.6 | 4.5 |
Table 10.
Deployment results of different models.
| Model | Processing Time (s) | Params (M) |
|---|---|---|
| SSD | 6.4 | 26.1 |
| Faster R-CNN | 8.3 | 40 |
| YOLOv5n | 4.7 | 7.1 |
| YOLOv7tiny | 4.2 | 7.2 |
| TeaViTNet (Ours) | 3.1 | 4.5 |
Disclaimer/Publisher’s Note: The statements, opinions and data contained in all publications are solely those of the individual author(s) and contributor(s) and not of MDPI and/or the editor(s). MDPI and/or the editor(s) disclaim responsibility for any injury to people or property resulting from any ideas, methods, instructions or products referred to in the content. |
© 2024 by the authors. Licensee MDPI, Basel, Switzerland. This article is an open access article distributed under the terms and conditions of the Creative Commons Attribution (CC BY) license (https://creativecommons.org/licenses/by/4.0/).
Share and Cite
MDPI and ACS Style
Chen, Z.; Zhou, H.; Lin, H.; Bai, D. TeaViTNet: Tea Disease and Pest Detection Model Based on Fused Multiscale Attention. Agronomy 2024, 14, 633. https://doi.org/10.3390/agronomy14030633
AMA Style
Chen Z, Zhou H, Lin H, Bai D. TeaViTNet: Tea Disease and Pest Detection Model Based on Fused Multiscale Attention. Agronomy. 2024; 14(3):633. https://doi.org/10.3390/agronomy14030633
Chicago/Turabian StyleChen, Zhichao, Hongping Zhou, Haifeng Lin, and Di Bai. 2024. "TeaViTNet: Tea Disease and Pest Detection Model Based on Fused Multiscale Attention" Agronomy 14, no. 3: 633. https://doi.org/10.3390/agronomy14030633
Note that from the first issue of 2016, this journal uses article numbers instead of page numbers. See further details here.