Article

Weed Species’ Diversity and Composition as Shaped by the Interaction of Management, Site, and Soil Variables in Olive Groves of Southern Greece

by
Petros Vahamidis
1,†,
Demosthenis Chachalis
1,*,
Antigoni Akrivou
1,†,
Evangelos Karanasios
1,
Maria Ganopoulou
2,
Apostolia Argiri
3,
Athanasia Mandoulaki
4,
Evangelos Hatzigiannakis
5,
Georgios Arampatzis
5,
Andreas Panagopoulos
5,
Irene Mantzouni
1 and
Emilia Markellou
1
1
Benaki Phytopathological Institute, 14561 Kifissia, Greece
2
School of Informatics, Aristotle University of Thessaloniki, 54124 Thessaloniki, Greece
3
Department of Agriculture, Crop Production and Rural Environment, University of Thessaly, 38446 Volos, Greece
4
Department of Agricultural Sciences, Biotechnology and Food Science, Cyprus University of Technology, 3036 Limassol, Cyprus
5
Soil and Water Resources Institute, Hellenic Agricultural Organization “DEMETER”, 57400 Thessaloniki, Greece
*
Author to whom correspondence should be addressed.
These authors contributed equally to this work.
Agronomy 2024, 14(3), 640; https://doi.org/10.3390/agronomy14030640
Submission received: 28 February 2024 / Revised: 19 March 2024 / Accepted: 20 March 2024 / Published: 21 March 2024
(This article belongs to the Special Issue Ecology and Management of Weeds in Different Situations)

Abstract

:
Gaining a comprehensive understanding of how weed communities respond to both environmental and human-induced factors is of paramount importance in developing effective and ecologically sound weed control strategies. The objectives of the current research were to (1) assess the effect of the main weed management practices used in Greek olive groves on weed species’ diversity; (2) explore the filtering effect of management, site, and soil variables in determining weed species’ composition; and (3) shed light on the association between weed species’ composition and the diversity of the understory vegetation of olive groves. To accomplish these objectives, winter weed species’ coverage was assessed in 116 olive groves, both conventional and organic, distributed across three provinces in southern Greece. The investigation encompassed 29 explanatory variables, categorized into three groups: soil (22), management practices (6), and site conditions (1). It was confirmed that glyphosate use may lower biodiversity and species richness; however, this trend was not universal. In fact, the negative influence of the presence of Oxalis pes-caprae L. on species richness and diversity far outweighed the effect of spraying glyphosate. Redundancy analysis (RDA) revealed that among the 29 variables used to describe the ecological niche, eight (i.e., Mn, Mg, chemical spraying, mowing, rotary tiller, grazing, irrigation, and elevation) were significant and explained 21.5% of the total variation in weed species’ data. Interestingly, the soil Mn concentration was identified as the most influential one, highlighting the importance of soil micronutrients in determining weed species’ composition. The variation partitioning procedure demonstrated that the effect of the management variables on weed species’ composition accounted for 2.2 times the variance of soil variables and 4.5 times the variance of elevation. The present findings might help to enhance optimal management in olive groves that can sustain the biodiversity of flora and, in turn, provide various ecosystem services to agro-ecosystems.

1. Introduction

Weed biodiversity plays a key role in supporting food webs and ecosystem services in agro-ecosystems [1]. According to Gerowitt et al. [2], agricultural systems have a clear human-centered perspective in which biodiversity will offer not only positive functions (‘services’) but also negative ones (‘disservices’). Therefore, finding a balance between weed management and biodiversity is one of the greatest challenges of sustainable agricultural production. Previous studies have identified the lack of subsidies as a major constraint for the adoption of practices that encourage the diversity of weed communities [3]. To overcome this barrier in Europe, the new common agricultural policy (CAP: 2023-27) contains a number of policy reforms (e.g., ‘eco-schemes’) to reward farmers for undertaking actions that are beneficial to the climate, environment, water quality, and biodiversity.
Olive groves are an ideal study model for several reasons. Olive (Olea europaea L.) is one of the most extensively cultivated tree crops in the Mediterranean basin and has been playing an important role in the socioeconomic life of the region since ancient times [4,5]. In Greece, traditionally managed olive groves have been identified as important habitats that often support a rich ground flora [6]. However, over the last three decades, olive cultivation has experienced a considerable intensification process (e.g., greater mechanization and use of herbicides), leading to rapid landscape changes with significant environmental impacts [6,7]. Finally, it is widely acknowledged that olive trees’ productivity can be limited by weed competition, depending on the weed flora and their density [8].
Understanding how weed communities respond to environmental and human-induced factors is essential to develop efficient, sustainable, and ecologically sound weed control practices [9,10]. So far, most of the studies have focused on the effect of management practices or cultivation systems [11,12,13,14] on weed communities in olive groves, but the combined effect of both management and environmental drivers has rarely been considered [6]. This does not imply that the combined filtering effect of management practices and environmental factors has not been tested in other perennial crop systems [10,15,16]; however, there are substantial differences among perennial crop systems (e.g., olive groves vs. vineyards) in terms of agro-ecological conditions, which make extrapolation of the findings risky.
Recent research on weed communities in olive groves has shown that management practices can significantly influence weed species’ composition and diversity [14,17,18,19]. Generally, the use of chemical herbicides decreases weed diversity in olive orchards, as well as in other perennial crop systems, whereas mowing promotes richer communities with more abundant species [14,16,20,21]. Additionally, concerning the effects of environmental factors on the ground flora of olive groves, it has been demonstrated that variables such as the soil’s characteristics, the slope aspect, and the slope angle may account for approximately 60% of the species–environment relationships [6].
Existing evidence on the importance of environmental and management practice filters in shaping weed assemblages is quite variable in the literature. On one hand, there are studies indicating that the weed species’ composition in farmlands may primarily be determined by environmental factors such as soil texture, pH, and the soil’s properties [22,23,24]. On the other hand, there are studies indicating that human management factors have a bigger impact on weed diversity than environmental factors [3,15]. Fried et al. [16] emphasized the difficulties in evaluating how management practices influence the composition of weed communities. It was concluded that knowledge of the soil’s characteristics can provide insights into the types of weeds that are likely to thrive in specific environments, which can be influenced by the combination of practices applied.
The objectives of the current research were to (1) assess the effect of the main weed management practices used in Greek olive groves on weed species’ diversity; (2) explore the filtering effect of management, site, and soil variables in determining weed species’ composition; and (3) provide further insight into the association between weed species’ composition and the diversity of the understory vegetation of olive groves.

2. Materials and Methods

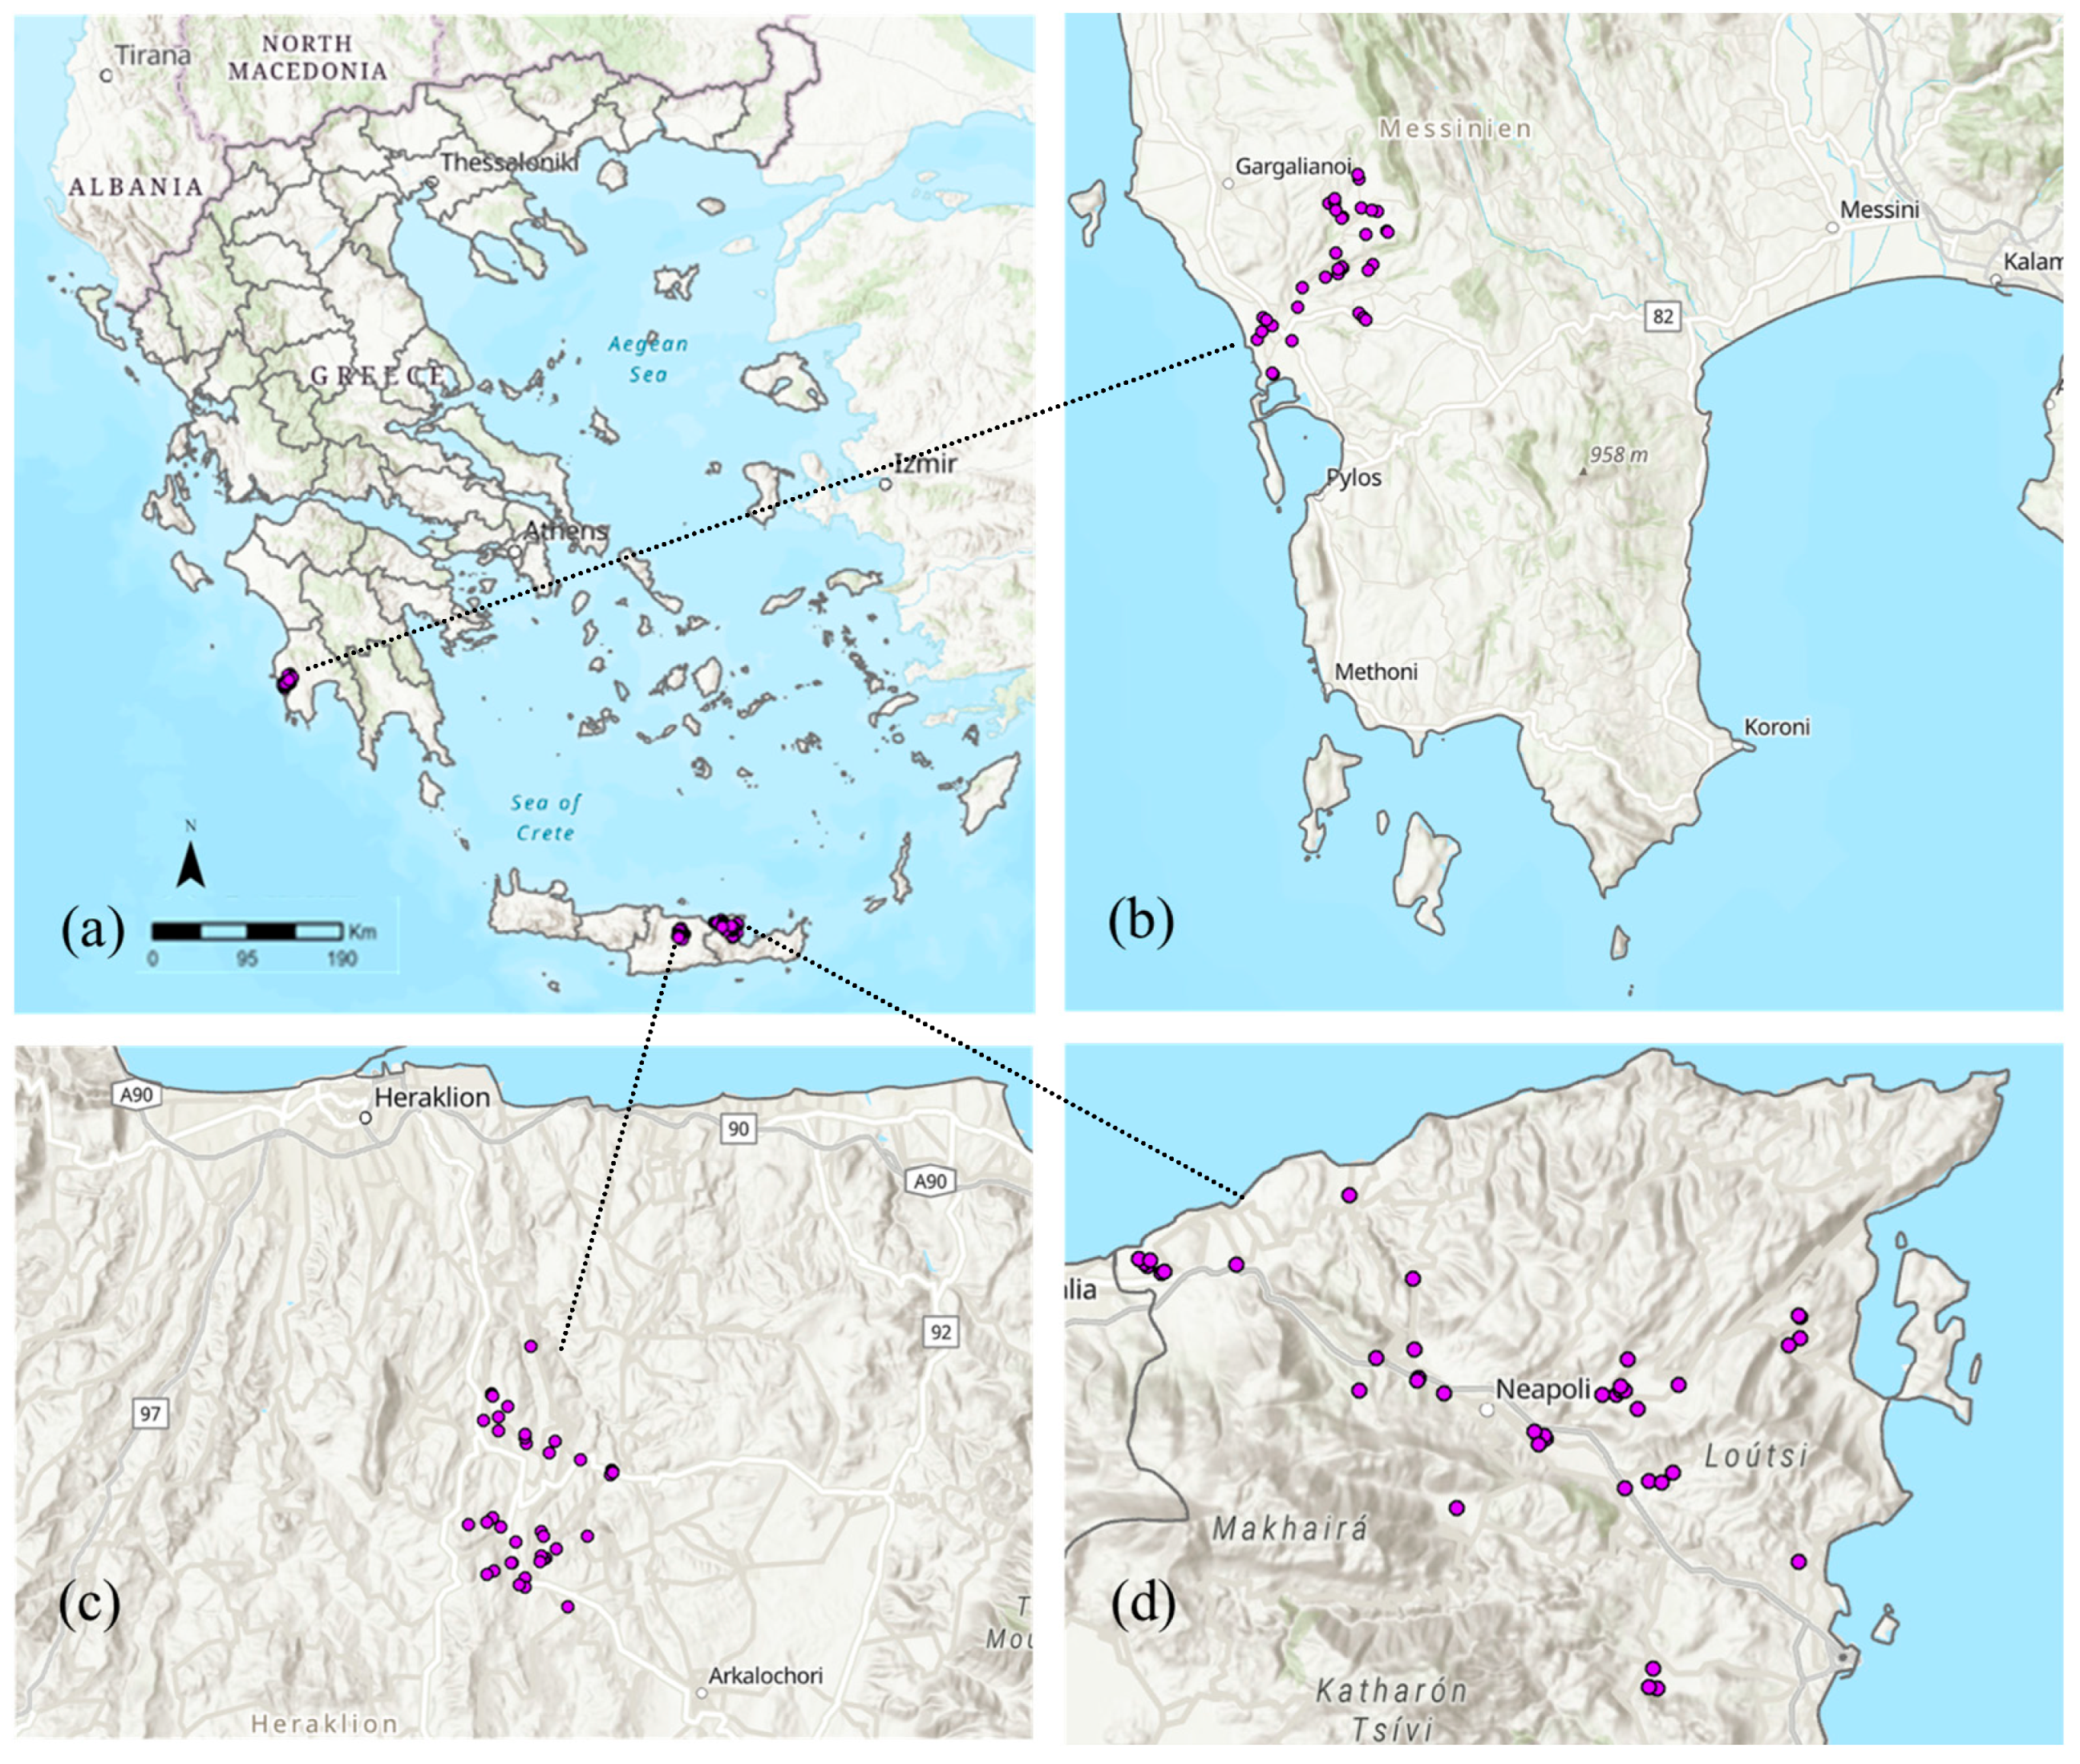
2.1. Study Areas and Data Collection

A survey of one growing season (late February to March) was performed in 116 olive groves with an area ranging from 0.025 to 6.1 ha across three geographical areas in southern Greece: Chora (Regional Unit of Messenia, Peloponnese), Meramvello (Regional Unit of Lasithi, Crete), and Peza (Regional Unit of Heraklion, Crete). Following Emberger’s bioclimatic classification [25], Chora is characterized by sub-humid climatic conditions, while Peza and Meramvello are by semi-arid. The study sites (Figure 1) were selected on the basis of the following criteria: (a) distribution within the studied areas and the landscape’s variability, (b) soil texture and properties, and (c) farming practices/production. The olive trees in the study sites varied in age from 24 to 224 years old, with an average age of 74 years and a median age of 59 years.
Soil properties were determined through soil sampling and subsequent physico-chemical analyses [26]. Soil samples were collected (0–30 cm depth) and each sample consisted of four to eight sub-samples. A zig-zag pattern of sampling was applied to minimize variability in the findings. An average composite sample represented an area of up to 1 ha. After removing the fresh plant debris, the samples were air-dried and passed through a 2-mm sieve. Particle size distribution was determined by the Bouyoucos hydrometer method [27], and pH was measured in a saturated soil paste. Soil carbonates were determined by the volumetric calcimeter method [28]. The method of ammonium acetate (1 N at pH 7) was used for exchangeable cations [29], and cation exchange capacity (CEC) was determined by the ammonium acetate method [30]. A modified wet-digestion Walkley and Black method [31] was used for determination of the organic matter, and plant-available P was determined by the Olsen method [32]. The azomethine–hydrogen method [33] was used to determine plant-available boron (B), while the available forms of Fe, Cu, Zn, and Mn were determined by extraction with 0.005 M diethylene-triamine-penta-acetic acid [34].
For the collection of data concerning the long-term agricultural practices that farmers follow in each of their fields, they were interviewed, and all the relevant information was recorded. It was observed that the farmers used various strategies to manage weeds, which were categorized into five broad groups:
(a)
Untreated olive groves or no treatment (used as the control in the current study)
(b)
Mowing: This involved 1–5 passes (average: 1.26; median: 1) from March to July (primarily in May) to trim weeds to a height of approximately 5 cm above the ground.
(c)
Rotary tiller: Farmers conducted 1–2 passes (with an average of 1.2 and a median of 1) from March to July, mainly in April, at a depth of ≤10 cm.
(d)
Animal grazing: Sheep and goats were used for grazing.
(e)
Herbicide application (glyphosate): This method involved 1–2 sprays (average: 1.2; median: 1) with glyphosate. The application rate of glyphosate varied among the areas due to differences in the targeted weeds and local practicalities [35]. In Chora and Peza, glyphosate was applied in the surveyed sites after the onset of rainfall between February and early April (primarily in March), while in Meramvello province, there was no use of herbicides for weed control.
Data on weed species were collected at the seasonal peak of winter weed vegetation specifically from late February to early March. The survey period was chosen because it provided information on the winter weed species existing prior to the application of the management. Weed sampling was carried out in four randomly selected plots in each olive grove (quadrat size = 1 × 1 m), and the percentage of cover of the winter weed population was estimated visually [23]. Due to the phenological development stage of some weed species at the time of the survey, some of the weeds found were only recorded at the genus level.

2.2. Data Analysis

Weed diversity was estimated from the species richness R (number of species per m2), the Shannon–Wiener index (H), Simpson’s diversity index (λ) and Pielou’s evenness index (J). The H, λ, and J were calculated as described by Travlos et al. [36].
Differences concerning the biodiversity indices (i.e., Shannon’s, Simpson’s, Pielou’s index, and species richness) in the different surveyed regions were tested by analysis of variance (ANOVA) one-factor analyses. Prior to the analyses, all data were tested to ensure compliance with the assumptions of normality (Shapiro–Wilk test) and homoscedasticity (Levene’s test). When the data failed to follow a normal distribution, the analysis was carried out by applying the Kruskal–Wallis (K–W) test. Multiple comparisons were performed using the protected least significant difference (LSD) procedure at p < 0.05. The analyses were conducted using SPSS statistical software (IBM SPSS Statistics for Windows, Version 22.0, IBM Corp. Armonk, New York, NY, USA).
Gradient analyses were performed using the software CANOCO 4.5 for Windows (Biometris, Plant Research International, Wageningen, The Netherlands). Before the analyses, the species data were log-transformed, and the explanatory variables were standardized. Only the species with >10 occurrences were included in the analyses. A pre-test in the form of a detrended correspondence analysis (DCA) was used to decide about the most suitable ordination method using the length of the community composition gradients in units of species turnover as a criterion [37]. The output of the DCA showed that the maximum gradient lengths of the first four axes were all less than 3 (lengths of the gradients: 2.57 for Axis 1; 1.78 for Axis 2; 1.82 for Axis 3; 1.54 for Axis 4), indicating a linear relationship between plant species’ mean cover values and the explanatory variables. Thus, the relationship between weed species’ composition and the explanatory variables was assessed using redundancy analysis (RDA) [37,38]. To detect possible collinear constraints, an initial RDA was undertaken with all the explanatory variables (Table 1). The number of explanatory variables was further decreased by applying the manual forward selection procedure (Monte Carlo permutation tests under the full model; the number of permutations was 999). Only the explanatory variables with p < 0.05 remained in the analysis. The association between weed species’ composition and the different biodiversity indices (i.e., Shannon’s, Simpson’s, Pielou’s evenness index, and species richness) was explored using redundancy analysis (RDA) (999 permutations under the full model) [39].
Similar to the approach of Lososová et al. [40], the marginal (in line with the ‘gross effects’) and conditional effects (in line with the ‘net effects’) of each explanatory variable were assessed using the automatic forward selection procedure, with the best k being equal to the number of variables. According to Lepš and Šmilauer [37], the marginal effect is defined as the independent effect of each environmental variable (i.e., equal to the variation explained in an RDA when the studied variable serves as the only explanatory variable). The conditional effect, on the other hand, is defined as the effect that each variable brings in addition to all the variables already selected.
The variation partitioning procedure followed the concept of Borcard et al. [41] and was based on the methodology provided by Lepš and Šmilauer [37], using a partial RDA. The goal of this procedure is to quantify the effects (and their overlap) of two or more groups of explanatory variables representing some distinct, ecologically interpretable phenomena [37].

3. Results

During the winter weed surveys, in total, 93 weed species or genera belonging to 28 botanical families were recorded. The complete list of all species is shown in the Supplementary Table S1. Oxalis pes-caprae L. was the most dominant weed species in Peza (frequency: 92.5%; mean cover per site: 35.2%) and Meramvello (frequency: 92.5%; mean cover per site: 40.2%). Even though Calendula arvensis had the highest frequency (69.4%) in Chora, Bromus spp. (10.2%) had the highest mean cover.

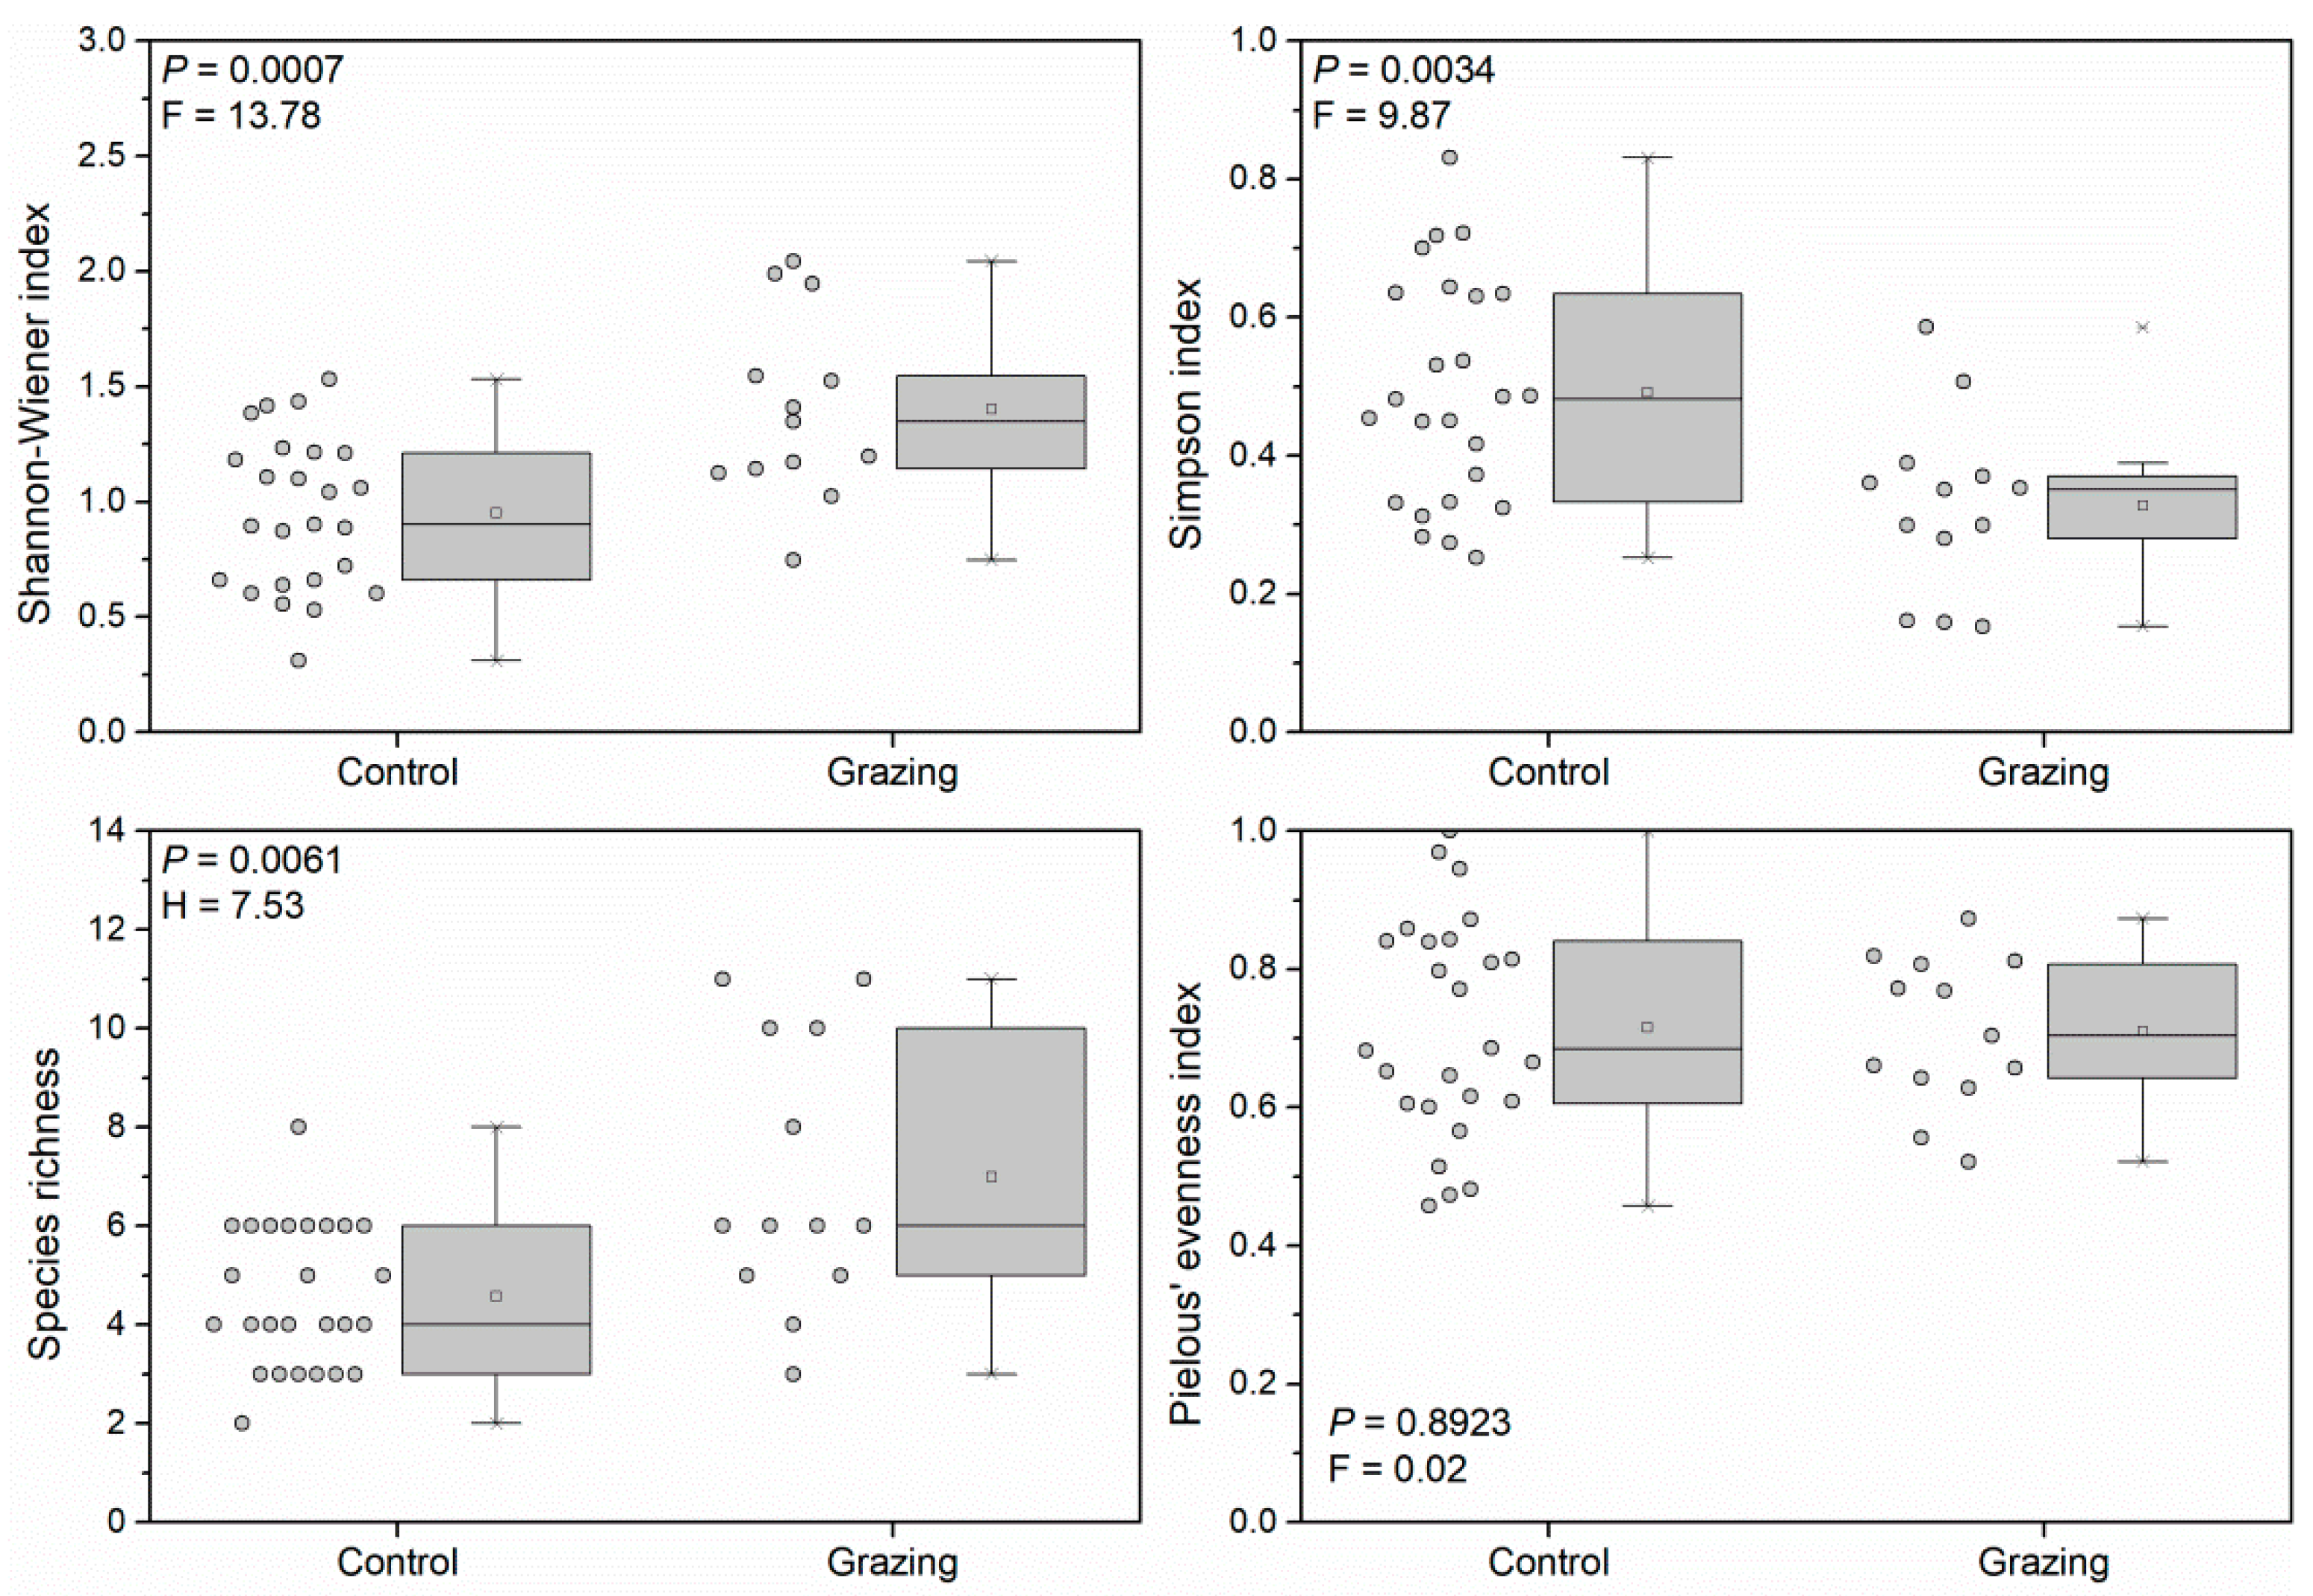
3.1. Responses of Plant Diversity to Weed Management Practices

In Chora, none of the estimated biodiversity indices (i.e., Shannon’s, Simpson’s, Pielou’s evenness index, and species richness) was significantly affected by the weed management practices (Shannon’s index: p = 0.3855; Simpson’s index: Kruskal–Wallis test, p = 0.450; species richness: p = 0.1916; evenness: p = 0.5040) (Figure 2). On the contrary, the weed management strategies adopted in Peza exerted a significant effect on the understory vegetation of olive groves (Shannon’s index: p = 0.0021; Simpson’s index: Kruskal–Wallis test, p = 0.0034; species richness: p = 0.0001; evenness: p = 0.0005). Compared with the control, plant diversity in Peza increased under all weed management treatments, as revealed by Shannon’s index and the species richness. Surprisingly, chemical spraying presented by far the highest values in Shannon’s index and species richness, and the lowest concerning Simpson’s index. Chemical spraying also had the highest value of Pielou’s evenness index but without a statistical difference from the control. Between the mowing and rotary tiller treatments, there were no statistically significant differences.
In the surveyed olive groves of Meramvello, no treatment (control) and grazing were the only weed management practices (Figure 3) applied. Compared with the control, Shannon’s index and species richness under grazing increased by 47.4 and 52.9%, respectively, whereas Simpson’s index decreased by 33.2%. No significant difference was recorded concerning Pielou’s evenness index (p = 0.8923).

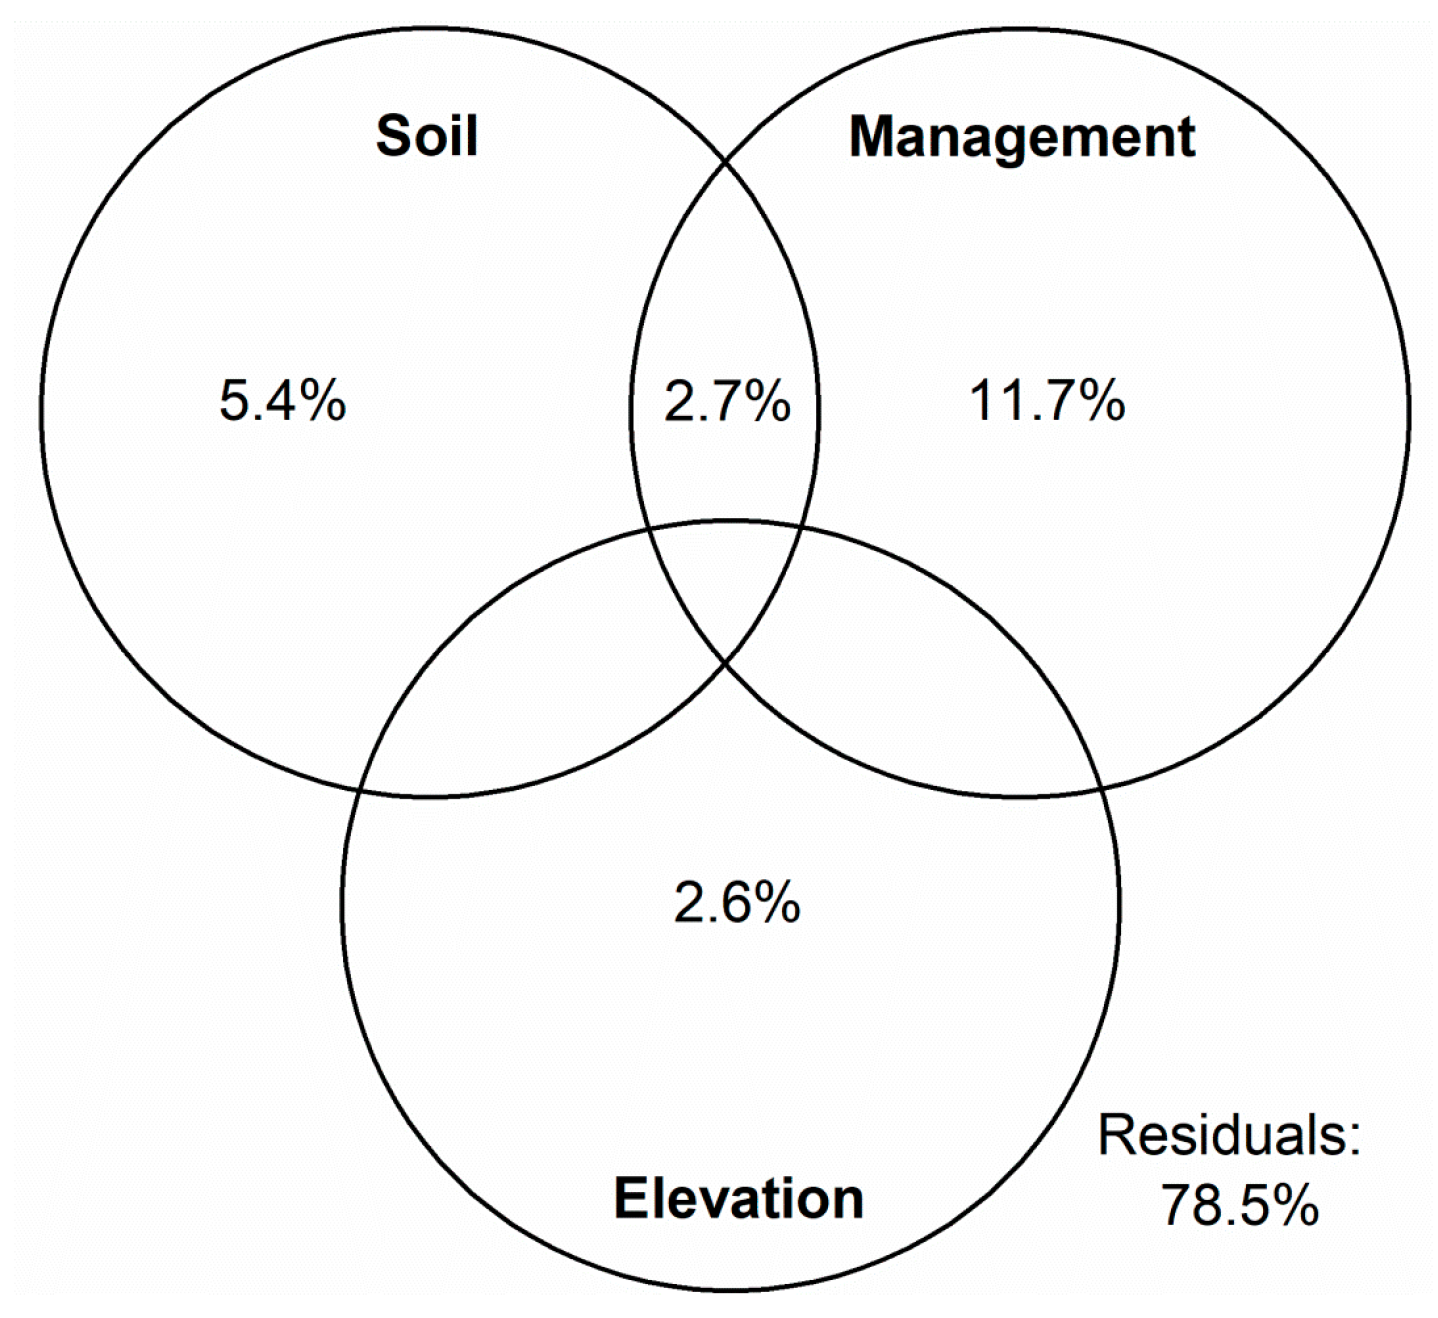
3.2. Factors Affecting the Weed Community’s Composition

The variation in weed species’ composition across the 116 surveyed fields was determined using RDA (Figure 4). The full RDA model, including 27 explanatory variables, explained 36.8% of the variance, whereas the reduced model, comprising eight predictor variables (i.e., soil variables: Mn and Mg; management variables: chemical spraying, mowing, rotary tiller, grazing, and irrigation; elevation) still explained 21.5% of the total variation in weed species’ data (Table 2). The first two RDA axes explained 10.6% and 3.3% of the changes in weed species, respectively. According to their conditional effect, the most important variables influencing weed species’ composition were, in decreasing order, Mn, chemical application or herbicides, mowing, and elevation (Table 3). These four variables together explained 15% of the total variation in weed species’ data. In addition, Mn also had the highest marginal effect. Although SOM, together with chemical spraying and mowing, recorded the second largest marginal effect (4%), it did not qualify for the final model due to the adoption of the 0.05 probability threshold level for entry.
On RDA Axis 1, weed species’ composition was mainly discriminated by Mn (0.50), mowing (0.35), and chemical spraying (−0.32) (Table 3). Oxalis pes-caprae L. and Phelipanche ramosa (L.) Pomel (syn. Orobanche ramosa) showed the highest negative relationship with soil Mn content, as well as a moderate positive association with the rotary tiller practice. In contrast, Calendula arvensis L., Geranium spp., Anthemis arvensis L., Bromus spp., Lolium spp., and Medicago spp. had a clear positive relationship with soil Mn content and were also favored by mowing. The second axis mainly reflected the changes in weed species’ composition due to chemical spraying (0.42) and, to a lesser extent, due to grazing (−0.26), mowing (−0.24), and irrigation (0.21). Ferula communis L., Oxalis pes-caprae L., Vicia spp., and Tordylium apulum L. showed the highest susceptibility to chemical spraying (i.e., glyphosate), whereas Malva sylvestris L., Erodium spp., and Euphorbia spp. had the lowest. Ferula communis L., Vicia spp., Trifolium spp., Tordylium apulum L., and Avena spp. were associated with grazing sites with Mg-rich soils. Oloptum miliaceum and Sinapis spp. were mostly found in irrigated olive groves located at higher altitudes.
Considering that our observations regarding grazing stemmed solely from one of the three surveyed regions (Meramvello), it is advisable to exercise caution when interpreting the outcomes of the gradient analysis (Figure 4; Table 2 and Table 3). Analyzing the data from Meramvello, where grazing was exclusively used, revealed a clear hierarchy among the weed species favored by grazing: Oxalis pes-caprae L. held the highest position (frequency: 84.6%; mean cover: 33.7%), followed by Medicago spp. (frequency: 76.9%; mean cover: 7.6%), Avena spp. (frequency: 69.2%; mean cover: 9.3%), Tordylium apulum L. (frequency: 38.5%; mean cover: 3.2%), and Vicia spp. (frequency: 38.5%; mean cover: 2.5%).
The variation partitioning procedure revealed that the effect of the management variables on weed species’ composition accounted for 2.2 times the variance of the soil variables and 4.5 times the variance of elevation (Figure 5).

3.3. Weed Species’ Composition and Plant Diversity

The relationship between the diversity indices and weed species’ composition using RDA is shown in Figure 6. The Monte Carlo unrestricted permutation test (999 permutations under the full model) indicated that Axis 1 and Axis 2 were statistically significant (trace = 0.168, F = 5.623, p = 0.0010). The RDA model, including four diversity indices (Shannon’s, Simpson’s, Pielou’s evenness index, and species richness) as explanatory variables, explained 16.8% of the total variation in weed species’ data. The first two RDA axes explained 13.7% and 2.1% of the changes in weed species, respectively. The ordination diagram of RDA revealed that the studied weed species (species with >10 occurrences) were mainly differentiated into three distinct groups. The first one, consisting of Oxalis pes-caprae L., Phelipanche ramosa, and Oloptum miliaceum, was associated with high values of the Simpson index and had a clear negative relationship with the Shannon index and species richness. On the contrary, the second group, which included the majority of the recorded weed species (e.g., Anthemis arvensis L., Calendula arvensis L., Geranium spp., etc.), was positively correlated with species richness, Shannon’s index, and Pielou’s evenness index. Finally, the species Ferula communis L. and Galium aparine L. (i.e., the weed species comprising the third group) were located virtually at the origin of both axis scores, highlighting their limited importance as drivers (exerting either a positive or a negative effect) of plant diversity.

4. Discussion

According to Storkey and Neve [42], in any particular crop, a more diversified weed community is less competitive and less susceptible to dominance by highly adapted weed species. Therefore, it serves as an indicator of agronomic and environmental sustainability. Our surveys in the olive groves of Chora and Peza yielded contrasting results regarding the studied biodiversity indices. In Chora, weed species’ diversity and richness were slightly lower (i.e., without statistically significant differences) in herbicide-sprayed sites compared with the mowed, rotary tiller, and control (no treatment) sites, which is consistent with numerous previous studies indicating that the use of glyphosate may negatively affect biodiversity and species richness [15,43,44,45]. This trend, however, was not universal, as was revealed in Peza, where sites with glyphosate spraying presented the highest values of Shannon’s index, species richness, and the evenness index. The explanation for this discrepancy lies in the presence of Oxalis pes-caprae L. It was revealed that Oxalis pes-caprae L. was the most dominant weed species in Peza (Supplementary Table S1) and had a strong negative relationship with Shannon’s index and species richness (Figure 6). Indeed, the negative effect of Oxalis pes-caprae L. on species richness and diversity is well established [46,47,48,49]. Petsikos et al. [47] have found that olive groves invaded by Oxalis pes-caprae L. were not species-poor at the beginning of the vegetative period but became monospecific a few months after its germination. In line with previous evidence [49], our results also point in the direction that the use of glyphosate can lead to a significant decrease in the cover of Oxalis pes-caprae L. (Figure 4) and, in turn, to the recovery of weed species’ diversity and richness. Surprisingly, Phelipanche ramosa also showed a negative association or correlation with weed species’ diversity and richness (Figure 6). This finding reflects the close relationship between Phelipanche ramosa and Oxalis pes-caprae L. because the latter serves as a host for the former [50].
As has been shown by previous studies [45,51], there are ‘winners’ and ‘losers’ among weed species after glyphosate applications. We found that the species group that was, from a relative perspective, promoted by the application of glyphosate mainly included the species Malva sylvestris L., Erodium spp., and Euphorbia spp. (Figure 4). Although resistance against glyphosate-based herbicides has not been reported for these species [52], there are reports from Greece [53] and France [15] indicating the reduced efficacy of glyphosate against Malva sylvestris L. Regarding Erodium spp. and Euphorbia spp., previous evidence suggests that annual life forms and longer flowering periods can serve as adaptation traits to chemical disturbances because they increase the probability of escaping extinction caused by herbicide applications [54]. More recent research [55] has shown that Euphorbia helioscopia L. (this was the main species of the genus Euphorbia recorded in the present study) has considerable plasticity in terms of its morpho-anatomical and physiological features in response to herbicide applications, which, in turn, enables it to survive after herbicide treatments.
According to MacLaren et al. [44], mowing does not remove all biomass and, therefore, it is more likely to favor species that conserve resources for recovery, as well as to select directly against tall species [56]. Our study provided additional support for this theory by demonstrating that mowing was advantageous for Medicago spp. and several annual plant species with low height, such as Anthemis arvensis L., Calendula arvensis L., and Geranium spp. It is also well known that mowing’s effectiveness can be affected either by the weeds’ developmental stage (i.e., it must be carried out before viable seeds have been produced) or by the fact that some of the heads are short and missed by the mower [57,58]. We also found that mowing was associated with grass species, such as Lolium spp. and Bromus spp., which is in line with previous research in France [16] and Italy [43]. It seems that the positive relationship between mowing and grass species can be attributed either to their ability to form new tillers from the crown after cutting or to the fact that mowing can be a potential means of the spread of seeds [59]. Recent research has indicated that mowing, compared with spraying herbicide and tillage, promotes the growth of perennial weeds but does not favor short-lived weeds [21].
The effects of livestock on the diversity of flora have been contradictory, as there have been cases with positive, neutral, and negative effects [60,61]. We showed that according to the agro-ecological and anthropogenic filters of the surveyed olive groves, grazing had a clear positive effect on weed species’ diversity and richness (Figure 3), which is in line with previous research [62,63]. In a comprehensive meta-analysis based on 197 studies from all major regions of the world, Díaz et al. [64] demonstrated that grazing favored annual over perennial plants, short plants over tall plants, prostrate over erect plants, and stoloniferous and rosette architectures over a tussock architecture. Our study showed that grazing favored both perennial and annual plant species, as well as plants with low height. Nonetheless, the influence of livestock’s selective foraging behavior must also be acknowledged in shaping the weed species’ composition [65,66].
Of the 27 variables used to describe the ecological niche in the analysis, eight were significant and explained 21.5% of the total variation in the weed species’ data. The effect of the predictor variables (i.e., site, soil, meteorological and management parameters) on weed species’ composition under the farms’ conditions is quite variable in the literature, depending on the scale of the studies (i.e., farm level vs. regional level vs. country level), the location, crops, weed species, the type and range of explanatory variables, and methods of data collection. It has been found that the use of such variables in gradient analyses was able to explain from 4.6–19.15% [9,15,22,45,67,68] to 25.2–42.4% [23,24,69,70] of the variance in weed species’ composition.
A growing body of literature [22,23,24] suggests that environmental factors are always more important than management practices in explaining the variance in weed species’ composition. However, our study did not support this assumption. We found that management variables outperformed the soil variables and the effect of elevation. In fact, the effect of management variables on weed species’ composition accounted for 1.5 times the variance of the cumulative effect of elevation and the soil variables (Figure 5). Still, there was a degree of uncertainty surrounding the actual effect of the environmental factors in our study because our analysis only partially included the climatic conditions of the surveyed olive groves (i.e., only through elevation).
What is new is that of all explanatory variables, the soil Mn concentration was identified as the most influential one, highlighting the importance of soil micronutrients in determining the weed species’ composition. This is in line with Korres et al. [71], who found that particular soil micronutrients were highly associated with the occurrence of most weed species examined.
The availability of micronutrients to plants is affected by several soil properties, especially the pH, calcium carbonate, and the SOM. SOM and CaCO3 are the sites of Mn retention in calcareous soils [72,73]. In particular, CaCO3 has a strong negative effect on the uptake of Mn, attributable to the immobilization of the divalent cations through adsorption and precipitation, or the formation of manganocalcite. Both reactions are favored by a high pH [73]. This is reflected in most of the studied soils, which have increased CaCO3 content and low Mn availability (48.5%). In soils of the Peza and Chora study areas, a higher CaCO3 content (mean: 46.37 and 26.88%, respectively) was associated with lower Mn availability (5.20 and 9.41 mg/kg, respectively) (Table 1). This was not verified in the Meramvello study area, possibly due to the higher SOM (4.19% versus 3.32% and 2.44% in Peza and Chora, respectively), which acts as a source of nutrients for the weeds, increasing the water-soluble and exchangeable forms of most micronutrients in the soil [72]. Moreover, the increased content of CaCO3 in most of the studied soils indicated the low availability of phosphorus and a possible iron deficiency. Indeed, 46% of the soil samples were found to have a low concentration of assimilable phosphorus. There was also a problem with the available manganese (48.5%). As soil pH falls to the vicinity of 5.5, Mg has been shown to precipitate, possibly as a mixture of Al and Mg double hydroxide, or as poorly ordered Mg silicate, rendering it less soluble and available to plants [70]. Carron (1991) observed Ca-induced Mg deficiency in pot-grown clover (Trifolium repens L.) when the ratio of exchangeable Ca to exchangeable Mg exceeded 20 [73]. The ratio of exchangeable Ca to exchangeable Mg for the soils in the Peza and Chora study areas exceeded 28 and 22, respectively, confirming the Mg deficiency. The low availability of exchangeable potassium (7%) in most soil samples was also apparent, while a small percentage of samples with a low boron content were observed. Finally, Zn deficiency was observed, mainly in the Peza and Chora study areas with the highest Ca concentrations and higher pH values compared with the soils of the Meramvello study area. These findings reinforce the results of other research which reported that the solubility of Zn in the soil solution decreases exponentially with increasing Ca concentrations and pH values [74,75].
The low predictive performance of pH in our study, despite the relatively wide range of pH values among the surveyed sites (Table 1), was similar to that in previous studies, demonstrating the low influence of pH on vegetation in some cases [9,76]. It has also been suggested that pH is not necessarily a soil property that determines weeds’ distribution per se; however, it can affect the availability of plant nutrients [77].
The effect of SOM on weed species’ composition remains debatable. Although SOM showed the second highest marginal effect (Table 3), the manual forward selection procedure still excluded it from the final model. According to Lepš and Šmilauer [37], if the variables in a group are closely correlated, then only a limited number of them are selected by the manual forward selection procedure. To shed more light on this hypothesis, we cross-checked our data and found a medium association between SOM and Zn (r = 0.52) which explained the exclusion of SOM from the final model.

5. Conclusions

Despite possible constraints, the present study provided further insight into the factors determining winter weed species’ diversity and composition in Greek olive groves. Firstly, we assessed the unique effect of the standard weed management practices used in Greek olive groves on sustaining the biodiversity of flora. Although our results confirmed that glyphosate use may lower biodiversity and species richness, it was also shown that this trend was not universal. In fact, the negative influence of the presence of Oxalis pes-caprae L. on species richness and diversity far outweighed the effect of spraying glyphosate.
Variation partitioning revealed that the effect of the management variables on weed species’ composition accounted for 1.5 times the variance of the cumulative effect of elevation and the soil variables. Among the 27 variables used to describe the ecological niche, eight (i.e., Mn, Mg, chemical spraying, mowing, rotary tiller, grazing, irrigation, and elevation) were significant and explained 21.5% of the total variation in weed species’ data. What is new is that of all the explanatory variables, the soil Mn concentration was identified as the most influential one, highlighting the importance of soil micronutrients on weed species’ composition. The present findings contribute to the enhancement of optimal management strategies in olive groves that can sustain the biodiversity of flora and, in turn, provide various ecosystem services to agro-ecosystems.

Supplementary Materials

The following supporting information can be downloaded at https://www.mdpi.com/article/10.3390/agronomy14030640/s1. Table S1: Species recorded in the study sites, frequencies of occurrence, means, and standard deviations (SD).

Author Contributions

Conceptualization, E.H., G.A., A.P. and E.M.; data curation, P.V. and M.G.; formal analysis, P.V. and M.G.; investigation, A.A. (Antigoni Akrivou), E.H., G.A. and A.P.; methodology, D.C., A.A. (Antigoni Akrivou), E.H., G.A. and A.P.; project administration, A.A. (Antigoni Akrivou) and E.M.; resources, E.M.; supervision, D.C. and E.M.; validation, D.C., E.K., M.G., A.A. (Apostolia Argiri), A.M. and I.M.; visualization, P.V. and M.G.; writing—original draft, P.V. and A.A. (Antigoni Akrivou); writing—review and editing, D.C., E.K., M.G., A.A. (Apostolia Argiri), A.M., E.H., G.A., A.P., I.M. and E.M. All authors have read and agreed to the published version of the manuscript.

Funding

This research was funded by the European Commission under the contract LIFE09 ENV/GR/000302: SAGE10 Project ‘Establishment of impact assessment procedure as the tool for the sustainability of agro-ecosystem: the case of Mediterranean olives’.

Data Availability Statement

Restrictions apply to the availability of these data. Data were obtained under the EC LIFE09 ENV/GR/000302 project.

Acknowledgments

The authors would like to thank the Nileas Producers’ Group; the Agricultural Cooperatives of Peza and Meramvello for allowing authors to conduct the experiments in their fields; and Sophia Lymperopoulou and Vaios Stathis, technical assistants at the Benaki Phytopathological Institute.

Conflicts of Interest

The authors declare no conflicts of interest.

References

  1. Schumacher, M.; Dieterich, M.; Gerhards, R. Effects of weed biodiversity on the ecosystem service of weed seed predation along a farming intensity gradient. Glob. Ecol. Conserv. 2020, 24, e01316. [Google Scholar] [CrossRef]
  2. Gerowitt, B.; Bàrberi, P.; Darmency, H.; Petit, S.; Storkey, J.; Westerman, P. Weeds and Biodiversity. In Weed Research; John Wiley & Sons: Hoboken, NJ, USA, 2017; pp. 115–147. [Google Scholar]
  3. Fried, G.; Norton, L.R.; Reboud, X. Environmental and management factors determining weed species composition and diversity in France. Agric. Ecosyst. Environ. 2008, 128, 68–76. [Google Scholar] [CrossRef]
  4. Loumou, A.; Giourga, C. Olive groves: “The life and identity of the Mediterranean”. Agric. Hum. Values 2003, 20, 87–95. [Google Scholar] [CrossRef]
  5. Fernández-Zamudio, M.A.; De Miguel, M.D. Sustainable management for woody crops in Mediterranean dry-lands. Span. J. Agric. Res. 2006, 4, 111. [Google Scholar] [CrossRef]
  6. Allen, H.D.; Randall, R.E.; Amable, G.S.; Devereux, B.J. The impact of changing olive cultivation practices on the ground flora of olive groves in the Messara and Psiloritis regions, Crete, Greece. Land Degrad. Dev. 2006, 17, 249–273. [Google Scholar] [CrossRef]
  7. Morgado, R.; Ribeiro, P.F.; Santos, J.L.; Rego, F.; Beja, P.; Moreira, F. Drivers of irrigated olive grove expansion in Mediterranean landscapes and associated biodiversity impacts. Landsc. Urban Plan. 2022, 225, 104429. [Google Scholar] [CrossRef]
  8. Huqi, B.; Dhima, K.; Vasilakoglou, I.; Keco, R.; Salaku, F. Weed flora and weed management in established olive groves in Albania. Weed Biol. Manag. 2009, 9, 276–285. [Google Scholar] [CrossRef]
  9. Nagy, K.; Lengyel, A.; Kovács, A.; Türei, D.; Csergő, A.M.; Pinke, G. Weed species composition of small-scale farmlands bears a strong crop-related and environmental signature. Weed Res. 2018, 58, 46–56. [Google Scholar] [CrossRef]
  10. Bopp, M.-C.; Kazakou, E.; Metay, A.; Fried, G. Relative importance of region, seasonality and weed management practice effects on the functional structure of weed communities in French vineyards. Agric. Ecosyst. Environ. 2022, 330, 107892. [Google Scholar] [CrossRef]
  11. Solomou, A.D.; Sfougaris, A.I.; Kalburtji, K.L.; Nanos, G.D. Effects of Organic Farming on Winter Plant Composition, Cover and Diversity in Olive Grove Ecosystems in Central Greece. Commun. Soil Sci. Plant Anal. 2013, 44, 312–319. [Google Scholar] [CrossRef]
  12. Simoes, M.P.; Belo, A.F.; Pinto-Cruz, C.; Pinheiro, A.C. Natural vegetation management to conserve biodiversity and soil water in olive orchards. Span. J. Agric. Res. 2014, 12, 633. [Google Scholar] [CrossRef]
  13. Solomou, A.D.; Sfougaris, A. Contribution of Agro-Environmental Factors to Yield and Plant Diversity of Olive Grove Ecosystems (Olea europaea L.) in the Mediterranean Landscape. Agronomy 2021, 11, 161. [Google Scholar] [CrossRef]
  14. Terzi, M.; Barca, E.; Cazzato, E.; D’amico, F.S.; Lasorella, C.; Fracchiolla, M. Effects of Weed Control Practices on Plant Diversity in a Homogenous Olive-Dominated Landscape (South-East of Italy). Plants 2021, 10, 1090. [Google Scholar] [CrossRef] [PubMed]
  15. Fried, G.; Cordeau, S.; Metay, A.; Kazakou, E. Relative importance of environmental factors and farming practices in shaping weed communities structure and composition in French vineyards. Agric. Ecosyst. Environ. 2019, 275, 1–13. [Google Scholar] [CrossRef]
  16. Fried, G.; Blanchet, C.; Cazenave, L.; Bopp, M.-C.; Kazakou, E.; Metay, A.; Christen, M.; Alard, D.; Cordeau, S. Consistent response of weeds according to Grime’s CSR strategies along disturbance and resource gradients in Bordeaux vineyards. Weed Res. 2022, 62, 347–359. [Google Scholar] [CrossRef]
  17. Popolizio, S.; Vivaldi, G.A.; Camposeo, S. Different Weed Managements Influence the Seasonal Floristic Composition in a Super High-Density Olive Orchard. Plants 2023, 12, 2921. [Google Scholar] [CrossRef] [PubMed]
  18. Carpio, A.J.; Lora, A.; Martin-Consuegra, E.; Sanchez-Cuesta, R.; Tortosa, F.S.; Castro, J. The influence of the soil management systems on aboveground and seed bank weed communities in olive orchards. Weed Biol. Manag. 2020, 20, 12–23. [Google Scholar] [CrossRef]
  19. Pereira, A.J.; Porto, M.; Correia, O.; Beja, P. Traditional ploughing is critical to the conservation of threatened plants in Mediterranean olive groves. Agric. Ecosyst. Environ. 2024, 359, 108775. [Google Scholar] [CrossRef]
  20. Sánchez-Moreno, S.; Castro, J.; Alonso-Prados, E.; Alonso-Prados, J.L.; García-Baudín, J.M.; Talavera, M.; Durán-Zuazo, V.H. Tillage and herbicide decrease soil biodiversity in olive orchards. Agron. Sustain. Dev. 2015, 35, 691–700. [Google Scholar] [CrossRef]
  21. Lisek, J. Diversity of Summer Weed Communities in Response to Different Plum Orchard Floor Management in-Row. Agronomy 2023, 13, 1421. [Google Scholar] [CrossRef]
  22. De Mol, F.; von Redwitz, C.; Gerowitt, B. Weed species composition of maize fields in Germany is influenced by site and crop sequence. Weed Res. 2015, 55, 574–585. [Google Scholar] [CrossRef]
  23. Pinke, G.; Blazsek, K.; Magyar, L.; Nagy, K.; Karácsony, P.; Czúcz, B.; Botta-Dukát, Z. Weed species composition of conventional soyabean crops in Hungary is determined by environmental, cultural, weed management and site variables. Weed Res. 2016, 56, 470–481. [Google Scholar] [CrossRef]
  24. Pinke, G.; Karácsony, P.; Czúcz, B.; Botta-Dukát, Z. When herbicides don’t really matter: Weed species composition of oil pumpkin (Cucurbita pepo L.) fields in Hungary. Crop. Prot. 2018, 110, 236–244. [Google Scholar] [CrossRef]
  25. Emberger, F. Bioclomatic Map of the Mediterranean Zone; UNESCO-FAO: Paris, France, 1963. [Google Scholar]
  26. Karyotis, T.; Arampatzis, G.; Panagopoulos, A.; Hatzigiannakis, E.; Tziritis, E.; Karyoti, K.; Vrouchakis, J. Nutrients, trace elements and water deficit in Greek soils cultivated with olive trees. EQA Int. J. Environ. Qual. 2014, 13, 9–20. [Google Scholar] [CrossRef]
  27. Gee, G.W.; Bauder, J.W. Particle Size Analysis by Hydrometer: A Simplified Method for Routine Textural Analysis and a Sensitivity Test of Measurement Parameters. Soil Sci. Soc. Am. J. 1979, 43, 1004–1007. [Google Scholar] [CrossRef]
  28. Allison, L.E.; Moodie, C.D. Carbonate. In Methods of Soil Analysis, Part 2; Black, C.A., Angle, J.S., Weaver, R.W., Eds.; Monograph 9; American Society of Agronomy: Madison, WI, USA, 1965; pp. 1379–1400. [Google Scholar]
  29. Thomas, G. Exchangeable Cations. In Methods of Soil Analysis, Part 2; Page, A.L., Miller, R.H., Keeney, D.R., Eds.; Book Series 9; American Society of Agronomy: Madison, WI, USA, 1982; pp. 159–164. [Google Scholar]
  30. Rhoades, J.D. Cation Exchange Capacity. In Methods of Soil Analysis; Agronomy Monographs; Wiley: Hoboken, NJ, USA, 2015; pp. 149–157. [Google Scholar]
  31. Nelson, D.W.; Sommers, L.E. Total carbon, organic carbon, and organic matter. In Methods of Soil Analysis: Part 3; SSSA Book Series; Wiley: Hoboken, NJ, USA, 2018; pp. 961–1010. [Google Scholar]
  32. Olsen, K.M.; Gould, S.A.; Patience, J.F. A comparison of the release of phosphorus by a phytase enzyme in pigs fed diets deficient or adequate in phosphorus content. J. Anim. Sci. 2021, 99, skab001. [Google Scholar] [CrossRef]
  33. Keren, R. Boron: Soil Contaminant. In Managing Global Resources and Universal Processes; CRC Press: Boca Raton, FL, USA, 2020; pp. 175–180. [Google Scholar]
  34. Lindsay, W.; Norvell, W. Development of a DTPA Soil Test Zinc, Iron, Manganese and Copper. Soil Sci. Soc. Am. J. 1978, 4, 421–428. [Google Scholar] [CrossRef]
  35. Karanasios, E.; Karasali, H.; Marousopoulou, A.; Akrivou, A.; Markellou, E. Monitoring of glyphosate and AMPA in soil samples from two olive cultivation areas in Greece: Aspects related to spray operators activities. Environ. Monit. Assess. 2018, 190, 361. [Google Scholar] [CrossRef] [PubMed]
  36. Travlos, I.S.; Cheimona, N.; Roussis, I.; Bilalis, D.J. Weed-Species Abundance and Diversity Indices in Relation to Tillage Systems and Fertilization. Front. Environ. Sci. 2018, 6, 11. [Google Scholar] [CrossRef]
  37. Leps, J.; Smilauer, P. Multivariate Analysis of Ecological Data Using CANOCO; Cambridge University Press: Cambridge, UK, 2010. [Google Scholar] [CrossRef]
  38. Ter Braak, C.J.F.; Prentice, I.C. A Theory of Gradient Analysis. In Advances in Ecological Research; Elsevier: Amsterdam, The Netherlands, 1988; pp. 271–317. [Google Scholar]
  39. Kawanza, S.; Ndagurwa, H.G.T.; Chateya, R.J.; Muvengwi, J. Jointed cactus Opuntia aurantiaca modifies soil nutrient concentrations, grass species assemblage and biomass yield in a savanna rangeland. Acta Oecol. 2019, 101, 103477. [Google Scholar] [CrossRef]
  40. Lososová, Z.; Chytrý, M.; Cimalová, S.; Kropáč, Z.; Otýpková, Z.; Pyšek, P.; Tichý, L. Weed vegetation of arable land in Central Europe: Gradients of diversity and species composition. J. Veg. Sci. 2004, 15, 415–422. [Google Scholar] [CrossRef]
  41. Borcard, D.; Legendre, P.; Drapeau, P. Partialling out the Spatial Component of Ecological Variation. Ecology 1992, 73, 1045–1055. [Google Scholar] [CrossRef]
  42. Storkey, J.; Neve, P. What good is weed diversity? Weed Res. 2018, 58, 239–243. [Google Scholar] [CrossRef] [PubMed]
  43. Fracchiolla, M.; Terzi, M.; Frabboni, L.; Caramia, D.; Lasorella, C.; De Giorgio, D.; Montemurro, P.; Cazzato, E. Influence of different soil management practices on ground-flora vegetation in an almond orchard. Renew. Agric. Food Syst. 2016, 31, 300–308. [Google Scholar] [CrossRef]
  44. MacLaren, C.; Bennett, J.; Dehnen-Schmutz, K. Management practices influence the competitive potential of weed communities and their value to biodiversity in South African vineyards. Weed Res. 2019, 59, 93–106. [Google Scholar] [CrossRef]
  45. Andert, S.; de Mol, F.; Koning, L.; Gerowitt, B. Weed response in winter wheat fields on a gradient of glyphosate use in the recent past. Agric. Ecosyst. Environ. 2022, 333, 107977. [Google Scholar] [CrossRef]
  46. Vilà, M.; Tessier, M.; Suehs, C.M.; Brundu, G.; Carta, L.; Galanidis, A.; Lambdon, P.; Manca, M.; Médail, F.; Moragues, E.; et al. Local and regional assessments of the impacts of plant invaders on vegetation structure and soil properties of Mediterranean islands. J. Biogeogr. 2006, 33, 853–861. [Google Scholar] [CrossRef]
  47. Petsikos, C.; Dalias, P.; Troumbis, A.Y. Effects of Oxalis pes-caprae L. invasion in olive groves. Agric. Ecosyst. Environ. 2007, 120, 325–329. [Google Scholar] [CrossRef]
  48. Vilà, M.; Gimeno, I. Does invasion by an alien plant species affect the soil seed bank? J. Veg. Sci. 2007, 18, 423–430. [Google Scholar] [CrossRef]
  49. Lazzaro, L.; Ferretti, G.; Bianchi, E.; Benesperi, R. Treatment by glyphosate-based herbicide allowed recovering native species after Oxalis pes-caprae L. invasion: Indications from a Mediterranean island. Plant Biosyst. 2019, 153, 651–659. [Google Scholar] [CrossRef]
  50. Thorogood, C.J.; Rumsey, F.J.; Hiscock, S.J. Seed viability determination in parasitic broomrapes (Orobanche and Phelipanche) using fluorescein diacetate staining. Weed Res. 2009, 49, 461–468. [Google Scholar] [CrossRef]
  51. Koning, L.A.; de Mol, F.; Gerowitt, B. Effects of management by glyphosate or tillage on the weed vegetation in a field experiment. Soil Tillage Res. 2019, 186, 79–86. [Google Scholar] [CrossRef]
  52. Heap, I. The International Herbicide-Resistant Weed Database. 2022. Available online: http://www.weedscience.org (accessed on 25 October 2022).
  53. Travlos, I.; Lysandrou, M.; Apostolidis, V. Efficacy of the herbicide GF-2581 (penoxsulam + florasulam) against broadleaf weeds in olives. Plant Soil Environ. 2014, 60, 574–579. [Google Scholar] [CrossRef]
  54. Juárez-Escario, A.; Conesa, J.A.; Solé-Senan, X.O. Management as a driver of functional patterns and alien species prominence in weed communities of irrigated orchards in Mediterranean areas. Agric. Ecosyst. Environ. 2017, 249, 247–255. [Google Scholar] [CrossRef]
  55. Iftikhar, M.; Ahmad, I.; Hameed, M.; Fatima, S.; Ahmad, F.; Ashraf, M.; Nazish, Z.; Ahmad, M.S.A.; Muneeb, A. Structural and functional responses in sun spurge (Euphorbia helioscopia L.) against post-emergence herbicides in wheat (Triticum aestivum L.). Weed Res. 2021, 61, 126–136. [Google Scholar] [CrossRef]
  56. Gago, P.; Cabaleiro, C.; García, J. Preliminary study of the effect of soil management systems on the adventitious flora of a vineyard in northwestern Spain. Crop. Prot. 2007, 26, 584–591. [Google Scholar] [CrossRef]
  57. Monaco, T.J.; Weller, S.C.; Ashton, F.M. Weed Science: Principles and Practices, 4th ed.; John Wiley & Sons: New York, NY, USA, 2002. [Google Scholar]
  58. Zimdahl, R.L. Fundamentals of Weed Science, 3rd ed.; Elsevier: New York, NY, USA, 2007. [Google Scholar]
  59. Hussain, M.; Farooq, S.; Merfield, C.; Jabran, K. Mechanical weed control. In Non-Chemical Weed Control; Jabran, K., Chauhan, B.S., Eds.; Elsevier: Amsterdam, The Netherlands, 2018; pp. 133–155. [Google Scholar] [CrossRef]
  60. Huaranca, J.C.; Novaro, A.J.; Valdivia, C.E. Effects of livestock grazing on biodiversity: A meta-analysis on three trophic levels. J. Nat. Conserv. 2022, 66, 126126. [Google Scholar] [CrossRef]
  61. Woldu, Z.; Saleem, M.A.M. Grazing induced biodiversity in the highland ecozone of East Africa. Agric. Ecosyst. Environ. 2000, 79, 43–52. [Google Scholar] [CrossRef]
  62. Schuster, M.Z.; Pelissari, A.; de Moraes, A.; Harrison, S.K.; Sulc, R.M.; Lustosa, S.B.C.; Anghinoni, I.; Carvalho, P.C.F. Grazing intensities affect weed seedling emergence and the seed bank in an integrated crop–livestock system. Agric. Ecosyst. Environ. 2016, 232, 232–239. [Google Scholar] [CrossRef]
  63. Díaz, S.; Lavorel, S.; McIntyre, S.; Falczuk, V.; Casanoves, F.; Milchunas, D.G.; Skarpe, C.; Rusch, G.; Sternberg, M.; NOY-Meir, I.; et al. Plant trait responses to grazing? a global synthesis. Glob. Change Biol. 2007, 13, 313–341. [Google Scholar] [CrossRef]
  64. Baumont, R.; Prache, S.; Meuret, M.; Morand-Fehr, P. How forage characteristics influence behaviour and intake in small ruminants: A review. Livest. Prod. Sci. 2000, 64, 15–28. [Google Scholar] [CrossRef]
  65. Egea, A.V.; Allegretti, L.; Lama, S.P.; Grilli, D.; Sartor, C.; Fucili, M.; Guevara, J.; Passera, C. Selective behavior of Creole goats in response to the functional heterogeneity of native forage species in the central Monte desert, Argentina. Small Rumin. Res. 2014, 120, 90–99. [Google Scholar] [CrossRef]
  66. Nowak, A.; Nowak, S.; Nobis, M.; Nobis, A. Crop type and altitude are the main drivers of species composition of arable weed vegetation in Tajikistan. Weed Res. 2015, 55, 525–536. [Google Scholar] [CrossRef]
  67. Adeux, G.; Yvoz, S.; Biju-Duval, L.; Cadet, E.; Farcy, P.; Fried, G.; Guillemin, J.-P.; Munier-Jolain, N.; Petit, S.; Cordeau, S.; et al. Cropping system diversification does not always beget weed diversity. Eur. J. Agron. 2022, 133, 126438. [Google Scholar] [CrossRef]
  68. Pinke, G.; Pál, R.W.; Tóth, K.; Karácsony, P.; Czúcz, B.; Botta-Dukát, Z. Weed vegetation of poppy (Papaver somniferum) fields in Hungary: Effects of management and environmental factors on species composition. Weed Res. 2011, 51, 621–630. [Google Scholar] [CrossRef]
  69. Ulber, L.; Steinmann, H.-H.; Klimek, S.; Isselstein, J. An on-farm approach to investigate the impact of diversified crop rotations on weed species richness and composition in winter wheat. Weed Res. 2009, 49, 534–543. [Google Scholar] [CrossRef]
  70. Korres, N.E.; Norsworthy, J.K.; Brye, K.R.; Skinner, V., Jr.; Mauromoustakos, A. Relationships between soil properties and the occurrence of the most agronomically important weed species in the field margins of eastern Arkansas—Implications for weed management in field margins. Weed Res. 2017, 57, 159–171. [Google Scholar] [CrossRef]
  71. Peng, Z.; Liu, Y.; An, Y.; Wang, Z.; Li, X.; Gao, H.; Wei, G.; Jiao, S. Contrasting patterns and drivers of soil micronutrient availability in paddy and maize fields of eastern China. Geoderma 2023, 431, 116342. [Google Scholar] [CrossRef]
  72. Dhaliwal, S.S.; Naresh, R.K.; Mandal, A.; Singh, R.; Dhaliwal, M. Dynamics and transformations of micronutrients in agricultural soils as influenced by organic matter build-up: A review. Environ. Sustain. Indic. 2009, 1–2, 100007. [Google Scholar] [CrossRef]
  73. Available online: https://dzumenvis.nic.in/Microbes%20and%20Metals%20Interaction/pdf/Soil%20acidification%20and%20liming.pdf (accessed on 27 December 2023).
  74. Gransee, A.; Führs, H. Magnesium mobility in soils as a challenge for soil and plant analysis, magnesium fertilization and root uptake under adverse growth conditions. Plant Soil 2013, 368, 5–21. [Google Scholar] [CrossRef]
  75. Moreno-Lora, A.; Delgado, A. Factors determining Zn availability and uptake by plants in soils developed under Mediterranean climate. Geoderma 2020, 376, 114509. [Google Scholar] [CrossRef]
  76. Cimalová, Š.; Lososová, Z. Arable weed vegetation of the northeastern part of the Czech Republic: Effects of environmental factors on species composition. Plant Ecol. 2009, 203, 45–57. [Google Scholar] [CrossRef]
  77. Walter, A.M.; Christensen, S.; Simmelsgaard, S.E. Spatial correlation between weed species densities and soil properties. Weed Res. 2002, 42, 26–38. [Google Scholar] [CrossRef]
Figure 1. Location map (a) of Greece, showing the sampling sites (purple dots) (b) in Chora, (c) in Peza, and (d) in Meramvello. This map was produced by the authors using ArcGISPro 3.0 Patch 2 (3.0.2) software (@esri.com; no copyrighted material was used).
Agronomy 14 00640 g001
Figure 2. The effect of different weed management systems on the Shannon–Wiener index, Simpson’s index, species richness, and Pielou’s evenness index in Chora and Peza. Error bars represent the standard error of the mean. Groups not sharing the same letter are significantly different according to the least significant difference (LSD) test (p < 0.05).
Agronomy 14 00640 g002
Figure 3. The effect of different weed management systems on the Shannon–Wiener index, Simpson’s index, species richness, and Pielou’s evenness index in Meramvello. In the boxplots, broad lines are the medians, square open dots are the means, boxes show the interquartile ranges, and whiskers extend to the last data points within 1.5 times the interquartile range.
Agronomy 14 00640 g003
Figure 4. Ordination diagram of the reduced RDA model containing the eight significant explanatory variables. Weed species are displayed with their EPPO codes (https://gd.eppo.int/, accessed on 27 February 2024). The quantitative variables are represented by arrows, and the nominal or categorical variables by centroids (triangles). Irr., irrigated olive groves; Elev., elevation; Rotary t, rotary tiller.
Agronomy 14 00640 g004
Figure 5. Percentage contributions of the groups of explanatory variables to the variation in weed species’ composition in the three studied regions (i.e., Chora, Peza, and Meramvello), identified by variation partitioning using partial RDA. Negative values are not shown.
Agronomy 14 00640 g005
Figure 6. RDA ordination diagram showing the effect of weed species’ composition on the Shannon–Wiener index, Simpson’s index, species richness, and Pielou’s evenness index. Weed species are displayed with their EPPO codes (https://gd.eppo.int/, accessed on 27 February 2024).
Agronomy 14 00640 g006
Table 1. List of continuous and categorical variables with their units of measurement, range, and mean values.
VariableUnitRangeMean
All Sampling SitesPezaMeramvelloChora
Site
Elevation m3–568372.30208.00184.00
Management variables
Irrigation (water)-Yes—no
Rotary tiller-Yes—no
Grazing-Yes—no
Without control 1-Yes—no
Mowing-Yes—no
Chemical (herbicide: glyphosate)-Yes—no
Soil variables
Sand 1%13.2–75.6035.2834.3539.02
Silt 1%10.4–5034.4330.9336.45
Clay 2%10–53.6030.2934.7224.53
CEC 1meq/100 gr5.71–36.4119.4819.0616.03
pH 1-4.9–7.907.707.237.36
EC 1mS/cm0.25–2.990.760.940.53
C 2%0.47–2.881.662.091.22
Soil organic matter (SOM) 1%0.94–5.763.324.192.44
CaCO3 1%0.05–88.0046.373.1226.88
ESP 1%0.454–12.091.272.211.95
NO3-N 1mg/kg3.03–81.918.4121.2213.12
Ntot 1mg/kg650–46002537.782130.251681.53
Na 1,3mg/kg19–460.0035.2834.3539.02
K 1,3mg/kg56–1350348.83494.68155.28
Ca 1,3mg/kg507–76183624.702904.113213.93
Mgmg/kg39–813127.26227.15143.54
P 1,3mg/kg1.15–82.6214.2918.7912.74
Cu 1,3mg/kg0.54–115.003.2717.5013.97
Fe 1,3mg/kg3.35–135.607.7334.1418.53
Zn 1,3mg/kg0.25–5.960.941.780.63
B 1,3mg/kg0.02–3.871.071.160.51
Mn 3mg/kg0.69–41.55.202.479.41
1 Variables dropped during the forward selection process. 2 Omitted variables due to collinearity. 3 Amounts available to plants.
Table 2. RDA statistical results of the relationship between the eight significant explanatory variables and weed species’ composition.
IndexParameterAxis 1Axis 2Axis 3Axis 4
Summary
Eigenvalues0.1060.0330.0250.019
Species–environment correlations 0.7120.6080.5570.529
Cumulative percentage of variance of species–environment relation49.164.476.085.1
Total variance (sum of all canonical eigenvalues)0.215
Correlation matrix
Mg−0.1127−0.21040.2556−0.1688
Mn0.505−0.10970.14540.1238
Irrigation−0.11580.2104−0.0731−0.1669
Rotary tiller−0.11090.0808−0.19810.3145
Grazing−0.1625−0.2632−0.1536−0.2386
Mowing0.3509−0.2418−0.00650.2003
Chemical0.32240.42240.0471−0.1398
Elevation−0.10540.17240.21930.3248
Table 3. Ranking of the environmental variables by importance according to their marginal and conditional effects, as obtained by forward selection in RDA.
Marginal EffectsConditional Effects
VariableVariation Explained VariableVariation Explained pF
Mn0.06Mn0.060.0017.24
SOM0.04Chemical0.040.0014.83
Chemical0.04Mowing0.030.0033.54
Mowing0.04Elevation0.020.0013.2
Grazing0.02Mg0.020.0082.43
Zn0.02Rotary tiller0.010.0232.08
EC0.02Grazing0.020.0142.12
B0.02Irrigation0.020.0232.11
Control 0.02pH0.010.1091.53
K0.02Silt0.010.0421.85
Mg0.02Sand0.010.0711.61
Elevation0.02SOM0.010.1771.34
Irrigation0.02P0.010.1221.51
Rotary tiller0.02B0.010.1781.33
Sand0.02Control0.010.2931.23
Fe0.02EC0.010.1971.34
N0.01K0.010.3141.12
CEC0.01Na00.4450.99
pH0.01ESP0.020.0981.49
CaCO30.01Ca00.3411.06
Silt0.01N0.010.5760.86
Na0.01Zn00.5820.88
Ca0.01CaCO30.010.6790.79
P0.01CEC0.010.7690.67
Cu0.01NO300.820.66
ESP0.01Cu00.8970.53
NO30.01Fe0.010.8450.59
Disclaimer/Publisher’s Note: The statements, opinions and data contained in all publications are solely those of the individual author(s) and contributor(s) and not of MDPI and/or the editor(s). MDPI and/or the editor(s) disclaim responsibility for any injury to people or property resulting from any ideas, methods, instructions or products referred to in the content.

