Article

The Effects of Soybean–Tea Intercropping on the Photosynthesis Activity of Tea Seedlings Based on Canopy Spectral, Transcriptome and Metabolome Analyses

1
Tea Research Institute, Shandong Academy of Agricultural Sciences, Jinan 250100, China
2
Tea Research Institute, Qingdao Agricultural University, Qingdao 266109, China
*
Author to whom correspondence should be addressed.
Agronomy 2024, 14(4), 850; https://doi.org/10.3390/agronomy14040850
Submission received: 21 March 2024 / Revised: 13 April 2024 / Accepted: 16 April 2024 / Published: 18 April 2024
(This article belongs to the Special Issue Beverage Crops Breeding: For Wine, Tea, Juices, Cocoa and Coffee)

Abstract

:
Intercropping soybean in tea plantations is a sustainable cultivation system that can improve the growing environment of tea plants compared to monoculture tea. However, the effects of this system on the photosynthesis activity of tea seedlings have yet to be reported. Therefore, we used tea cultivar ‘Zhongcha108’ as experimental materials to investigate the effects of intercropping soybean on the canopy spectral parameters and photosynthesis activity of tea seedlings. Canopy spectral reflectance data showed that soybean–tea intercropping (STS) improved the reflectance of 720, 750 and 840 nm bands in tea seedlings’ canopy. The vegetation indexes (VIs) value related to photosynthetic pigments in STS was obviously higher than monoculture tea (T). In addition, the Fv/Fm and SPAD value in STS were also clearly higher. Transcriptome analysis data indicated that STS induced the expression of light-harvesting complex (LHC) genes, photosystem subunit (Psbs and Psas) genes and dark reaction biological process genes (FBP1, RPE, Calvin cycle protein CP12-1 and transketolase). These results indicate that STS enhanced the photosynthesis activity. The metabolome analysis showed that STS promoted the accumulation of carbohydrate metabolites, which further provided evidence for the enhancement of photosynthesis in the leaves of tea seedlings. This study enhanced our understanding of how intercropping soybeans in a young tea plantation improves the photosynthesis activity to promote tea seedlings’ growth and development.

1. Introduction

The tea plant [Camellia sinensis (L.) O. Kuntze] is a popular special cash crop, and its tender leaves are processed in different ways to produce tea beverages consumed around the world [1]. Tea beverages are popular because of their unique flavor and have significant health benefits [2]. The flavor of tea beverages varies with the content and proportion of many secondary metabolites [3,4]. Photosynthesis is the main energy source for the biosynthesis of secondary metabolites [5]. Tea plants can produce more nitrogen-containing compounds, nitrogen-containing aromatics, chlorophyll, amino acids and other effective substances during photosynthesis under diffuse light conditions [2].
The pigment contents in plant leaves, especially chlorophyll and carotenoids, are an important biological indicator of many physiological processes, including the light-harvesting reaction of photosynthesis [6]. In addition, photosynthetic pigment contents also affect the photosynthetic activity and growth of plants, which is directly related to their primary yield and biomass accumulation [7]. VIs have been used to estimate plant photosynthetic pigment contents, such as chlorophyll and carotenoid, in recent years [8,9,10]. Zhang et al. [11] used 26 VIs calculated from multispectral reflectance data to estimate the chlorophyll and carotenoid contents of poplar leaves, showing that a chlorophyll index using green reflectance (CIgreen), chlorophyll index using red edge reflectance (CIred-edge), chlorophyll vegetation index (CVI), green leaf index (GLI), green normalized difference vegetation index (GNDVI), leaf chlorophyll index (LCI), MERIS terrestrial chlorophyll index (MTCI), normalized difference red-edge index (NDRE), green NDVI (NDVIg), red-edge normalized difference vegetation index (RENDVI) and vogelmann red-edge index 1 (VOG1) had a high correlation with chlorophyll and carotenoid contents. Therefore, multi-spectral imaging technology has a broad application prospect in the monitoring of photosynthetic pigment contents in leaves.
The photochemical reactions of photosynthesis occur via two photosystems including photosynthetic pigments. Photosystem I (PS I) and photosystem II (PS II) have a special pigment complex and other substances. The functions of PS I and PS II are crucial to maintain the growth and survival of tea plants [12]. PSII can provide energy and electrons by producing ATP and NADPH for subsequent reactions in various metabolic processes. In the photosynthetic electron transfer chain, the PS II, cytochrome b6f complex and PSI, embedded in the thylakoid, work in series, together with ATP synthase, to convert light energy into chemical energy [13]. Firstly, light is absorbed by pigment-binding LHC, and then transferred to the nearest correctly oriented pigment until it reaches the photosynthetic reaction centers PS II and PS I [14]. In the face of the complex photosynthetic reaction process, the PSII complex must be properly regulated to fulfil its function. Different regulatory mechanisms can produce different effects, such as increasing photosynthetic efficiency, reducing energy consumption, and maintaining PSII stability.
Intercropping in tea plantations is an important cropping system based on the biological characteristics of tea plants, which adopts a three-dimensional compound cultivation method to realize the intensive use of various natural resources, such as light, temperature, water and fertilizer [15]. In the intercropping system of tea plantations, different species occupy different ecological niches by which light and nutrients can be fully recycled. In areas with a high temperature and strong solar radiation, intercropping can effectively reduce the light intensity of tea gardens and the air and soil temperature around tea gardens, thus providing a suitable growth environment for tea plants [16,17,18,19]. This altered microclimate satisfies the tea plant’s preference for shade, diffuse light, moisture, warmth and acidic soil, helping to improve tea yield and quality. So far, studies on intercropping soybean in tea plantations have mainly focused on the improvement in tea quality from the perspective of rhizosphere soil nutrients and microbial communities, leaf nutritional physiology, functional genes and metabolite changes [20,21,22]. The soybean–tea intercropping system improved nutrient absorption and tea quality by regulating the abundance of beneficial microorganisms in soil [16]. Moreover, soybean–tea intercropping improved the aroma of tea by increasing the soil nitrogen levels [23]. Duan et al. [15] revealed that the synthesis of glutamate, amino acids, lysine, arginine and glutamine was increased, and the biosynthesis of flavonoid, flavone and flavonol also changed in the soybean–tea intercropping system. These studies have strengthened our understanding of how soybean–tea intercropping in tea plantations regulates the soil bacterial community to maintain soil health, and revealed that the legumes–tea intercropping system has great potential to improve tea quality in terms of tea quality components, amino acid metabolism, flavonoid metabolism, etc. However, the effects of soybean–tea intercropping on the photosynthesis activity of tea seedlings remain unclear.
The research aimed to decipher the effects of STS on the tea seedlings canopy’s spectral and photosynthetic pathways. We detected the difference in the multispectral reflectance, physiology, genes and metabolites of a tea seedlings canopy in T and STS. The spectral and temperature differences in the tea canopies were analyzed by UAV multispectral and thermal infrared remote sensing data. SPAD and Fv/Fm were used to explore the chlorophyll content and integrity of the photosystem of tea seedling leaves in STS. The expression levels of genes involved in photosynthetic pathways were analyzed through transcriptome sequencing. Moreover, the genes enriched in photosynthesis-antenna proteins and the PSII subunit were identified, and the gene expression profiles were detected via RT-qPCR. Finally, the metabolome data were used to analyze the changes in the sugars produced by photosynthesis. This study provided theoretical guidance for improving the photosynthesis activity of tea seedling leaves by enhancing the light harvesting ability and PSII levels in a young tea plantation.

2. Materials and Methods

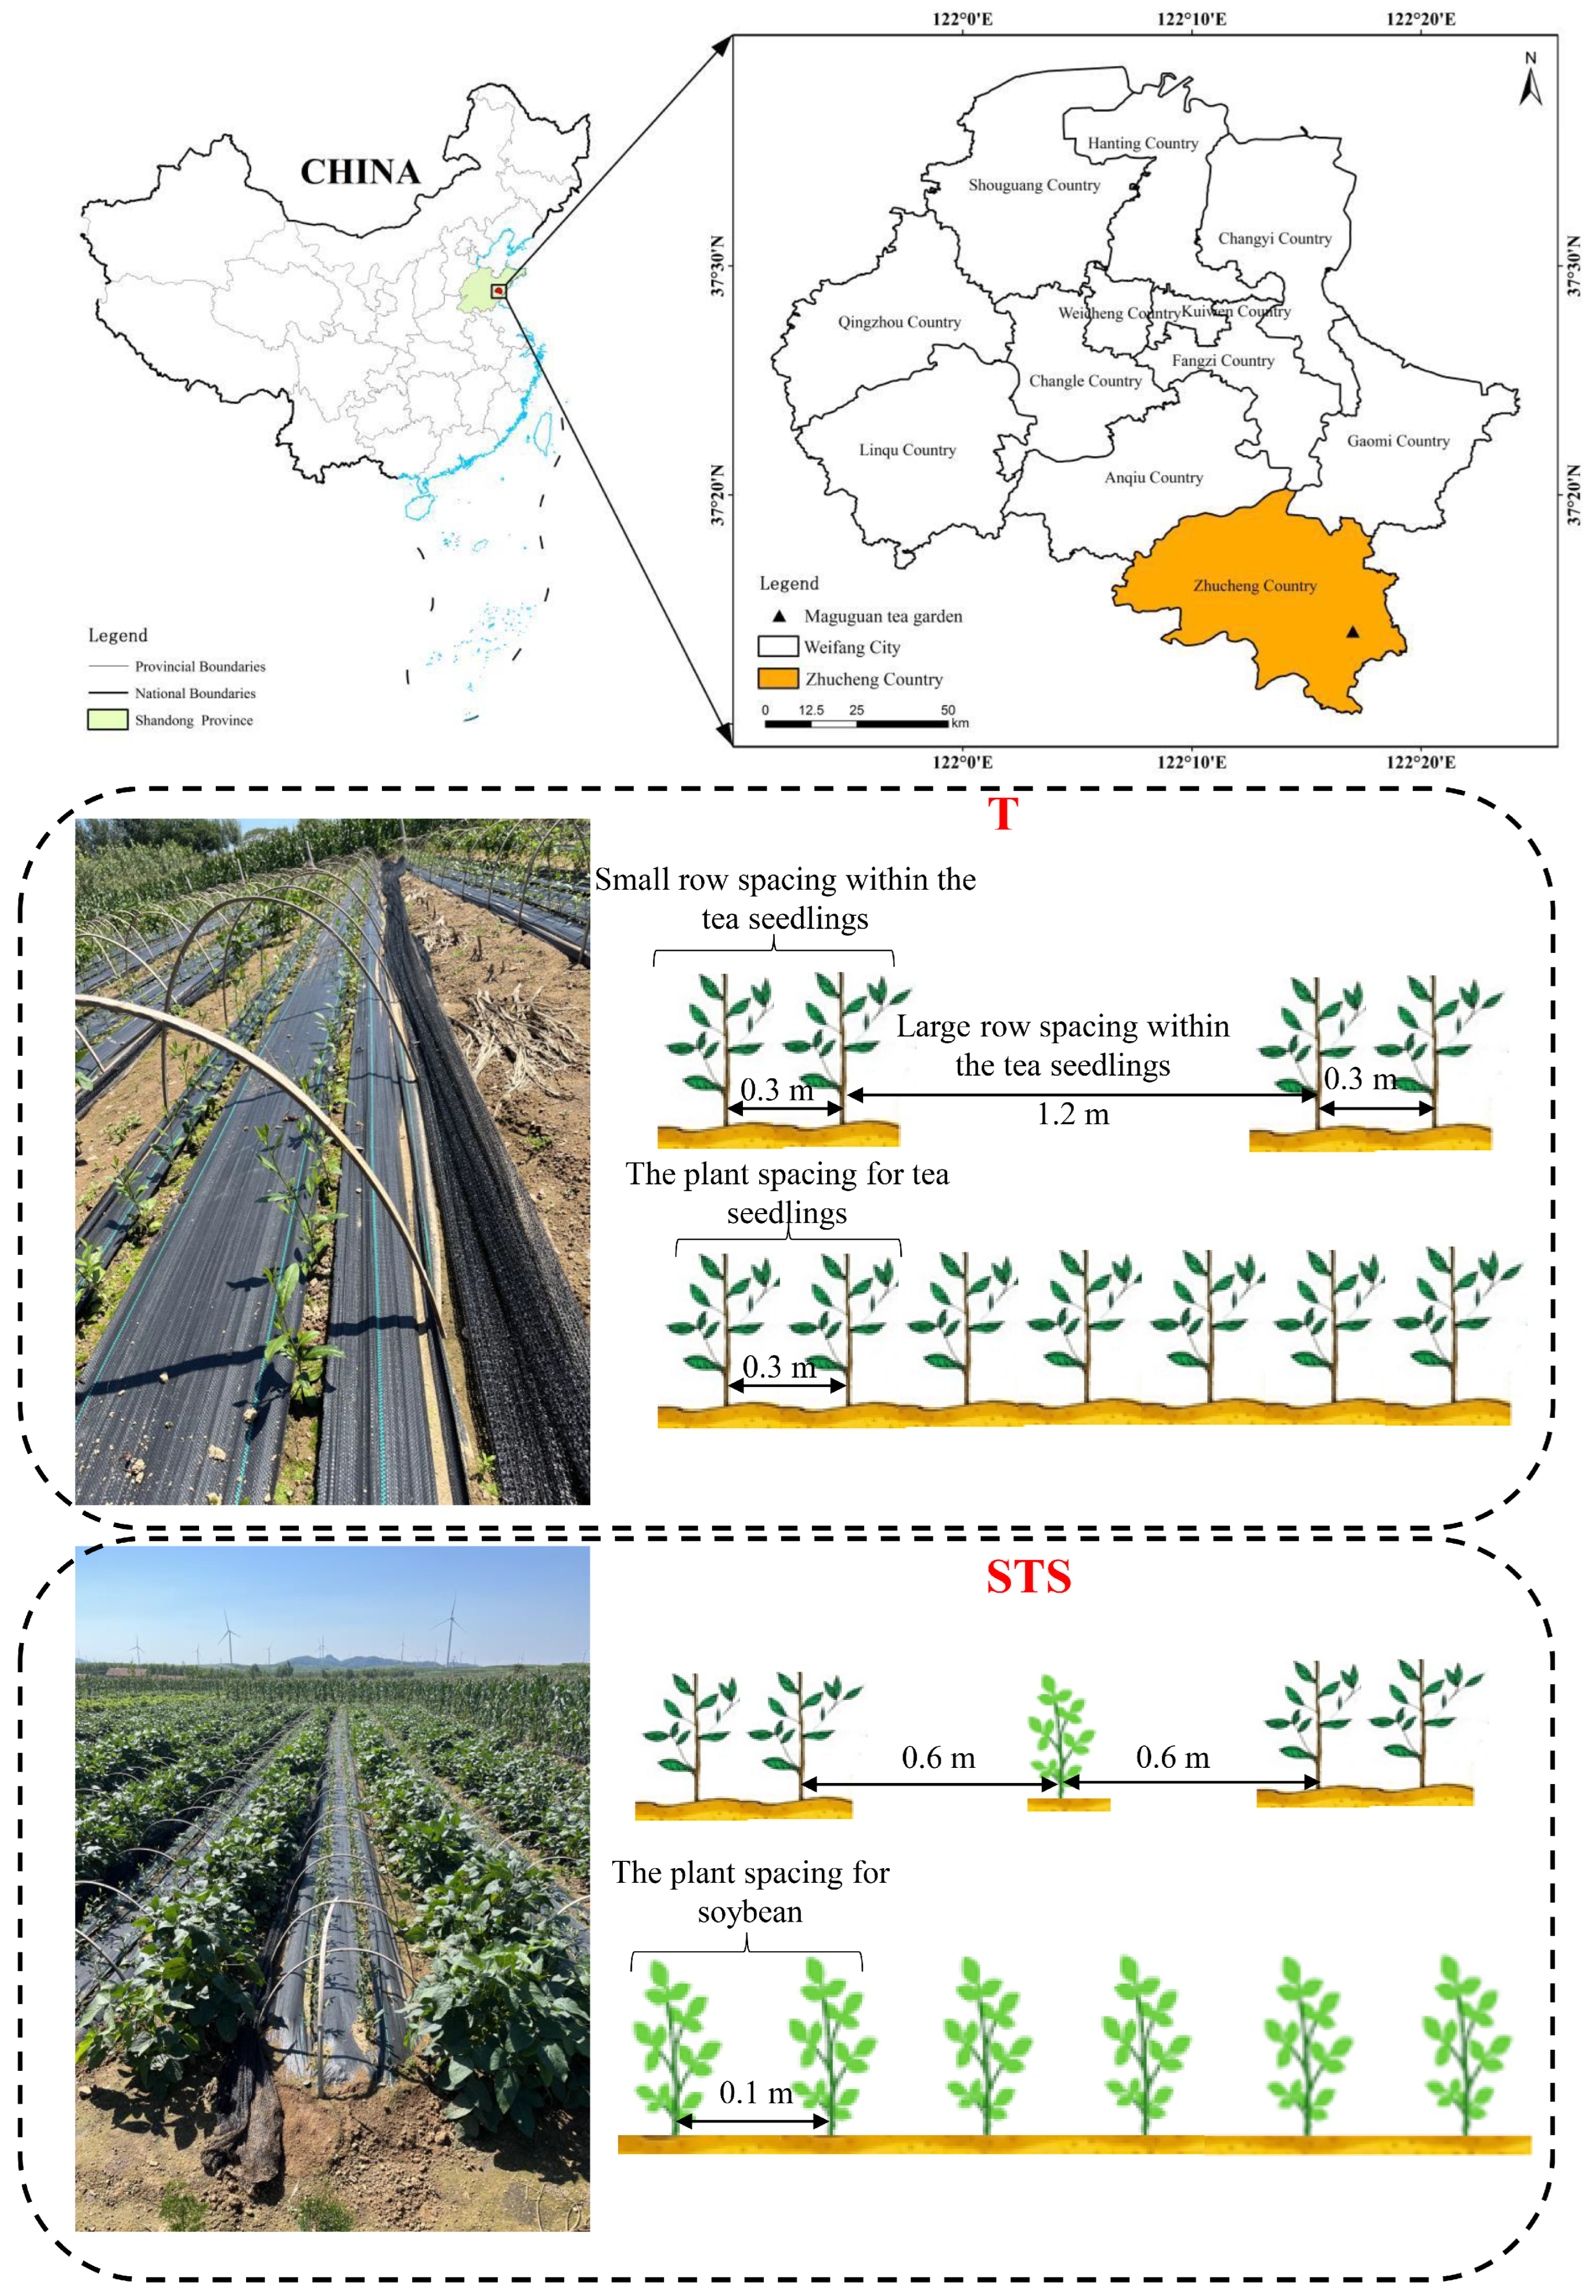
2.1. Experiment Field and Setup

This field experiment was conducted in the Maguguan young tea plantation, which is located at Zhucheng, Shandong Province, China (119.60° E, 35.91° N) (Figure 1). This region belongs to a warm temperate zone semi-humid climate with an average annual temperature of 13.2 °C and annual precipitation of 741.8 mm. The annual average relative humidity is 67%, and the annual evaporation is 1677.5 mm. the frost-free period is about 217 days. A one-year tea cultivar (Camellia sinensis cv. Zhongcha108) was intercropped with soybean (Glycine max cv. Qihuang34). The cuttings of “Zhongcha 108” were sown on 6 April 2022, with a plant spacing of 0.3 m, small row spacing of 0.3 m, and large row spacing of 1.2 m. The seeds of “Qihuang34” were sown on 5 June 2022, with a plant spacing of 0.1 m. In the soybean–tea intercropping system, the distance between adjacent tea seedling rows and soybean rows was 0.6 m (Figure 1). Field experiments were conducted with two treatments, including monoculture tea (T) and soybean–tea intercropping (STS). Other management measures were completely consistent, such as fertilization and watering. When the intercropping soybean reached physiological maturity and was sufficient for harvest (27 August 2022), tender leaves of tea seedlings were sampled. T was used as a control. Each treatment had 3 replicates, for a total of 6 samples.

2.2. Unmanned Aerial Systems and Image Acquisition

The UAV system consisted of a DJ M200 V2 UAV flying platform (DJI Co., Ltd., Shenzhen, China) and multi-source sensor systems (multispectral camera and thermal imager). Flight parameters were determined according to the previous research of our team [24]. The MS600 multispectral camera (Yusense Co., Ltd., Qingdao, China) used in this study can simultaneously capture six bands of spectral images. The parameters of MS600 are shown in Table 1. Other information regarding the MS600, such as the pixel resolution, spatial resolution, image storage format, and specific information before and after acquisition, are provided in detail in our previous research [24]. The ZENMUSE™ XT 2 camera (DJI, Shenzhen, China) used in this study was equipped with a thermal imaging camera movement and a visible light camera to capture thermal and visible images simultaneously. The thermal camera has a resolution of 640 × 512 and the images are stored in TIFF format.
The extraction of the tea seedlings canopy’s spectral information was carried out according to our previous research [24]. In brief, the ROI tool of ENVI 5.3 (Research System Inc., Orlando, FL, USA) software was used to extract average spectral values of the 6 bands from MS images as the multispectral data of the research points. In this study, we selected an individual tea seedling canopy as the ROI region and extracted the spectral values of 20 ROI regions under STS and T patterns, respectively. A typical image obtained with a multispectral camera and the ROI selected from the image are shown in Figure S1. In addition, 11 commonly used VIs [11] were calculated using the average spectral data of 6 bands. The extraction of temperature information of the tea seedlings canopy was carried out according to the method presented by Mao et al. [24]. In brief, FLIR Tools 2.2 (FLIR Systems, Inc., Wilsonville, OR, USA) software was used to extract the temperature information of the tea seedlings canopy. In this study, tea seedlings canopy temperatures at 20 points under different treatments were extracted from TIR images.
The 11 VIs and calculation formulas are shown in Table 2.

2.3. Determination of SPAD and Fv/Fm

The SPAD were measured by a plant nutrition analyzer (TYS-4N, Hangzhou, China). For each treatment, 20 young leaves of different tea seedlings were randomly selected for determination.
Tea seedling leaves were treated with dark adaptation forceps for 20 min and the Fv/Fm was measured using chlorophyll fluorimeter (PS I, Drásov, Czech Republic) [25].

2.4. RNA Extraction and RNA-Seq

The RNA extraction of six samples was performed through an RNA Isolation System (TaKaRa, Dalian, China). The degradation and contamination of RNA were detected by 1% agarose gel electrophoresis. Using the NanoPhotometer® spectrophotometer (IMPLEN, Calabasas, CA, USA), RNA purity was checked. Using the Qubit®RNA Assay Kit in Qubit®2.0 Flurometer (Life Technologies, Carlsbad, CA, USA), RNA concentration was measured. The RNA Nano 6000 Assay Kit of the Bioanalyzer 2100 system (Agilent Technologies, Palo Alto, CA, USA) was used to assess RNA integrity. A total of 6 RNA samples were used to construct cDNA libraries and sequenced on the Illumina platform by Metware Biotechnology Co., Ltd. (Wuhan, China).

2.5. Transcriptome Data Analysis

Raw data were filtered by fastp (v 0.19.3) to obtain clean reads. Clean reads were mapped to the tea genome (https://ftp.ncbi.nlm.nih.gov/genomes/all/GCF/004/153/795/GCF_004153795.1_AHAU_CSS_1/GCF_004153795.1_AHAU_CSS_1_genomic.fna.gz, accessed on 12 December 2022) using HISAT (v2.1.4) [26]. A new transcript was predicted using StringTie (v1.3.4). FPKM value was used to estimate transcript expression level. FeatureCounts (v1.6.2) and StringTie (v1.3.4) were used to calculate the gene alignment and FPKM. Differentially expressed genes (DEGs) were identified by DESeq2 (v1.6.3) and edgeR (v3.24.3). The thresholds for significant difference expression were corrected p-value < 0.05 and |log2foldchange| > 1. Venny 2.1.0 software was used to display the number of DEGs. KEGG and GO enrichment analyses were performed for all DEGs.

2.6. Metabolite Extraction and Analysis

The frozen six tea samples were freeze-dried using a vacuum Scientz-100F lyophilizer (SCIENTZ Biotechnology, Ningbo, China). After the freeze-dried samples were crushed, dissolved and extracted, the extracts were used for UPLC-MS/MS analysis. The detailed process followed the method presented by Duan et al. [15]. Unsupervised principal component analysis (PCA) was performed by statistics function prcomp within R. The differential metabolites were determined by VIP (VIP ≥ 1) and absolute Log2FC (|Log2FC| ≥ 1.0).

2.7. Quantitative Real-Time PCR Analysis

Eight DEGs were selected for qRT-PCR verification. A primer online design tool (https://www.ncbi.nlm.nih.gov/tools/primer-blast/index.cgi?LINK_LOC=BlastHome, accessed on 15 October 2023) was used to generate primers, and primer sequences are shown in Table S1. A glyceraldehyde 3-phosphate dehydrogenase (CsGAPDH) was used as a reference gene [27]. qRT-PCR reactions were performed using the ABI 7500 Sequence Detection System. The reaction volume was 20-μL. All eight genes were analyzed for three biological replicates. The relative expression was normalized against the reference gene and calculated based on the 2−ΔΔCT method [28].

2.8. Statistical Analysis

Statistical analyses in this study were performed using GraphPad Prism 9.0. Differences between groups were detected by using a t-test. A p-value < 0.05 was considered significant.

3. Results

3.1. Effects of STS on Spectral Reflectance and VIs of Tea Seedlings Canopy

Figure 2 shows the statistical characteristics of the multispectral reflectance of six bands and VIs values. The spectral reflectances of the tea seedlings canopy under T and STS were not significantly different in the 450 nm, 555 nm and 660 nm bands. However, the spectral reflectances of the 720 nm, 750 nm and 840 nm bands in STS were significantly higher than those in T. Among the 11 spectral indexes highly correlated with leaf pigment contents, except for CVI and MTCI, the other spectral indexes of STS were significantly higher than those in T.

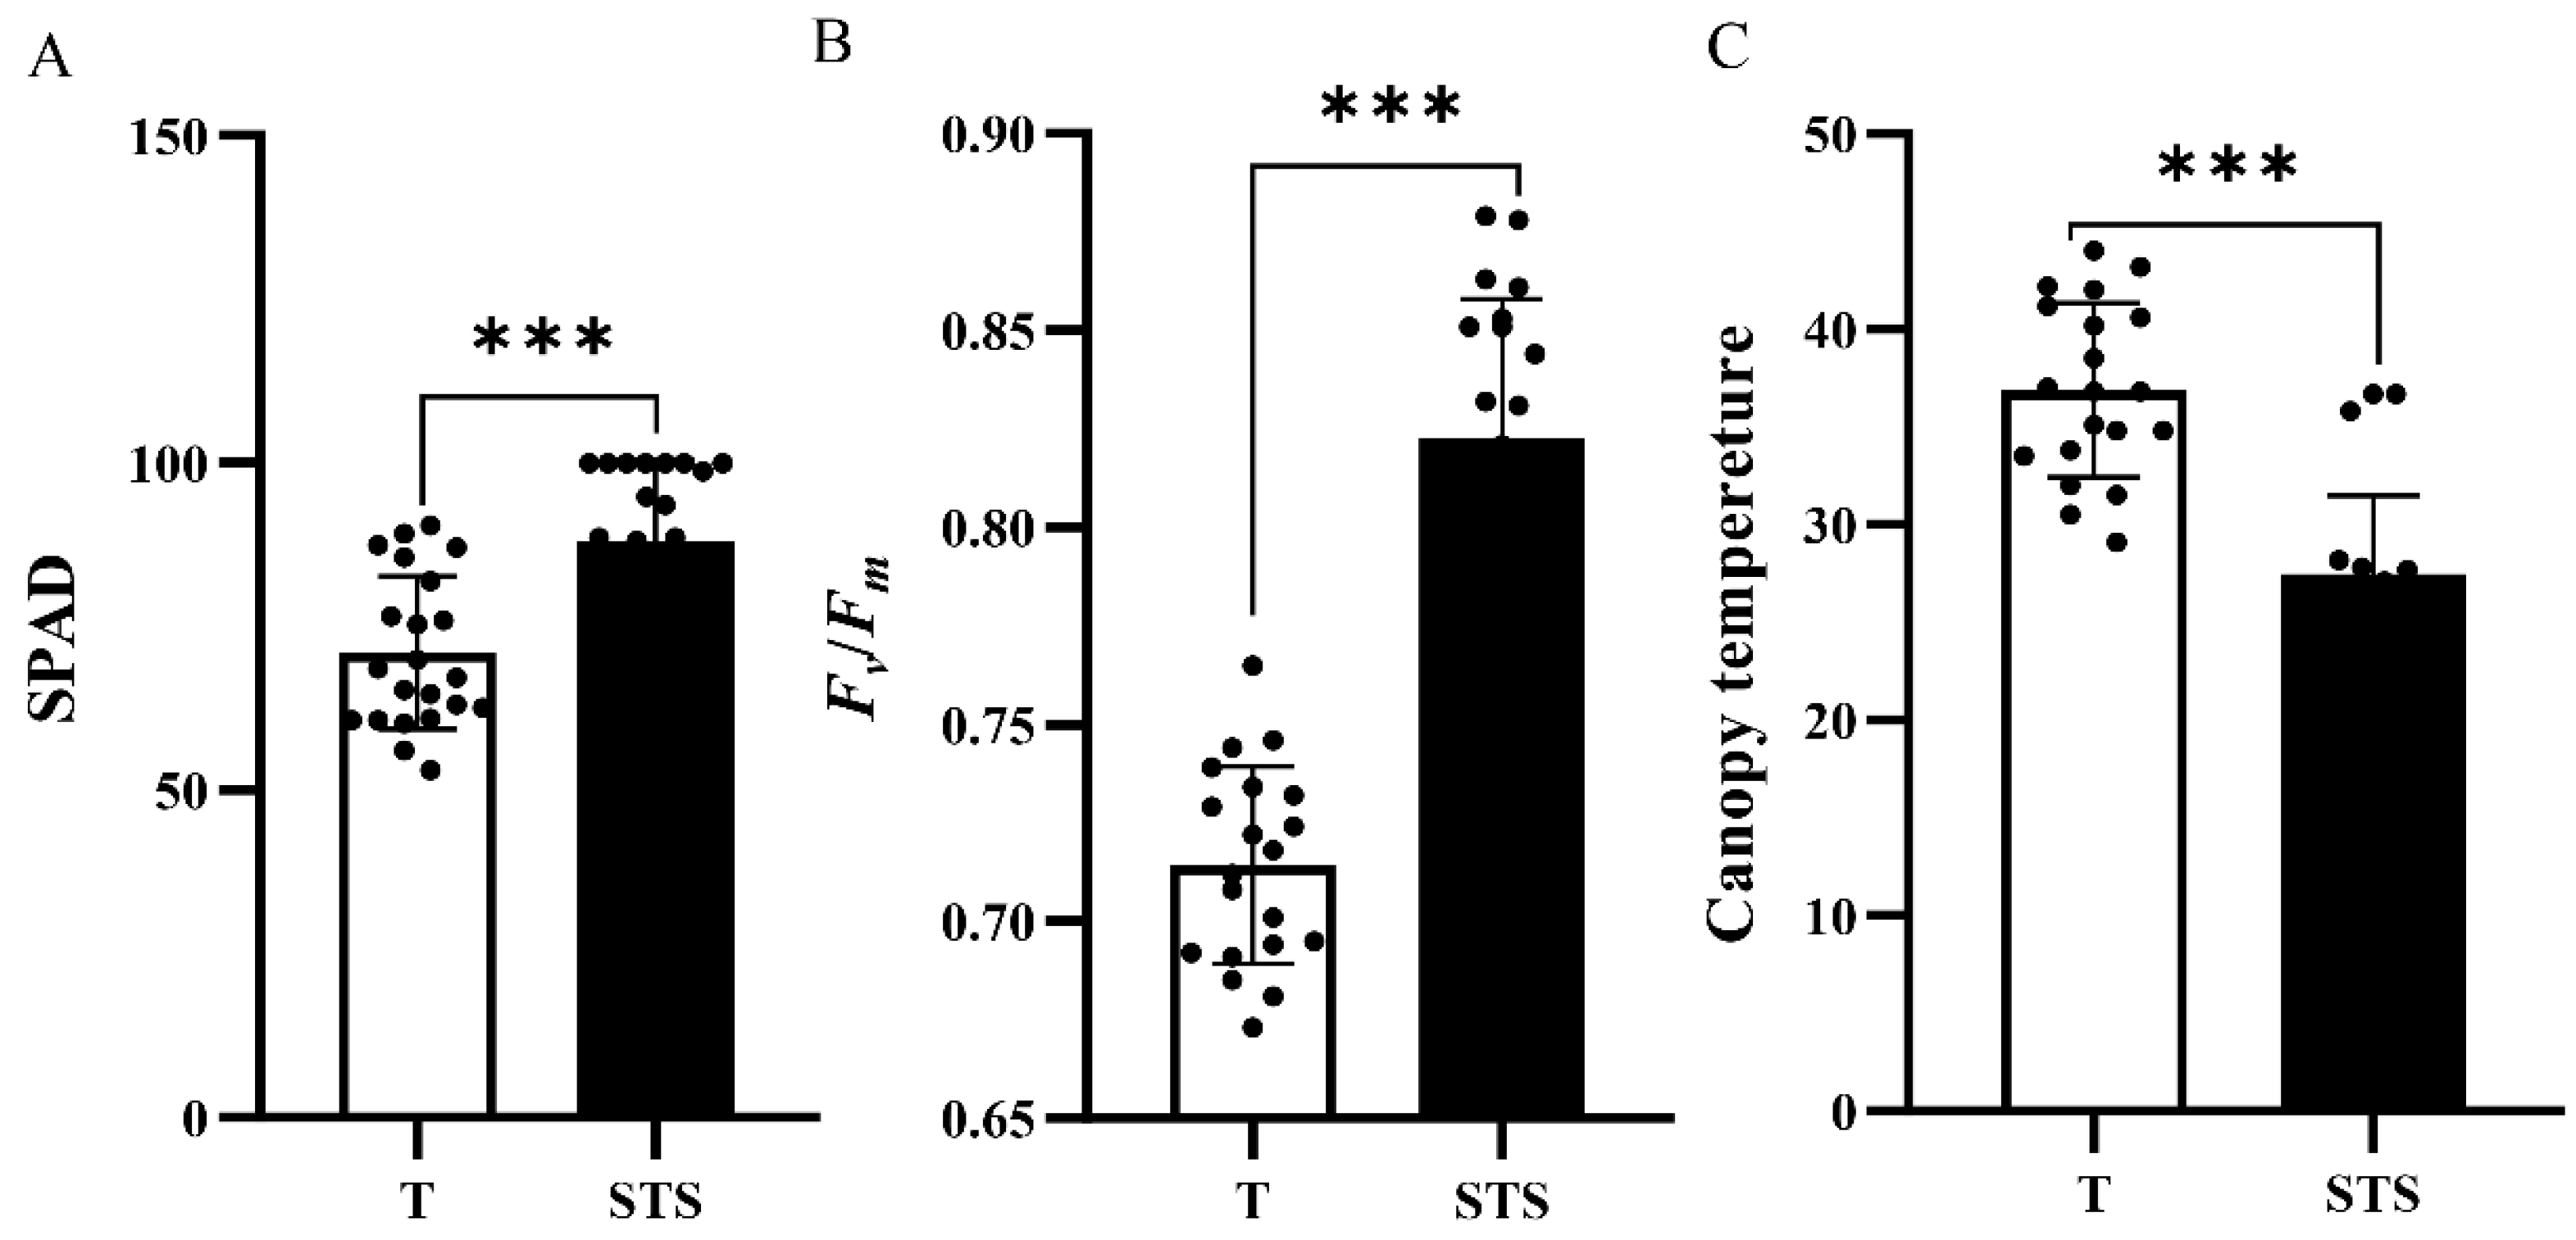
3.2. Effects of STS on the SPAD, Fv/Fm and Canopy Temperature of Tea Seedlings

SPAD and Fv/Fm were measured to obtain an overview of the relative chlorophyll content and intactness of the photosystems of tea seedlings under field conditions (Figure 3). Significantly higher SPAD and Fv/Fm values were detected in STS compared to T. Furthermore, the canopy temperature of tea seedlings under the STS was significantly lower than that of T.

3.3. RNA Sequencing Data Analysis

A global-transcriptome analysis using the tender leaves of tea seedlings was performed. In total, 42.69 Gb of clean data were generated from six libraries, and the clean data of each sample were above 7 Gb. The average clean bases, Q20 and Q30 values were 7.11 Gb, 97.95% and 93.93%, respectively. The mapping ratio was 86.84–87.92% (Table S2).
The results of PCA analysis using PC1 × PC2 score plots distinguished the transcript grouping of different sample groups (Figure S2). The PC1 (64.56%) and PC2 (12.6%) effectively separated STS group from T.

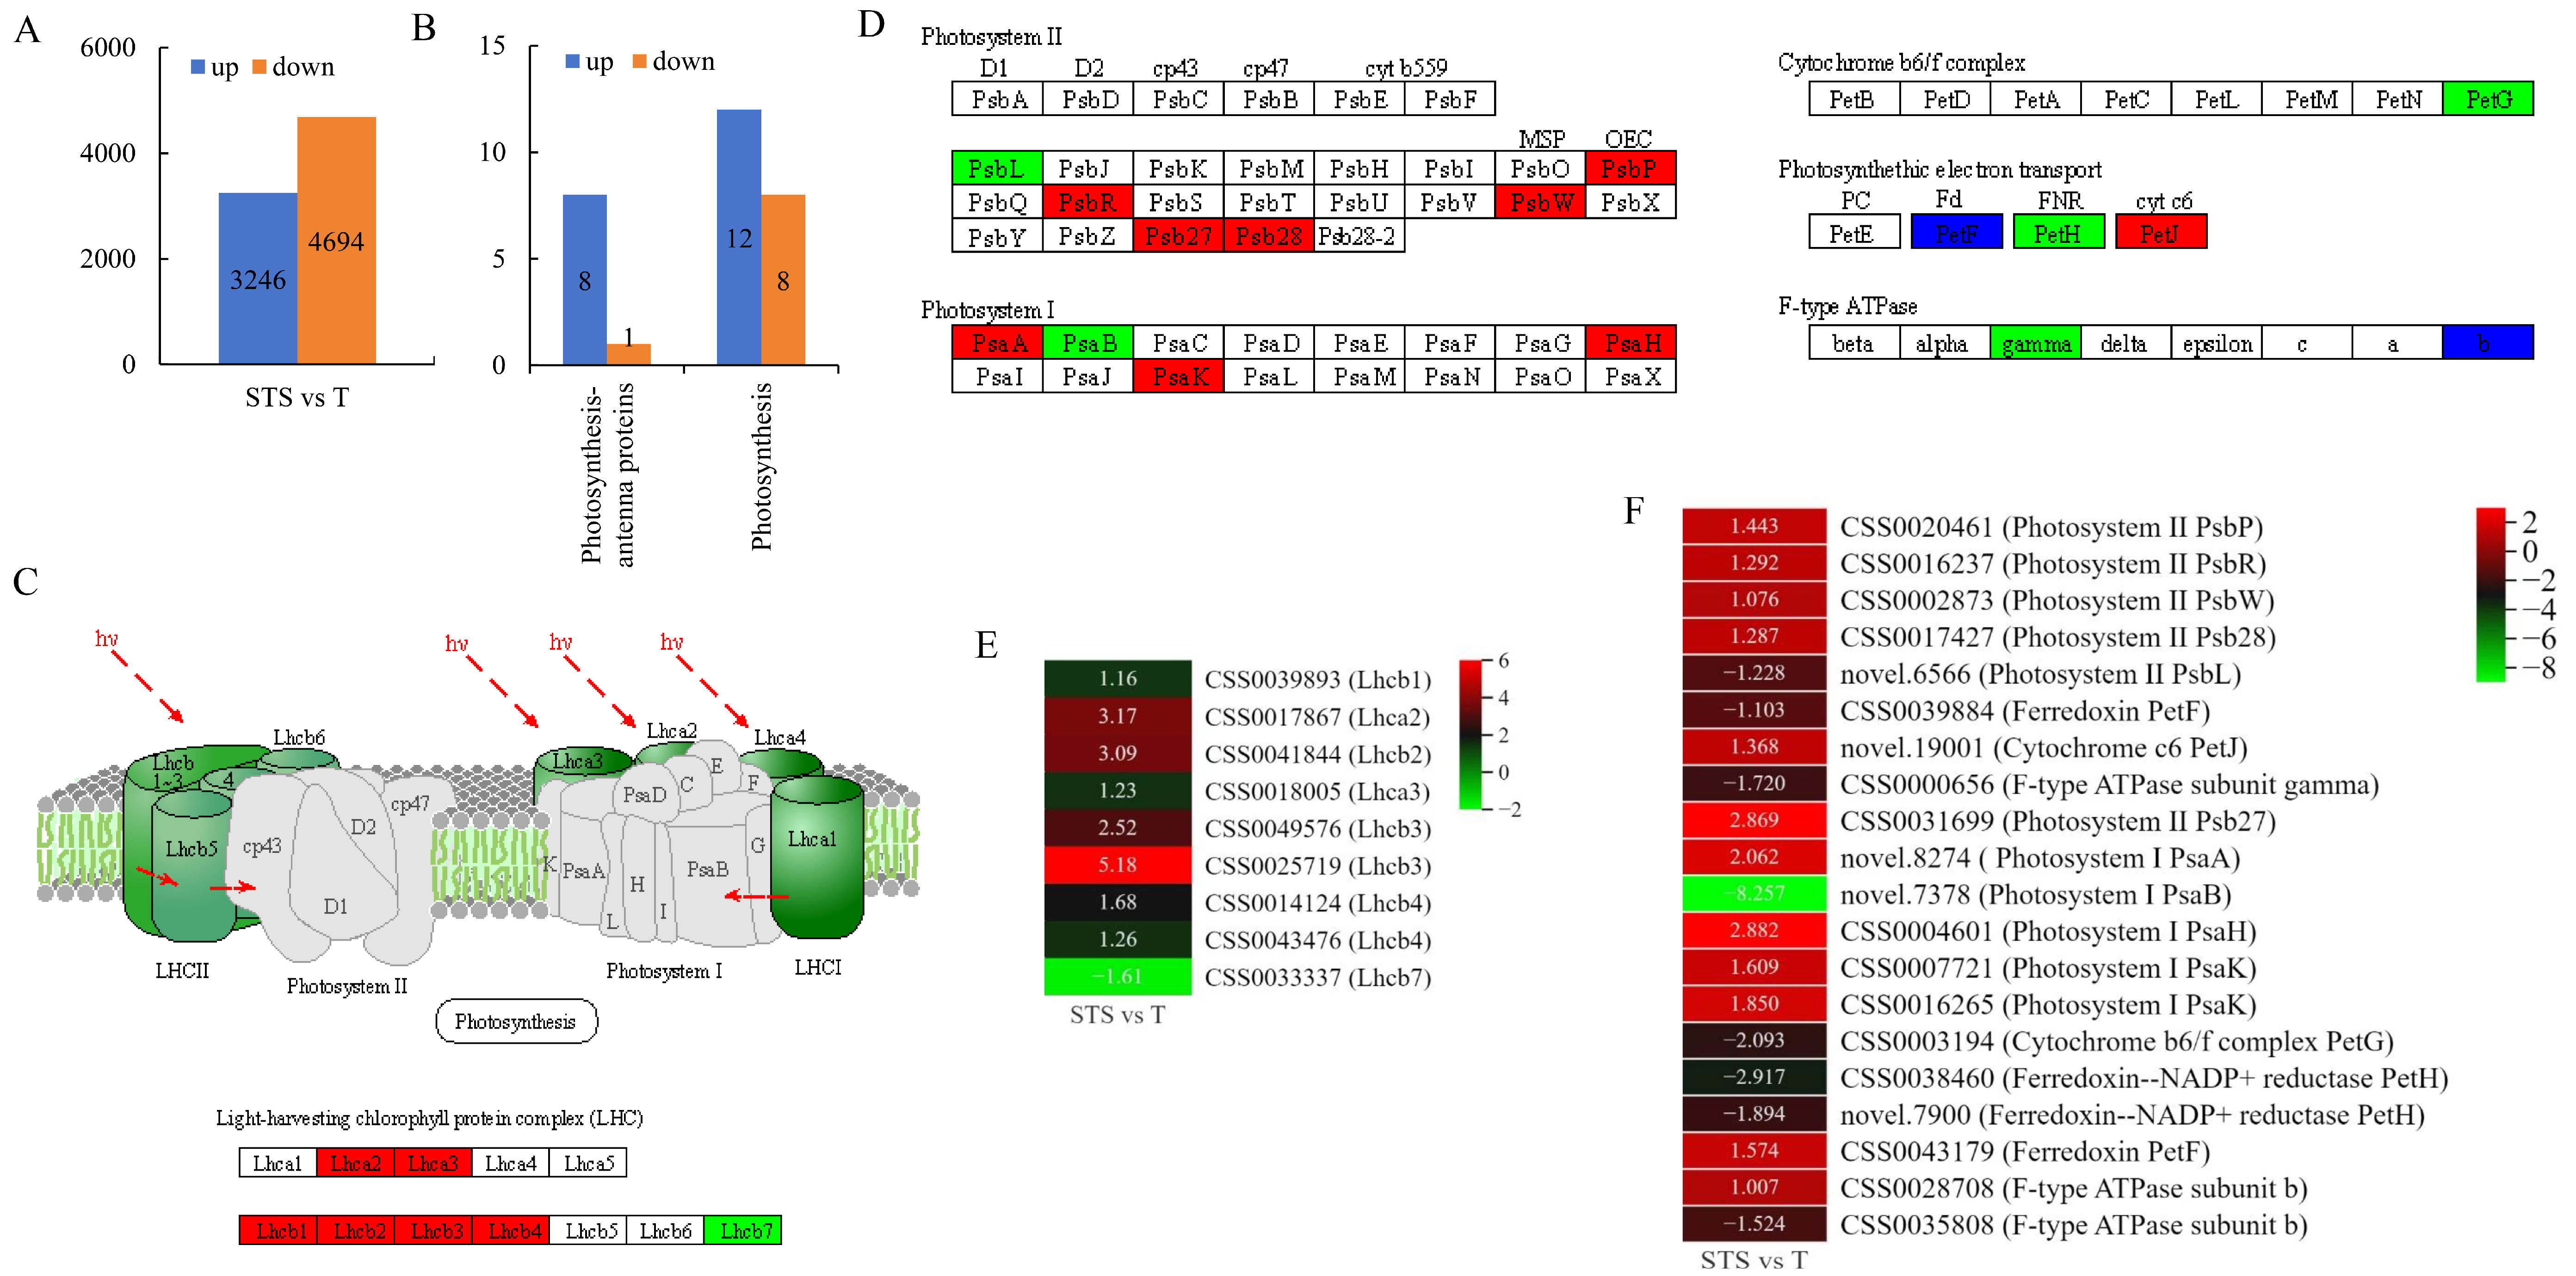
3.4. Analysis of Photosynthesis-Antenna Proteins and Photosynthesis Pathways

Transcript levels analysis showed that 7940 (3246 up- and 4694 down-regulated) genes were identified as DEGs in STS compared with T (Figure 4A). This result suggests that STS induced more down-regulated than up-regulated DEGs.
All DEGs in the STS vs. T group were matched to the KEGG pathway database. A total of 139 pathways were enriched (Table S3). Combining the phenotypic results of Figure 2 and Figure 3, we focused on analyzing the photosynthesis-antenna proteins (Ko00196) and photosynthesis (Ko00195) pathways to elucidate the molecular mechanism of this trait difference. For photosynthesis-antenna proteins pathway, a total of nine DEGs (eight up- and one down-regulated) were selected, including one Lhcb1 (CSS0039893), one Lhca2 (CSS0017867), one Lhcb2 (CSS0041844), one Lhca3 (CSS0018005), two Lhcb3 (CSS0049576 and CSS0025719), two Lhcb4 (CSS0014124 and CSS0043476) and one Lhcb7 (CSS0033337) (Figure 4B,C,E). These DEGs belong to the LHC family. The up-regulated expression of the above DEGs indicated that STS could enhance the light-harvesting capacity of tea seedlings by increasing Lhca2, Lhca3, Lhcb1, Lhcb2, Lhcb3 and Lhcb4 levels compared with T.
For photosynthesis pathway, there were 12 up-regulated DEGs and 8 down-regulated DEGs (Figure 4B,D,F). In PSII, PsbP (CSS0020461), PsbR (CSS0016237), PsbW (CSS0002873), Psb27 (CSS0031699) and Psb28 (CSS0017427) were up-regulated. In PSI, subunit genes PsaA (novel.8274), PsaH (CSS0004601) and PsaK (CSS0007721 and CSS0016265) were up-regulated. Down-regulated DEGs include PsbL (novel.6566), PsaB (novel.7378), PetG (CSS0003194), PetH (CSS0038460 and novel.7900) and PetF (CSS0043179). This result indicates that STS could enhance PSII and PSI by increasing PsbP, PsbR, PsbW, Psb27, Psb28 (CSS0017427), PsaA, PsaH and PsaK expression levels.

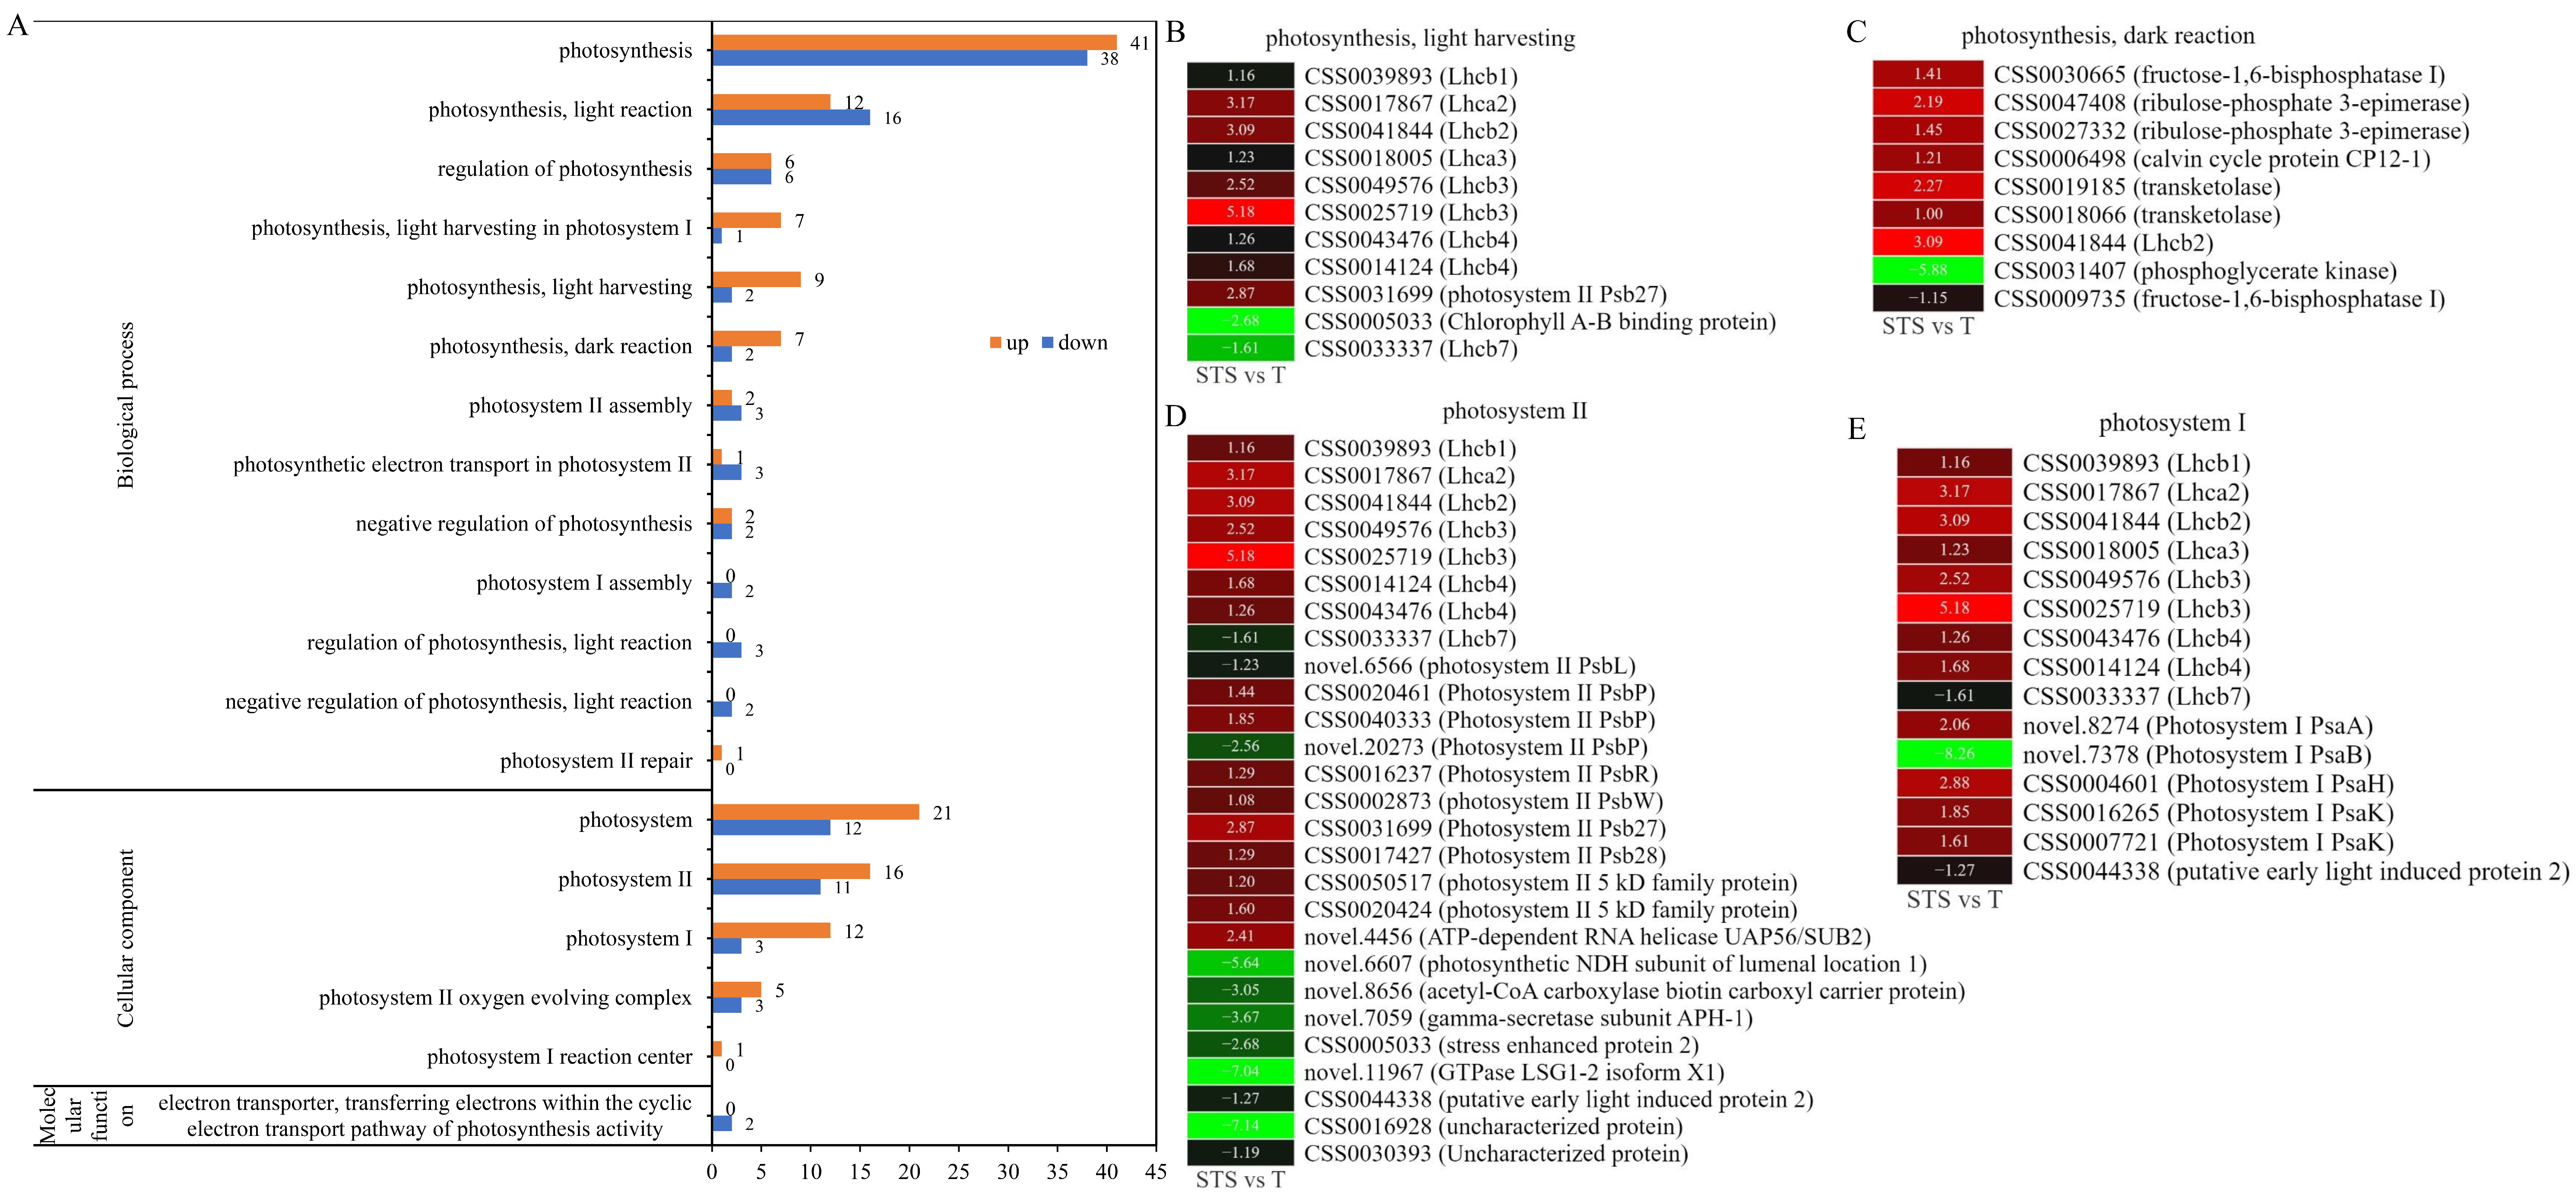
3.5. GO Analysis Related to Photosynthesis

GO enrichment analyses were performed to elucidate the functional differences between DEGs. All DEGs in the STS vs. T were matched in the GO database. A total of 4630 GO terms were enriched (Table S4). Among them, 19 GO terms were associated with photosynthesis (Figure 5A). For the biological process, STS mainly enhanced the expression level of genes related to the light harvesting (GO:0009765) and dark reaction (GO:0019685) of photosynthesis. The genes enriched in the light harvesting process mainly included Lhcb1 (CSS0039893), Lhca2 (CSS0017867), Lhcb2 (CSS0041844), Lhca3 (CSS0018005), Lhcb3 (CSS0049576 and CSS0025719), Lhcb4 (CSS0014124 and CSS0043476) and Psb27 (CSS0031699) (Figure 5B). The genes enriched in the dark reaction process of photosynthesis mainly included FBP1 (CSS0030665), RPE (CSS0047408 and CSS0027332), Calvin cycle protein CP12-1 (CSS0006498), transketolase (CSS0019185 and CSS0018066) and Lhcb2 (CSS0041844) (Figure 5C). For the cellular component, STS mainly increased the expression level of genes in photosystem II (GO:0009523) and photosystem I (GO:0009522). In addition, 27 DEGs (16 up- and 11 down-regulated) were selected in PS II. These up-regulated DEGs mainly included LHC antenna genes (Lhcb1, Lhca2, Lhcb2, Lhcb3, Lhcb4) and PSII subunit genes (PsbP, PsbR, PsbW, Psb27, Psb28) (Figure 5D). A total of 15 DEGs (12 up- and 3 down-regulated) were selected in PS I. These up-regulated DEGs mainly included LHC antenna genes (Lhcb1, Lhca2, Lhcb2, Lhca3, Lhcb3, Lhcb4) and PS I subunit genes (PsaA, PsaB, PsaH, PsaK) (Figure 5E).

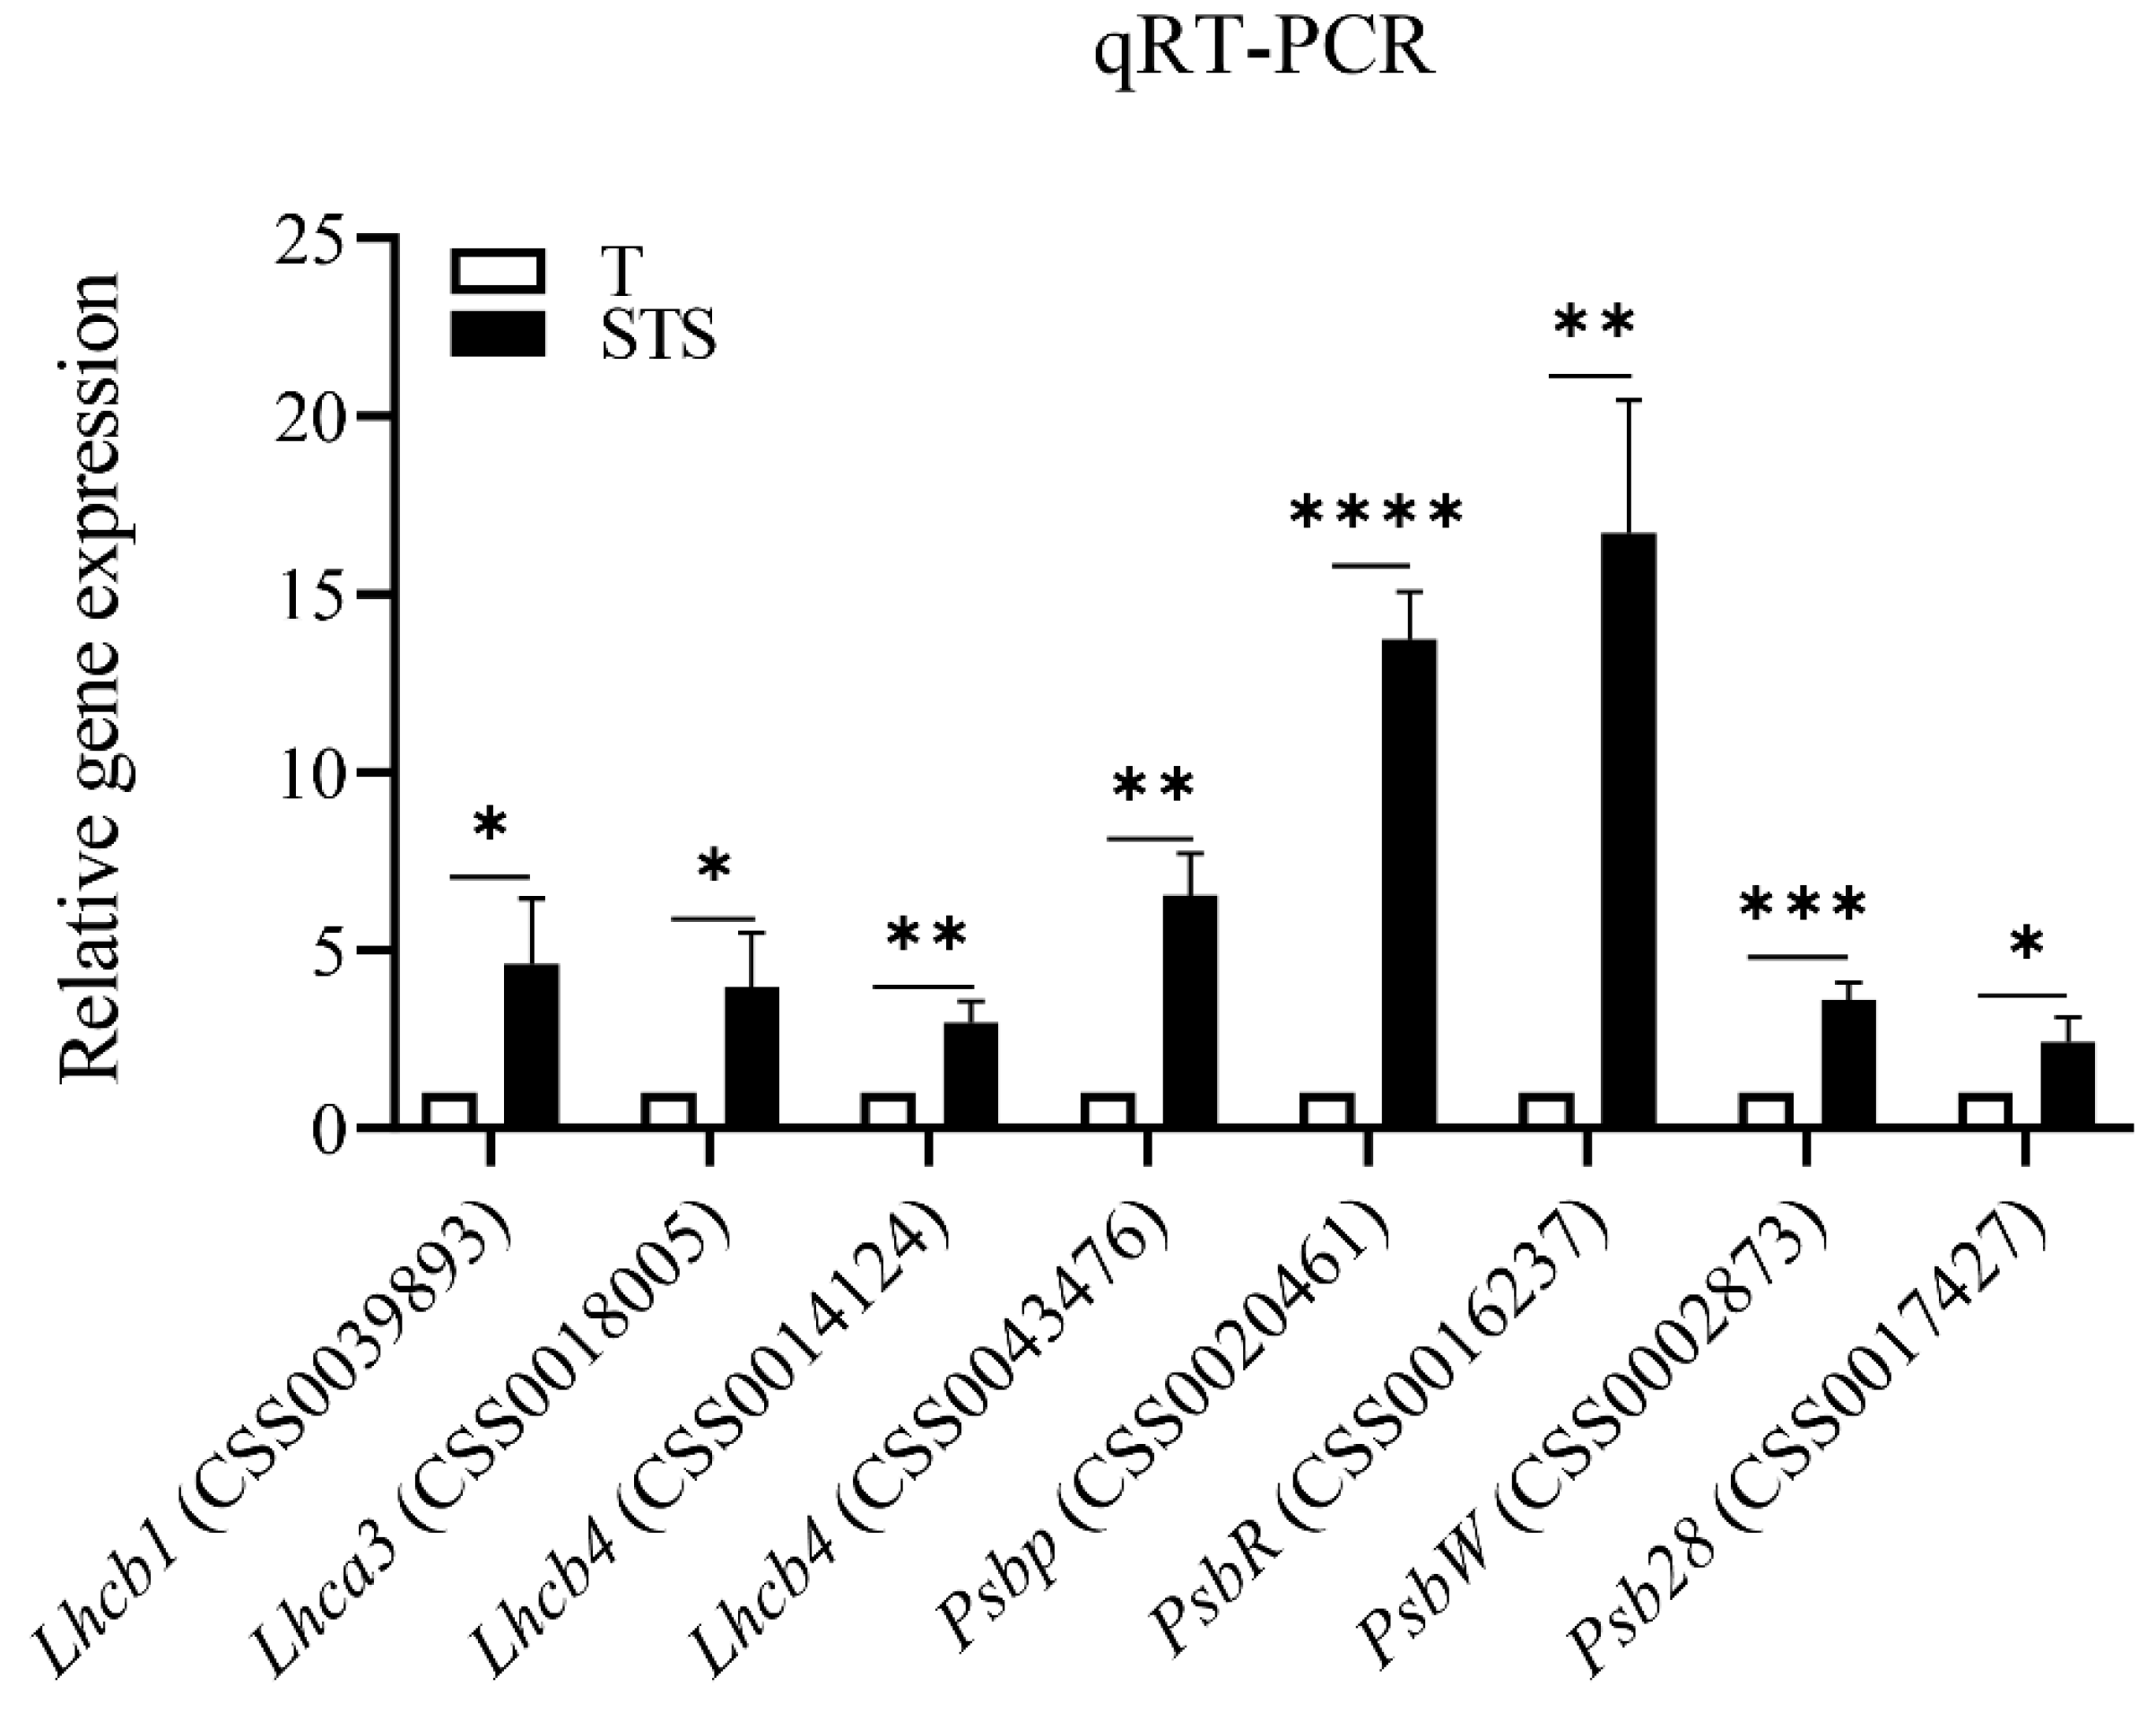
3.6. Validation of DEGs by qRT-PCR

To verify the reliability of transcriptome sequencing results, four LHC antennas DEGs (CSS0039893, CSS0018005, CSS0043476 and CSS0014124) and four PSII subunit genes (CSS0020461, CSS0016237, CSS0002873, CSS0017427) were selected for qRT-PCR assay validation. qRT-PCR results indicated that the expression level of these eight genes were consistent with the transcriptome data (Figure 6).

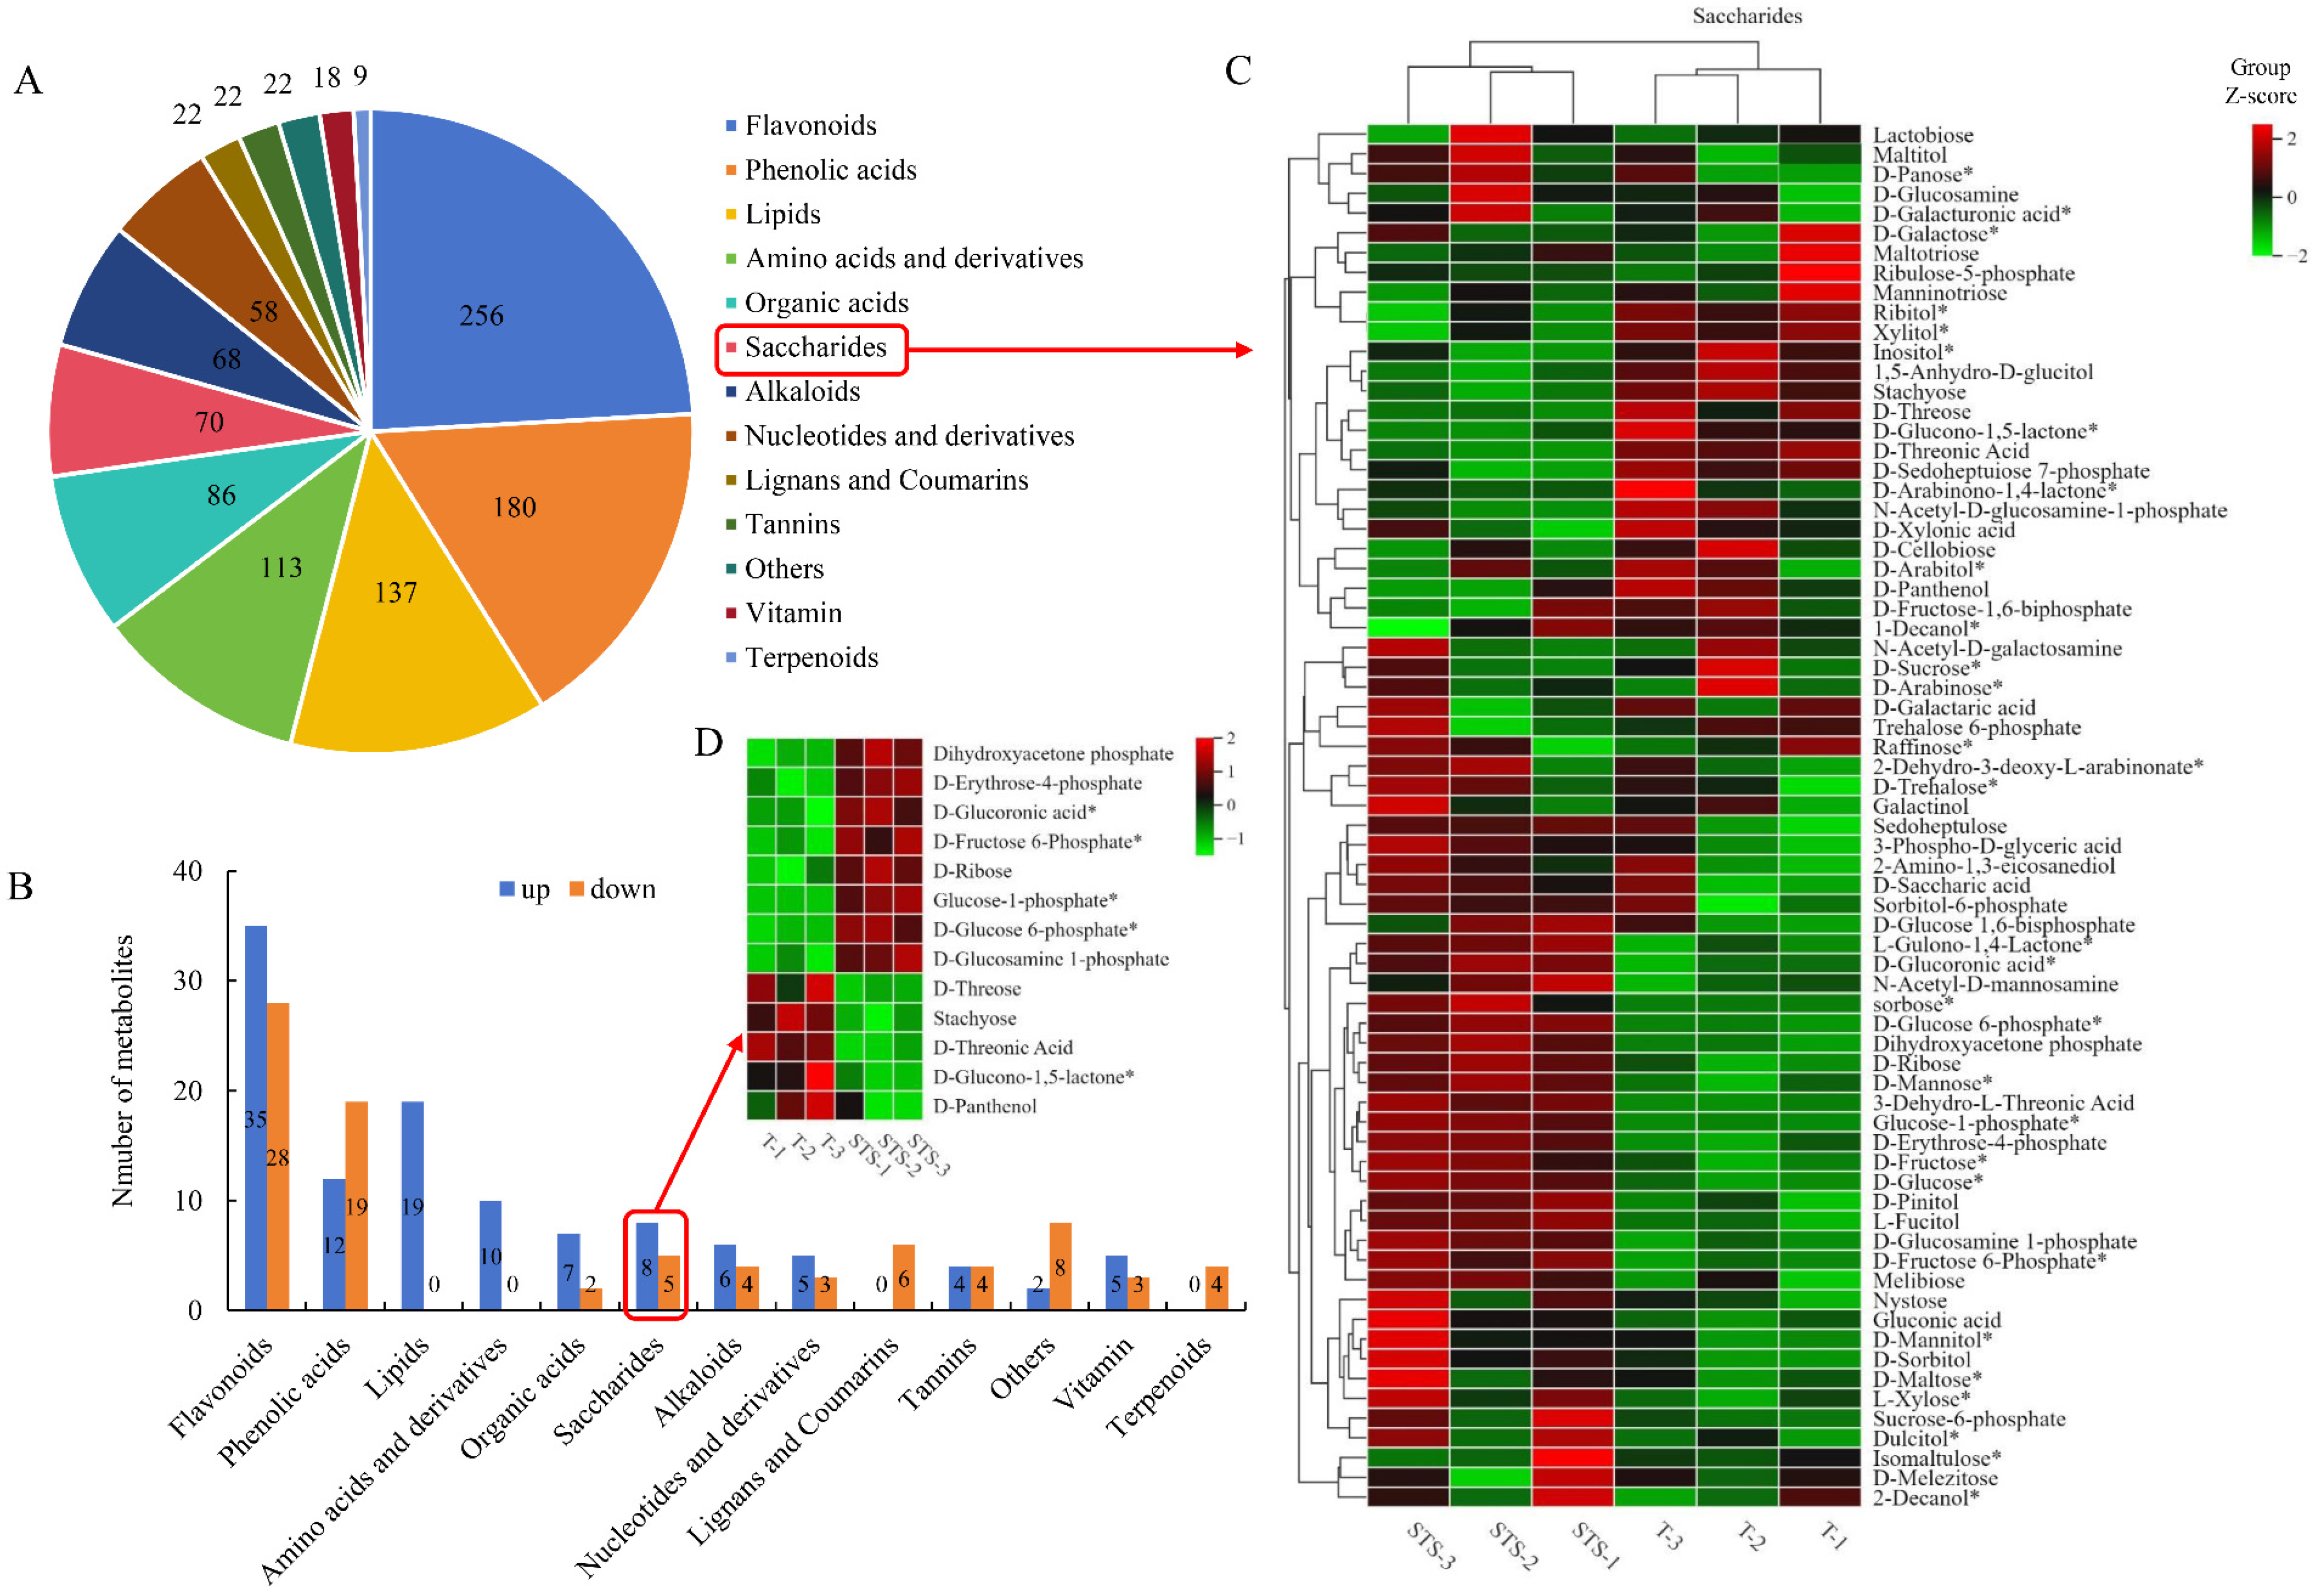
3.7. Differential Metabolite Identification

To analyze the change in metabolites, a widely targeted metabolome analysis using the tender leaves of tea seedlings was performed using an UPLC-MS/MS system. PCA revealed that variance shown in the horizontal axis and vertical axis was 63.26% (PC1) and 10.38% (PC2), respectively (Figure S3). This result shows that the STS and T can be clearly separated, indicating that there are differences in the metabolites.
A total of 1062 metabolites were detected. Flavonoids were the richest, including 256 compounds. Phenolic acids were the second largest group, with 180 compounds. In addition, other metabolites were also detected (Figure 7A). Compared to the T group, STS had 195 differential metabolites (111 up- and 84 down-regulated) based on a fold change ≥ 2 and fold change ≤ 0.5 (Figure 7B). Saccharides are the main product of photosynthesis. In this study, a total of 70 saccharides metabolites were extracted, and the content of most metabolites in STS was higher than that of T (Figure 7C). In addition, STS had eight up-regulated differential metabolites and five down-regulated differential metabolites compared with T, with 70 saccharides metabolites (Figure 7D). These up-regulated DEMs included Dihydroxyacetone phosphate (C3H7O6P), D-Erythrose-4-phosphate (C4H9O7P), D-Glucoronic acid* (C6H10O7), D-Fructose 6-Phosphate* (C6H13O9P), D-Ribose (C5H10O5), Glucose-1-phosphate* (C6H13O9P), D-Glucose 6-phosphate* (C6H13O9P) and D-Glucosamine 1-phosphate (C6H14NO8P). These down-regulated DEMs included D-Threose (C4H8O4), Stachyose (C24H42O21), D-Threonic Acid (C4H8O5), D-Glucono-1,5-lactone* (C6H10O6) and D-Panthenol (C9H19NO4).

4. Discussion

The ecological benefits of interplanting soybean in a tea plantation are mainly based on the characteristics of soybean plants. Soybean plants have large leaves and a large population, and the root system has the ability of nitrogen fixation, which can provide a suitable growth environment for the growth of tea seedlings [16]. In soybean–tea intercropping, soybean leaves reflect part of the light to the tea seedlings canopy, changing the light environment of the tea seedlings canopy. Therefore, to evaluate the effects of intercropping soybean on the spectral reflectance and photosynthetic capacity of tea tree seedlings, we compared the differences between intercropping soybean and solo tea from the perspectives of canopy multispectral reflectance, vegetation index, SPAD, Fv/Fm, gene transcription and metabolite changes.

4.1. Soybean–Tea Intercropping Changed the Spectral Characteristics of the Tea Seedlings Canopy

Canopy NIR reflectance is affected by leaf structure (leaf thickness, palisade thickness and spongy parenchyma, etc.) [29] and leaf arrangement (leaf angles and leaf clumping) [30]. These characteristics of canopy leaves can be used to elucidate plants’ functional responses to environmental changes, including leaf nitrogen availability and photosynthesis [29,30]. In this study, the spectral reflectance of the 720 nm, 750 nm and 840 nm bands in STS was significantly higher than that in T (Figure 2A). This was a very interesting result. The increased level of NIR reflectance indicated that the canopy leaf structure of tea seedlings in STS may undergo some changes to response to the changes in the surrounding environment. This surrounding environment might include light, temperature, etc. Notably, a strong positive correlation was reported between NIR reflectance and stomatal conductance [31]. Moreover, the increase in stomatal conductance can promote the enhancement of photosynthesis [32,33,34]. Therefore, the changes in tea seedlings’ leaf structure in the STS pattern are worthy of further study. We speculated that the increase in NIR reflectance is due to the change in leaf structure. At the same time, this change n structure led to an increase in stomatal conductance (Gs), which increased the photosynthetic rate (Pn) of tea seedlings.
Plant chlorophyll content can be more effectively assessed based on UAV multi-spectral images and machine learning algorithms, which is important for better understanding the interaction between plants and the environment [35]. Numerous studies have shown that spectral indices calculated using red edge and NIR bands were able to accurately estimate canopy chlorophyll content [36,37,38]. In this study, we calculated the 11 spectral indices using red edge and NIR bands, and the results showed that the values of CIgreen, CIred-edge, GLI, GNDVI, LCI, NDRE, NDVIg, RENDVI and VOG1 in STS were significantly higher than those in T (Figure 2B). Similarly, these vegetation indices were used to estimate canopy chlorophyll content of soybean, maize and poplar, and maintain a high correlation [11,36]. Therefore, it is speculated that there are differences in the canopy chlorophyll content of tea seedlings between STS and T.

4.2. Soybean–Tea Intercropping Improved the Photosynthetic Characteristics of Tea Seedlings’ Leaves

Soybean–tea intercropping is an effective cultivation measure to improve photosynthetic efficiency. The Gs, Pn, ABS, DI, RC/CS, ETo/RC and ETo/CSo in the soybean–tea intercropping were higher than those in the monoculture [15]. This study also indicated that the Fv/Fm and SPAD value in STS were significantly higher than T (Figure 3A,B). In addition, the ambient temperature around tea seedlings in STS was significantly lower than that of T (Figure 3C). Photosynthesis is sensitive and easily affected by high temperatures [39,40]. High-temperature stress resulted in the Fv/Fm, chlorophyll content, Pn, transpiration rate (Tr) and water potential decreasing significantly [41]. Extreme summer high-temperature (HT) conditions significantly inhibited the Pn and PSII photosynthetic activity of tea plants [42]. Therefore, the improvement in Fv/Fm in STS may have a great correlation with the decrease in tea canopy temperature.

4.3. Soybean–Tea Intercropping Enhanced Photosynthesis-Related Genes’ Expression Levels

PSII-LHCII super-complexes in plants are composed of core antenna proteins CP43 and CP47, and variable amounts of trimeric LHCII antennas, such as Lhcb1, Lhcb2, Lhcb3, Lhcb4, Lhcb5 and Lhcb6 proteins [13,43]. PSI-LHCI super-complexes in plants, such as Lhca1, Lhca2, Lhca3 and Lhca4, are also essential for coping with different light conditions [44]. LHC captures light energy and rapidly transfers energy to the reaction center to maximize the photosynthetic efficiency [45,46]. Previously published studies have demonstrated that the enhancement of photosynthetic capacity is always consistent with the up-regulated expression of light-harvesting complex I (LHCI) and II (LHCII) Chl a/b binding protein genes that acted as photosynthesis antenna proteins in tea plant leaves [2,45,47,48]. In this study, eight LHC genes involved in the photosynthesis–antenna proteins pathway were upregulated, including Lhca2 (CSS0017867), Lhca3 (CSS0018005), Lhcb1 (CSS0039893), Lhcb2 (CSS0041844), Lhcb3 (CSS0049576 and CSS0025719), Lhcb4 (CSS0014124 and CSS0043476) (Figure 4C,E). These LHC genes are mainly involved in the biological processes of photosynthesis, and light harvesting (Figure 5A,B). RT-qPCR showed that STS increased the expression of Lhcb1, Lhca3 and Lhcb4 (Figure 6). The transcription levels indicated that STS could enhance the light-harvesting capacity of tea seedlings by increasing the expression of Lhca2, Lhca3, Lhcb1, Lhcb2, Lhcb3 and Lhcb4.
The PSII complex contains more than 20 subunits [49]. The core subunits are mainly Psb proteins, including PsbB, PsbC, PsbR, PsbO, PsbP and PsbQ, which have photochemical reaction capabilities [50]. Fv/Fm can be used to reflect the intactness of the photosystems or the maximum potential capacity of a photochemical reaction [51]. The expression of PsbP and PsbR, as well as LHCII subunits Lhcb1, Lhcb2, Lhcb4, Lhcb5 and Lhcb6, in tea plants was significantly inhibited under the strong light conditions, and the Fv/Fm value was decreased. However, the expression levels of PsbP and PsbR and the value of Fv/Fm were significantly increased under low-light treatment [49]. Similarly, low light caused by artificial shading enhanced PsbR (CSS0016237) and increased Fv/Fm value [48]. The present study shows that STS clearly induced the expression of the PSII subunits PsbP (CSS0020461), PsbR (CSS0016237), PsbW (CSS0002873), Psb27 (CSS0031699) and Psb28 (CSS0017427) and PSI subunits PsaA (novel.8274), PsaH (CSS0004601) and PsaK (CSS0007721 and CSS0016265) (Figure 4D,F). In addition, these Psbs and Psas genes are key components of cellular component photosystem II and photosystem I (Figure 5D,E). This result indicates that the STS intercropping system could enhance photosystem II and photosystem I levels by increasing PsbP, PsbR, PsbW, Psb27, Psb28, PsaA, PsaH and PsaK expression. Combined with the previous discussion of Fv/Fm value, the improvement in PSII-LHCII and PSI-LHCI might be an important regulatory pathway for STS in enhancing the photosynthesis of tea seedlings.

4.4. Soybean–Tea Intercropping Promotes the Accumulation of Carbohydrate Substances

The enhanced photosynthesis activity can improve the accumulation and metabolism of carbohydrates, thus promoting the growth of tea seedlings [52]. The dark reaction of photosynthesis is mainly for CO2 fixation and the Calvin cycle, which ultimately ensures the conversion to sugars [53,54]. The transcriptome data in this study indicate that the STS intercropping system significantly improved the expression level of genes involved in the dark reaction, mainly including FBP1 (CSS0030665), RPE (CSS0047408 and CSS0027332), Calvin cycle protein CP12-1 (CSS0006498), transketolase (CSS0019185 and CSS0018066) and Lhcb2 (CSS0041844) (Figure 4C). A lot of evidence shows that these genes are involved in the regulation and synthesis of carbohydrates. FBP1 contributes to glucose homeostasis and was demonstrated to regulate plant growth in response to fructose signaling [55,56]. Ribulose-phosphate 3-epimerase (RPE) is involved in the regulation of pentose phosphate pathway [57]. The Calvin cycle protein CP12-1 has been shown to regulate the activity of two Calvin cycle enzymes, phosphoribulokinase (PRK) and glyceraldehyde-3-phosphate dehydrogenase (GAPDH), through the reversible formation of a multiprotein complex [58]. These conclusions suggest that the STS intercropping system can improve carbohydrate synthesis and regulation by up-regulating the expression of FBP1, RPE and Calvin cycle protein CP12-1. In addition, metabolomics data showed that the level of saccharides metabolites in the STS intercropping system were higher than that of T, especially Dihydroxyacetone phosphate, D-erythrose-4-phosphate, D-Glucoronic acid*, D-Fructose 6-Phosphate*, D-Ribose, Glucose-1-phosphate*, D-Glucose 6-phosphate* and D-Glucosamine 1-phosphate (Figure 7). The up-regulated expression levels of genes related to the dark reaction in transcriptome data were consistent with the metabolomics data. In conclusion, STS promotes the accumulation of carbohydrates in the leaves of tea seedlings by up-regulating the expression of genes in the dark reaction of photosynthesis.

5. Conclusions

This study investigated the molecular mechanism of soybean–tea intercropping to improve the photosynthesis activity in tea seedling leaves through multi-source remote sensing, photosynthetic characteristics, transcriptomics and metabolomics analysis. We obtained the following conclusions: (1) Based on the results of multispectral reflectance, VIs and thermal infrared remote sensing data, we determined that soybean–tea intercropping system can increase the canopy chlorophyll contents and reduce the canopy temperature of tea seedlings. (2) The photosynthetic characteristics data showed that soybean–tea intercropping could significantly improve the Fv/Fm and SPAD levels of tea seedling leaves. (3) At the transcriptome level, soybean–tea intercropping enhanced the photosynthesis activity of tea seedling leaves by improving the expression of light-harvesting genes (LHC), photosystem subunit genes (Psbs and Psas) and dark reaction biological process genes (FBP1, RPE, Calvin cycle protein CP12-1 and transketolase). (4) At the metabolome level, soybean–tea intercropping promoted the accumulation of carbohydrate metabolites, which provided further evidence for the enhancement of photosynthesis in the leaves of tea seedlings.
In conclusion, our research showed that intercropping soybean in young tea plantation could improve the photosynthesis activity of tea seedlings by improving the spectral characteristics of the tea seedlings canopy, reducing the canopy temperature and increasing the expression levels of LHC and photosystem subunit genes. Actually, soybean–tea intercropping is a mutually beneficial cultivation pattern of cash crops and food crops, which improves the growth environment of tea seedlings and increases soybean yield. Therefore, it is suggested to promote this pattern in terms of practical production. In addition, this intercropping pattern also improves the land-utilization rate of tea gardens, which is particularly valuable.

Supplementary Materials

The following supporting information can be downloaded at: https://www.mdpi.com/article/10.3390/agronomy14040850/s1, Table S1: Primers used for real-time PCR analysis; Table S2: Quality of transcriptomic data; Table S3: KEGG pathway enrichment analysis of the DEGs in STS vs. T; Table S4: GO pathway enrichment analysis of the DEGs in STS vs. T. Figure S1: Typical image obtained with the multispectral camera and the ROI selected from the image in this study; Figure S2: PCA score plot based on normalized gene count data from all samples; Figure S3: PCA score plot based on normalized metabolite count data from all samples.

Author Contributions

X.L. conducted experiments, analyzed the data, and wrote the manuscript. Y.X. and Y.M. participated in the collection and analysis of UAV remote sensing data. S.W., L.S. and J.S. revised the manuscript. X.X. and Y.W. collected samples. Z.D. conducted experiments and revised the manuscript. All authors have read and agreed to the published version of the manuscript.

Funding

This research was funded by the Agricultural Science and Technology Innovation Project of the Shandong Academy of Agricultural Sciences (CXGC2023F18, CXGC2023A11), the Project of Improved Agricultural Varieties in Shandong Province (2020LZGC010), the Technology System of Modern Agricultural Industry in Shandong Province (SDAIT-19-01).

Data Availability Statement

The original contributions presented in the study are publicly available. This data can be found here: NCBI, PRJNA1029300.

Acknowledgments

We thank the whole research group for their active role in the experimental process, data analysis, and manuscript revision. And we are grateful to Wuhan Metware Biotechnology Co., Ltd. for assisting in sequencing and bioinformatics analysis.

Conflicts of Interest

The authors declare no competing interests.

References

  1. Xia, E.; Zhang, H.; Sheng, J.; Li, K.; Zhang, Q.; Kim, C.; Zhang, Y.; Liu, Y.; Zhu, T.; Li, W.; et al. The Tea Tree Genome Provides Insights into Tea Flavor and Independent Evolution of Caffeine Biosynthesis. Mol. Plant 2017, 10, 866–877. [Google Scholar] [CrossRef] [PubMed]
  2. Yang, N.; Han, M.H.; Teng, R.M.; Yang, Y.Z.; Wang, Y.H.; Xiong, A.S.; Zhuang, J. Exogenous Melatonin Enhances Photosynthetic Capacity and Related Gene Expression in A Dose-dependent Manner in the Tea Plant (Camellia sinensis (L.) Kuntze). Int. J. Mol. Sci. 2022, 23, 6694. [Google Scholar] [CrossRef] [PubMed]
  3. Li, H.; Liu, Z.; Wu, Z.; Wang, X.; Teng, R.; Zhuang, J. Differentially expressed protein and gene analysis revealed the effects of temperature on changes in ascorbic acid metabolism in harvested tea leaves. Hortic. Res. 2018, 5, 65. [Google Scholar] [CrossRef] [PubMed]
  4. Liu, Z.W.; Li, H.; Liu, J.X.; Wang, Y.; Zhuang, J. Integrative transcriptome, proteome, and microRNA analysis reveals the effects of nitrogen sufficiency and deficiency conditions on theanine metabolism in the tea plant (Camellia sinensis). Hortic. Res. 2020, 7, 65. [Google Scholar] [CrossRef] [PubMed]
  5. Verma, N.; Shukla, S. Impact of various factors responsible for fluctuation in plant secondary metabolites. J. Appl. Res. Med. Aroma. 2015, 2, 105–113. [Google Scholar] [CrossRef]
  6. Croft, H.; Chen, J.M. Leaf Pigment Content. In Comprehensive Remote Sensing; Elsevier: Amsterdam, The Netherlands, 2018; pp. 117–142. [Google Scholar]
  7. Gitelson, A.A.; Peng, Y.; Arkebauer, T.J.; Schepers, J. Relationships between gross primary production, green LAI, and canopy chlorophyll content in maize: Implications for remote sensing of primary production. Remote Sens. Environ. 2014, 144, 65–72. [Google Scholar] [CrossRef]
  8. Féret, J.B.; François, C.; Gitelson, A.; Asner, G.P.; Barry, K.M.; Panigada, C.; Richardson, A.D.; Jacquemoud, S. Optimizing spectral indices and chemometric analysis of leaf chemical properties using radiative transfer modeling. Remote Sens. Environ. 2011, 115, 2742–2750. [Google Scholar] [CrossRef]
  9. Pan, W.J.; Wang, X.; Deng, Y.-R.; Li, J.H.; Chen, W.; Chiang, J.Y.; Yang, J.B.; Zheng, L. Nondestructive and intuitive determination of circadian chlorophyll rhythms in soybean leaves using multispectral imaging. Sci. Rep. 2015, 5, 11108. [Google Scholar] [CrossRef] [PubMed]
  10. Chungcharoen, T.; Donis-Gonzalez, I.; Phetpan, K.; Udompetaikul, V.; Sirisomboon, P.; Suwalak, R. Machine learning-based prediction of nutritional status in oil palm leaves using proximal multispectral images. Comput. Electron. Agric. 2022, 198, 107019. [Google Scholar] [CrossRef]
  11. Zhang, C.; Xue, Y. Estimation of Biochemical Pigment Content in Poplar Leaves Using Proximal Multispectral Imaging and Regression Modeling Combined with Feature Selection. Sensors 2024, 24, 217. [Google Scholar] [CrossRef] [PubMed]
  12. Oh, S.; Koh, S.C. Photosystem II photochemical efficiency and photosynthetic capacity in leaves of tea plant (Camellia sinensis L.) under winter stress in the field. Hortic. Environ. Biotechnol. 2014, 55, 363–371. [Google Scholar] [CrossRef]
  13. Gunell, S.; Lempiäinen, T.; Rintamäki, E.; Aro, E.M.; Tikkanen, M. Enhanced function of non-photoinhibited photosystem II complexes upon PSII photoinhibition. BBA Bioenerg. 2023, 1864, 148978. [Google Scholar] [CrossRef] [PubMed]
  14. Van Bezouwen, L.S.; Caffarri, S.; Kale, R.S.; Kouřil, R.; Thunnissen, A.M.W.H.; Oostergetel, G.T.; Boekema, E.J. Subunit and chlorophyll organization of the plant photosystem II supercomplex. Nat. Plants 2017, 3, 17080. [Google Scholar] [CrossRef] [PubMed]
  15. Duan, Y.; Shang, X.; Liu, G.; Zou, Z.; Zhu, X.; Ma, Y.; Li, F.; Fang, W. The effects of tea plants-soybean intercropping on the secondary metabolites of tea plants by metabolomics analysis. BMC Plant Biol. 2021, 21, 482. [Google Scholar] [CrossRef] [PubMed]
  16. Sun, L.; Dong, X.; Wang, Y.; Maker, G.; Agarwal, M.; Ding, Z. Tea-Soybean Intercropping Improves Tea Quality and Nutrition Uptake by Inducing Changes of Rhizosphere Bacterial Communities. Microorganisms 2022, 10, 2149. [Google Scholar] [CrossRef] [PubMed]
  17. Ma, Y.; Fu, S.; Zhang, X.; Zhao, K.; Chen, H. Intercropping improves soil nutrient availability, soil enzyme activity and tea quantity and quality. Appl. Soil Ecol. 2017, 119, 171–178. [Google Scholar] [CrossRef]
  18. Wu, T.; Zou, R.; Pu, D.; Lan, Z.; Zhao, B. Non-targeted and targeted metabolomics profiling of tea plants (Camellia sinensis) in response to its intercropping with Chinese chestnut. BMC Plant Biol. 2021, 21, 55. [Google Scholar] [CrossRef] [PubMed]
  19. Bai, Y.; Li, B.; Xu, C.; Raza, M.; Wang, Q.; Wang, Q.; Fu, Y.; Hu, J.; Imoulan, A.; Hussain, M.; et al. Intercropping Walnut and Tea: Effects on Soil Nutrients, Enzyme Activity, and Microbial Communities. Front. Microbiol. 2022, 13, 852342. [Google Scholar] [CrossRef]
  20. Wang, T.; Duan, Y.; Lei, X.G.; Cao, Y.; Liu, L.F.; Shang, X.W.; Wang, M.H.; Lv, C.J.; Ma, Y.C.; Fang, W.P.; et al. Tea Plantation Intercropping Legume Improves Soil Ecosystem Multifunctionality and Tea Quality by Regulating Rare Bacterial Taxa. Agronomy 2023, 13, 1110. [Google Scholar] [CrossRef]
  21. Huang, Z.; Cui, C.; Cao, Y.; Dai, J.; Cheng, X.; Hua, S.; Wang, W.; Duan, Y.; Petropoulos, E.; Wang, H. Tea plant-legume intercropping simultaneously improves soil fertility and tea quality by changing Bacillus species composition. Hortic. Res. 2022, 9, uhac046. [Google Scholar] [CrossRef] [PubMed]
  22. Duan, Y.; Wang, T.; Zhang, P.X.; Zhao, X.J.; Jiang, J.; Ma, Y.C.; Zhu, X.J.; Fang, W.P. The effect of intercropping leguminous green manure on theanine accumulation in the tea plant: A metagenomic analysis. Plant Cell Environ. 2024, 47, 1141–1159. [Google Scholar] [CrossRef] [PubMed]
  23. Zhong, Y.J.; Liang, L.N.; Xu, R.N.; Xu, H.Y.; Sun, L.L.; Liao, H. Intercropping tea plantations with soybean and rapeseed enhances nitrogen fixation through shifts in soil microbial communities. Front. Agric. Sci. Eng. 2022, 9, 344–355. [Google Scholar]
  24. Mao, Y.; Li, H.; Wang, Y.; Wang, H.; Shen, J.; Xu, Y.; Ding, S.; Wang, H.; Ding, Z.; Fan, K. Rapid monitoring of tea plants under cold stress based on UAV multi-sensor data. Comput. Electron. Agric. 2023, 213, 108176. [Google Scholar] [CrossRef]
  25. Tian, F.; Jia, T.; Yu, B. Physiological regulation of seed soaking with soybean isoflavones on drought tolerance of Glycine max and Glycine soja. Plant Growth Regul. 2014, 74, 229–237. [Google Scholar] [CrossRef]
  26. Kim, D.; Langmead, B.; Salzberg, S.L. HISAT: A fast spliced aligner with low memory requirements. Nat. Methods 2015, 12, 357–360. [Google Scholar] [CrossRef] [PubMed]
  27. Wang, J.X.; Liu, L.L.; Tang, Q.H.; Sun, K.; Zeng, L.; Wu, Z.J. Evaluation and selection of suitable qRT-PCR reference genes for light responses in tea plant (Camellia sinensis). Sci. Hortic. 2021, 289, 110488. [Google Scholar] [CrossRef]
  28. Arocho, A.; Chen, B.Y.; Ladanyi, M.; Pan, Q.L. Validation of the 2−ΔΔCt calculation as an alternate method of data analysis for quantitative PCR of BCR-ABL P210 transcripts. Diagn. Mol. Pathol. 2006, 15, 56–61. [Google Scholar] [CrossRef] [PubMed]
  29. Neuwirthova, E.; Lhotakova, Z.; Cervena, L.; Lukes, P.; Campbell, P.; Albrechtova, J. Asymmetry of leaf internal structure affects PLSR modelling of anatomical traits using VIS-NIR leaf level spectra. Eur. J. Remote Sens. 2024, 57, 2292154. [Google Scholar] [CrossRef]
  30. Béland, M.; Kobayashi, H. Drivers of deciduous forest near-infrared reflectance: A 3D radiative transfer modeling exercise based on ground lidar. Remote Sens. Environ. 2024, 302, 113951. [Google Scholar] [CrossRef]
  31. Pappula-Reddy, S.P.; Kumar, S.; Pang, J.Y.; Chellapilla, B.; Pal, M.; Millar, A.H.; Siddique, K.H.M. High-throughput phenotyping for terminal drought stress in chickpea (Cicer arietinum L.). Plant Stress 2024, 11, 100386. [Google Scholar] [CrossRef]
  32. Huang, G.J.; Zeng, Y.J. Increased stomatal conductance and leaf biochemical capacity, not mesophyll conductance, contributing to the enhanced photosynthesis in Oryza plants during domestication. Planta 2024, 259, 28. [Google Scholar] [CrossRef] [PubMed]
  33. Matsuda, H.; Takaragawa, H. Leaf Photosynthetic Reduction at High Temperatures in Various Genotypes of Passion Fruit (Passiflora spp.). Hortic. J. 2023, 92, 412–423. [Google Scholar] [CrossRef]
  34. Li, X.; Zhao, S.W.; Lin, A.Y.; Yang, Y.Y.; Zhang, G.Z.; Xu, P.; Wu, Y.J.; Yang, Z.C. Effect of Different Ratios of Red and Blue Light on Maximum Stomatal Conductance and Response Rate of Cucumber Seedling Leaves. Agronomy 2023, 13, 1941. [Google Scholar] [CrossRef]
  35. Yin, H.; Huang, W.L.; Li, F.; Yang, H.B.; Li, Y.; Hu, Y.C.; Yu, K. Multi-temporal UAV Imaging-Based Mapping of Chlorophyll Content in Potato Crop. PFG–J. Photogramm. Remote Sens. Geoinf. Sci. 2022, 91, 91–106. [Google Scholar] [CrossRef]
  36. Peng, Y.; Nguy-Robertson, A.; Arkebauer, T.; Gitelson, A.A. Assessment of Canopy Chlorophyll Content Retrieval in Maize and Soybean: Implications of Hysteresis on the Development of Generic Algorithms. Remote Sens. 2017, 9, 226. [Google Scholar] [CrossRef]
  37. Su, W.; Zhao, X.F.; Sun, Z.P.; Zhang, M.Z.; Zou, Z.C.; Wang, W.; Shi, Y.L. Estimating the Corn Canopy Chlorophyll Content Using the Sentinel-2A Image. Spectrosc. Spect. Anal. 2019, 39, 1535–1542. [Google Scholar]
  38. Schlemmer, M.; Gitelson, A.; Schepers, J.; Ferguson, R.; Peng, Y.; Shanahan, J.; Rundquist, D. Remote estimation of nitrogen and chlorophyll contents in maize at leaf and canopy levels. Int. J. Appl. Earth. Obs. 2013, 25, 47–54. [Google Scholar] [CrossRef]
  39. Greer, D.H.; Weedon, M.M. Modelling photosynthetic responses to temperature of grapevine (Vitis vinifera cv. Semillon) leaves on vines grown in a hot climate. Plant Cell Environ. 2012, 35, 1050–1064. [Google Scholar] [CrossRef] [PubMed]
  40. Tan, W.; Meng, Q.; Brestic, M.; Olsovska, K.; Yang, X. Photosynthesis is improved by exogenous calcium in heat-stressed tobacco plants. J. Plant Physiol. 2011, 168, 2063–2071. [Google Scholar] [CrossRef] [PubMed]
  41. Liu, J.J.; Zhang, Y.C.; Niu, S.C.; Hao, L.H.; Yu, W.B.; Chen, D.F.; Xiang, D.Y. Response of Dahlia Photosynthesis and Transpiration to High-Temperature Stress. Horticulturae 2023, 9, 1047. [Google Scholar] [CrossRef]
  42. Yang, Q.; Guo, Y.; Li, J.; Wang, L.; Wang, H.; Liu, G.; Fang, W.; Qiang, S.; Strasser, R.J.; Chen, S.G. Natural plant inducer 2-Amino-3-Methylhexanoic acid protects physiological activity against high-temperature damage to tea (Camellia sinensis). Sci. Hortic. 2023, 312, 111836. [Google Scholar] [CrossRef]
  43. Grieco, M.; Suorsa, M.; Jajoo, A.; Tikkanen, M.; Aro, E.M. Light-harvesting II antenna trimers connect energetically the entire photosynthetic machinery-including both photosystems II and I. BBA Bioenerg. 2015, 1847, 607–619. [Google Scholar] [CrossRef] [PubMed]
  44. Rantala, S.; Tikkanen, M. Phosphorylation-induced lateral rearrangements of thylakoid protein complexes upon light acclimation. Plant Direct 2018, 2, 39. [Google Scholar] [CrossRef] [PubMed]
  45. Elias, E.; Liguori, N.; Croce, R. At the origin of the selectivity of the chlorophyll-binding sites in Light Harvesting Complex II (LHCII). Int. J. Biol. Macromol. 2023, 243, 125069. [Google Scholar] [CrossRef] [PubMed]
  46. Palm, D.M.; Agostini, A.; Averesch, V.; Girr, P.; Werwie, M.; Takahashi, S.; Satoh, H.; Jaenicke, E.; Paulsen, H. Chlorophyll a/b binding-specificity in water-soluble chlorophyll protein. Nat. Plants 2018, 4, 920–929. [Google Scholar] [CrossRef] [PubMed]
  47. Chen, X.F.; Li, J.J.; Yu, Y.; Kou, X.B.; Periakaruppan, R.; Chen, X.; Li, X.H. STAY-GREEN and light-harvesting complex II chlorophyll a/b binding protein are involved in albinism of a novel albino tea germplasm ‘Huabai 1′. Sci. Hortic. 2022, 293, 110653. [Google Scholar] [CrossRef]
  48. Zaman, S.; Shen, J.; Wang, S.; Song, D.; Wang, H.; Ding, S.; Pang, X.; Wang, M.; Sabir, I.A.; Wang, Y.; et al. Effect of shading on physiological attributes and comparative transcriptome analysis of Camellia sinensis cultivar reveals tolerance mechanisms to low temperatures. Front. Plant Sci. 2023, 14, 1114988. [Google Scholar] [CrossRef] [PubMed]
  49. Cai, W.; Zheng, X.; Liang, Y. High-Light-Induced Degradation of Photosystem II Subunits’ Involvement in the Albino Phenotype in Tea Plants. Int. J. Mol. Sci. 2022, 23, 8522. [Google Scholar] [CrossRef] [PubMed]
  50. Silveira, J.A.G.; Carvalho, F.E.L. Proteomics, photosynthesis and salt resistance in crops: An integrative view. J. Proteom. 2016, 143, 24–35. [Google Scholar] [CrossRef]
  51. Cai, W.; Ma, J.; Guo, J.; Zhang, L. Function of ROC4 in the Efficient Repair of Photodamaged Photosystem II in Arabidopsis. Photochem. Photobiol. 2008, 84, 1343–1348. [Google Scholar] [CrossRef] [PubMed]
  52. Zhang, Y.; Zhang, Q.; Wang, Y.H.; Lin, S.X.; Chen, M.H.; Cheng, P.Y.; Du, M.R.; Jia, X.L.; Ye, J.H.; Wang, H.B. Study on the effect of magnesium on leaf metabolites, growth and quality of tea tree. Front. Plant Sci. 2023, 14, 1192151. [Google Scholar] [CrossRef] [PubMed]
  53. Zhi, Y.C.; Li, X.A.; Wang, X.W.; Jia, M.H.; Wang, Z.Y. Photosynthesis promotion mechanisms of artificial humic acid depend on plant types: A hydroponic study on C3 and C4 plants. Sci. Total Environ. 2024, 917, 170404. [Google Scholar] [CrossRef] [PubMed]
  54. Luo, L.Y.; Wang, S.Y.; Zhang, L.P.; Xiao, X.D.; Wu, B.G.; Jaroniec, M.; Jiang, B.J. Unveiling enhanced dark photocatalysis: Electron storage-enabled hydrogen production in polymeric carbon nitride. Appl. Catal. B-Environ. 2024, 343, 123475. [Google Scholar] [CrossRef]
  55. Li, Y.Y.; Sun, W.P.; Yao, Y.H.; Zhang, L.; Xu, S.W.; Zhang, Q.; Huang, T. FRUCTOSE INSENSITIVE1 regulates stem cell function in Arabidopsis in response to fructose signalling. J. Exp. Bot. 2023, 74, 3060–3073. [Google Scholar] [CrossRef] [PubMed]
  56. Pack, M.; Gulde, T.N.; Völcker, M.V.; Boewe, A.S.; Wrublewsky, S.; Ampofo, E.; Montenarh, M.; Götz, C. Protein Kinase CK2 Contributes to Glucose Homeostasis by Targeting Fructose-1,6-Bisphosphatase 1. Int. J. Mol. Sci. 2023, 24, 428. [Google Scholar] [CrossRef] [PubMed]
  57. Guo, M.X.; Zhang, X.Y.; Li, M.Y.; Li, T.T.; Duan, X.W.; Zhang, D.D.; Hu, L.M.; Huang, R.M. Label-Free Proteomic Analysis of Molecular Effects of 2-Methoxy-1,4-naphthoquinone on Penicillium italicum. Int. J. Mol. Sci. 2019, 20, 3459. [Google Scholar] [CrossRef] [PubMed]
  58. Singh, P.; Kaloudas, D.; Raines, C.A. Expression analysis of the Arabidopsis CP12 gene family suggests novel roles for these proteins in roots and floral tissues. J. Exp. Bot. 2008, 59, 3975–3985. [Google Scholar] [CrossRef] [PubMed]
Figure 1. The geographical location of the experimental area and the RGB images of sampling position. The letter T indicates monoculture tea. The letter STS indicates soybean–tea intercropping.
Agronomy 14 00850 g001
Figure 2. Spectral reflectance (A) and spectral indexes (B) of tea seedlings canopy with T and STS. Asterisks * indicate the difference level at p < 0.05; ** indicates the difference level at p < 0.01; *** indicates the difference level at p < 0.001.
Agronomy 14 00850 g002
Figure 3. SPAD (A), Fv/Fm (B) and canopy tempereture (C) of tea seedlings canopy with T and STS. Asterisks *** indicates the difference level at p < 0.001.
Agronomy 14 00850 g003
Figure 4. Photosynthesis-antenna proteins and photosynthesis pathways based on the KEGG pathway analysis. (A) The total number of DEGs in STS vs. T. (B) The number of DEGs in photosynthesis-antenna proteins and photosynthesis pathways. (C) Partial diagram of photosynthesis-antenna protein pathway. The red boxes in are associated with up-regulated genes, while green is associated with down-regulated genes. (D) Partial diagram of photosynthesis pathway. The blue boxes are associated with both up-regulated and down-regulated genes. The red and green boxes are the same as subfigure C. (E) Heatmap of the DEGs involved in the photosynthesis-antenna protein pathway. Expression differences in genes are represented by different colors, ranging from low (green) to high (red), based on log2foldchange. (F) Heatmap of the DEGs involved in the photosynthesis pathway. Color difference is the same as (E).
Agronomy 14 00850 g004
Figure 5. GO analysis related to photosynthesis. (A) The number of DEGs involved in 19 GO terms. (B) Heatmap of DEGs in the “photosynthesis, light harvesting” pathway. (C) Heatmap of DEGs in “photosynthesis, dark reaction”. (D) Heatmap of DEGs in PS II. (E) Heatmap of DEGs in PS I. Expression differences between genes are represented by different colors, ranging from low (green) to high (red), based on log2foldchange.
Agronomy 14 00850 g005
Figure 6. Relative expression levels of four LHC antenna genes and four PSII subunit genes in the tender buds and leaves of T and STS planting patterns. Asterisks * indicate the difference level at p < 0.05; ** indicates the difference level at p < 0.01; *** indicates the difference level at p < 0.001; **** indicates the difference level at p < 0.0001.
Agronomy 14 00850 g006
Figure 7. Identification of metabolites and components. (A) Total metabolites and their components, identified from the buds of tea seedlings. (B) Differential metabolites and their classification in STS vs. T. (C) Heatmap of saccharides changes in T and STS. (D) Heatmap of differential metabolites in saccharides. The asterisks * in (C,D) indicate that the metabolite has an isomer.
Agronomy 14 00850 g007
Table 1. Wavelength parameters of the MS600 multispectral camera.
WavelengthCentre (nm)Bandwidth (nm)
Blue45235
Green55525
Red66020
Red edge172010
Red edge275015
Near infrared84035
Table 2. VIs and calculation formulas.
VIsFormulation
LC(NIR − Edge1)/(NIR + Red)
MTC(Edge2 − Edge1)/(Edge1 − Red)
NDRE(NIR − Edge1)/(NIR + Edge1)
NDVI(Edge2 − Green)/(Edge2 + Green)
RENDVI(Edge2 − Edge1)/(Edge2 + Edge1)
VOG1Edge2/Edge1
CIgreen(NIR/Green) − 1
CIred-edge(NIR/Edge1) − 1
CVNIR × (RED/Blue2)
GLI(2 × Green − Red − Blue)/(2 × Green + Red + Blue)
GNDV(NIR − Green)/(NIR + Green)
Disclaimer/Publisher’s Note: The statements, opinions and data contained in all publications are solely those of the individual author(s) and contributor(s) and not of MDPI and/or the editor(s). MDPI and/or the editor(s) disclaim responsibility for any injury to people or property resulting from any ideas, methods, instructions or products referred to in the content.

