Article

Evaluation of Quinoa Varieties for Adaptability and Yield Potential in Low Altitudes and Correlation with Agronomic Traits

1
College of Agriculture, Shanxi Agricultural University, Jinzhong 030801, China
2
Provincial-Ministerial Collaborative Innovation Center for High Quality and Efficient Production of Specialty Crops on the Loess Plateau, Jinzhong 030801, China
3
Shanxi Jiaqi Agricultural Science and Technology Co., Ltd., Taiyuan 030010, China
4
Department of Botany, Government College Women University, Faisalabad 38000, Pakistan
*
Author to whom correspondence should be addressed.
Agronomy 2024, 14(4), 852; https://doi.org/10.3390/agronomy14040852
Submission received: 4 March 2024 / Revised: 15 April 2024 / Accepted: 17 April 2024 / Published: 19 April 2024
(This article belongs to the Section Crop Breeding and Genetics)

Abstract

:
The research conducted at the Shanxi Agricultural University’s Quinoa Experimental Model Base in Jinzhong, Shanxi Province, aimed to assess agronomic traits and their correlation with yield across 32 quinoa varieties. Three distinct yield categories emerged: low (≤1500 kg ha−1), middle (1500–2500 kg−1), and high (>2500 kg ha−1). High-yielding varieties demonstrated notable characteristics, including decreased plant height and increased leaf area per plant at maturity compared to low- and middle-yielding varieties. Moreover, the decline in leaf area per plant and root traits from flowering to maturity was less pronounced in the high-yielding varieties. The high-yielding varieties had a higher hardness of the stem base and middle stem by 12–13.7% and 6.3–11.5% compared to the medium- and low-yield varieties. Furthermore, high-yielding varieties indicated improvements in dry matter accumulation, decreased effective branch number, and increased main ear length and 1000-grain weight. Correlation analysis highlighted significant relationships between grain weight, yield, post-flowering senescence, and root and leaf characteristics. Structural equation model analysis revealed the negative impact of certain root and leaf traits on grain weight and yield, suggesting their importance in determining productivity. Notably, high-yielding varieties exhibited traits conducive to increased grain weight, including shorter plant height, slower root senescence, and enhanced post-flowering leaf resilience. These findings showed that understanding the relationship between agronomic traits and yield potential is crucial for optimizing quinoa production and promoting the sustainable development of this essential crop.

1. Introduction

Quinoa (Chenopodium quinoa Willd.), a revered member of the Amaranthaceae family, predominantly thrives in the Andes of South America [1,2,3]. This exceptional grain is celebrated for its balanced and comprehensive nutritional profile, outshining traditional grains with its superior protein, amino acid content, and essential vitamins and minerals [4]. It contains all nine essential amino acids, rendering it a complete protein source [5]. Quinoa is rich in dietary fiber, B vitamins, and antioxidants, offering a range of health benefits including improved digestion and reduced risk of chronic diseases [6]. Such nutritional richness has propelled quinoa to global recognition as one of the healthiest foods [1,2].
Despite its numerous advantages, quinoa cultivation faces several challenges. Uneven ripening can complicate harvest times and affect yield [7]. Additionally, its low tolerance to herbicides necessitates extensive manual labor, thus increasing labor costs [8]. Nevertheless, owing to its remarkable ecological resilience, quinoa demonstrates adaptability in various harsh environments, including drought, salinity, and cold and barren conditions, which has spurred its widespread cultivation and acceptance [9,10].
Quinoa was introduced to China in the late 20th century, and by 2010, it had achieved large-scale cultivation in Luliang, Shanxi Province. Since then, its cultivation has expanded to different regions as market demand and prices have continued to rise [11]. Shanxi Province, situated in the Loess Plateau, epitomizes arid or semi-arid areas where soil water scarcity significantly impacts crop yield and quality [12,13].
Plant phenotype serves as a fundamental tool for assessing crop production potential and morphologically associated traits. Understanding genotypic variations requires a comprehensive evaluation of multiple traits and their interactions with the environment [14]. Studies on quinoa germplasm in China have revealed variations in yield, morphology, and physiology, particularly in arid regions. Root development plays a crucial role in arid and semi-arid environments, as it influences plant growth and productivity [15]. Quinoa’s performance under drought conditions involves intricate physiological and morphological adaptations, including alterations in the root system that enhance water and nutrient uptake efficiency and yield formation [16]. Leaf area directly impacts plant productivity by facilitating light energy capture and assimilating production [17]. Leaf senescence, a determinant of biomass production, negatively affects yield by limiting nutrient mobilization [18]. To optimize yield, plants redistribute nutrients by adjusting leaf area, lateral branches, and senescence processes during the final developmental stages [19].
Previous studies revealed significant correlations between quinoa yield and agronomic traits, including plant height, stem diameter, branch number, panicle length, and grain weight [20,21]. Lodging, a common phenomenon affecting yield, is influenced by plant height, stem strength, and stem diameter [22,23]. Selecting phenological traits which favor lodging resistance could increase yield by reducing stem displacement and strengthening plant structure [24]. Helena et al. [25] evaluated the phenological and yield relationships in 30 quinoa genotypes and reported that the panicle length, seed weight, and seed diameters were the most influencing traits for a higher yield.
While previous research has identified correlations between quinoa yield and agronomic traits [26,27], few studies have explored trait disparities among quinoa germplasms at various yield levels and their implications for yield [28]. This preliminary study aims to address this gap by comparing and analyzing agronomic traits of different quinoa germplasm varieties in the low-altitude area of Shanxi. By elucidating growth characteristics and underlying post-anthesis root and leaf senescence, this research aims to identify high-yield quinoa germplasm suitable for regional cultivation, providing valuable insights for breeding and variety development.

2. Materials and Methods

2.1. Seed Material and Experimental Conditions

The experiment was conducted in 2021 at the Nong Valley Quinoa Base of Shanxi Agricultural University (37°42′N, 112°53′E), which belongs to a warm temperate continental climate with an altitude of 791 m, annual sunshine duration of 2500–2600 h, average annual temperature difference of 6 °C, and average annual precipitation of 458 mm. Thirty-two different quinoa varieties were provided by Shanxi Jiaqi Agricultural Technology Co., Ltd, Taiyuan, China (Table 1). Quinoa (Chenopodium quinoa Willd.) was sown in mid to late April and harvested in late September. Precipitation and temperature from April to September are shown in Table 2. Soil surface fertility was as follows: organic matter of 12.65 g kg−1, alkali-hydrolyzed nitrogen of 42.56 mg kg−1, available phosphorus of 15.65 mg kg−1, and available potassium of 210.66 mg kg−1.

2.2. Seed Sowing and Experimental Design

A randomized complete design (RCBD) with three replications (as blocks) was used in the experiment. The plot area of each replicate was 12 m × 4 m. The seeds were sown on 22 April 2021 and 150 kg ha–1 compound fertilizer was applied before sowing. Seeds were sown through a drill and the seeding rate was 5.25 kg ha–1. After germination, thinning was performed to attain an effective plant density of 15 × 104 ha−1. Weeds were controlled by hand and field-irrigated at different stages such as the seedling stage, branch stage, ear stage, flowering stage, and filling stage, in the routine control of pests and diseases, and when taking the harvest and yield measurements at the maturity stage.

2.3. Determination of Agronomic Traits

2.3.1. Green Leaf Area Per Quinoa Plant

During each growth stage of quinoa, five uniform quinoa plants were randomly selected. Ten green leaves of different sizes were removed from each plant and a 4 cm2 area of leaves was clipped using a punch. The whole leaves and leaf blades were dried at 105 °C in an oven for 30 min and then at 75 °C to constant weight. The dry weight of the green leaves per unit area and the total dry weight of the green leaves were recorded to calculate the green leaf area per plant as follows:
Green leaf area (cm2) = Dry leaf weight per plant × unit green leaf area/dry
weight per unit green leaf area

2.3.2. Root System Characteristics

After rinsing with deionized water, quinoa roots were placed on the glass plate of the root scanner. After scanning with the root scanner (EpsonperfectionV850Pro), the images were analyzed using the WinRHIZO2017 root analysis software. The parameters of total root length (TRL), root diameter, root volume (RV), and root tip number (RT) were obtained [29].

2.3.3. Dry Matter Mass

During each growth period, five plants with uniform growth were uprooted and placed in an oven at 105 °C for 30 min, dried at 75 °C to constant weight, weighed to record the dry matter mass of each plant, and then converted into dry matter mass per hectare [30].

2.3.4. Stalk Characteristics

Stalk strength traits were measured using a YYD-1-type stalk strength tester (Zhejiang Topu Yunnong Technology Company, Ltd., Hangzhou, China). The maximum penetrating value (Kpa) of the culm cuticle was recorded from the middle and base of the internode vertically at a constant speed. The node to be measured was placed in the groove of the analyzer, the distance between the two fulcrums was 2 cm, and the node to be measured was aligned with the middle point of the stalk strength tester; then, the pressure was slowly applied to the middle point of the node until it broke and the maximum force to break the stalk was the stem-breaking force of the node.

2.4. Yield and Panicle Architecture

When 80% of the leaves were yellow and senescence started, the yield of the 1 m2 sample area was harvested. A scythe or cutter was used to cut the stalks 50 cm above the ground. Stems were tied into small bundles. After natural air drying of the grains, the 1000-grain weight and the yield per plant were measured and converted into yield of hectares. Ten panicles were selected from the main axis and the length and width of the panicle were measured using a ruler. Panicle compactness was determined by dividing the number of panicle branches by the panicle length (Table 3).

2.5. Harvest Index (%)

The harvest index was calculated using the following formula:
H a r v e s t i n d e x % = G r a i n y i e l d D r y m a t t e r a c c u m u l a t i o n × 100

2.6. Data Analysis

For statistical data processing and visualization, Microsoft Excel 2010 was used. Systematic cluster analysis and mapping were conducted using SPSS 26.0 software. Analysis of variance (ANOVA) was performed for all analyses and significant variance among treatments was tested via the LSD method. Additionally, IBM SPSS 26.0 Amos software was utilized to analyze structural equation models, construct path diagrams, and calculate correlation coefficients and R2 values. Correlation analysis graphs using the Pearson correlation coefficient were drawn using Origin 2021 software.

3. Results

3.1. Yield Cluster Analysis

The cluster analysis was performed on the grain yield of 32 quinoa varieties. Considering the first and second levels of clustering, the quinoa cultivars were clustered into three categories (Figure 1). Ten varieties in cluster Ⅰ had yields lower than 1500 kg ha–1 and were categorized as low-yielding varieties (LY). The 16 varieties in cluster II with a yield of 1500–2500 kg ha–1 were categorized as the medium-yielding variety (MY). Class III consisted of six varieties with a yield higher than 2500 kg ha–1 and were categorized as high-yielding varieties (HY).

3.2. Differences in Agronomic Traits of Low-, Medium-, and High-Yield Quinoa Cultivars across Growth Stages

3.2.1. Plant Height

With the advancement of the growth process, plant height showed an increasing trend (Figure 2). The plant height of the LY varieties was the highest during all growth stages before flowering. At the flowering stage, the MY variety had the highest plant height, which was 4.4% and 9.7% higher compared with the LY and HY varieties. At maturity, the plant heights of the HY varieties were 24.8% and 22.4%, which were significantly lower compared with the LY and MY varieties. In conclusion, the plant height of high-yielding varieties of quinoa was significantly lower compared with the low and middle varieties during the whole growth period.

3.2.2. Green Leaf Area Per Plant

The green leaf area per plant increased first and then decreased with the growth period (Table 4). In the branching stage, the green leaf area per plant was the highest for the MY varieties with 15.6% and 3.1% higher green leaf area than the LY and HY varieties, respectively. In the ear and flowering stages, the number of green leaves per plant was the highest in the LY varieties in which the increase in green leaf area per plant from the ear to the flowering stage was 310.4 cm2, which was significantly higher than that in the HY varieties.
At maturity, the green leaf area per plant was reduced compared to the flowering stage and the reduction in green leaf area of the HY varieties was 34% and 30.4% lower than that of the LY and MY varieties.
The variation coefficient of the three quinoa categories increased first and then decreased with the growth period. Compared with the other growth stages, the variation coefficient was the highest in the heading stage, showing high genetic variability. With time, the variation coefficient of the MY and HY varieties decreased. The HY varieties had a relatively smaller coefficient of variation and high genetic stability compared to the LY and MY varieties.

3.2.3. Root Characteristics

The total root length, root diameter, and root volume increased first and then decreased with the advancement of the growth period, while the number of root tips showed an increasing trend (Figure 3). The total root length showed a rapid increase from the ear to the flowering stage. The HY varieties showed the maximum increment in root length from the ear to the flowering stage. The increase in root length of the LY, MY, and HY varieties was 283.96 cm, 278.73 cm, and 329.26 cm from the ear to the flowering stage, respectively. At maturity, the total root length of the HY varieties was higher than that of the LY and MY varieties.
From the ear to the flowering stage, the root diameter of the LY, MY, and HY varieties increased by 0.31 mm, 0.57 mm, and 0.42 mm, respectively. At the flowering and maturity stages, the root diameter was the highest for the HY varieties, but the decrease in the root diameter from the flowering to the maturity stage was 141% and 49.6% lower for the HY variety than that of the LY and MY varieties, respectively.
The ear to flowering stage was the rapid growth period for root volume. The root volume in the flowering and maturity stages was the highest for the HY varieties. The root volume was reduced at maturity compared to the flowering stage and the root volume reduction was lower for the HY varieties than that of the LY and MY varieties.
The root tip number was the highest for the HY varieties in the whole growth period. The root tip number from the heading to the flowering stage was 42.3% and 37.3% higher for the HY variety than that of the LY and MY varieties, respectively. Similarly, the root tip number at the maturity stage was significantly higher for the HY variety than that of the LY and MY varieties.

3.2.4. Dry Matter Accumulation

The dry matter accumulation per plant increased gradually with the growth period (Table 5). In the seeding and heading stages, the dry matter of the LY varieties was the highest. After the heading stage, the highest dry matter was accumulated by the HY varieties and was significantly higher than for the varieties in the other yield categories. The dry matter accumulation of the HY varieties at the maturity stage was 46.64% and 15.67% higher than that for the LY and MY varieties. The coefficient of variation of dry matter accumulation increased first, reaching its highest in the flowering stage, and then decreased at maturity. The coefficient of variation was lower for the HY variety than that of the LY and MY varieties at the flowering and maturity stages. It can be seen that the dry matter accumulation of the HY varieties was higher in the late growth stage.

3.3. Stem Strength and Yield Traits of Low-, Medium-, and High-Yield Quinoa Cultivars at Maturity

3.3.1. Stem Characteristics

The stem diameter, hardness of the stem base, and the hardness of the middle part of the stem were the highest for the HY varieties (Table 6). Compared with the LY and MY varieties, the hardness of the stem base of the HY varieties was 12% and 13.7% higher, and the hardness of the middle part of the stem was 11.5% and 6.3% higher. The stem-breaking force of the MY variety was higher, reaching 11.52 N, which was 20.40% higher compared with the LY varieties.
The coefficient of variation of the stem diameter was the lowest (7.48%) for the MY variety, followed by the HY variety, while the highest was for the LY variety, and both the LY and HY varieties were greater than 10%. The coefficient of variation of stem base hardness was greater than 10% for all yield categories, showing high genetic variation. The coefficient of variation of hardness in the middle of the stem and the coefficient of variation of stem-breaking force decreased gradually with the increase in yield. It can be seen that the high-yield varieties have thicker stems and high hardness and lodging resistance.

3.3.2. Panicle Characteristics

The average main stem ear length was significantly higher for the HY varieties, which was 20.3% and 13.8% higher compared with the LY and MY varieties, respectively. The main ear width was the highest for the LY varieties, which increased by 20.6% and 27.7% compared with the MY and LY varieties, respectively (Table 7). The degree of ear compactness was the highest in the HY varieties, followed by MY, and the lowest in the LY varieties. The coefficient of variation gradually decreased with the increase in yield. The coefficient of variation was the highest for the main stem panicle length and lowest for panicle compactness. The variation coefficient of the main stem panicle width was the lowest for the HY variety. It can be seen that the HY varieties have longer main stem panicles, more compact panicles, and low variation.

3.3.3. Yield and Component Factors

The effective branch number was the lowest for the HY varieties, which was 37.8% and 14.2% lower than that of the LY and MY varieties, respectively (Table 8). The 1000-grain weight was the highest for the HY variety, which was 36% and 16% higher than that of the LY and MY varieties, respectively. The yield of the LY, MY, and HY varieties significantly varied and was 932.6 kg ha–1, 1853.9 kg ha–1, and 2781.6 kg ha–1, respectively. The harvest index of the HY varieties was significantly higher than that of the LY and MY varieties, reaching 13.15%. The coefficient of variation decreased first and then increased with the increase in yield and was the lowest for the MY variety. It can be seen that high-yield varieties have fewer effective branches and higher 1000-grain weight, which is more conducive to a high yield.

3.4. Correlation Analysis between Yield and Agronomic Traits

The correlation analysis was performed between yield, plant height, stem-breaking force, main stem ear length, main stem ear width, dry matter accumulation, effective branch number, and 1000-grain weight at maturity stage, and the reduction in total root length, root diameter, root volume, and green leaf area per plant from the flowering to the maturity stage (Figure 4). The yield showed a significant positive correlation with the 1000-grain weight, dry matter weight, spike length of the main stem, and the stem-breaking force. On the other hand, it showed a significant negative correlation with the effective branch number, root diameter reduction range, and leaf area reduction. Thousand-grain weight was significantly positively correlated with the dry matter accumulation, significantly positively correlated with stem-breaking force value, significantly negatively correlated with effective branch number and reduction in green leaf area per plant and root diameter, and significantly negatively correlated with reduction in total root length and root volume. The number of effective branches was significantly positively correlated with the reduction in root diameter and green leaf area per plant, and significantly negatively correlated with the reduction in total root length, dry matter accumulation, stress value of stem breaking, and the length of main stem spike. There was a significant positive correlation between dry matter weight and stem-breaking force value, and a significant negative correlation between dry matter weight and root diameter, total root length reduction, and green leaf area reduction per plant.

3.5. Structural Equation Modeling of Yield and Agronomic Traits

The relationship between yield and main agronomic traits was analyzed using the structural equation model (Figure 5). The results showed that the reduction in total root length had a significant positive effect on plant height. The reduction in green leaf area per plant was positively affected by plant height, total root length reduction, and root diameter reduction. The reduction in green leaf area per plant had a significant positive effect on the number of effective branches. The 1000-grain weight and yield were negatively affected by the reduction in total root length, the reduction in root diameter, the reduction in green leaf area per plant, and the number of effective branches.
The results of the cluster analysis on quinoa yield and subsequent analysis of agronomic traits across different yield categories provide valuable insights into the relationship between yield and various plant characteristics. The cluster analysis identified three distinct yield categories based on grain yield: low-yielding (LY), medium-yielding (MY), and high-yielding (HY) varieties. These categories provide a basis for understanding the performance of different quinoa cultivars in terms of yield potential.
Yield components such as effective branch number and 1000-grain weight varied significantly among yield categories. High-yielding varieties demonstrated fewer effective branches but higher 1000-grain weight, suggesting efficient resource allocation towards grain production. This study also found a positive correlation between yield per plant and 1000-grain weight. Previous research has mentioned a positive correlation of yield with seed size, harvest index, and 1000-grain weight [20,31,32]. On the other hand, the number of effective branches at maturity decreased with increasing yield, consistent with the results of Woo et al. [19].
The harvest index (HI) reflects the ability of crop photosynthetic assimilation products to be converted into economic products. A high harvest index indicates that plants have a mechanism for supplying a higher biomass to seeds. In this study, the harvest index of quinoa was low (8.77–13.15%), but the HI increased with the yield, and the HY varieties depicted a higher HI. This suggests that increasing the HI is an important way to increase the yield of quinoa [33]. Therefore, increasing the 1000-grain weight, reducing the branch number, and improving the biomass allocation mechanism can be considered important research directions for increasing quinoa yield.
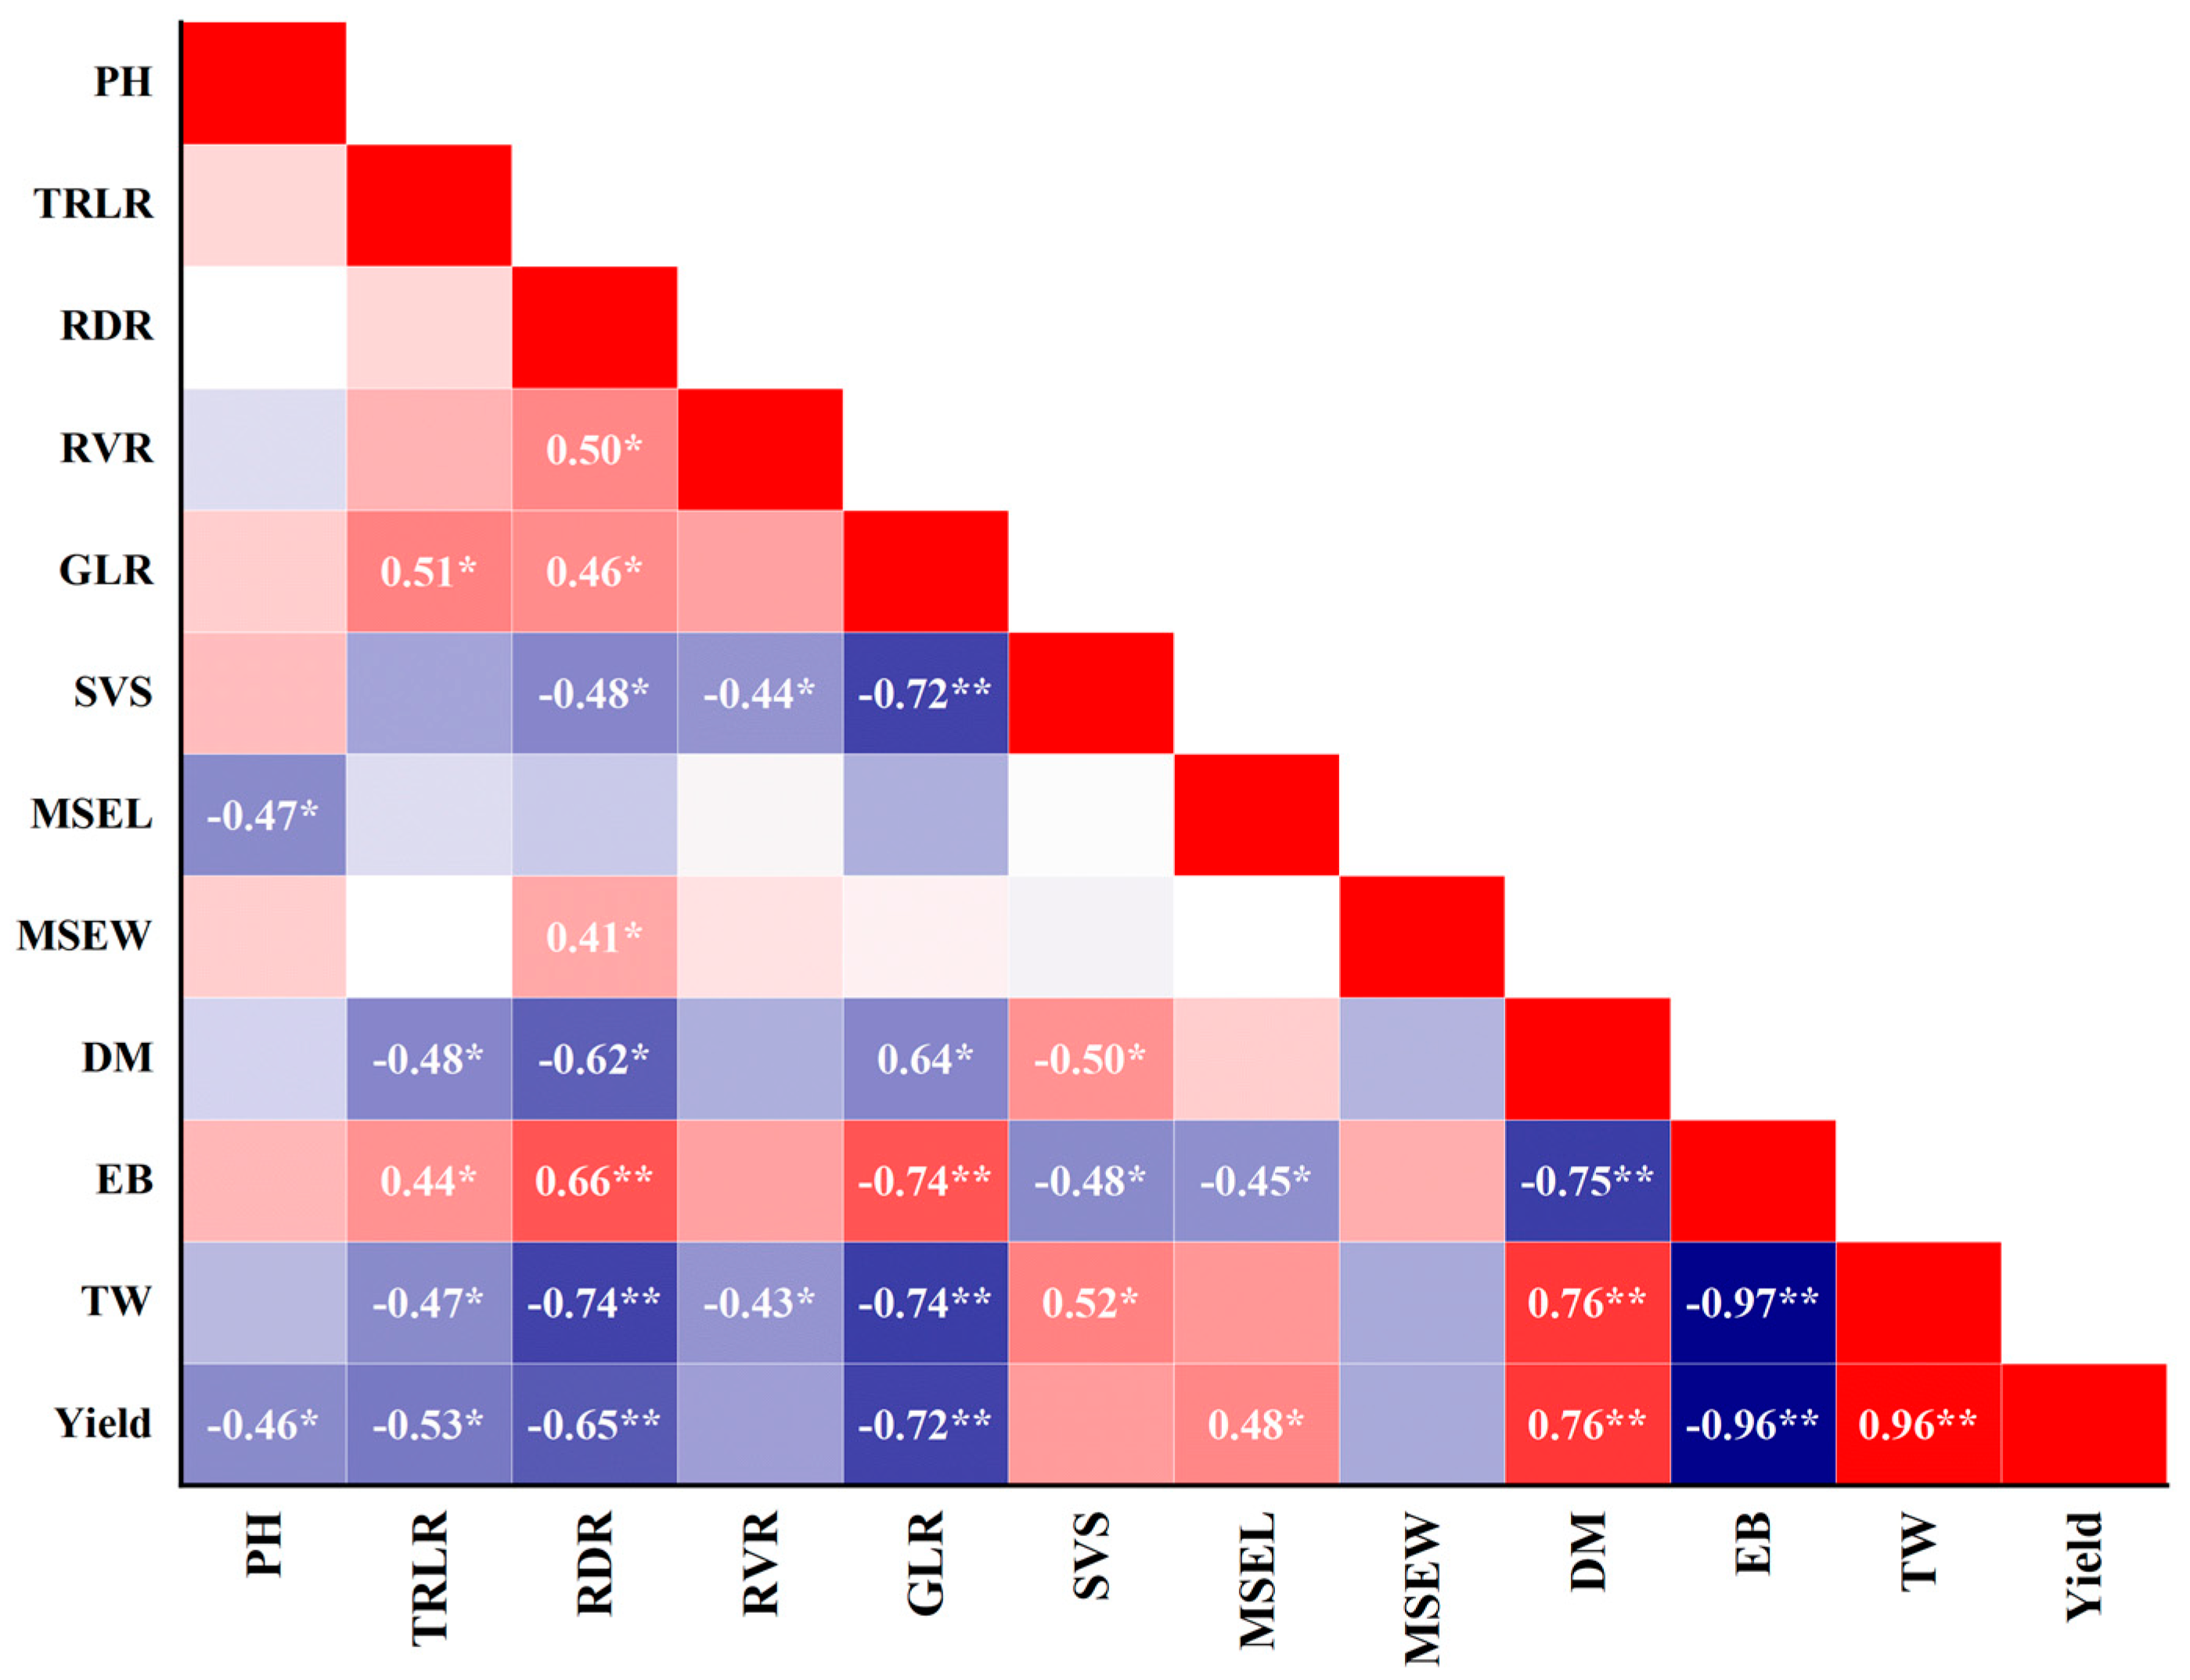
Correlation analysis revealed significant relationships between yield and various agronomic traits. Positive correlations were observed between yield and traits such as dry matter accumulation, stem-breaking force, and 1000-grain weight, while negative correlations were observed with traits like effective branch number. These correlations highlight the importance of specific traits in determining yield potential and suggest potential breeding targets for improving quinoa productivity.
The ear (panicle) length of the main stem was found to be significantly higher in the HY varieties, and this increase was positively correlated with yield. On the other hand, the ear width of the main stem at the maturity stage was significantly lower in the HY varieties, and it gradually decreased with increasing yield. The yield was negatively correlated with the ear width and positively correlated with the ear length of the main stem. These findings align with a previous study by Dumschott et al. [7]. However, Manjarres-Hernández et al. [25] reported that quinoa accessions with longer panicle lengths (>57.94 cm) had a lower yield. This discrepancy might be because the maximum average panicle length (43.04 cm) in the present study was lower than the limit referred to by Manjarres-Hernández et al. [25].
Additionally, the dry matter weight at maturity increased with increasing yield. Considering the research by Qi et al. [34], it is evident that quinoa with longer main inflorescence and more branches requires more biomass. In this study, it is speculated that as yield increased, the growth resources were continuously transferred to the panicle, causing a delay in stem growth after flowering. Therefore, breeding high-yield quinoa with dwarf, thick stems, longer main spike length, and strong plants can be considered a promising direction.
Roots serve as the primary interface between plants and the soil [35]. The strength of roots can be determined by various factors such as root number, morphology, and physiological indices [36,37]. This study found that high-yield varieties exhibited the highest values for total root length, root diameter, root volume, and root tip number during the flowering and maturity stages, which aligns with the findings of Sarropoulou et al. [38].
In the present study, the root length and diameter increased consistently with the growth stage until the flowering stage and then growth was slowed or stopped. Previous research on rice roots has demonstrated that slowing down the root growth and delaying the physiological activities of roots after flowering enhances leaf photosynthetic efficiency, promotes grain growth, and increases yield [39,40]. The decrease in total root length, root diameter, and root volume after flowering was found to be associated with increased yield. Specifically, yield was significantly negatively correlated with the decrease in total diameter, total root length, and root volume after anthesis. These findings are consistent with the study by Ma et al. [41]. The quinoa varieties that attained higher root length and diameter at the flowering stage and maintained this until the maturity stage showed enhanced grain weight and yield.
Dry matter accumulation per plant increased with the growth period, with high-yielding varieties accumulating the highest dry matter at maturity. This suggests that high-yielding varieties allocate more resources to biomass production, contributing to increased yield potential. Photosynthesis plays a crucial role in the accumulation of dry matter, which directly impacts crop yield. After flowering, enhancing physiological activity and improving photosynthetic performance can delay the senescence of flag leaves, promote the assimilation of synthesis, and increase grain weight [42]. The findings of this study indicate that high-yield varieties exhibit the highest green leaf area per plant and superior dry matter accumulation during the maturity stage. High-yielding varieties tended to have lower reductions in green leaf area at maturity compared to low- and medium-yielding varieties. Notably, there is a significant negative correlation between yield and the decrease in green leaf area per plant after anthesis. The reduction in green leaf area decrement after anthesis, coupled with an increase in net photosynthetic rate, led to enhanced dry matter accumulation and increased grain yield, aligning with previous research [43,44].
The root distribution of quinoa is shallow and the stem is fragile. During the flowering to maturity period, extreme weather conditions can lead to lodging and stem breakage. Variations in plant height were observed across different yield categories and growth stages. Interestingly, the high-yielding varieties exhibited a shorter plant height compared to the low- and medium-yielding varieties at maturity, suggesting potential trade-offs between plant height and yield [45]. Differences in stem diameter, hardness, and panicle traits were observed among yield categories. High-yielding varieties tended to have thicker stems, higher stem hardness, longer main stem ear length, and more compact panicles, indicating structural characteristics that may contribute to higher yield stability and resistance to lodging [46]. Additionally, the stem diameter, hardness of the middle part of the stem, and stress value of the stem at maturity all increased with increasing yield, which aligns with the results of previous studies [47]. The yield of quinoa is positively correlated with the stress value of the stem. The low and thick stem of quinoa enhances lodging resistance, promoting the accumulation of dry matter and increasing grain weight and yield.
The structural equation model (SEM) analysis provided insights into the complex relationships among different agronomic traits and their effects on yield. The 1000-grain weight and yield were negatively affected by the reduction in total root length, the reduction in root diameter, the reduction in green leaf area per plant, and the number of effective branches. These results highlighted the importance of root characteristics, plant height, and green leaf area in influencing yield, underscoring the multifaceted nature of yield determination in quinoa.
Overall, these results contribute to a better understanding of the factors influencing quinoa yield and provide valuable information for breeding programs aimed at developing high-yielding varieties with improved agronomic traits and yield stability.

4. Conclusions

To summarize, this study categorized the yield of 32 quinoa varieties into three categories in this study. High-yielding varieties exhibited several advantages: They maintained lower plant heights while developing stronger and thicker stems, resulting in increased resistance to lodging. Furthermore, these varieties attained higher dry matter accumulation and possessed extensive root systems characterized by greater length, volume, and number of tips, facilitating water and nutrient absorption. Despite having fewer effective branches, they compensated for yield with significantly heavier grain weights, highlighting their superior yield potential. The structural equation modeling revealed that the higher observed yield could be attributed to the slower senescence of the roots and leaves after anthesis. Consequently, high-yield genotypes exhibited less of a reduction in green leaf area, root diameter, and root length, indicating an improved ability to absorb water and accumulate photosynthate during the grain-filling stage, ultimately enhancing the yield.

Author Contributions

Data curation, A.R.; Funding acquisition, M.S.; Investigation, Z.J. and R.W.; Methodology, K.C. and X.W.; Project administration, Z.G.; Writing—original draft, P.T.; Writing—review and editing, P.T., S.A. and M.S. All authors have read and agreed to the published version of the manuscript.

Funding

This research is a collaborative innovation center of provincial and ministerial level for high-quality and efficient production Special crops in the Loess Plateau were supported. Science and Technology Assistance Project for Developing Countries (KY202002002), Key Project of Shanxi Province Research and Development Plan (202102140601007), the technology innovation team of China Shanxi Province (No. 201605D131041), the Key Laboratory of Shanxi Province (No. 201705D111007), the “1331” Engineering Key Laboratory of Shanxi Province, and the “1331” Engineering Key Innovation Cultivation Team of Shanxi Province (No. SXYBKY201733).)

Data Availability Statement

The data that support the findings of this study are available from the corresponding author.

Conflicts of Interest

Author Xiangyun Wu from company Shanxi Jiaqi Agricultural Science and Technology Co., Ltd. The remaining authors declare that the research was conducted in the absence of any commercial or finaical relationships that could be construed as a potential conflicts of interests.

References

  1. Navruz-Varli, S.; Sanlier, N. Nutritional and health benefits of quinoa (Chenopodium quinoa Willd.). J. Cereal Sci. 2016, 69, 371–376. [Google Scholar] [CrossRef]
  2. Vilcacundo, R.; Hernández-Ledesma, B. Nutritional and biological value of quinoa (Chenopodium quinoa Willd.). Curr. Opin. Food Sci. 2017, 14, 1–6. [Google Scholar] [CrossRef]
  3. Etaati, M.; Ardakani, M.R.; Bagheri, M.; Paknejad, F.; Golzardi, F. Grain Yield, Nutritional Value and Fatty Acids Profile of Quinoa (Chenopodium quinoa Willd.) Genotypes in Semi-arid Climatic Condition. Gesunde Pflanz. 2022, 75, 993–1002. [Google Scholar] [CrossRef]
  4. Jan, N.; Hussain, S.Z.; Naseer, B.; Bhat, T.A. Amaranth and quinoa as potential nutraceuticals: A review of anti-nutritional factors, health benefits and their applications in food, medicinal and cosmetic sectors. Food Chem. X 2023, 18, 100687. [Google Scholar] [CrossRef] [PubMed]
  5. Jianxin, S.; Yao, T. Effect of extrusion temperature on characteristic amino acids, fatty acids, organic acids, and phenolics of white quinoa based on metabolomics. Food Res. Int. 2023, 169, 112761. [Google Scholar]
  6. Ramos-Pacheco, B.S.; Choque-Quispe, D.; Ligarda-Samanez, C.A.; Solano-Reynoso, A.M.; Palomino-Rincón, H.; Choque-Quispe, Y.; Peralta-Guevara, D.E.; Moscoso-Moscoso, E.; Aiquipa-Pillaca, Á.S. Effect of Germination on the Physicochemical Properties, Functional Groups, Content of Bioactive Compounds, and Antioxidant Capacity of Different Varieties of Quinoa (Chenopodium quinoa Willd.) Grown in the High Andean Zone of Peru. Foods 2024, 13, 417. [Google Scholar] [CrossRef]
  7. Dumschott, K.; Wuyts, N.; Alfaro, C.; Castillo, D.; Fiorani, F.; Zurita-Silva, A. Morphological and Physiological Traits Associated with Yield under Reduced Irrigation in Chilean Coastal Lowland Quinoa. Plants 2022, 11, 323. [Google Scholar] [CrossRef]
  8. Merino, J.; Pedreros, A.; Fischer, S.; López, M.D. Effect of post-emergence herbicides on stress indicators in quinoa. Chil. J. Agric. Res. 2020, 80, 21–29. [Google Scholar] [CrossRef]
  9. McGinty, E.M.; Murphy, K.M.; Hauvermale, A.L. Seed Dormancy and Preharvest Sprouting in Quinoa (Chenopodium quinoa/italic Willd). Plants 2021, 10, 458. [Google Scholar] [CrossRef]
  10. Mu, H.; Xue, S.; Sun, Q.; Shi, J.; Zhang, D.; Wang, D.; Wei, J. Research progress of quinoa seeds (Chenopodium quinoa Wild.): Nutritional components, technological treatment, and application. Foods 2023, 12, 2087. [Google Scholar] [CrossRef]
  11. Sun, S.L.; Zhu, Z.D.; Zhang, J.L.; Mei, L. Outbreak of Choanephora stem rot caused by Choanephora cucurbitarum on quinoa (Chenopodium quinoa) in China. Plant Dis. 2018, 102, 2379. [Google Scholar] [CrossRef]
  12. Wang, Z.; Fu, X. Scheme simulation and predictive analysis of water environment carrying capacity in Shanxi Province based on system dynamics and DPSIR model. Ecol. Indic. 2023, 154, 110862. [Google Scholar] [CrossRef]
  13. Zhang, Y.; Liu, B.; Sui, R. Evaluation and Driving Determinants of the Coordination between Ecosystem Service Supply and Demand: A Case Study in Shanxi Province. Appl. Sci. 2023, 13, 9262. [Google Scholar] [CrossRef]
  14. Achim, W.; Frank, L.; Andreas, H. Plant phenotyping: From bean weighing to image analysis. Plant Methods 2015, 11, 14. [Google Scholar]
  15. de Souza Campos, P.M.; Meier, S.; Morales, A.; Lavanderos, L.; Nahuelcura, J.; Ruiz, A.; López-García, Á.; Seguel, A. New Insights into the Phosphorus Acquisition Capacity of Chilean Lowland Quinoa Roots Grown under Low Phosphorus Availability. Plants 2022, 11, 3043. [Google Scholar] [CrossRef]
  16. Li, R.; Zeng, Y.; Xu, J.; Wang, Q.; Wu, F.; Cao, M.; Lan, H.; Liu, Y.; Lu, Y. Genetic variation for maize root architecture in response to drought stress at the seedling stage. Breed. Sci. 2015, 65, 298–307. [Google Scholar] [CrossRef]
  17. Asplund, L.; Bergkvist, G.; Weih, M. Functional traits associated with nitrogen use efficiency in wheat. Acta Agric. Scand. Sect. B—Soil Plant Sci. 2015, 66, 153–169. [Google Scholar] [CrossRef]
  18. Gaju, O.; DeSilva, J.; Carvalho, P.; Hawkesford, M.J.; Griffiths, S.; Greenland, A.; Foulkes, M.J. Leaf photosynthesis and associations with grain yield, biomass and nitrogen-use efficiency in landraces, synthetic-derived lines and cultivars in wheat. Field Crops Res. 2016, 193, 1–15. [Google Scholar] [CrossRef]
  19. Woo, H.R.; Kim, H.J.; Lim, P.O.; Nam, H.G. Leaf Senescence: Systems and Dynamics Aspects. Annu. Rev. Plant Biol. 2019, 70, 347–376. [Google Scholar] [CrossRef]
  20. Ali, S.; Chattha, M.U.; Hassan, M.U.; Khan, I.; Chattha, M.B.; Iqbal, B.; Rehman, M.; Nawaz, M.; Amin, M.Z. Growth, Biomass Production, and Yield Potential of Quinoa (Chenopodium quinoa Willd.) as Affected by Planting Techniques Under Irrigated Conditions. Int. J. Plant Prod. 2020, 14, 427–441. [Google Scholar] [CrossRef]
  21. Jorfi, A.; Alavifazel, M.; Gilani, A.; Ardakani, M.R.; Lak, S. Yield and morpho-physiological performance of quinoa (Chenopodium quinoa) genotypes as affected by phosphorus and zinc. J. Plant Nutr. 2022, 45, 2432–2446. [Google Scholar] [CrossRef]
  22. Wang, N.; Wang, F.; Shock, C.C.; Meng, C.; Qiao, L. Effects of Management Practices on Quinoa Growth, Seed Yield, and Quality. Agronomy 2020, 10, 445. [Google Scholar] [CrossRef]
  23. Berry, P.M.; Spink, J.H.; Gay, A.P.; Craigon, J. A comparison of root and stem lodging risks among winter wheat cultivars. J. Agric. Sci. 2003, 141, 191–202. [Google Scholar] [CrossRef]
  24. Khan, S.; Anwar, S.; Kuai, J.; Ullah, S.; Fahad, S.; Zhou, G. Optimization of nitrogen rate and planting density for improving yield, nitrogen use efficiency, and lodging resistance in oilseed rape. Front. Plant Sci. 2017, 8, 246598. [Google Scholar] [CrossRef] [PubMed]
  25. Manjarres-Hernández, E.H.; Morillo-Coronado, A.C.; Ojeda-Pérez, Z.Z.; Cárdenas-Chaparro, A.; Arias-Moreno, D.M. Characterization of the yield components and selection of materials for breeding programs of quinoa (Chenopodium quinoa Willd.). Euphytica 2021, 217, 101. [Google Scholar] [CrossRef]
  26. Manjarres-Hernández, E.H.; Arias-Moreno, D.M.; Morillo-Coronado, A.C.; Ojeda-Pérez, Z.Z.; Cárdenas-Chaparro, A. Phenotypic Characterization of Quinoa (Chenopodium quinoa Willd.) for the Selection of Promising Materials for Breeding Programs. Plants 2021, 10, 1339. [Google Scholar] [CrossRef]
  27. Hussain, M.I.; Muscolo, A.; Ahmed, M.; Asghar, M.A.; Al-Dakheel, A.J. Agro-morphological, yield and quality traits and interrelationship with yield stability in quinoa (Chenopodium quinoa Willd.) genotypes under saline marginal environment. Plants 2020, 9, 1763. [Google Scholar] [CrossRef] [PubMed]
  28. Shah, S.S.; Shi, L.; Li, Z.; Ren, G.; Zhou, B.; Qin, P. Yield, Agronomic and Forage Quality Traits of Different Quinoa (Chenopodium quinoa Willd.) Genotypes in Northeast China. Agronomy 2020, 10, 1908. [Google Scholar] [CrossRef]
  29. Nguyen, L.V.; Bertero, D.; Hoang, D.T.; Long, N.V. Variation in quinoa roots growth responses to drought stresses. J. Agron. Crop Sci. 2021, 208, 830–840. [Google Scholar] [CrossRef]
  30. Mengistu, G.; Aleme, M.; Bogale, A.; Tulu, D.; Faji, M.; Terefe, G.; Mohammed, K. Dry matter yield and nutritive quality of alfalfa (Medicago sativa L.) cultivars grown in sub-humid areas in Ethiopia. Cogent Food Agric. 2022, 8, 2154854. [Google Scholar] [CrossRef]
  31. Taaime, N.; El Mejahed, K.; Choukr-Allah, R.; Bouabid, R.; Oukarroum, A.; El Gharous, M. Optimization of macronutrients for improved grain yield of quinoa (Chenopodium quinoa Wild.) crop under semi-arid conditions of Morocco. Front. Plant Sci. 2023, 14, 1146658. [Google Scholar] [CrossRef]
  32. Gómez, M.B.; Curti, R.N.; Bertero, H.D. Seed weight determination in quinoa (Chenopodium quinoa Willd.). J. Agron. Crop Sci. 2022, 208, 243–254. [Google Scholar] [CrossRef]
  33. Rauf, S.; Sadaqat, H.A. Effect of organic amendments on the microbial populations of the rhizosphere of quinoa cultivation (Chenopodium quinoa Willd.) in the South Altiplano of Bolivia. J. Selva Andin. Biosph. 2019, 7, 32–43. [Google Scholar]
  34. Wu, Q.; Bai, X.; Zhao, W.; Shi, X.; Xiang, D.; Wan, Y.; Wu, X.; Sun, Y.; Zhao, J.; Peng, L.; et al. Investigation into the underlying regulatory mechanisms shaping inflorescence architecture in Chenopodium quinoa. BMC Genom. 2019, 20, 658. [Google Scholar] [CrossRef] [PubMed]
  35. Almeida, D.M.; Oliveira, M.M.; Saibo, N.J. Regulation of Na+ and K+ homeostasis in plants: Towards improved salt stress tolerance in crop plants. Genet. Mol. Biol. 2017, 40, 326–345. [Google Scholar] [CrossRef] [PubMed]
  36. Awad, W.; Byrne, P.F.; Reid, S.D.; Comas, L.H.; Haley, S.D. Great plains winter wheat varies for root length and diameter under drought stress. Agron. J. 2018, 110, 226–235. [Google Scholar] [CrossRef]
  37. Fu, Y.; Li, P.; Mounkaila Hamani, A.K.; Wan, S.; Gao, Y.; Wang, X. Effects of Single and Combined Drought and Salinity Stress on the Root Morphological Characteristics and Root Hydraulic Conductivity of Different Winter Wheat Varieties. Plants 2023, 12, 2694. [Google Scholar] [CrossRef] [PubMed]
  38. Sarropoulou, V.; Dimassi-Theriou, K.; Therios, I.; Koukourikou-Petridou, M. Melatonin enhances root regeneration, photosynthetic pigments, biomass, total carbohydrates and proline content in the cherry rootstock PHL-C (Prunus avium × Prunus cerasus). Plant Physiol. Biochem. 2012, 61, 162–168. [Google Scholar] [CrossRef] [PubMed]
  39. Liu, L.H.; Wang, W.W.; He, H.A.; Nie, N.L. Correlation of Leaf and Root Senescence During Ripening in Dry Seeded and Transplanted Rice. Rice Sci. 2018, 25, 279–285. [Google Scholar]
  40. Ye, J.; Yang, W.; Li, Y.; Wang, S.; Yin, L.; Deng, X. Seed Pre-Soaking with Melatonin Improves Wheat Yield by Delaying Leaf Senescence and Promoting Root Development. Agronomy 2020, 10, 84. [Google Scholar] [CrossRef]
  41. Ma, S.C.; Duan, A.W.; Ma, S.T.; Yang, S.J. Effect of Early-Stage Regulated Deficit Irrigation on Stem Lodging Resistance, Leaf Photosynthesis, Root Respiration and Yield Stability of Winter Wheat under Post-Anthesis Water Stress Conditions. Irrig. Drain. 2016, 65, 673–681. [Google Scholar] [CrossRef]
  42. Jobson, M.E.; Johnston, E.R.; Oiestad, J.A.; Martin, J.M.; Giroux, M.J. The Impact of the Wheat Rht-B1b Semi-Dwarfing Allele on Photosynthesis and Seed Development Under Field Conditions. Front. Plant Sci. 2019, 10, 388208. [Google Scholar] [CrossRef]
  43. Jahan, E.; Sharwood, R.E.; Tissue, D.T. Effects of leaf age during drought and recovery on photosynthesis, mesophyll conductance and leaf anatomy in wheat leaves. Front. Plant Sci. 2023, 14, 1091418. [Google Scholar] [CrossRef]
  44. Kretzler, B.; Rodrigues Gabriel Sales, C.; Karady, M.; Carmo-Silva, E.; Dodd, I.C. Maintenance of Photosynthesis as Leaves Age Improves Whole Plant Water Use Efficiency in an Australian Wheat Cultivar. Agronomy 2020, 10, 1102. [Google Scholar] [CrossRef]
  45. Gao, Z.; Wang, Y.; Tian, G.; Zhao, Y.; Li, C.; Cao, Q.; Han, R.; Shi, Z.; He, M. Plant height and its relationship with yield in wheat under different irrigation regime. Irrig. Sci. 2020, 38, 365–371. [Google Scholar] [CrossRef]
  46. Muhammad, A.; Hao, H.; Xue, Y.; Alam, A.; Bai, S.; Hu, W.; Sajid, M.; Hu, Z.; Samad, R.A.; Li, Z.; et al. Survey of wheat straw stem characteristics for enhanced resistance to lodging. Cellulose 2020, 27, 2469–2484. [Google Scholar] [CrossRef]
  47. Wang, D.; Ding, W.H.; Feng, S.W.; Hu, T.Z.; Li, G.; Li, X.H.; Yang, Y.Y.; Ru, Z.G. Stem characteristics of different wheat cultivars and their relationship with lodging resistance. Chin. J. Appl. Ecol. 2016, 27, 1496–1502. [Google Scholar] [CrossRef]
Figure 1. Quinoa yield cluster analysis.
Agronomy 14 00852 g001
Figure 2. Plant height of quinoa at different yield levels in different periods. The bars indicate means (n = 3 ± standard error) and different lowercase letters on the bars indicate significant differences among the LY, ML, and HY categories at a specific growth stage using the LSD test (p < 0.05). LY, MY, and HY indicate low-, medium-, and high-yielding genotypes, respectively.
Agronomy 14 00852 g002
Figure 3. Root characteristics of quinoa at different yield levels in different periods. The bars indicate means (n = 3 ± standard error) and different lowercase letters on the bars indicate significant differences among the LY, ML, and HY categories at a specific growth stage using the LSD test (p < 0.05). LY, MY, and HY indicate low-, medium-, and high-yielding genotypes, respectively.
Agronomy 14 00852 g003
Figure 4. Correlation analysis between yield and agronomic characteristics of quinoa. GLR: green leaf area reduction; DM: dry matter accumulation; EB: effective branch number; MSEL: main stem ear (panicle) length; MSEW: main stem ear (panicle) width; PH: plant height; RDR: root diameter reduction; RVR: root volume reduction, SVS: stress value of stem; TW: thousand-grain weight; TRLR: total root length reduction. * indicates significant level (p < 0.05); ** indicates very significant level (p < 0.01).
Agronomy 14 00852 g004
Figure 5. Structural equation modelling to reveal the relationship between quinoa yield and main agronomic traits. GLR: green leaf area reduction; EB: effective branch number; PH: plant height; RDR: root diameter reduction; RVR: root volume reduction, TW: thousand-grain weight; TRLR: total root length reduction. * indicates significant level (p < 0.05); ** indicates very significant level (p < 0.01); *** indicates very significant level (p < 0.005).
Agronomy 14 00852 g005
Table 1. The names and apparent characteristics of different quinoa varieties used in the current study.
Sr. No.Variety No.Apical Leaf ColorSpike ColorSr. No.Variety No.Apical Leaf ColorSpike Color
1JQ-00955GreenGreen17JQ-00685WhiteGreen
2JQ-00987GreenWhite18JQ-02259GreenWhite
3JQ-00679GreenGreen19JQ-00783GreenGreen
4JQ-00764GreenIndipink20JQ-00080WhiteGreen
5JQ-01347GreenGreen21JQ-02267LilacPurple
6JQ-02284GreenWhite22JQ-02275WhiteGreen
7JQ-01525PurplePurple23JQ-00984PurpleLilac
8JQ-01778GreenGreen24JQ-00174WhiteGreen
9JQ-00920LilacPurple25JQ-02319GreenGreen
10JQ-01141WhiteWhite26JQ-00623LilacPurple
11JQ-00988GreenGreen27JQ-02307LilacPurple
12JQ-01961GreenGreen28JQ-00317WhiteIndipink
13JQ-00952GreenGreen29JQ-00573WhiteGreen
14JQ-02342WhiteIndipink30JQ-00294PinkPink
15JQ-00740GreenGreen31JQ-00425GreenGreen
16JQ-00927GreenGreen32JQ-01238GreenIndipink
Table 2. Precipitation and temperature at the experimental site in Taigu.
AprilMayJuneJulyAugust September
Precipitation (mm)10.813.975.679.892.058.7
Average temperature (°C)12.7818.8023.2724.1623.3321.21
Table 3. Phenotyping scoring of ear compactness of quinoa.
AssignmentStandard
1Most dispersive
2More dispersive
3Dispersive
4Tight
5Tighter
6Tightest
Table 4. The green leaf area (cm2) at different yield levels and growth stages of quinoa.
TypeSeeding StageBranch StageEar stageFlowering StageMaturity Stage
AverageCVAverageCVAverageCVAverageCVAverageCV
LY35.36 a5.55%72.11 b8.43%144.57 a18.26%454.98 a16.16%128.42 b16.19%
MY38.19 a7.62%85.41 a6.31%133.05 b17.05%434.81 ab16.69%156.53 ab12.08%
HY37.11 a4.31%82.75 a9.47%143.58 a13.66%410.70 b11.12%181.80 a11.03%
Different lowercase letters following means indicate significant differences among the LY, ML, and HY categories using the LSD test (p < 0.05). LY, MY, and HY indicate low-, medium-, and high-yielding genotypes, respectively. CV refers to the coefficient of variation.
Table 5. The difference in dry matter accumulation (kg ha–1) of quinoa at different yield levels and growth stages.
TypeSeeding StageBranching StageEar StageFlowering StageMaturity Stage
AverageCVAverageCVAverageCVAverageCVAverageCV
LY64.50 a3.06%632.50 a10.49%2088.00 c22.19%5647.50 c28.95%9736.50 c15.73%
MY55.50 b4.92%477.00 c15.61%2194.50 b16.37%7489.50 b17.03%15388.50 b16.83%
HY54.00 b3.11%545.50 b10.30%2512.50 a11.41%9736.50 a12.52%18247.50 a10.61%
Different lowercase letters following means indicate significant differences among the LY, ML, and HY categories using the LSD test (p < 0.05). LY, MY, and HY indicate low-, medium-, and high-yielding genotypes, respectively. CV refers to the coefficient of variation.
Table 6. Differences in culm characteristics of quinoa at maturity at different yield levels.
TypeStem Thickness (mm)Stem Base Hardness (Kpa)Mid-Stem Hardness (Kpa)Stress Value of Stem Section (N)
AverageCVAverageCVAverageCVAverageCV
LY9.65 a19.75%346.22 b16.79%268.63 b12.11%9.17 c19.14%
MY10.13 a7.48%339.71 b35.68%284.34 b6.66%10.82 b9.05%
HY10.72 a12.60%393.59 a12.73%303.35 a5.96%11.52 a4.17%
Different lowercase letters following means indicate significant differences among the LY, ML, and HY categories using the LSD test (p < 0.05). LY, MY, and HY indicate low-, medium-, and high-yielding genotypes, respectively. CV refers to the coefficient of variation.
Table 7. Differences in ear traits of quinoa at maturity at different yield levels.
TypeMain Stem Ear Length (cm)Main Stem Ear Width (cm)Panicle Compactness
AverageCVAverageCVAverageCV
LY34.28 c18.14%16.47 a15.34%3.17 c5.25%
MY37.08 b13.33%13.07 b10.58%4.25 b4.01%
HY43.04 a11.91%11.91 c5.62%5.10 a2.85%
Different lowercase letters following means indicate significant differences among the LY, ML, and HY categories using the LSD test (p < 0.05). LY, MY, and HY indicate low-, medium-, and high-yielding genotypes, respectively. CV refers to the coefficient of variation.
Table 8. Differences in yield and yield components of quinoa at different yield levels.
TypeEffective Branching NumberThousand Seed Weight (g)Yield (kg ha–1)Harvest Index
(%)
AverageCVAverageCVAverageCV
LY37.05 a6.42%1.90 c17.35%932.56 c30.85%8.77 c
MY30.69 b2.73%2.49 b2.49%1853.78 b6.94%10.93 b
HY26.88 c5.93%2.96 a8.32%2781.61 a12.17%13.15 a
Different lowercase letters following means indicate significant differences among the LY, ML, and HY categories using the LSD test (p < 0.05). LY, MY, and HY indicate low-, medium-, and high-yielding genotypes, respectively. CV refers to the coefficient of variation.
Disclaimer/Publisher’s Note: The statements, opinions and data contained in all publications are solely those of the individual author(s) and contributor(s) and not of MDPI and/or the editor(s). MDPI and/or the editor(s) disclaim responsibility for any injury to people or property resulting from any ideas, methods, instructions or products referred to in the content.

