
The Biogas Production Potential and Community Structure Characteristics of the Co-Digestion of Dairy Manure and Tomato Residues
State Key Laboratory of Nutrient Use and Management/Key Laboratory of Agricultural Environment in Huang-Huai-Hai Plain, Ministry of Agriculture and Rural Affairs, Institute of Agricultural Resources and Environment, Shandong Academy of Agricultural Sciences, Jinan 250100, China
*
Author to whom correspondence should be addressed.
Agronomy 2024, 14(5), 881; https://doi.org/10.3390/agronomy14050881
Submission received: 20 March 2024
/
Revised: 18 April 2024
/
Accepted: 22 April 2024
/
Published: 23 April 2024
(This article belongs to the Special Issue Nutrient Cycling and Environmental Effects on Farmland Ecosystems)
Abstract
:Anaerobic digestion is an important means to turn agricultural waste into resources and an important way to address the challenges in treating vegetable residues in China. In this study, the co-digestion of dairy manure with tomato residue was investigated to clarify the effect of the total solids (TS) of the digestion substrate on methane’s production and mechanism using the self-made anaerobic digestion device. The results showed that all treatments could rapidly ferment methane and that the daily methane production showed a trend of increasing first and then decreasing. The optimal concentrations of the digestion substrate for liquid anaerobic digestion (L-AD), hemi-solid-state anaerobic digestion (HSS-AD), and solid-state anaerobic digestion (SS-AD) were 10%, 18%, and 25%, respectively. Compared with SS-AD and HSS-AD, L-AD gas production peaked 3–6 days earlier. Treatment TS25 had the best cumulative methane production, reaching 117.4 mL/g VS. However, treatment TS6 had acid accumulation and a very unstable system. The cumulative methane production of SS-AD was higher than that of HSS-AD and L-AD. Firmicutes and Bacteroidetes were the dominant flora, and Methanoculleus, Methanosarcina, and Methanobrevibacter were the main archaeal groups. The TS significantly changed the microbial community composition of the digestion system, especially the low TS treatment. The results presented herein indicated that TS significantly changed the bacterial and archaeal community composition of the digestion system, and thus with the increase in TS from 6% to 25%, the methane yield increased.
1. Introduction
As of the end of 2022, there are 104,200 biogas plants in China, and the main substrates are livestock and poultry manure. Since the implementation of the transformation and upgrading of biogas projects in 2015, the development of extra-large biogas projects has become a trend. The extra-large biogas plants usually have a reactor volume of ≥5000 m3. Due to stable methane yield production, extra-large biogas plants are economically feasible. Manure has a low energy value and low biogas conversion efficiency, and thus livestock manure alone can no longer meet the needs of the normal operation of biogas plants, so it is imperative to add a co-substrate for anaerobic digestion.
Tomato is one of the most important main vegetables in China. Tomato production was 65.15 million tons in 2022, nearly one-third of the global tomato production. Due to their perishable characteristics, the large amount of tomato vines produced cannot be used in landfills. Tomato vines are a potential resource of anaerobic digestion owing to the high biodegradability and high moisture content of this waste stream, and a wide variety of tomato vines are underutilized causing a serious waste of resources and other environmental problems [1,2]. If tomato residues are added to livestock manure as an auxiliary material for anaerobic digestion, the problems of the shortage of raw materials for very large biogas projects and difficulty in processing tomato seedlings will be solved [3,4].
According to the total solids (TS) of the digestion substrate, anaerobic digestion was divided into liquid anaerobic digestion (L-AD, TS < 10%), hemi-solid-state anaerobic digestion (HSS-AD, 10% < TS < 20%), and solid-state anaerobic digestion (SS-AD, TS > 20%) [5,6]. In general, L-AD is one of the most commonly used anaerobic digestion methods due to the low digestion concentration of the material, the ease of stirring, the more convenient operation and maintenance, and the high mass transfer efficiency [7]. However, due to the high concentration of the material digestion, small reactor volume, and small footprint, SS-AD and HSS-AD are considered to be more advantageous [8,9,10]. In recent years, many scholars have conducted a large amount of research on L-AD and SS-AD using single materials or mixtures of wastes such as livestock and poultry manure and crop straw [11,12,13]. Yu et al. (2020) [14] evaluated the effect of mixing ratios on biogas production during the mesophilic digestion of cabbage waste and cattle manure, showing that a 30–50% methane yield increase appeared in AD co-digestion compared with mono feedstock. The anaerobic co-digestion of cow manure and canteen food waste yielded greater biogas (147–300 cm3/g VS) than mono-digestion and could play a better role in nutrient management for the circular economy [15]. Mlaik et al. (2024) [16] found that the anaerobic co-digestion of fruits and vegetable waste with cow manure and poultry manure achieved a 1.3-fold higher biogas yield than that of fruits and vegetable waste’s mono-digestion. However, tomato residues were added as an auxiliary material to the livestock and poultry manure digestion system, and the investigation of the effects of digestion substrate concentration on the gas production performance, stability, and microbial community characteristics of the system has not been reported.
Therefore, in this study, tomato residues were selected as an excipient in the dairy manure anaerobic digestion system (1) to compare the effect of the digestion substrate concentration (L-AD, TS < 12%; HSS-AD, 12% ≤ TS < 20%; SS-AD, TS ≥ 20%) on methane production and (2) to examine digestion characteristics and the microbial community structure to clarify the effect mechanism of the digestion substrate on methane production.
2. Materials and Methods
2.1. Raw Materials and Inoculum
Dairy manure was obtained from the cowshed of Yinxiang Weiye Group Co., Ltd. and was homogenized using a blender. The tomato residues were obtained from the Modern Agriculture Demonstration Garden in Jinan City and were crushed to a particle size of less than 5.0 mm using a food waste disposer (DAOGRS MCD-56, DAOGRS INC, China). All materials were stored in a 4 °C freezer until use.
The sludge from the Hengyuan agricultural biogas plant (with dairy manure and tail vegetables as substrate) in Changqing District, Jinan, was collected and centrifuged at 2000 r/min for 15 min. The collected precipitate was used as the inoculum. The inoculum was stored in a walk-in cooler at 4 °C in a sealed bucket until use. The chemical properties of the raw materials and inoculum are shown in Table 1.
2.2. Equipment
The digestion device consisted of a constant temperature cabinet, a reactor, a flowmeter and an air bag. The reactor has a volume of 2.5 L. The reactor, flowmeter, and air bag were connected by glass tubes and rubber tubes. The biogas generated was collected by an air bag. The digestion was measured by a flowmeter, the reactor was placed in a constant temperature cabinet, and the temperature of the constant temperature cabinet was set at 35 ± 1 °C (Figure 1).
2.3. Experimental Design
Nine treatments were set up according to different digestion technologies (L-AD, TS < 10%; HSS-AD, 10% < TS < 20%; SS-AD, TS > 20%: TS 6% (TS6); TS 8% (TS8); TS 10% (TS10); TS 12% (TS12); TS 15% (TS15); TS 18% (TS18); TS 20% (TS20); TS 22% (TS22); TS 25% (TS25). Each treatment had three replicates. In the anaerobic digestion system, the mass ratio of dairy manure to tomato residue was 1:1, and the inoculation ratio was 1. After the addition of materials, nitrogen was bubbled into the reactor to ensure a strict anaerobic environment. The anaerobic reactor was placed in an incubator at 35 ± 1 °C for 50 d. During the experiment, biogas was collected using a 5 L biogas bag (Plato, Dalian, China) at regular intervals every day, and the biogas production and components were measured. Meanwhile, samples before and after digestion were collected for digestion system properties and microbial characterization. The controls without dairy manure and tomato residue were prepared for every treatment separately.
2.4. Measurement Indicators and Methods
Solid indicators: Total solids content and volatile solids content were determined by dry weighing [17]; total carbon and total nitrogen were measured using an elemental analyzer (Elementar Analysensystem, Hanau, Germany) [18].
Liquid indicators: pH value was measured using a pH meter using a solid-to-liquid ratio of 1:10; total ammonia nitrogen (including free ammonia (NH3) and ammonium nitrogen (NH4+-N)) was determined by an improved distillation titration method [19]; according to Wang et al. (2018) [20], volatile fatty acid was determined using an alkalinity analyzer (Shanghai Leici, Shanghai, China).
Gas indicators: The biogas collected in the gas bags was measured with a biogas flowmeter (Ritter, Bochum, Germany), and the biogas components (CO2, CH4, N2 and O2) were analyzed with a gas chromatographer (Beijing Spectrum Analysis Company, Beijing, China). Daily methane yield expressed in mL/g VS substrate was calculated as the volume of methane gas produced per g of VS loaded into the reactor at startup, corrected by subtracting the methane yield obtained from the control reactor and adjusted linearly based on the amount of VS. The cumulative methane yield was obtained by the cumulative calculation of the daily methane yield [21,22].
Microbial indicators: Three treatments, TS6, TS20, and TS25, were selected to collect samples at the initial stage of digestion (TS6-IP, TS20-IP, and TS25-IP) and the peak gas production period (TS6-GP, TS20-GP, and TS25-GP). For high-throughput sequencing, three biological parallel samples were taken from each treatment. The analytical test was completed by Beijing Novogene Technology Co., Ltd. (Novogene, Beijing, China). The primer sequences for the bacterial and archaeal V3-V4 regions used are listed in Table 2.
2.5. Statistical Analysis
All data were analyzed using SAS9.2 (SAS Institute Inc., Cary, NC, USA). All treatments were considered significant at p < 0.05 (Tukey). Data processing and visualization were performed using Microsoft Excel 2013. Due to the existence of interference data in the original sequencing data, the data were further filtered and spliced by RDP and QIIME2 software to obtain valid data, which were subjected to cluster analysis and species classification analysis with 97% consistency. Based on the obtained OTU results, species annotation was performed on each OTU by software such as the BLAST online analysis tool to obtain the species information and species abundance data of the microbial communities of bacteria and Archaea, respectively.
3. Results and Discussion
3.1. Methane Production
The effect of the digestion substrate TS on daily methane production through anaerobic digestion is shown in Figure 2. All treatments could rapidly ferment to produce methane; the daily methane production showed a trend of increasing first and then decreasing, with the peak value of gas production appearing at 9–15 days. Agreeing with Zhang et al. (2018) [23] and Lin et al. (2014) [24], this study fit with the typical kinetic characteristics of batch anaerobic digestion. Compared with SS-AD and HSS-AD, L-AD reached the peak value of gas production 3-6 days earlier [25]. The study also found that, compared with SS-AD, L-AD digestion started faster and had a shorter methane residence period. In L-AD, the TS10 treatment had the highest peak daily gas production at 7.3 mL/g VS. The peak values of gas production for the TS6 and TS8 treatments were lower, and the daily methane production decreased rapidly in the later stage to basically no longer produce gas after 23 days. This may be due to the higher TS of the inoculum and material, and a large amount of water was added during the material mixing process, resulting in less degradable material in the tank. In HSS-AD, the maximum daily peak gas production decreased as the TS increased, which is in agreement with Lin et al. (2015) [26] and Li et al. (2018) Lin, Ge, Liu, and Li [26,27]. The maximum daily peak gas production of the TS12 treatment was 28% higher than that of the TS18 treatment. However, the TS12 and TS15 treatments almost no longer produced gas after 27 days, and the TS18 treatment continued to produce gas. Similar to HSS-AD, the peak daily gas production for the TS20, TS22, and TS25 treatments was 9.6, 5.0, and 8.0 mL/g VS, respectively; the decreasing trend of the daily gas production was slow until the daily methane production decreased below 1.0 mL/g VS after 30 days.
As shown in Figure 3, the cumulative methane production of SS-AD was higher than that of HSS-AD and L-AD. Among all digestion treatments, the TS25 treatment had the highest level of the digestion cumulative methane production at 117.4 mL/g VS, while the TS6 treatment had the lowest level of the digestion methane yield at 34.2 mL/g VS. In L-AD, the cumulative methane production gradually increased with the increase in TS. Compared with the TS6 treatment, the cumulative methane production of the TS10 treatment increased by 98.3%. The trends of the cumulative methane production of HSS-AD and SS-AD were similar to those of L-AD. The cumulative methane production increased by 53.8% (p < 0.05) from TS12 to TS18, but the difference in cumulative methane production between the TS12 and TS15 treatments was not significant. It is generally considered that digestion is basically completed when gas production reaches more than 90% of the total gas production [28]. The digestion of L-AD and HSS-AD was completed between 17 and 23 d (Figure 3). The completion time of SS-AD was 27–28 days. These results indicated that as TS increased, the degradable materials in the system increased, and the time needed for the completion of anaerobic digestion gradually increased. Wang et al. (2020) [29] indicated that the reactor required a longer startup time in the presence of a higher TS content.
The methane yield per unit volume (m3 methane/m3 reactor volume) of SS-AD was significantly higher than that of L-AD (p < 0.01) (Figure 4). However, there was no significant difference in the methane production rate per unit volume among the TS10, TS12, and TS15 treatments (p > 0.05). Treatment TS25 had the highest rate of methane production per unit volume at 5.8 m3 methane/m3 reactor volume, which was 0.6–13.5 times higher than that of the other treatments. This was consistent with the previous study. The higher the TS is, the higher the methane yield per unit volume [30]. This is mainly due to the addition of a large amount of water by L-AD, which requires a larger reactor volume and a lower methane yield per unit volume under the same solid load [30].
3.2. Anaerobic Digestion Characteristics
An appropriate pH value of the digestion material helps to maintain the activity of methanogens and ensure the progress of anaerobic digestion [31]. As the reaction progressed, except for the pH values of the TS6 and TS8 treatments, which fell below 6.2, the final pH values of the other treatments remained above 7.5 (Table 3). The drop in pH could inhibit methanogenesis and disrupt the AD process [32]. This was in agreement with the low cumulative methane production by the TS6 and TS8 treatments, which may be due to the inhibition of fermentative methanogenesis by system acidification. Studies have shown that a total ammonia nitrogen (TAN) concentration of less than 3 g/L helps the growth of anaerobic microorganisms and provides a certain buffer for anaerobic reaction tanks [33,34]. The final TAN contents of the different treatments were in the range of 0.7–2.2 g/kg; therefore, the system TAN was not the cause of the low cumulative methane production in treatments TS6 and TS8.
As the system TS increased, the final VFA concentrations showed a decreasing trend. Li et al. (2018) [35] also reported that SS-AD conditions had a higher initial alkalinity than that of the L-AD condition, which may have provided more buffering capacity to overcome the higher organic loading under SS-AD conditions. The final concentration of VFAs in the TS6 treatment was 5.8 g/kg, which was close to the toxicity threshold of 6 g/kg [36]. It was further confirmed that VFAs accumulated in excess in the TS6-treated tanks, which led to system instability and low methane production. In general, VFAs in SS-AD were lower than those in L-AD and HSS-AD, which was consistent with the result of cumulative gas production [37]. The VFA/ALK ratio is a reliable parameter reflecting the stability of anaerobic digestion systems. A value higher than 0.6 indicates that the reactor load is too high or the system alkalinity is low [38]. The final VFA/ALK ratio of the TS6 treatment reached 1.32, indicating that this treatment had severe acidification and insufficient basicity, which severely inhibited digestion and gas production.
3.3. Microbial Community Structure
Bacteria and archaea play critical roles in the anaerobic digestion process. For example, the degradation of materials such as proteins and polysaccharides and the transformation of organic matter such as acetic acid are all related to bacteria. In anaerobic biogas digestion, archaea, represented by methanogenic microorganisms, play a key role in “methane production” [39]. Therefore, changes in the composition and structure of the bacterial and archaeal communities have a great impact on key indicators such as biogas production and methane concentration.
The Chao1 and observed_species indices showed that, compared with the initial stage of digestion, the bacterial richness during the peak gas production period showed a decreasing trend, while the Shannon and Simpson indices showed an increasing trend in bacterial diversity (Table 4). TS25-GP had the highest Shannon and Simpson indices, which was consistent with the cumulative methane production of the TS25 treatment. These results indicated that anaerobic digestion can increase the bacterial biodiversity in the system. In contrast to bacteria, the Shannon index of TS6-GP was lower than the initial value of digestion (Table 4), which was consistent with the fact that the TS6 digestion system tended to be poorly acidified and stable, resulting in low daily methane production (Figure 2).
At the phylum level, the main bacteria in the different treatments were Firmicutes, Bacteroidetes, Proteobacteria, and unidentified bacteria, with Firmicutes and Bacteroidetes being the dominant flora (Figure 5). Firmicutes can generate acetic acid during anaerobic digestion, and its relative abundance is related to cumulative methane production [40]. In the initial stage of digestion, the relative abundance of Firmicutes in TS6-IP, TS20-IP, and TS25-IP was 43.16%, 38.62%, and 37.61%, respectively, with no significant difference among treatments. These results indicated that the Firmicutes at the early stage of digestion was mainly carried over by the inoculum, and the digestion concentration had a slight effect on its relative abundance. During the peak gas production period, the relative abundance of Firmicutes in TS6-GP, TS20-GP, and TS25-GP was 38.12%, 48.74%, and 43.84%, respectively; that in the TS 6% treatment was significantly lower than that in TS20 and TS25. This was consistent with the results of cumulative methane production (Figure 3). Wang et al. (2018) [41] also discovered that Firmicutes could hydrolyze cellulose in cow dung and tail vegetable residue. Bacteroidetes play an important role in the degradation process of tomato residues [42]. During the initial stage of digestion, the relative abundance of Bacteroidetes did not differ significantly among the treatments. However, during the peak gas production period, the relative abundance of Bacteroidetes in TS6-GP, TS20-GP, and TS25-GP reached 36.64%, 35.60%, and 33.39%, respectively, which was similar to that of Firmicutes (Figure 5). The above results are consistent with Tukanghan et al. (2021) [43] that Firmicutes and Bacteroidetes were predominated in anaerobic digesters.
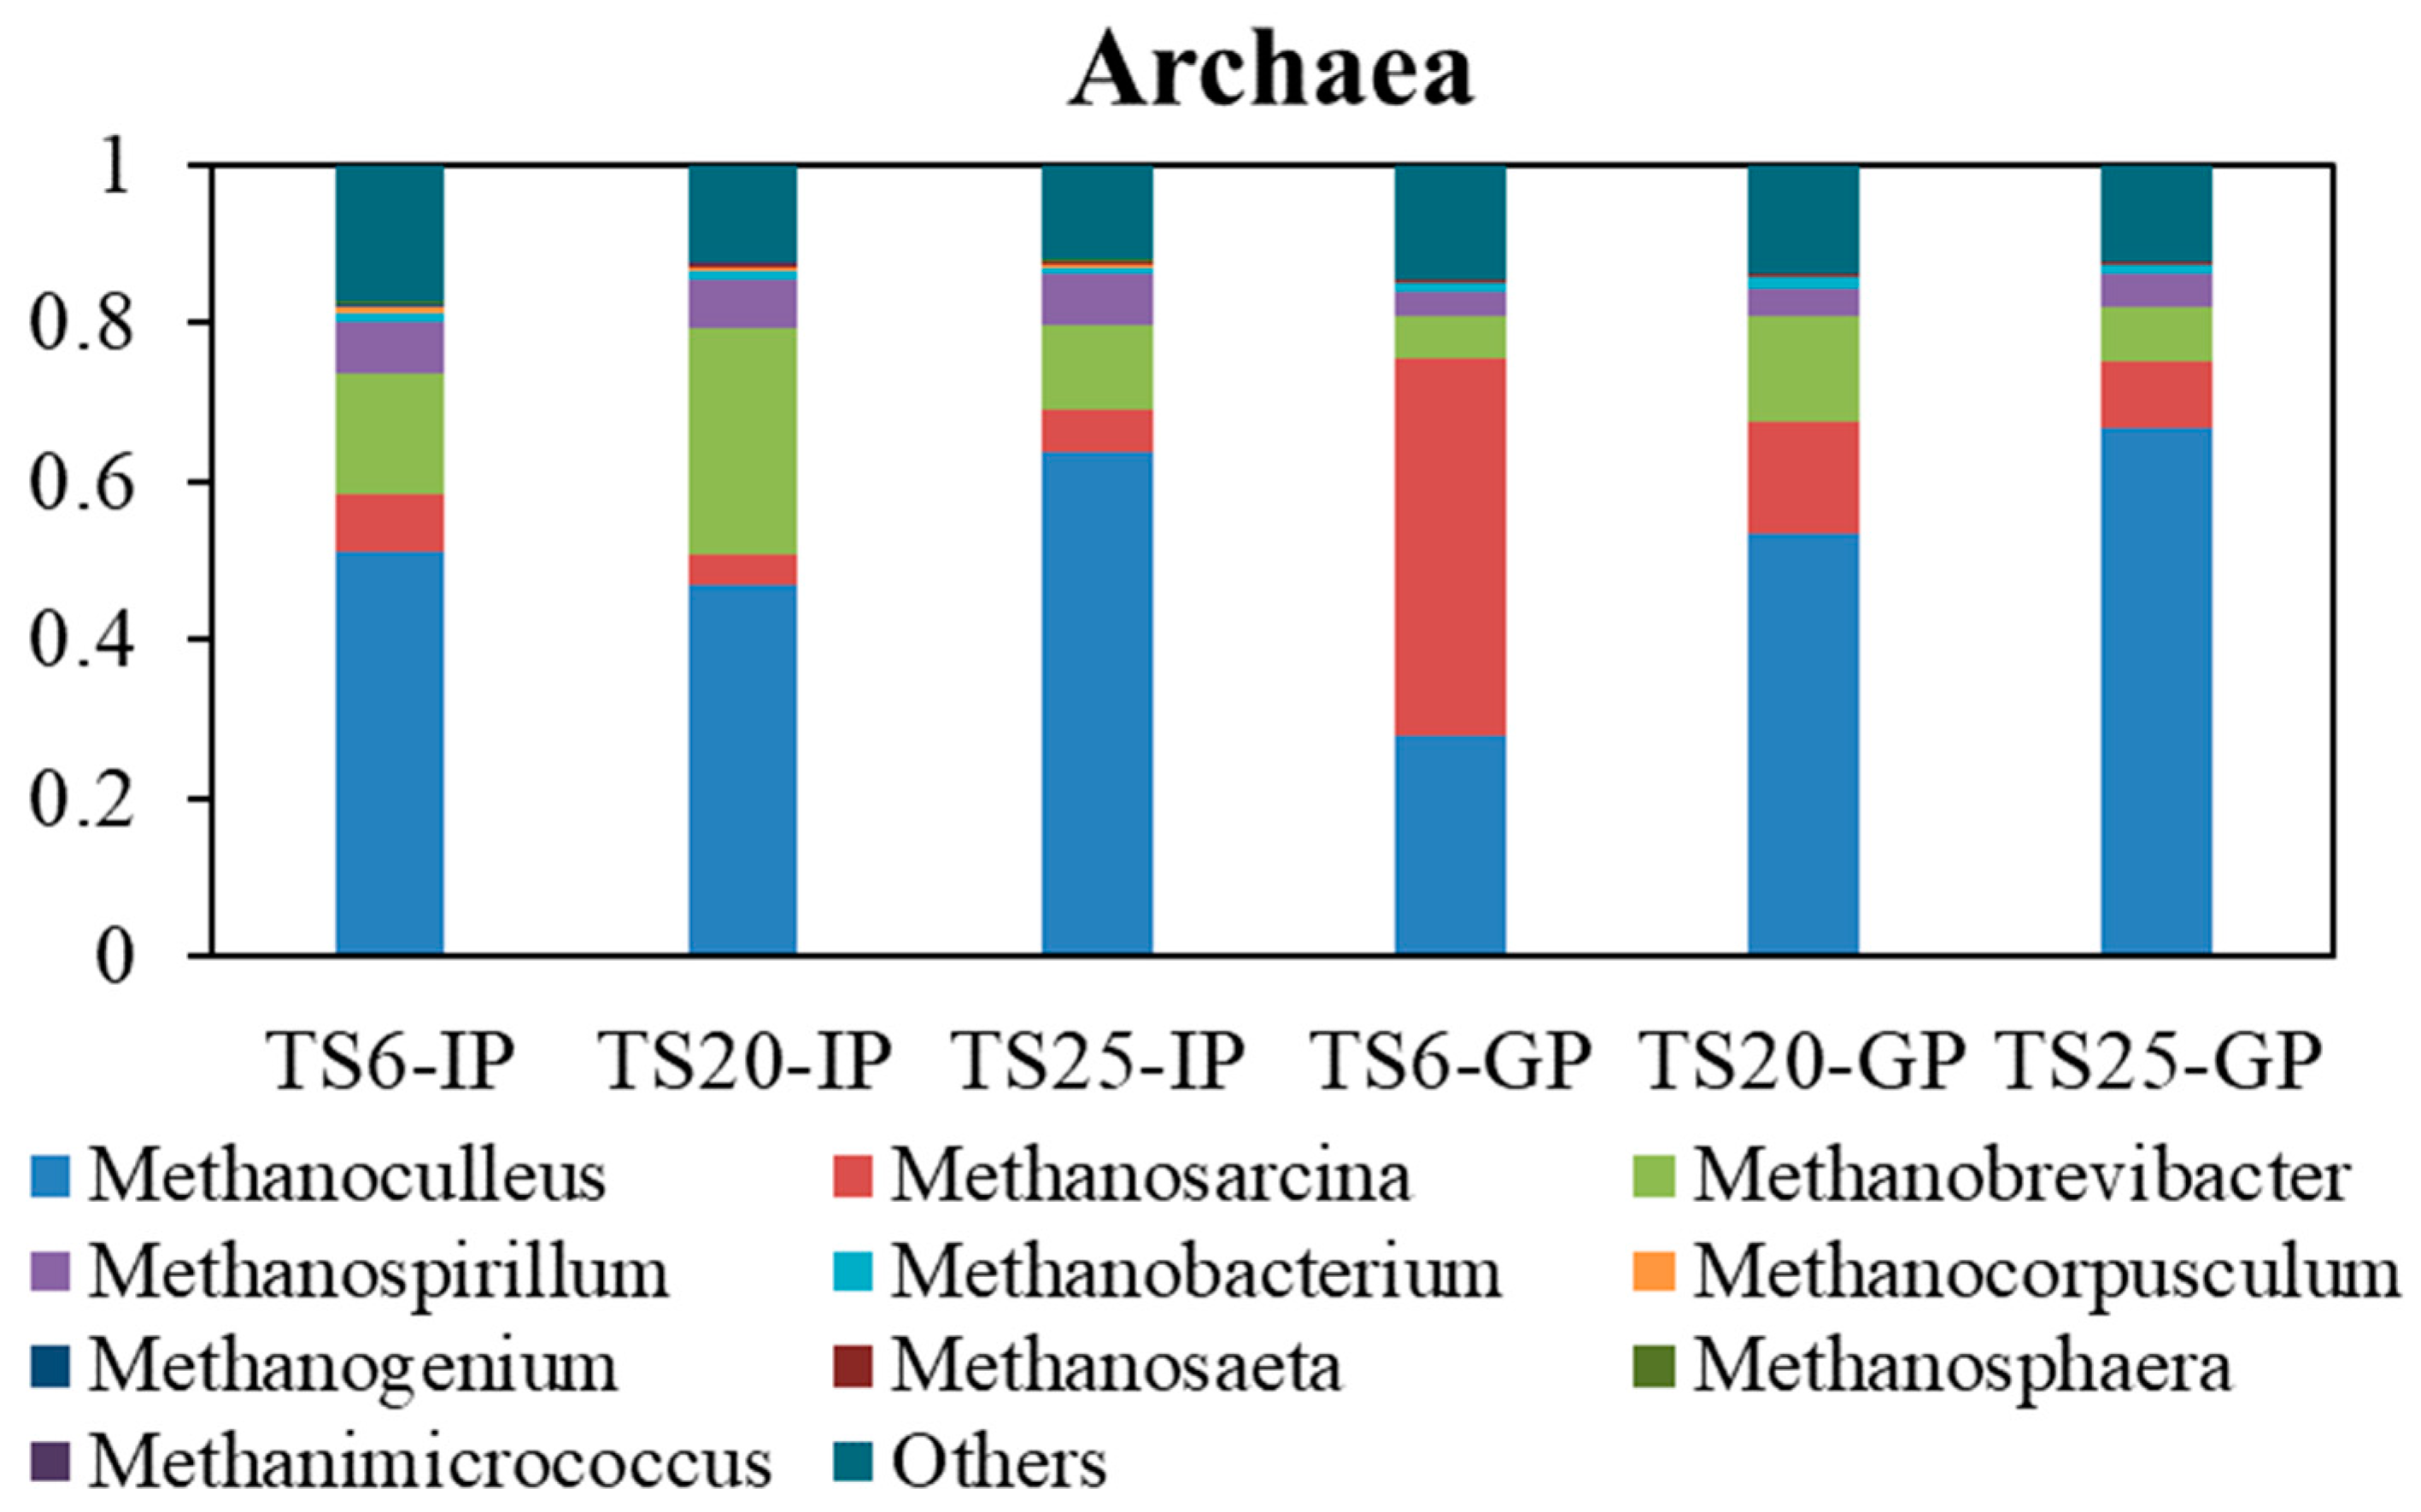
At the subordinate level, the main archaea under different treatments were Methanoculleus, Methanosarcina, and Methanobrevibacter. Methanoculleus is a type of extreme anaerobic bacteria that mainly uses formate and CO2 in the system to generate CH4 during the digestion process [44]. During the peak gas production period, the relative abundance of Archaea showed an increasing trend as the TS increased, which was consistent with the cumulative methane production (Figure 3). Based on the analysis of the microbial community in the reactors, a higher presence of hydrogenotrophic methanogenic archaea (Methanospirillum, Methanobacterium, Methanobrevibacter, and Methanoculleus) was found [45,46]. Compared with other archaea, Methanosarcina was not sensitive to the environment and could survive in higher concentrations of acetic acid and VFAs. During the peak gas production period, the TS6 treatment system had already been acidified, but the relative abundance of Methanosarcina was very high at 47.59%.
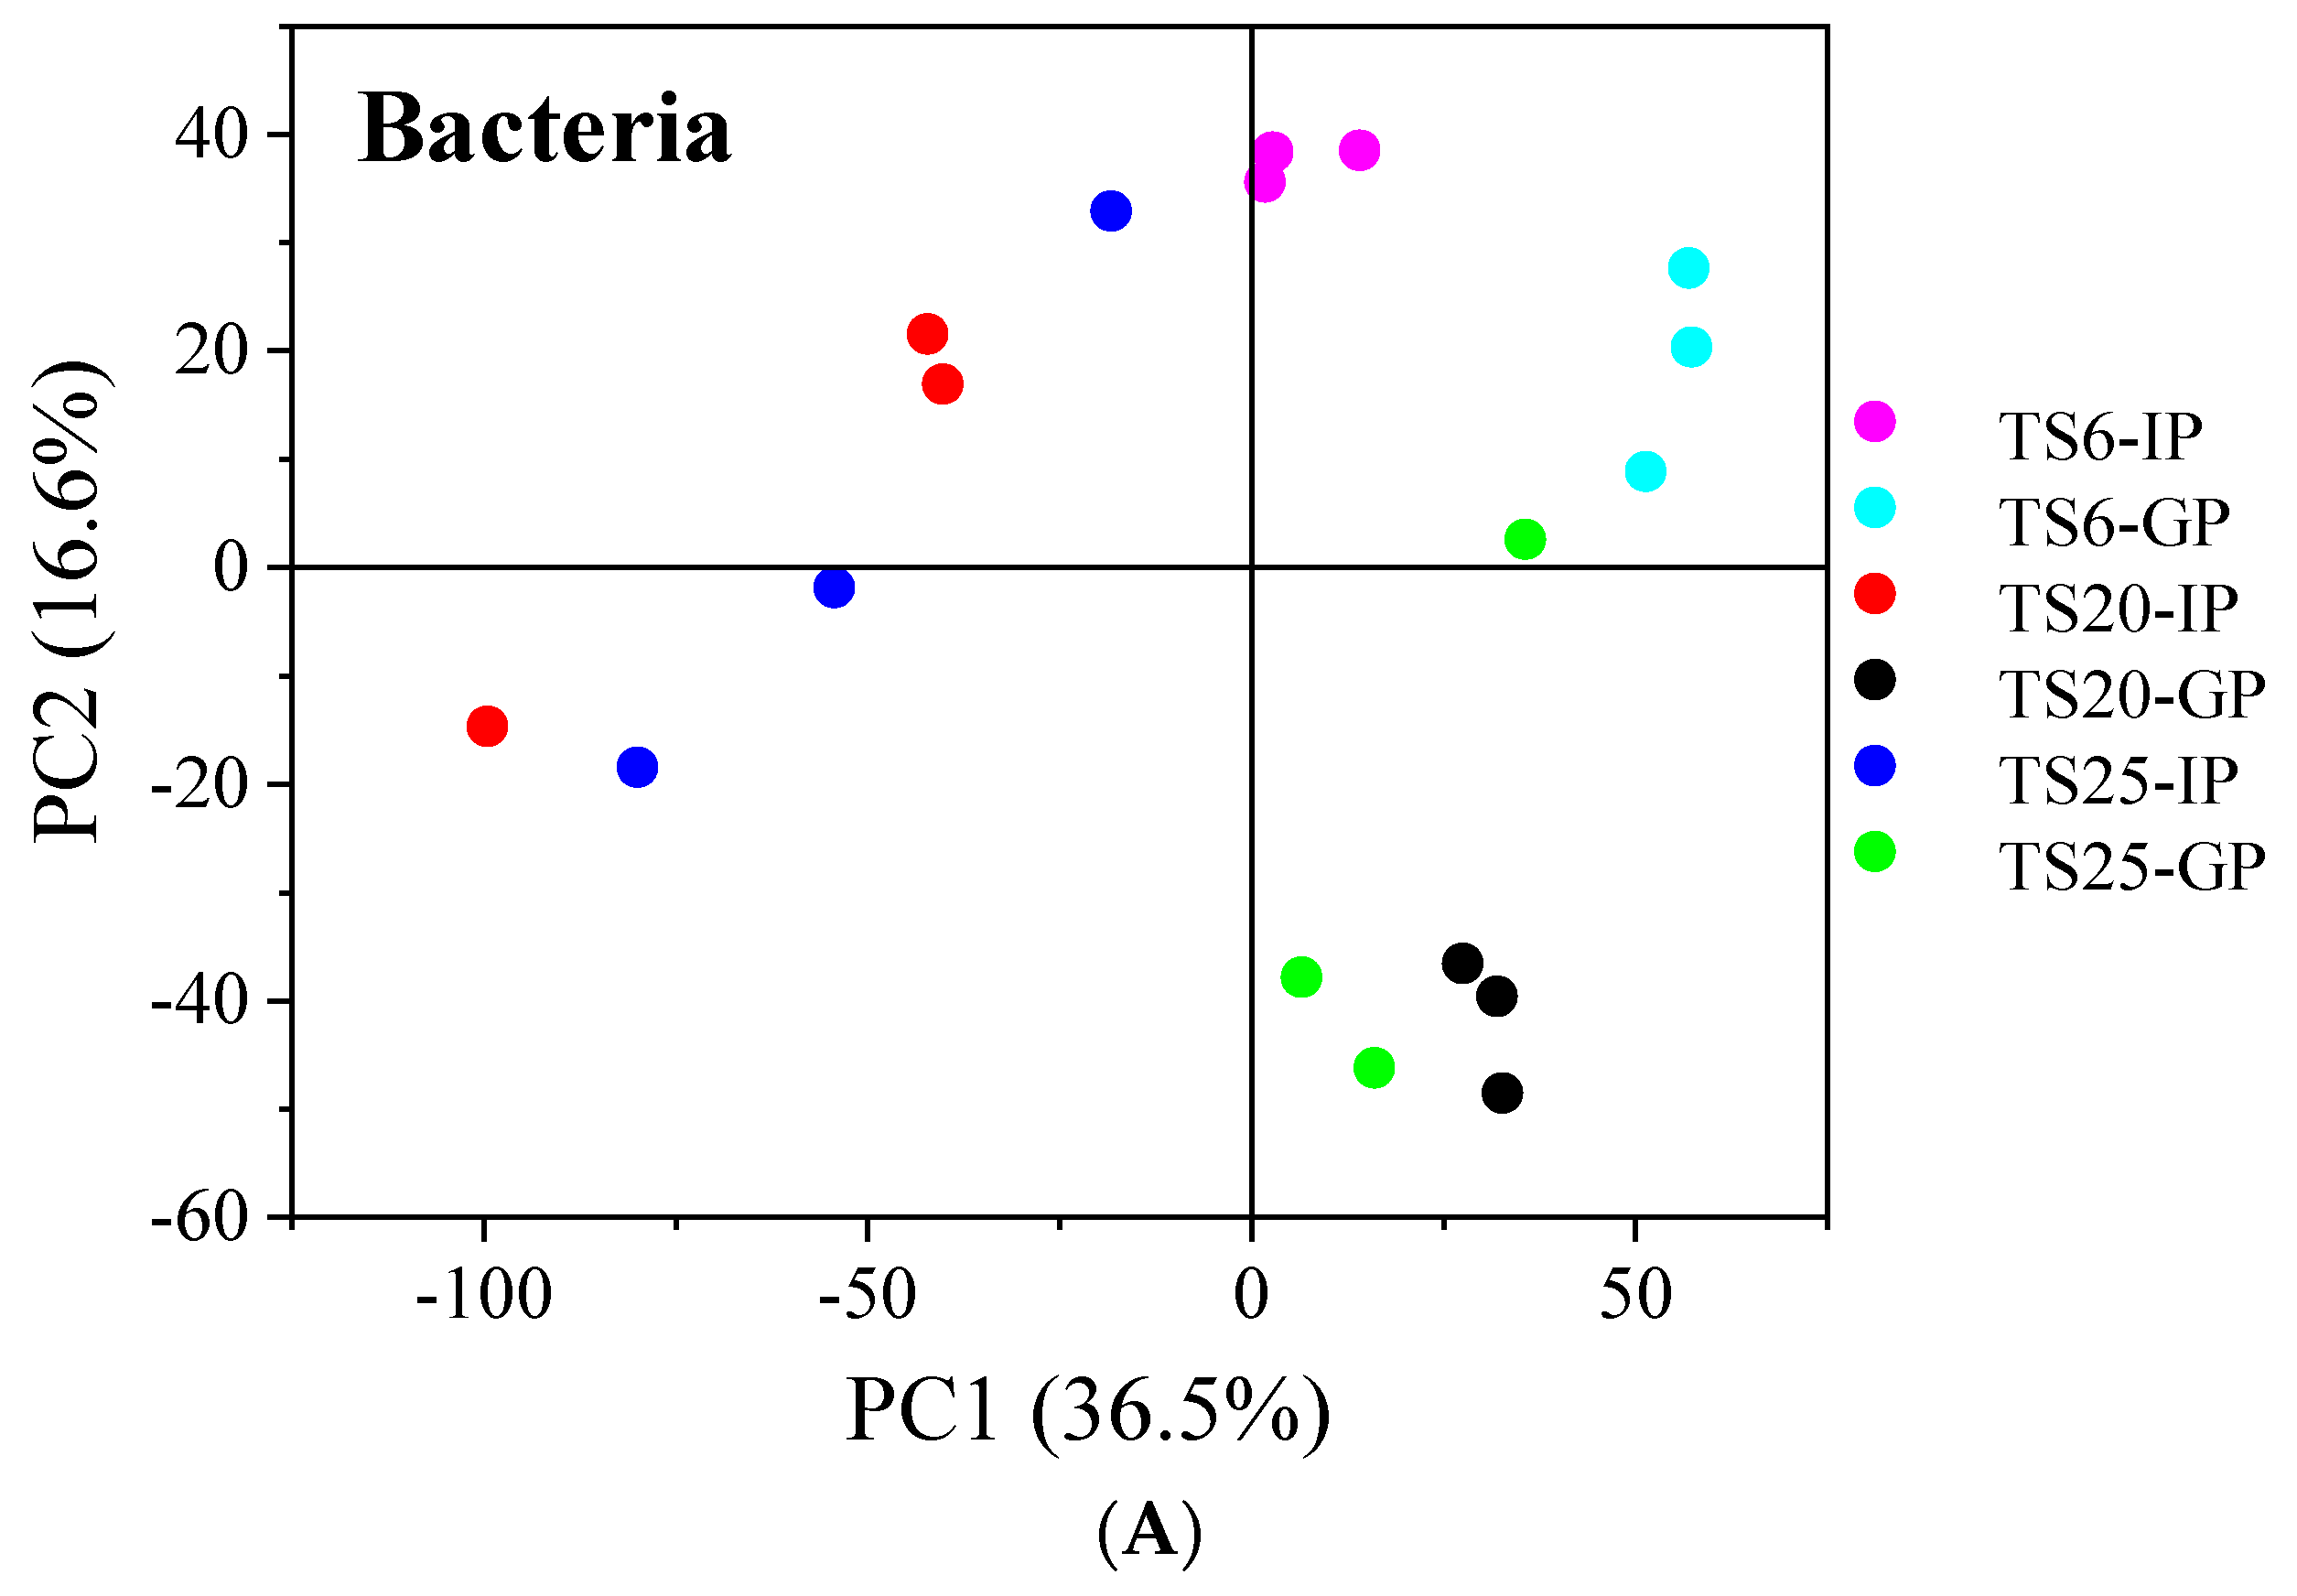
As shown in Figure 6, there was no significant difference in the bacterial community structure among TS6-IP, TS20-IP, and TS25-IP or between TS20-GP and TS25-GP. There was a significant difference in the bacterial community structure between groups. These results indicated that the main microorganisms in the initial stage of digestion were from the inoculum and had little relationship with the digestion material. During the peak period of digestion and gas production, TS significantly changed the bacterial community composition of the digestion system, especially the low TS treatment. Similar to the changes in the bacterial community structure, TS also had a great impact on the archaeal community structure during the digestion process. Compared with the initial stage of digestion, the archaeal community structure was the most obvious during TS6-GP, while changes in TS20-GP and TS25-GP were relatively small. The changes in the digestion substrate could result in shifts in the microbial community structure and function in the digestion processes and the consequent augmentation of biogas production [47,48]. These results suggest that lower TS not only significantly changed the bacterial community structure but also changed the archaeal community structure.
4. Conclusions
TS significantly changed the bacterial and archaeal community composition of the digestion system, and thus with the increase in TS from 6% to 25%, the methane yield increased. The TS6 treatment resulted in severe acidification and insufficient basicity, which severely inhibited digestion and gas production. The anaerobic digestion process increased the bacterial biodiversity in the system. In contrast to bacteria, the archaeal Shannon index of TS6-GP was lower than the initial value of digestion, which was consistent with the results of the cumulative methane production. During the peak period of digestion and gas production, TS significantly changed the bacterial and archaeal community composition of the digestion system, especially the low TS treatment. Furthermore, the techno-economic assessment of the anaerobic digestion of dairy manure and tomato residues should be made for future research and development.
Author Contributions
Conceptualization, Y.W., Y.L. and Z.L.; Methodology, Y.W., L.Y. and Z.L.; Software, Y.W. and L.Y.; Validation, Y.W., L.Y. and L.F.; Investigation, Y.W.; Resources, Y.W. and L.F.; Data curation, Y.W. and L.F.; Writing—original draft, Y.W.; Writing—review & editing, Y.W. and Z.L.; Visualization, Y.W.; Supervision, Y.L.; Project administration, Z.L.; Funding acquisition, Y.L. and Z.L. All authors have read and agreed to the published version of the manuscript.
Funding
This work was funded by the National Key R&D Program of China (2022YFD1700700), Taishan Scholars Program, Shandong Province Key R&D Program (2021CXGX010801), and Agricultural Scientific and Technological Innovation Project of Shandong Academy of Agricultural Sciences (CXGC2023F03).
Data Availability Statement
The data presented in this study are available on request from the corresponding author.
Conflicts of Interest
The authors declare that they have no known competing financial interests or personal relationships that could have appeared to influence the work reported in this paper.
References
- Sridevi, V.D.; Rema, T.; Srinivasan, S.V. Studies on biogas production from vegetable market wastes in a two-phase anaerobic reactor. Clean Technol. Environ. Policy 2014, 17, 1689–1697. [Google Scholar] [CrossRef]
- Arvanitoyannis, I.S.; Varzakas, T.H. Vegetable waste treatment: Comparison and critical presentation of Methodologies. Crit. Rev. Food Sci. Nutr. 2008, 48, 205–247. [Google Scholar] [CrossRef] [PubMed]
- Neves, L.; Oliveira, R.; Alves, M. Anaerobic co-digestion of coffee waste and sewage sludge. Waste Manag. 2006, 26, 176–181. [Google Scholar] [CrossRef] [PubMed]
- Kaparaju, P.; Rintala, J. Anaerobic co-digestion of potato tuber and its industrial by-products with pig manure. Resour. Conserv. Recycl. 2005, 43, 175–188. [Google Scholar] [CrossRef]
- Qian, X.; Shen, G.; Wang, Z.; Li, J.; Lei, Z.; Zhang, Z. Performance of semi-dry anaerobic co-digestion of swine manure with rice straw under biogas slurry addition. In Proceedings of the 2015 2nd International Conference on Machinery, Materials Engineering, Chemical Engineering and Biotechnology, Chongqing, China, 28–29 November 2015; Atlantis Press: Amsterdam, The Netherlands, 2015; pp. 235–243. [Google Scholar]
- Abbassi-Guendouz, A.; Brockmann, D.; Trably, E.; Dumas, C.; Delgenès, J.-P.; Steyer, J.-P.; Escudié, R. Total solids content drives high solid anaerobic digestion via mass transfer limitation. Bioresour. Technol. 2012, 111, 55–61. [Google Scholar] [CrossRef] [PubMed]
- Fdéz, L.A.; Álvarez-Gallego, C.; Márquez, D.S.; García, L.I.R. Start-up of thermophilic–dry anaerobic digestion of OFMSW using adapted modified SEBAC inoculum. Bioresour. Technol. 2010, 101, 9031–9039. [Google Scholar] [CrossRef] [PubMed]
- Delgenes, J.P.; Carrère, M.; Cacho, J.; Buffière, P.; Guendouz, J. High-solids anaerobic digestion: Comparison of three pilot scales. Water Sci. Technol. 2008, 58, 1757–1763. [Google Scholar]
- Li, Y.B.; Park, S.Y.; Zhu, J.Y. Solid-state anaerobic digestion for methane production from organic waste. Renew. Sustain. Energy Rev. 2011, 15, 821–826. [Google Scholar] [CrossRef]
- Shi, J.; Xu, F.Q.; Wang, Z.J.; Stiverson, J.A.; Yu, Z.T.; Li, Y.B. Effects of microbial and non-microbial factors of liquid anaerobic digestion effluent as inoculum on solid-state anaerobic digestion of corn stover. Bioresour. Technol. 2014, 157, 188–196. [Google Scholar] [CrossRef]
- Jin, W.Y.; Xu, X.C.; Yang, F.L.; Li, C.L.; Zhou, M. Performance enhancement by rumen cultures in anaerobic co-digestion of corn straw with pig manure. Biomass Bioenergy 2018, 115, 120–129. [Google Scholar] [CrossRef]
- Li, Y.Y.; Manandhar, A.; Li, G.X.; Shah, A. Life cycle assessment of integrated solid state anaerobic digestion and composting for on-farm organic residues treatment. Waste Manag. 2018, 76, 294–305. [Google Scholar] [CrossRef] [PubMed]
- Li, C.X.; Champagne, P.; Anderson, B.C. Evaluating and modeling biogas production from municipal fat, oil, and grease and synthetic kitchen waste in anaerobic co-digestions. Bioresour. Technol. 2011, 102, 9471–9480. [Google Scholar] [CrossRef]
- Yu, X.; Yan, L.; Wang, H.; Bi, S.; Zhang, F.; Huang, S.; Wang, Y.; Wang, Y. Anaerobic co-digestion of cabbage waste and cattle manure: Effect of mixing ratio and hydraulic retention time. Renew. Energy 2024, 221, 119743. [Google Scholar] [CrossRef]
- Abbas, Y.; Yun, S.; Mehmood, A.; Shah, F.A.; Wang, K.; Eldin, E.T.; Al-Qahtani, W.H.; Ali, S.; Bocchetta, P. Co-digestion of cow manure and food waste for biogas enhancement and nutrients revival in bio-circular economy. Chemosphere 2023, 311, 137018. [Google Scholar] [CrossRef] [PubMed]
- Mlaik, N.; Sayadi, S.; Masmoudi, M.A.; Yaacoubi, D.; Loukil, S.; Khoufi, S. Optimization of anaerobic co-digestion of fruit and vegetable waste with animal manure feedstocks using mixture design. Biomass Convers. Biorefinery 2024, 14, 4007–4016. [Google Scholar] [CrossRef]
- APHA. Standard Methods for the Examination of Water and Wastewater; American Public Health Association: Washington, DC, USA, 2005. [Google Scholar]
- Page, A.L.; Miller, R.H.; Keeney, D.R. Methods of Soil Analysis: Chemical and Microbiological Properties; American Society of Agronomy, Soil Science Society of America: Madison, WI, USA, 1982. [Google Scholar]
- ISO-5664; Water Quality-Determination of Ammonium-Distillation and Titration Method. International Organization for Standardization: Geneva, Switzerland, 1984.
- Wang, Y.Y.; Li, G.X.; Chi, M.H.; Sun, Y.B.; Zhang, J.X.; Jiang, S.X.; Cui, Z.J. Effects of co-digestion of cucumber residues to corn stover and pig manure ratio on methane production in solid state anaerobic digestion. Bioresour. Technol. 2018, 250, 328–336. [Google Scholar] [CrossRef]
- Brown, D.; Li, Y. Solid state anaerobic co-digestion of yard waste and food waste for biogas production. Bioresour. Technol. 2013, 127, 275–280. [Google Scholar] [CrossRef] [PubMed]
- van Lier, J.B.; Jenicek, P.; Kalyuzhnyi, S.; Guwy, A.J.; Campos, J.L.; Borzacconi, L.; Bolzonella, D.; Alves, M.; Angelidaki, I. Defining the biomethane potential (BMP) of solid organic wastes and energy crops: A proposed protocol for batch assays. Water Sci. Technol. 2009, 59, 927–934. [Google Scholar]
- Zhang, E.L.; Li, J.J.; Zhang, K.Q.; Wang, F.; Yang, H.H.; Zhi, S.L.; Liu, G.Q. Anaerobic digestion performance of sweet potato vine and animal manure under wet, semi-dry, and dry conditions. AMB Express 2018, 8, 45. [Google Scholar] [CrossRef]
- Lin, L.; Yang, L.C.; Xu, F.Q.; Michel, F.C.; Li, Y.B. Comparison of solid-state anaerobic digestion and composting of yard trimmings with effluent from liquid anaerobic digestion. Bioresour. Technol. 2014, 169, 439–446. [Google Scholar] [CrossRef]
- Ge, X.M.; Xu, F.Q.; Li, Y.B. Solid-state anaerobic digestion of lignocellulosic biomass: Recent progress and perspectives. Bioresour. Technol. 2016, 205, 239–249. [Google Scholar] [CrossRef] [PubMed]
- Lin, Y.Q.; Ge, X.M.; Liu, Z.; Li, Y.B. Integration of Shiitake cultivation and solid-state anaerobic digestion for utilization of woody biomass. Bioresour. Technol. 2015, 182, 128–135. [Google Scholar] [CrossRef] [PubMed]
- Li, Y.Y.; Wang, Y.Q.; Yu, Z.H.; Lu, J.X.; Li, D.Y.; Wang, G.Y.; Li, Y.; Wu, Y.; Li, S.Y.; Xu, F.Q.; et al. Effect of inoculum and substrate/inoculum ratio on the performance and methanogenic archaeal community structure in solid state anaerobic co-digestion of tomato residues with dairy manure and corn stover. Waste Manag. 2018, 81, 117–127. [Google Scholar] [CrossRef] [PubMed]
- Zhong, W.Z.; Zhang, Z.Z.; Luo, Y.J.; Sun, S.S.; Qiao, W.; Xiao, M. Effect of biological pretreatments in enhancing corn straw biogas production. Bioresour. Technol. 2011, 102, 11177–11182. [Google Scholar] [CrossRef] [PubMed]
- Wang, Y.; Zhang, J.; Li, Y.; Jia, S.; Li, G. Methane production from the co-digestion of pig manure and corn stover with the addition of cucumber residue: Role of the total solids content and feedstock-to-inoculum ratio. Bioresour. Technol. 2020, 306, 123172. [Google Scholar] [CrossRef] [PubMed]
- Li, Y.Q.; Zhang, R.H.; Liu, X.Y.; Chen, C.; Xiao, X.; Feng, L.; He, Y.F.; Liu, G.Q. Evaluating methane production from anaerobic mono- and Co-digestion of kitchen waste, corn stover, and chicken manure. Energy Fuels 2013, 27, 2085–2091. [Google Scholar] [CrossRef]
- Park, S.; Li, Y.B. Evaluation of methane production and macronutrient degradation in the anaerobic co-digestion of algae biomass residue and lipid waste. Bioresour. Technol. 2012, 111, 42–48. [Google Scholar] [CrossRef] [PubMed]
- Liu, W.Y.; Liao, B. Anaerobic co-digestion of vegetable and fruit market waste in LBR+CSTR two-stage process for waste reduction and biogas production. Appl. Biochem. Biotechnol. 2019, 188, 185–193. [Google Scholar] [CrossRef] [PubMed]
- Chen, Y.; Cheng, J.J.; Creamer, K.S. Inhibition of anaerobic digestion process: A review. Bioresour. Technol. 2008, 99, 4044–4064. [Google Scholar] [CrossRef]
- Mahdy, A.; Fotidis, I.A.; Mancini, E.; Ballesteros, M.; González-Fernández, C.; Angelidaki, I. Ammonia tolerant inocula provide a good base for anaerobic digestion of microalgae in third generation biogas process. Bioresour. Technol. 2017, 225, 272–278. [Google Scholar] [CrossRef]
- Li, Y.; Lu, J.; Xu, F.; Li, Y.; Li, D.; Wang, G.; Li, S.; Zhang, H.; Wu, Y.; Shah, A.; et al. Reactor performance and economic evaluation of anaerobic co-digestion of dairy manure with corn stover and tomato residues under liquid, hemi-solid, and solid state conditions. Bioresour. Technol. 2018, 270, 103–112. [Google Scholar] [CrossRef] [PubMed]
- Appels, L.; Baeyens, J.; Degrève, J.; Dewil, R. Principles and potential of the anaerobic digestion of waste-activated sludge. Prog. Energy Combust. Sci. 2008, 34, 755–781. [Google Scholar] [CrossRef]
- Zhang, C.; Yun, S.N.; Li, X.; Wang, Z.Q.; Xu, H.F.; Du, T.T. Low-cost composited accelerants for anaerobic digestion of dairy manure: Focusing on methane yield, digestate utilization and energy evaluation. Bioresour. Technol. 2018, 263, 517–524. [Google Scholar] [CrossRef] [PubMed]
- Chen, X.; Yan, W.; Sheng, K.C.; Sanati, M. Comparison of high-solids to liquid anaerobic co-digestion of food waste and green waste. Bioresour. Technol. 2014, 154, 215–221. [Google Scholar] [CrossRef] [PubMed]
- Vavilin, V.; Fernandez, B.; Palatsi, J.; Flotats, X. Hydrolysis kinetics in anaerobic degradation of particulate organic material: An overview. Waste Manag. 2008, 28, 939–951. [Google Scholar] [CrossRef] [PubMed]
- Ren, J.W.; Yuan, X.F.; Li, J.; Ma, X.G.; Zhao, Y.; Zhu, W.B.; Wang, X.F.; Cui, Z.J. Performance and microbial community dynamics in a two-phase anaerobic co-digestion system using cassava dregs and pig manure. Bioresour. Technol. 2014, 155, 342–351. [Google Scholar] [CrossRef] [PubMed]
- Wang, G.; Li, Q.; Gao, X.; Wang, X.C. Synergetic promotion of syntrophic methane production from anaerobic digestion of complex organic wastes by biochar: Performance and associated mechanisms. Bioresour. Technol. 2018, 250, 812–820. [Google Scholar] [CrossRef] [PubMed]
- Yue, Z.B.; Chen, R.; Yang, F.; MacLellan, J.; Marsh, T.; Liu, Y.; Liao, W. Effects of dairy manure and corn stover co-digestion on anaerobic microbes and corresponding digestion performance. Bioresour. Technol. 2013, 128, 65–71. [Google Scholar] [CrossRef] [PubMed]
- Tukanghan, W.; Hupfauf, S.; Gómez-Brandón, M.; Insam, H.; Salvenmoser, W.; Prasertsan, P.; Cheirsilp, B.; Sompong, O. Symbiotic Bacteroides and Clostridium-rich methanogenic consortium enhanced biogas production of high-solid anaerobic digestion systems. Bioresour. Technol. Rep. 2021, 14, 100685. [Google Scholar] [CrossRef]
- Liu, Y.C.; Whitman, W.B. Metabolic, phylogenetic, and ecological diversity of the methanogenic archaea. Ann. N. Y. Acad. Sci. 2008, 1125, 171–189. [Google Scholar] [CrossRef]
- Ince, O.; Akyol, Ç.; Ozbayram, E.G.; Tutal, B.; Ince, B. Enhancing methane production from anaerobic co-digestion of cow manure and barley: Link between process parameters and microbial community dynamics. Environ. Prog. Sustain. Energy 2020, 39, 13292. [Google Scholar] [CrossRef]
- Borth, P.L.B.; Perin, J.K.H.; Torrecilhas, A.R.; Lopes, D.D.; Santos, S.C.; Kuroda, E.K.; Fernandes, F. Pilot-scale anaerobic co-digestion of food and garden waste: Methane potential, performance and microbial analysis. Biomass Bioenergy 2022, 157, 106331. [Google Scholar] [CrossRef]
- Xu, R.; Zhang, K.; Liu, P.; Khan, A.; Xiong, J.; Tian, F.; Li, X. A critical review on the interaction of substrate nutrient balance and microbial community structure and function in anaerobic co-digestion. Bioresour. Technol. 2018, 247, 1119–1127. [Google Scholar] [CrossRef] [PubMed]
- Xu, Q.; Long, S.; Liu, X.; Duan, A.; Du, M.; Lu, Q.; Leng, L.; Leu, S.-Y.; Wang, D. Insights into the occurrence, fate, impacts, and control of food additives in food waste anaerobic digestion: A review. Environ. Sci. Technol. 2023, 57, 6761–6775. [Google Scholar] [CrossRef] [PubMed]
Figure 1.
Schematic diagram of digestion apparatus (1: Thermostated cabinet; 2: Heater; 3: Temperature control Panel; 4: Reactor; 5: Sampling tube; 6: Gasway tube; 7: Gas bag).
Figure 1.
Schematic diagram of digestion apparatus (1: Thermostated cabinet; 2: Heater; 3: Temperature control Panel; 4: Reactor; 5: Sampling tube; 6: Gasway tube; 7: Gas bag).

Figure 2.
Effect of different solids contents of digestion materials on daily methane production through anaerobic digestion. (Liquid anaerobic digestion (L-AD), TS < 12%; dry-state anaerobic digestion (SS-AD) 12% ≤ TS < 20%; semidry-state anaerobic digestion (HSS-AD), TS ≥ 20%).
Figure 2.
Effect of different solids contents of digestion materials on daily methane production through anaerobic digestion. (Liquid anaerobic digestion (L-AD), TS < 12%; dry-state anaerobic digestion (SS-AD) 12% ≤ TS < 20%; semidry-state anaerobic digestion (HSS-AD), TS ≥ 20%).

Figure 3.
Effect of different solids contents of digestion materials on cumulative methane production from anaerobic digestion. (Liquid anaerobic digestion (L-AD), TS < 12%; dry-state anaerobic digestion (SS-AD) 12% ≤ TS < 20%; semidry-state anaerobic digestion (HSS-AD), TS ≥ 20%).
Figure 3.
Effect of different solids contents of digestion materials on cumulative methane production from anaerobic digestion. (Liquid anaerobic digestion (L-AD), TS < 12%; dry-state anaerobic digestion (SS-AD) 12% ≤ TS < 20%; semidry-state anaerobic digestion (HSS-AD), TS ≥ 20%).

Figure 4.
Effect of different solids contents of the digestion materials on the cumulative methane production per unit volume of anaerobic digestion. (Liquid anaerobic digestion (L-AD), TS < 12%; dry-state anaerobic digestion (SS-AD) 12% ≤ TS < 20%; semidry-state anaerobic digestion (HSS-AD), TS ≥ 20%).

Figure 5.
The relative abundance of bacteria and archaea during the initial digestion and peak gas production periods. (TS6-IP, TS20-IP, and TS25-IP denote that the samples were collected at the initial stage of digestion; TS6-GP, TS20-GP, and TS25-GP denote that the samples were collected at the peak gas production period).


Figure 6.
Principal component analysis (PCA) of the bacterial (A) and archaeal (B) communities under different solids contents of the digestion materials. (TS6−IP, TS20−IP, and TS25−IP denote that the samples were collected at the initial stage of digestion; TS6−GP, TS20−GP, and TS25−GP denote that the samples were collected at the peak gas production period).


Table 1.
Physicochemical properties of materials and inoculum.
| Measurement Indicator | Dairy Manure | Tomato Residues | Inoculum |
|---|---|---|---|
| Water content (%) | 82.2 ± 0.4 | 85.1 ± 0.2 | 62.6 ± 0.8 |
| Total Solid (%) | 17.8 ± 0.3 | 14.9 ± 0.2 | 37.4 ± 0.4 |
| Volatile solids (%) b | 16.1 ± 0.02 | 10.5 ± 0.5 | 10.2 ± 0.03 |
| Volatile solids/Solid content (%) | 42.6 ± 0.2 | 70.2 ± 0.07 | 27.3 ± 0.04 |
| pH | 8.0 ± 0.2 | ND a | 8.3 ± 0.4 |
| Total carbon (%) b | 45.4 ± 0.0 | 46.6 ± 0.4 | 16.7 ± 0.02 |
| Total nitrogen (%) b | 2.4 ± 0.0 | 2.4 ± 0.3 | 0.8 ± 0.01 |
| Carbon nitrogen ratio | 18.5 ± 0.0 | 19.5 ± 0.8 | 21.2 ± 0.02 |
| Hemicellulose (%) b | 25.1 ± 0.7 | 16.0 ± 0.08 | 14.3 ± 0.2 |
| Cellulose (%) b | 23.4 ± 0.5 | 21.5 ± 0.02 | 6.3 ± 0.5 |
| Lignin (%) b | 6.1 ± 0.07 | 7.0 ± 0.01 | 5.1 ± 0.7 |
Notes: ND a = Undeterminate. b Calculate according to dry weight, the rest according to wet weight.
Table 2.
Primers used in high-throughput sequencing of bacteria and archaea.
| Sequencing Region | Primer Name | Primer Sequence | Species |
|---|---|---|---|
| V3-V4 | 338F | ACTCCTACGGGGAGGCAGGAG | Bacteria |
| 806R | GGACTACHVGGGTWTCTAAT | ||
| V3-V4 | 344F | ACGGGGYGCAGCAGGCGCGA | Archaea |
| 806R | GGACTACVSGGGTATCTAAT |
Table 3.
The final pH value, ammonia nitrogen, volatile fatty acids, and basicity of the digestion system under different solids contents of the digestion materials.
Table 3.
The final pH value, ammonia nitrogen, volatile fatty acids, and basicity of the digestion system under different solids contents of the digestion materials.
| Treatment | pH | TAN (g/kg) | VFAs (g/kg) | ALK (g CaCO3/kg) | VFA/ALK |
|---|---|---|---|---|---|
| TS6 | 5.6 | 1.0 | 5.8 | 4.4 | 1.32 |
| TS8 | 6.2 | 0.7 | 3.7 | 8.3 | 0.45 |
| TS10 | 7.5 | 1.6 | 3.1 | 9.8 | 0.32 |
| TS12 | 7.6 | 1.0 | 3.4 | 11.2 | 0.30 |
| TS15 | 7.6 | 1.2 | 2.3 | 8.9 | 0.26 |
| TS18 | 8.3 | 1.8 | 2.9 | 11.7 | 0.25 |
| TS20 | 8.5 | 2.1 | 1.1 | 8.4 | 0.13 |
| TS22 | 8.3 | 2.1 | 1.3 | 9.5 | 0.14 |
| TS25 | 8.4 | 2.2 | 1.2 | 6.5 | 0.18 |
Notes: Total ammonia nitrogen, TAN; volatile fatty acids, VFAs; alkalinity, ALK. TS6, TS8, TS10, TS12, TS15, TS18, TS20, TS22, and TS25 denote the total solid (TS) of fermentation substrates (TS were 6%, 8%, 10%, 12%, 15%, 18%, 20%, 22%, and 25%).
Table 4.
The alpha diversity of bacteria and archaea at the beginning of digestion and the peak gas production period under different solids contents of the digestion materials.
Table 4.
The alpha diversity of bacteria and archaea at the beginning of digestion and the peak gas production period under different solids contents of the digestion materials.
| Samples | Observed-Species | Shannon | Simpson | Chao1 | |
|---|---|---|---|---|---|
| Bacteria | TS6-IP | 1009.5 | 6.878 | 0.966 | 1095.269 |
| TS20-IP | 1067.2 | 6.552 | 0.954 | 1189.641 | |
| TS25-IP | 1039.8 | 6.821 | 0.967 | 1163.642 | |
| TS6-GP | 1087.3 | 7.005 | 0.973 | 1079.027 | |
| TS20-GP | 988.1 | 7.128 | 0.977 | 1129.575 | |
| TS25-GP | 989.9 | 7.352 | 0.984 | 1077.806 | |
| Archaea | TS6-IP | 172 | 4.227 | 0.877 | 185.942 |
| TS20-IP | 149 | 3.991 | 0.857 | 162.881 | |
| TS25-IP | 158 | 3.548 | 0.773 | 174.237 | |
| TS6-GP | 130 | 4.114 | 0.88 | 137.567 | |
| TS20-GP | 145 | 4.122 | 0.861 | 152.595 | |
| TS25-GP | 140 | 3.722 | 0.804 | 157.254 | |
Notes: TS6-IP, TS20-IP, and TS25-IP denote that the samples were collected at the initial stage of digestion; TS6-GP, TS20-GP, and TS25-GP denote that the samples were collected at the peak gas production period.
Disclaimer/Publisher’s Note: The statements, opinions and data contained in all publications are solely those of the individual author(s) and contributor(s) and not of MDPI and/or the editor(s). MDPI and/or the editor(s) disclaim responsibility for any injury to people or property resulting from any ideas, methods, instructions or products referred to in the content. |
© 2024 by the authors. Licensee MDPI, Basel, Switzerland. This article is an open access article distributed under the terms and conditions of the Creative Commons Attribution (CC BY) license (https://creativecommons.org/licenses/by/4.0/).
Share and Cite
MDPI and ACS Style
Wang, Y.; Li, Y.; Yao, L.; Fu, L.; Liu, Z. The Biogas Production Potential and Community Structure Characteristics of the Co-Digestion of Dairy Manure and Tomato Residues. Agronomy 2024, 14, 881. https://doi.org/10.3390/agronomy14050881
AMA Style
Wang Y, Li Y, Yao L, Fu L, Liu Z. The Biogas Production Potential and Community Structure Characteristics of the Co-Digestion of Dairy Manure and Tomato Residues. Agronomy. 2024; 14(5):881. https://doi.org/10.3390/agronomy14050881
Chicago/Turabian StyleWang, Yanqin, Yan Li, Li Yao, Longyun Fu, and Zhaodong Liu. 2024. "The Biogas Production Potential and Community Structure Characteristics of the Co-Digestion of Dairy Manure and Tomato Residues" Agronomy 14, no. 5: 881. https://doi.org/10.3390/agronomy14050881
Note that from the first issue of 2016, this journal uses article numbers instead of page numbers. See further details here.