Article

Influence of Land Use Types on Soil Properties and Soil Quality in Karst Regions of Southwest China

1
College of Resources and Safety Engineering, Chongqing University, Chongqing 400044, China
2
Key Laboratory of the Three Gorges Reservoir Region’s Eco-Environment, Ministry of Education, Department of Environmental Science, Chongqing University, Chongqing 400044, China
3
Observation and Research Station of Ecological Restoration for Chongqing Typical Mining Areas, Ministry of Natural Resources, Chongqing Institute of Geology and Mineral Resources, Chongqing 401120, China
4
School of Geographical Sciences, Southwest University, Chongqing 400715, China
*
Author to whom correspondence should be addressed.
Agronomy 2024, 14(5), 882; https://doi.org/10.3390/agronomy14050882
Submission received: 25 March 2024 / Revised: 18 April 2024 / Accepted: 19 April 2024 / Published: 23 April 2024
(This article belongs to the Section Soil and Plant Nutrition)

Abstract

:
Establishing a suitable and useful soil quality index (SQI) is the key to accurately evaluating changes in soil quality (SQ) under different land use types. In the present study, a suitable and useful SQI using a minimum data set (MDS) with two scoring methods (linear scoring method and nonlinear scoring method) and two additive models (simple additive model with same weighting value and weighted additive model with significant different weighting value) was established to compare SQ under different land uses in Longtan valley. Soil samples were collected under one dryland (DRYL), one paddy (PADD), one orchard (GRA), and one natural forest (FORE), and 13 soil properties were measured. The four land use types had the same soil type and similar environmental conditions. Land use types had significant effects on the measured 12 soil properties. The top two principal components in Principal Component Analysis were chosen, and their cumulative variance was more than 90%. Soil indicators of soil labile carbon, C/N ratio, and microaggregates were chosen as members of MDS in this study. Significant (p < 0.001) positive correlations among the four establishing SQIs were found. The values of the sensitive index ranged from 47.17% to 82.12% for the four SQIs, and the SQI established using the nonlinear scoring method and weighted additive model (SQI-NLW) had the highest values. Among the four land use types, the four SQIs had similar change trends, and the average values of SQ under FORE (0.73) and PADD (0.68) were significantly higher than those under GRA (0.54) and DRYL (0.43). These results indicated that the SQI-NLW was an effective and precise tool to assess SQ under different land uses in similar regions, and the FORE and PADD were the suitable land use types for the sustainable use of soils in karst regions.

1. Introduction

On the Earth’s surface, karst is a dynamic and complex system that is formed by carbonate rocks [1]. The karst landforms are distributed widely on our planet and occupy more than 20% of the continental terrain [2]. Due to the unique characteristics of thin soil layers and poor water and nutrient retention capacity, soils in karst regions were easily affected by anthropogenic influences, thus resulting in soil erosion and land degradation [1,3]. As one of the top three karst concentrated distribution areas in the world, the karst regions in Southwest China have experienced a high intensity of utilization in order to meet the peoples’ needs since the 1950s [4]. Therefore, rocky desertification has occurred in some karst regions. Some big ecological restoration projects have been implemented since 1999 to restore the degraded karst ecosystems [5]. The coexistence of agricultural lands and revegetation lands in the karst regions resulted in the diversification of land use types. However, the influences of land use types on soil quality and sustainable use of soil are still unclear in these karst regions.
Soil quality (SQ) is a key indicator in assessing the sustainable use of soil, and the accuracy of the evaluation of SQ is important for us to make well-informed decisions to maintain high soil productivity and prevent soil degradation [6]. The SQ is an integrated expression of soil properties, and using more soil properties to assess SQ can produce more accurate results [7,8,9,10]. However, using more soil properties for SQ evaluation could significantly increase the cost of labor, material, and financial resources in laboratory analysis [6,8]. Therefore, many conceptual models and approaches have been established to assess SQ under different regions in the world [2,11,12]. Among these models and approaches, the soil quality index (SQI) established using minimum data set (MDS) is widely accepted and used to assess SQ because of accuracy, labor and cost saving, and quantitative flexibility [7,13]. For example, Yang et al., in the Sanjiang Plain, northeastern China, used MDS to establish SQIs and analyzed the influences of land use change on SQ [14]. Similarly, Negis et al., on the Karapinar-Konya Plain, south Turkey, established SQIs using MDS to evaluate the influences of land use change on SQ dynamics [15]. However, there is no universal SQI for evaluating SQ in different ecosystems and regions.
There are three main steps to establish the SQI: selecting the MDS, scoring soil indicators in MDS, and integrating the scores [16,17]. However, any step in the calculation of SQIs is still a challenging field [2]. Previous studies showed that the principal component analysis (PCA) was widely used to choose the best representative soil properties from lots of soil properties and successfully evaluate SQ at different locations and scales [7,14,17]. After selecting the MDS, two common methods, the linear scoring method (LSM) and the nonlinear scoring method (NLSM), were used to score the soil properties in MDS. However, some studies used the LSM to establish the SQI [14,16], and other studies used the NLSM to calculate the SQI [10,18]. Comparisons between the two methods to determine which was better for assessing SQ were very few in previous studies and thus resulted in uncertain or inaccurate results in SQ assessment [6]. Finally, the unitless scores of soil indicators in MDS added up to a comprehensive SQ value using the simple additive model or weighted additive model [19]. Some studies found that both methods of the simple additive model or weighted additive model could accurately assess the variations in SQ [2,20]. However, the other studies suggested that the weighted additive model had better discrimination than the simple additive model in SQ evaluation because it considered the different contributions of soil indicators in MDS to SQ [10,21]. These contradictory results indicate that further studies are still required to choose the suitable additive model before the SQ evaluation.
Accurate assessment of the changes of SQ using a suitable evaluation tool under different land use types is of great significance for regional sustainable development [2]. According to the above analysis, we hypothesized that the SQI established using the NLSMand weighted additive model was better than other SQIs, and the natural forest had the highest SQ. To test these hypothesizes, the objectives of the present study were to: (1) establish different SQIs using two scoring methods (linear and nonlinear) and two additive models (simple and weighted), and select the sensitivity and effectiveness SQI for karst regions; (2) evaluate changes in SQ values under native forest, grapefruit orchard, dryland and paddy in karst regions.

2. Materials and Methods
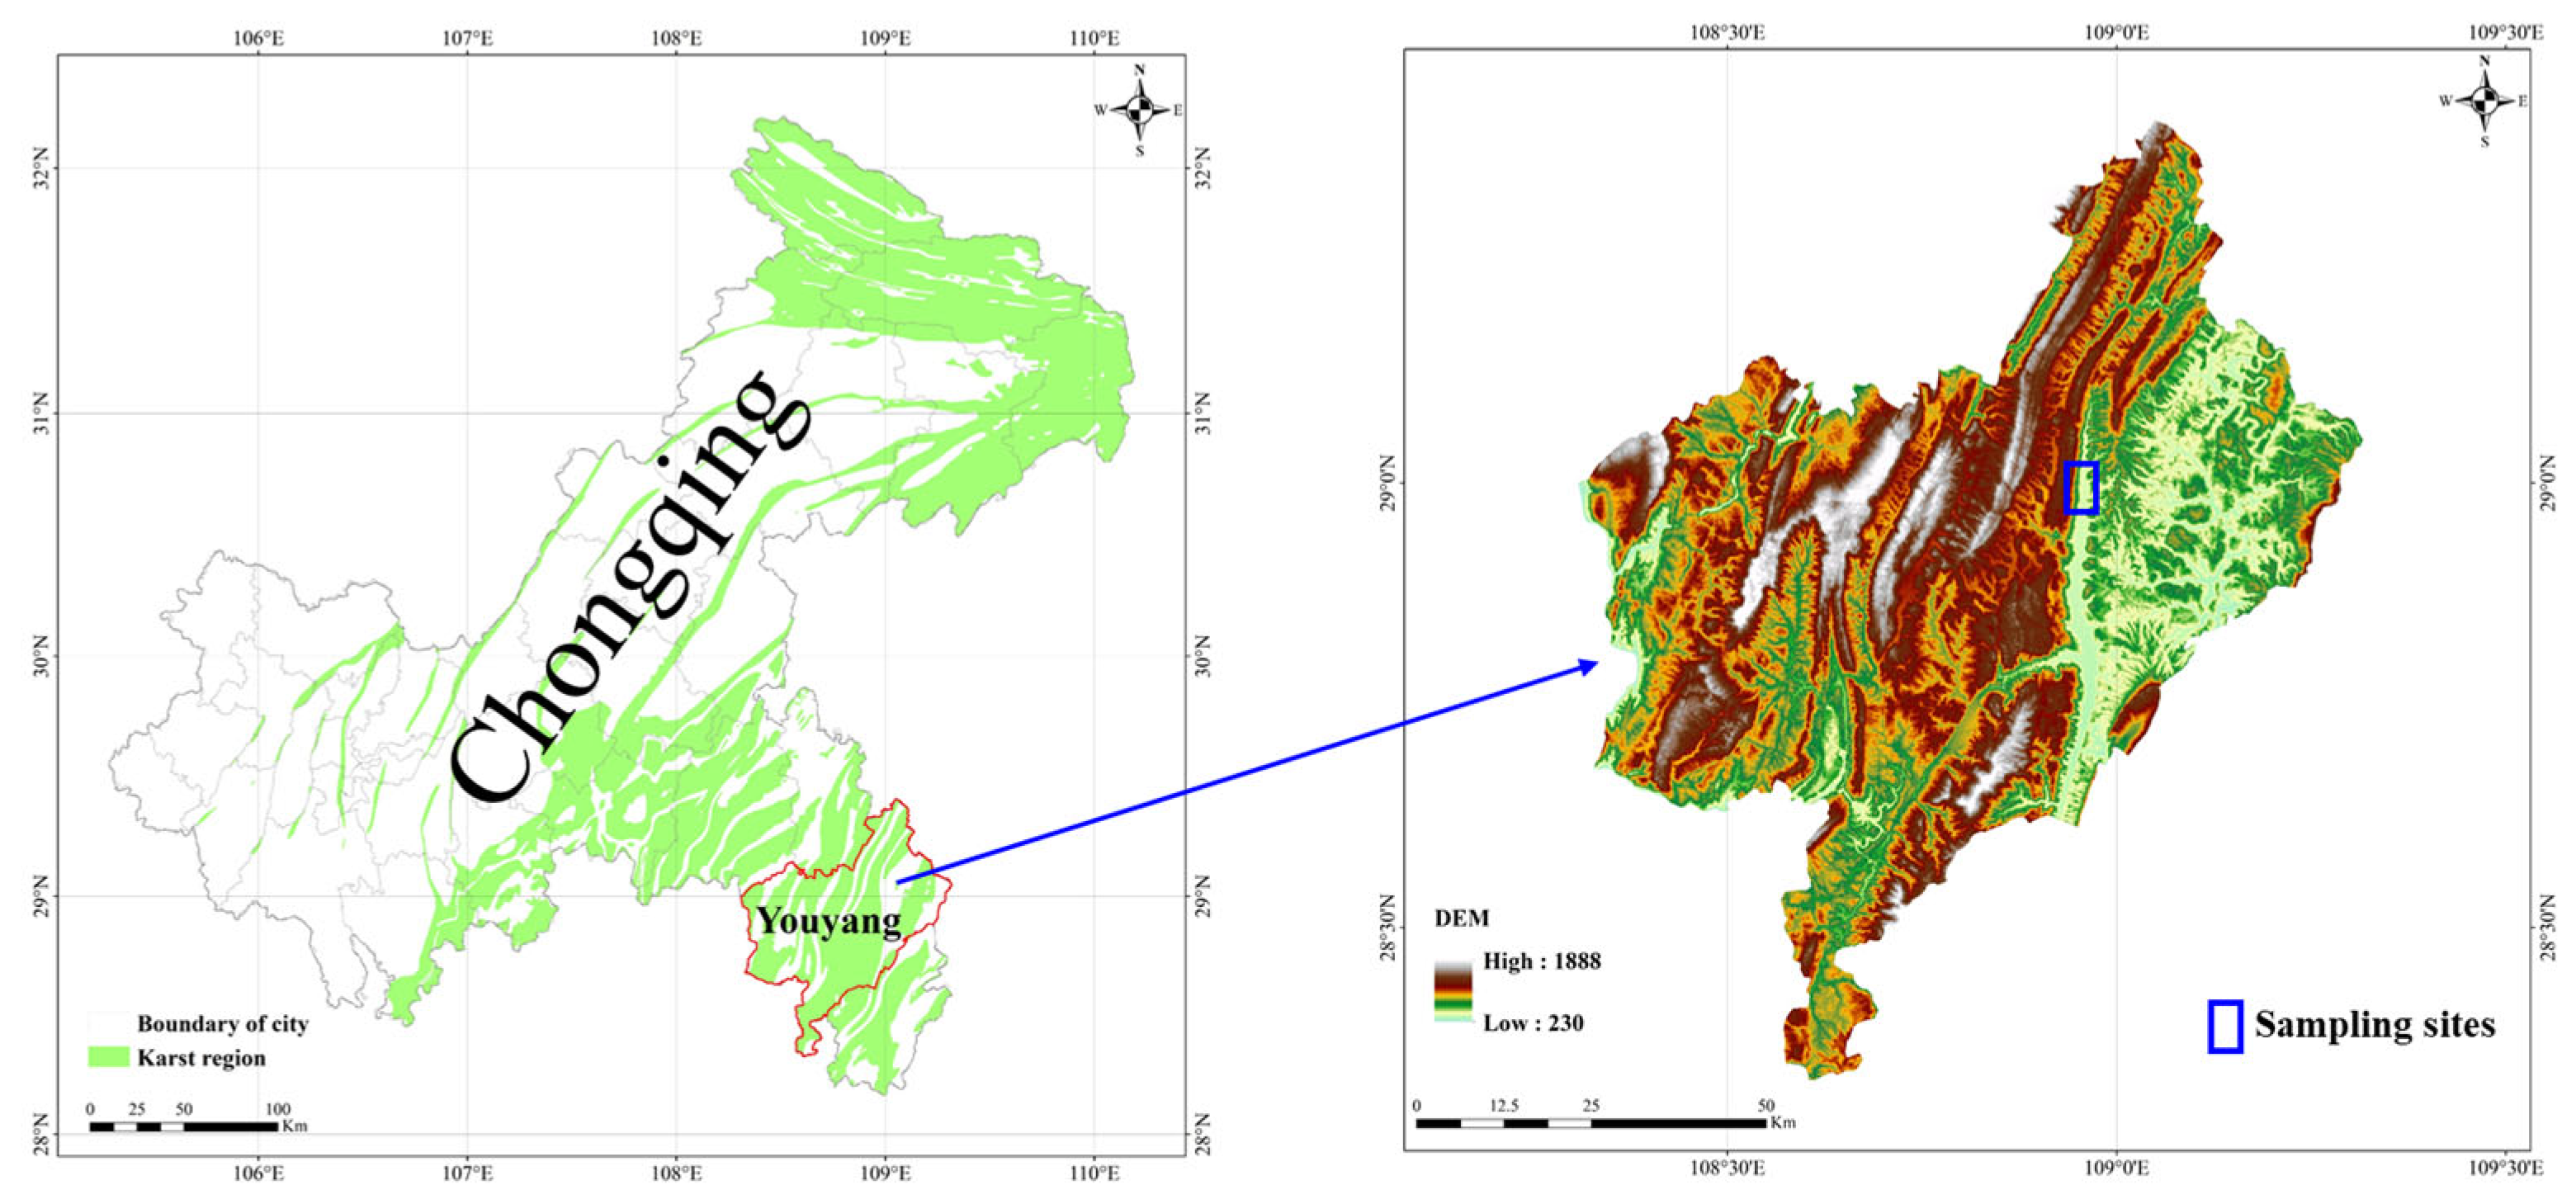
2.1. Study Area

This study was performed in the Longtan valley (108°57′ E, 29°00′ N) in Youyang, Chongqing (Figure 1). The Longtan valley is a typical karst valley with an elevation between 350 m a.s.l. and 380 m a.s.l. The climate type in Longtan Valley was a subtropical, humid monsoon climate. The total annual rainfall and annual temperature averages 1300 mm and 15 °C, respectively. The bedrock is composed of Cambrian and Ordovician dolomites. The soil type in Longtan Valley is Calcic Luvisols, according to the WRB taxonomy system. The soil texture was 27.9% clay, 61.5% silt and 10.6% sand. The bulk density was about 1.34 g cm−3. The subtropical evergreen broad-leaved forest is the natural vegetation in the mountain regions of Longtan Valley. In the valley, the natural vegetation was converted to cropland or orchards to meet the needs of people’s lives. Rock desertification occurred in some regions of Longtan Valley due to excessive utilization.

2.2. Sampling Design

According to the remote sensing and the detailed field investigation, four typical land uses in the study area (2.0 km2) were selected. The four land use types were one dryland for planting maize (DRYL), one paddy for planting rice (PADD), one orchard for planting grapefruit (GRA), and one natural forest (FORE). To ensure the soil samples were the same before land use changes, the environmental conditions, lithology, soil type, and previous land uses were all considered during the selection of study sites. Four replicate sampling plots were established in each land use type. The area of each sampling plot for natural forest and orchard was 10 m × 10 m, and the area of each sampling plot for dryland and paddy was 1 m × 1 m. A total of 16 sampling plots were set up. In each sampling plot, five soil samples were collected at a depth of 0–15 cm depth in May 2022. The distance between any two sampling plots exceeded 30 m in our study because previous studies found that a sampling distance of >13.5 m was required to obtain statistically independent samples [22,23]. Two subsamples were divided from each soil sample: one subsample was broken into small particles with a diameter less than 8 mm for aggregate fractionation, and one subsample was air-dried and grounded for physicochemical analysis.

2.3. Soil Analysis

Thirteen soil properties were measured per sample to evaluate the SQ in our study. The wet sieving method was used to divide the different sizes of soil aggregates, and the bulk soil was separated into macroaggregate (>0.25 mm, MAC) and microaggregate (0.053–0.25 mm, MIC). Mean weight diameter (MWD) and geometric mean diameter (GMD) were used to represent the soil aggregate stability following the method of Okolo et al. [22]. Soil pH was determined using a 1:2.5 soil/water solution. Contents of soil organic carbon (SOC), macroaggregate-associated carbon (MACC), and free mineral-associated organic carbon (Free MAOC) were measured using the K2Cr2O7-H2SO4 oxidation method. Soil labile carbon (SLC) content was determined using the revised Walkley and Black method [23]. Total nitrogen (TN) and phosphorus (TP) were determined using the Continuous-Flow Analyzer of AA500 (SEAL Analytical GmbH, Norderstedt, Germany). The ratio of SOC and TN (C/N) and the ratio of SOC and TP (C/P) were calculated as the molar ratios [24]. Previous studies reported that the contents of SLC, MACC, and SOC were closely related to soil microbial properties (e.g., soil microbial biomass and soil microbial diversity) [20,24]. Therefore, we used the contents of SLC, MACC, and SOC instead of soil microbial properties to evaluate SQ due to the high cost of determining microbial properties in the present study. These 15 soil properties were selected due to their important roles in soil sustainability. The rocky desertification resulting from soil erosion was the main ecological problem in Longtan Valley. The soil’s physical properties were a good indicator of soil erosion condition [6]. Therefore, the soil’s physical properties, including MAC, MIC, GMD, and MWD, were selected in the present study. Other soil chemical properties (e.g., TN, TP, pH, and Free MAOC) were important indicators of soil fertility and productivity and thus were commonly used as important indicators in SQ assessment in Southwest China.

2.4. Calculate the Soil Quality Index

  • Selecting the MDS;
We used One-way ANOVA to test the influences of different land use types on the thirteen soil properties, and only the soil properties that were significantly (p < 0.05) affected by different land uses were used to select the MDS in this study. The PCA was performed to analyze the data matrix of the selected soil properties above. Considering the principal components (PCs) contribution in the present study, only the PCs with an eigenvalue of more than 1 were considered meaningful and thus were chosen for selecting the key soil indicators in MDS [24,25]. In each chosen PC, the soil properties with a loading value of more than 90% of the highest loading value in the same PC were considered as the important soil indicators, and these important soil indicators were kept representing this PC in MDS. In each PC, if the number of important soil indicators was more than one. The correlation relationships among the soil indicators were tested. If these soil indicators were significantly correlated, only the soil indicator with the highest loading value was chosen to represent this PC in MDS. If these soil indicators were not correlated with each other, all the uncorrelated soil indicators were chosen to represent this PC in MDS [18].
2.
Establishing the SQI;
The LSM and NLSM were two commonly used scoring methods in SQ evaluation under different regions and different management practices, which could well reflect the function of soil indicators in SQ [24,25]. Therefore, the soil indicators selected in MDS were transformed into dimensionless scores (ranging from 0 to 1) using the LSM and nNLSM in the present study. Soil indicators in MDS were separated into two groups: one group used the “more is better” scoring function (e.g., SLC, C/N, SOC, and MWD), and the soil indicators with a high score in this group indicated good SQ; another group used the “less is better” scoring function (e.g., MIC and free MAOC), and the soil indicators with a high score in this group indicated poor SQ.
For the LSM, Equations (1) and (2) were the “more is better” and “less is better” scoring functions, respectively.
SC L = V / V max
SC L = V min / V
where SCL is the score of the selected soil indicator in LSM, V is the value of the selected soil indicator, Vmax and Vmin are the max. and min. values of the selected soil indicator.
For the NLSM, Equation (3) was used as follows:
SC NL = 1 1 + ( V / V m ) a
where SCNL is the score of the selected soil indicator in NLSM, Vm is the mean value of the selected soil indicator; a is −2.5 for the “more is better” scoring function and 2.5 for the “less is better” scoring function.
After scoring the soil indicators in MDS, these unitless scores of soil indicators needed to be added together as an SQ value. The simple additive model with equal weighting value (emphasis on equal contributions for SQ) and the weighted additive model with significantly different weighting value (emphasis on different contributions for SQ) were widely used to establish the comparative soil quality index (SQI) in previous studies [20,21]. Therefore, the simple additive model (Equation (4)) and the weighted additive model (Equation (5)) were used in this study to calculate the SQI as follows:
SQI s = i = 1 n SC i n
SQI w = i = 1 n ( W i × SC i )
where SQIS and SQIW are the values of SQI for simple and weighted additive models, respectively. SCi is the score of the soil indicator in MDS; n is the number of soil indicators in MDS. Wi is the weighting value, which was determined using the eigenvalue of the respective PCs.
According to the different scoring methods and different additive models, four SQIs, including the linear and simple additive SQI (SQI-LS), the linear and weighted additive SQI (SQI-LW), the nonlinear and simple additive SQI (SQI-NLS), and the nonlinear- and weighted additive SQI (SQI-NLW) were obtained in this study.
3.
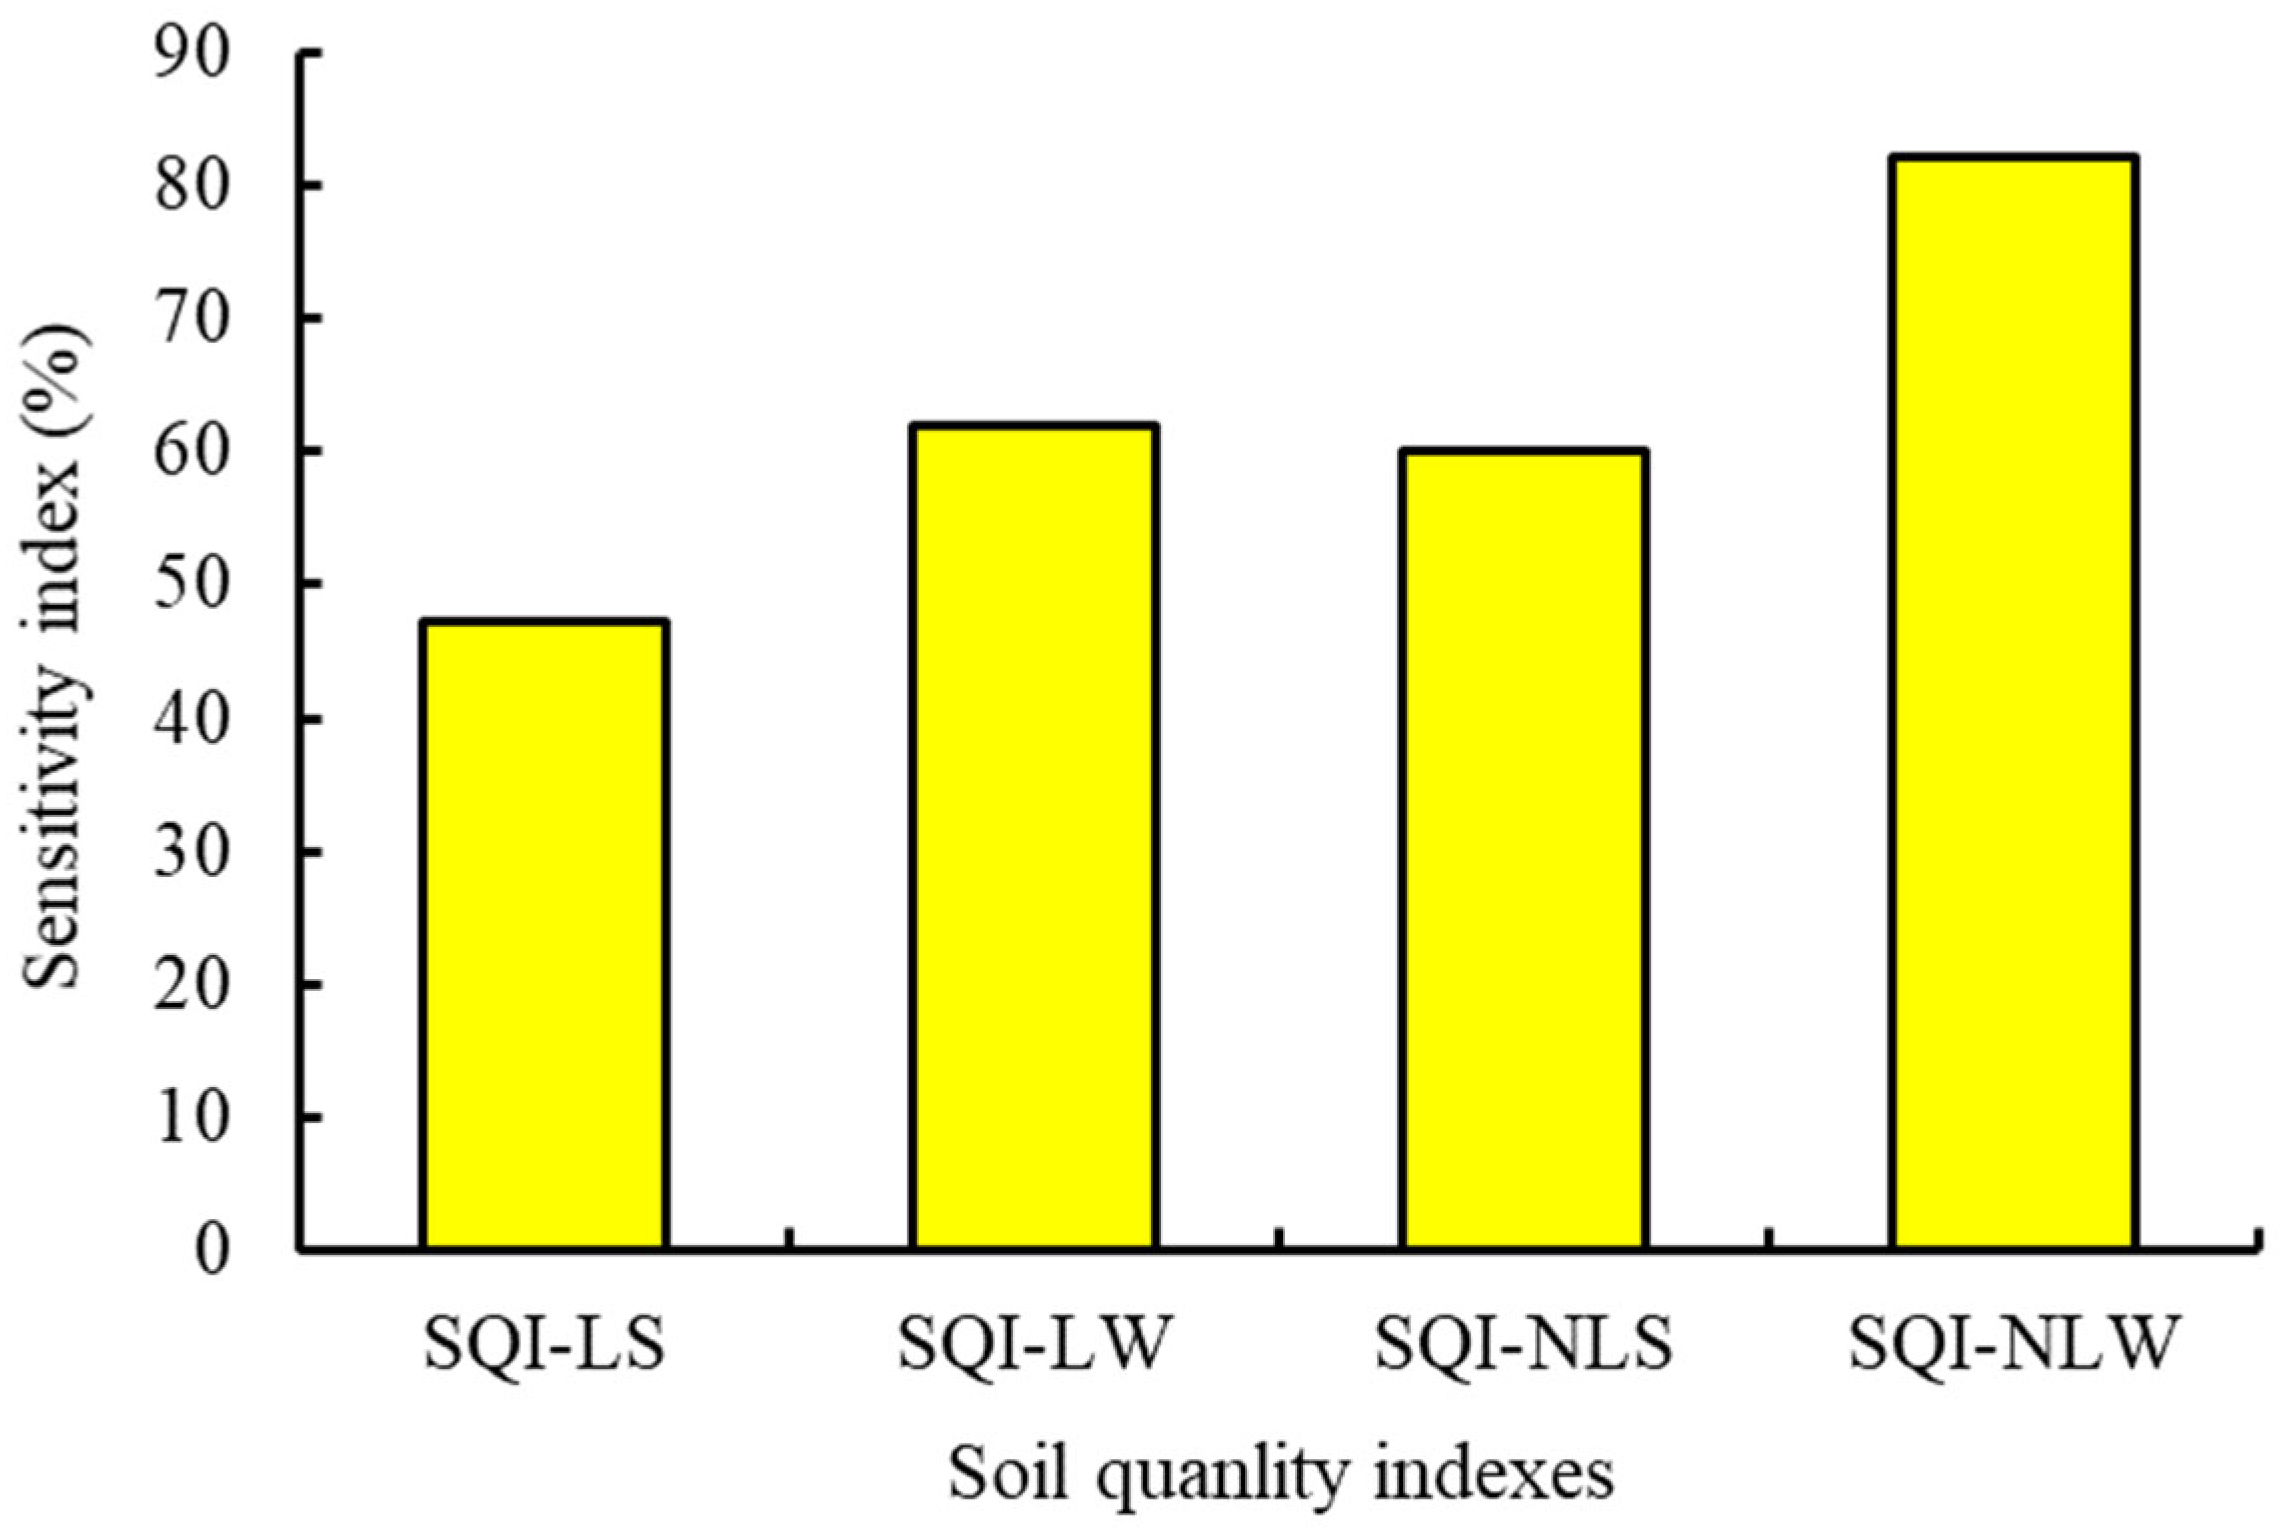
The sensitivity index of SQI.
The sensitivity index (SI) of the soil quality index was used to evaluate the effectiveness and sensitivity potential of establishing SQIs for different land use types [18,20]. A high SI value indicated the SQI was more effective and sensitive to different land use types. The SI was calculated using the following equations:
SI = SQI max SQI min SQI mean
where the SQImax, SQImin, and SQImean are the man., min., and mean value of a specific establishing SQI, respectively [26].

2.5. Statistical Analyses

We used the SPSS 16.0 and R v.4.1.1 software to perform the statistical analyses in the present study. The KMO (0.75) and Bartlett’s Test (p < 0.001) of the data set were tested to meet the assumptions of PCA analysis. The influences of land use on 13 soil properties and the four establishing SQIs were tested using the One-way ANOVA, and then the LSD test was applied to compare the differences at the p < 0.05 level. Pearson correlation analyses were used at the p < 0.05 level to remove the unsuitable soil indicators in MDS and inappropriate SQIs. The Pearson correlation analyses were performed using the corrplot (v. 0.92) package.

3. Results

3.1. Contents of Soil Properties

Of the thirteen measured soil properties, twelve soil properties were significantly influenced by different land uses. The MAC, GMD, MWD, and soil pH values under FORE were significantly higher than those under GRA ≈ PADD > DRYL (Table 1). The contents of free MAOC under FORE were not different from that under PADD. However, they were significantly higher than that under GRA and DRYL. The content of SOC, MACC, SLC, and TN under GRA and DRYL were significantly lower than that under FORE and PADD. The highest content of TP was found under PADD, which was significantly higher than that under DRYL, FORE, and GRA (Table 1). The lowest C/N ratio under PADD was significantly lower than that under FORE, GRA, and DRYL, and the highest C/N ratio under GRA was higher than that under FORE. The DRYL had the highest MIC contents, which were higher than that under PADD > GRA > FORE.

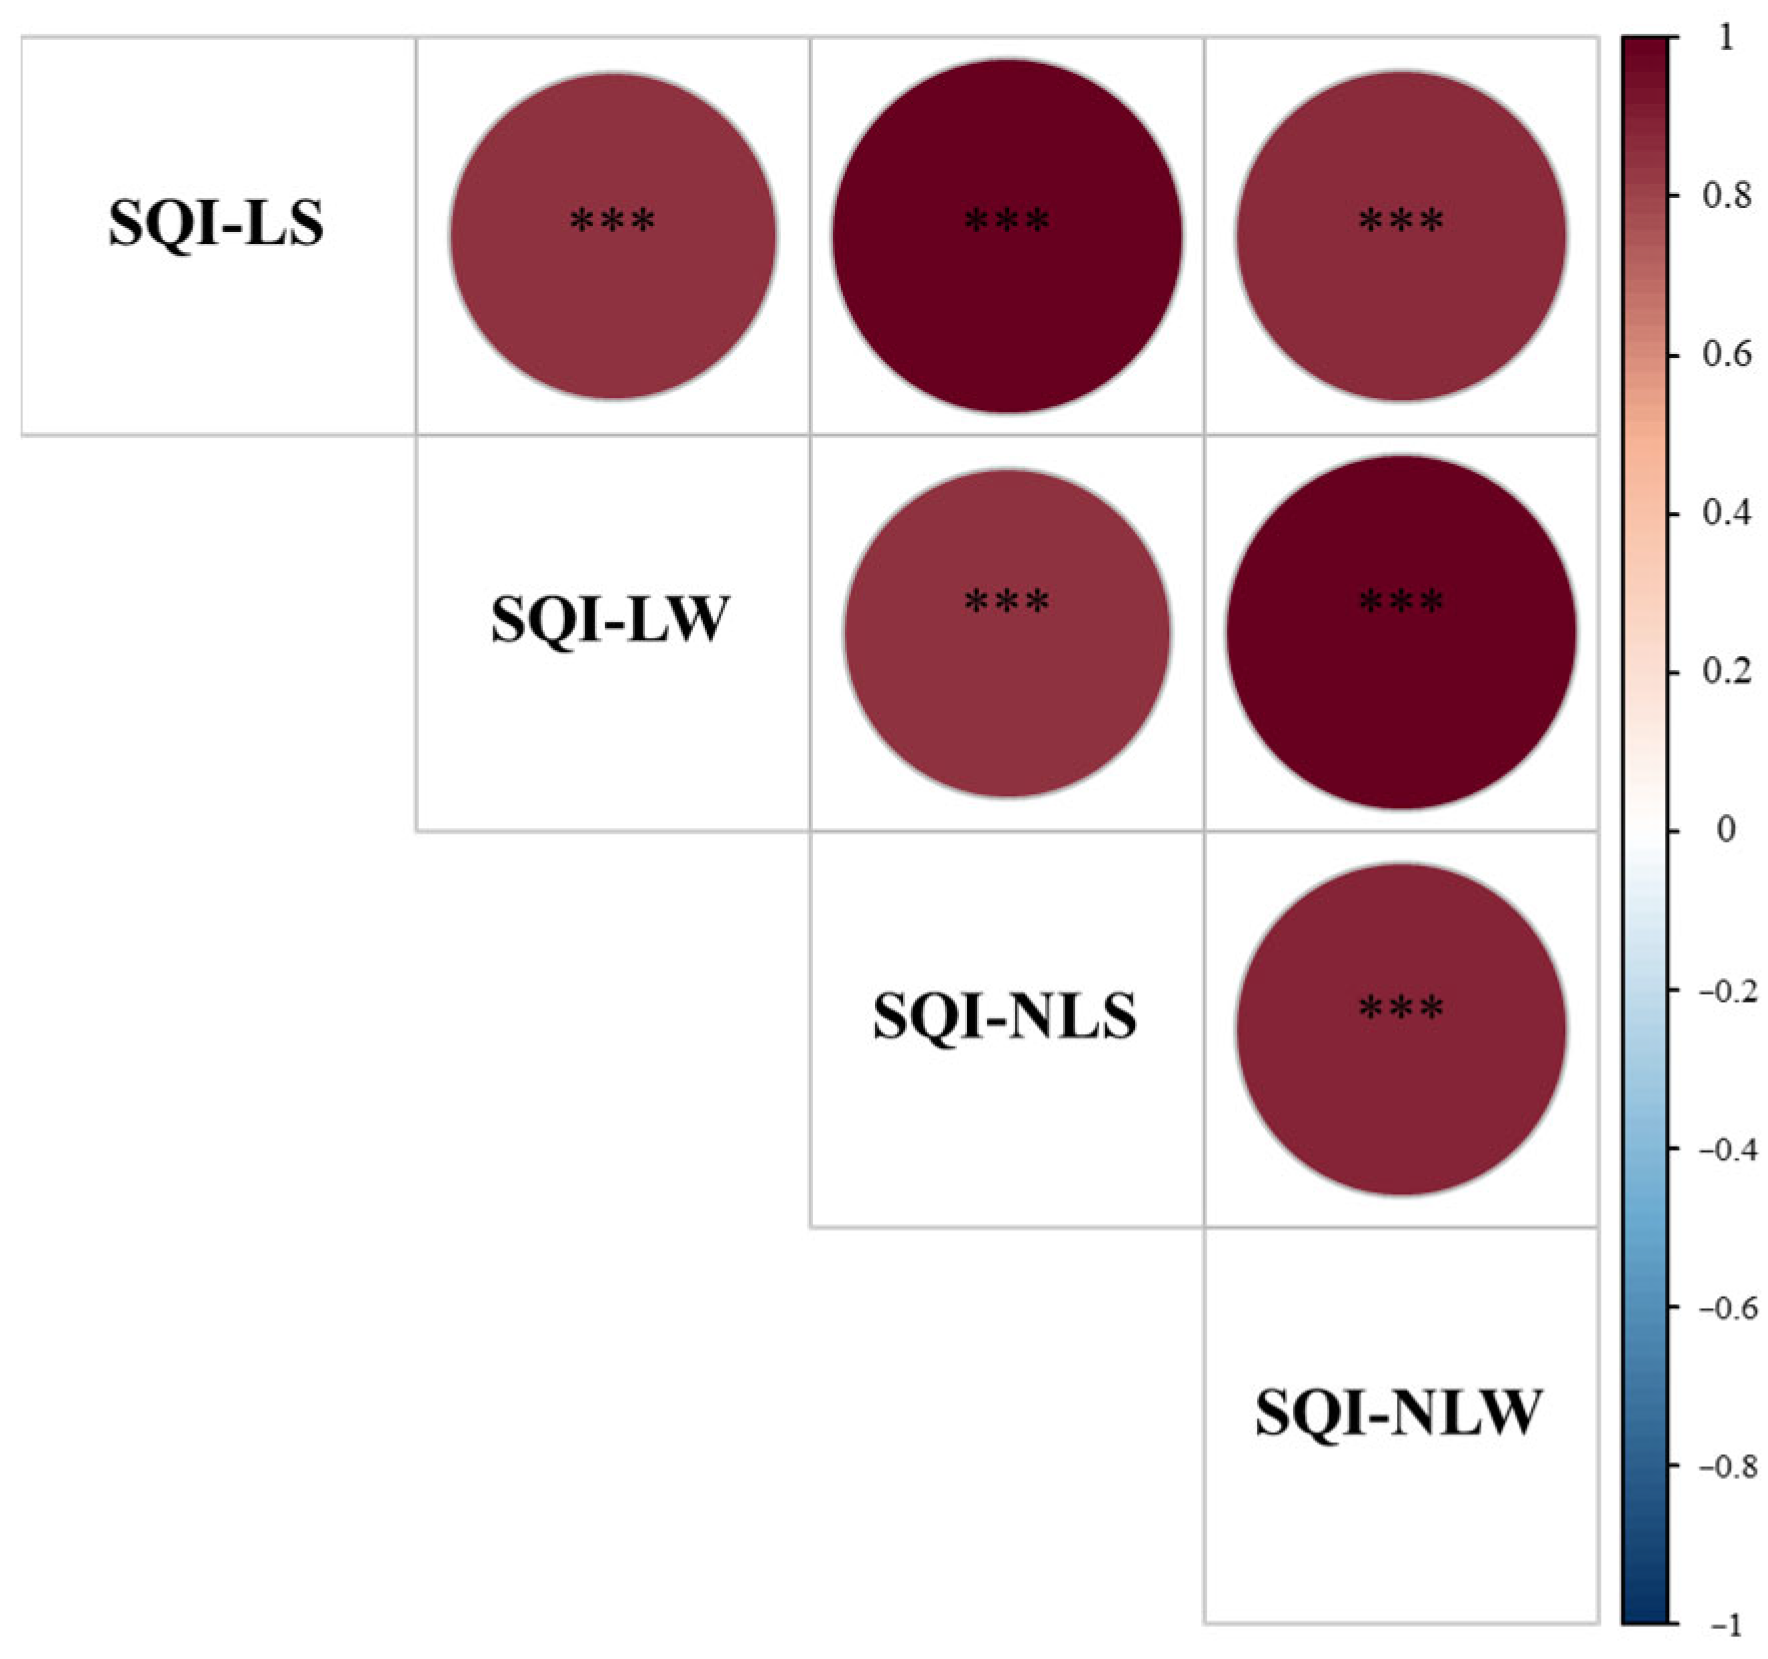
3.2. The Soil Quality Index Based on MDS

In the PCA analysis, the top two PCs with an eigenvalue value > 1 were chosen to select soil indicators in MDS (Table 2). The cumulative variance value for the top two PCs was 92.97%. The eigenvalue of PC1 was 7.64, and this PC explained 63.63% of the total variability of the twelve soil properties. In PC1, three soil indicators (SOC, free MAOC, and SLC) were identified because of their high loading value. The SLC with the highest loading value was significantly correlated with the SOC and free MAOC (Figure 2). Therefore, the SLC was finally selected to represent the PC1 in MDS.
The eigenvalue of PC2 was 3.52, and it explained 29.34% of the total variability in the selected soil properties (Table 2). In PC2, five soil indicators of C/N, MIC, GMD, MWD, and MAC with high loading values were chosen as the potential soil indicators in MDS. The MIC was significantly related to MWD, GMD, and MAC, but it was not related to the C/N ratio (Figure 2). Therefore, soil indicators of MIC and C/N were selected to represent the PC2 in MDS. Finally, three soil indicators of SLC, C/N, and MIC were chosen as members of MDS.
Based on the eigenvalue of each PC, the weighted value was calculated for the weighted additive model. The weighted values for PC1 and PC2 were 0.68 and 0.32, respectively. In the simple additive model, these soil indicators in MDS had an equal-weighted value of 0.33. The SI value for SQI-NLW was the highest, with a value of 82.12%, while the SQI-LS had the lowest SI value of 47.17% (Figure 3). The correlation matrix among the four establishing SQIs indicated that these SQIs were significantly correlated with each other (Figure 4). The p values of one-way ANOVA analysis for the four establishing SQIs were all less than 0.001. However, the F value for the SQI-NLW was 119.62%, 39.17%, and 25.16% higher than the SQI-LS, SQI-LW, and SQI-NLS, respectively (Figure 5).

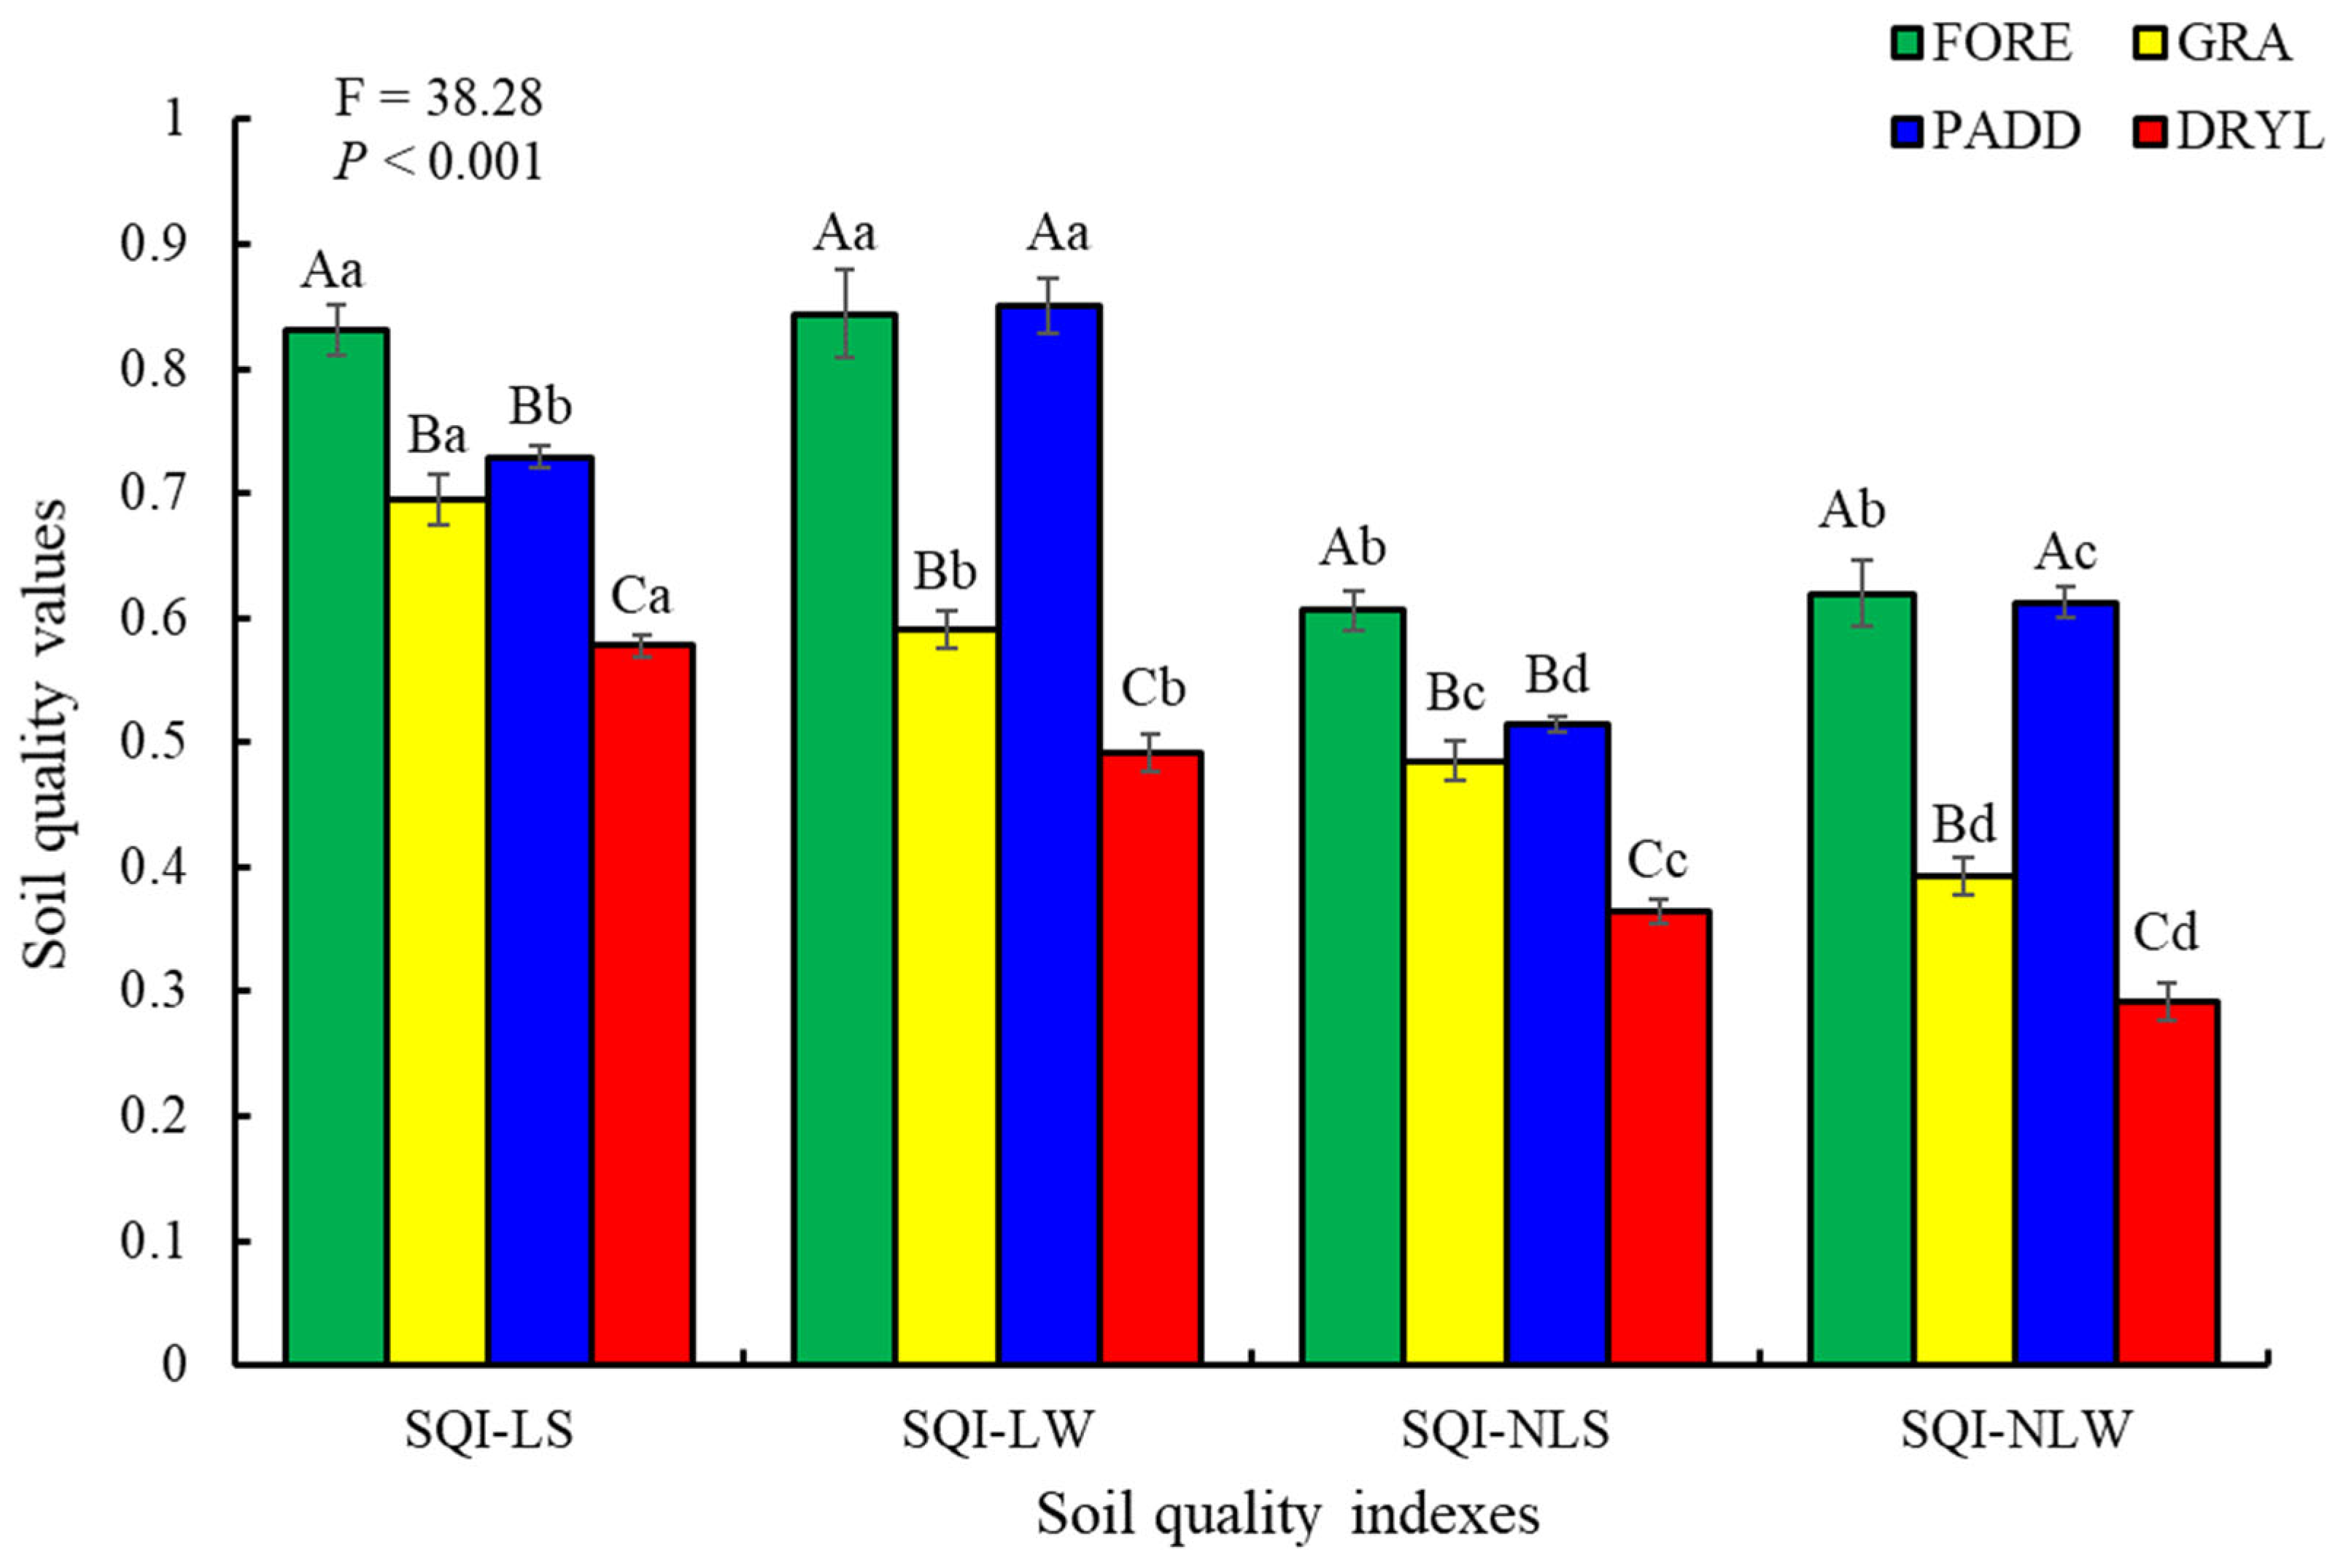
3.3. Soil Quality under Different Land Uses

The SQI values ranged from 0.58 to 0.83 for SQI-LS, from 0.49 to 0.84 for SQI-LW, from 0.36 to 0.61 for SQI-NLS, and from 0.29 to 0.62 for SQI-NLW (Figure 5). The average SQI values were significantly higher for SQI-LS (0.71) and SQI-LW (0.69) to SQI-NLS (0.49) and SQI-NLW (0.48). Land use types significantly affected the soil quality values based on the four established SQIs. Among the four land use types, the lowest SQI value was found under DRYL regardless of the SQIs. The SQI value under DRYL was significantly lower than that under GRA < FORE ≈ PADD. The highest SQI values for SQI-LS and SQI-NLS were both found under FORE, while the highest SQI value for SQI-LW was found under PADD. For the SQI-NLW, the SQI values under FORE and PADD were 0.62 and 0.61, respectively.

4. Discussion

4.1. Effect of Land Use Types on Soil Properties

Land use change had significant effects on soil property contents in different regions and nations [18,22]. Our results confirmed the findings that land use change in karst regions significantly changed the contents of different soil properties (Table 1). The highest content of MAC and lowest contents of MIC under FORE indicated that the FORE was beneficial to the formation of macroaggregates. This result was in agreement with the findings of Yu et al. in a similar study area of Southwest China [27]. Compared with other land uses, the high inputs from plant biomass to soils under FORE resulted in high SOC contents and provided sufficient cementing materials for the formation of soil macroaggregates. In addition, the higher human distributions under DRYL, PADD, and GRA than the FORE destroyed the soil macroaggregates, thus resulting in lower macroaggregate contents [28,29]. Previous studies reported that aggregate stability significantly correlated with soil structural stability and soil erosion resistance, and high aggregate stability often implied a strong ability to resist soil erosion [30]. The changes in aggregate stability indexes indicated that soil under DRYL was more susceptible to water erosion than that under FORE. The high MAC content was the main reason for the strong ability to resist erosion under FORE because the MAC was not easier to erosion than the fine soil practices [27].
The higher SOC content under FORE was because of the higher plant biomass inputs and lower human distributions compared with GRA and DRYL. This result was in agreement with reports by Yu et al. in karst regions and Zhong et al. in the Loess Plateau of China. Similar to the FORE, SOC content under PADD was significantly higher than that under GRA and DRYL (Table 1) [23,31]. Water in the PADD created an anaerobic environment and thus restricted the decomposition of SOC by soil microorganisms [30]. The reduction in decomposition of SOC resulted in high SOC content under PADD. The change trends of MACC, free MAOC, and SLC content were similar to the SOC content among these land uses. The MACC and SLC were usually considered as the labile carbon fractions, while the free MAOC was usually considered as the stable carbon fraction [23]. Although these soil carbon fractions had different carbon stability, they were all significantly correlated with the content of total SOC [32].
The results of the present study confirmed the finding that the application of nitrogen fertilizer in agricultural lands was an important reason for soil acidification [33]. The lower soil pH under DRYL, PADD, and GRA were mainly due to the fertilizer management in these agricultural lands because the farmers in the study area usually applied large amounts of urea and phosphate fertilizer to soils in order to obtain high yields. The fertilizer application was the main reason for the high soil TN and TP contents under PADD. This finding was in agreement with the reports of Liu et al. in Jiangxi Province, China, who also found that fertilizer application improved soil nutrient content [34]. The average C/N ratio in China was 14.4, according to the previous study [35]. Our results showed that the C/N ratio in the study area was similar to the average C/N ratio in China [36].

4.2. Evaluation of SQ Using Different Soil Quality Indexes

The PCA analysis was an effective method for reducing redundant information and selecting useful information. This method is commonly used for selecting the MDS for SQ assessment [2,18]. The cumulative variance of the chosen PCs exceeded 92%, which indicated that the two PCs could reflect the variability of the twelve soil properties, and they could be used to choose the key soil indicators in MDS. In our study, the soil indicators of SLC, MIC, and C/N were identified as members of MDS (Table 2). These soil indicators played a crucial role in soil function and ecosystem services and were commonly used as members of MDS for SQ assessment in various ecosystems [24,25,26]. Using an MDS to establish an SQI offered numerous advantages, including cost, labor, and resource savings compared to using the total data set of soil properties [24,37]. Consequently, many previous studies used the MDS to establish the SQI and assess the SQ changes under different land use management or specific regions [2,37].
The LSM and NLSM were two important scoring methods during the calculation of SQI, and they were usually used by previous studies to assess SQ [6,17]. The LSM was computationally simple, and it did not require an in-depth understanding of the soil indicator function in SQ. Although the NLSM was calculated complexly, it could better reflect the relationships between soil indicators and soil quality change compared to LSM [22]. Our results showed a significant positive correlation between the SQIs calculated using the LSM and those calculated using the NLSM, and the p values of the one-way ANOVA were all less than 0.001 (Figure 4 and Figure 5). These results revealed that both scoring methods were effective in evaluating the SQ in karst regions. However, the p values of the SQIs calculated using the NLSM were higher than those calculated using the LSM in this study. This suggested that the SQIs calculated with the NLSM demonstrated better differentiation among different land use types. Therefore, the NLSM was more suitable than the LSM for evaluating SQ in Southwest China. Our results confirmed the findings of Yu et al. in Northeast China and Teng et al. in south-central Guizhou Province of China because the NLSM required an in-depth knowledge of soil indicators functions in SQ [6,24].
In the simple additive model, the contributions of soil indicators to SQ were equal. In contrast, the contributions varied significantly in the weighted additive model. That is to say, the weighted additive model, in comparison to the simple additive model, emphasized the distinct roles of soil indicators in soul functions and SQ, aligning more closely with the realities of soil ecosystems [38]. The changes in SQ were typically constrained by a small number of crucial soil indicators, often just one or two key soil indicators, while the effects of other soil indicators on SQ were minimal [17]. The results of the present study confirmed the superiority of the weighted additive model in the SQ assessment. Although there was a significant correlation between the SQIs established by the simple additive model and those by the weighted additive model, the sensitivity indexes of the SQIs established by the weighted additive model were higher than the SQIs established by the simple additive model (Figure 2 and Figure 3). The elevated sensitivity indexes suggested that the SQIs established using the weighted additive model were more sensitive to the changes in SQ under different land uses in Southwest China.
Due to variations in soil types, vegetation, land use types, and climatic conditions, different regions may adopt distinct SQIs calculated using different scoring methods and additive models [6]. This study compared the effectiveness of four established SQIs in assessing SQ using various statistical analysis methods (Figure 2, Figure 3 and Figure 4). The significant correlations among the four SQIs and the similar change trends of SQ value among the four land use types indicated that all four establishing SQIs could be used to accurately evaluate the SQ in karst regions. Nevertheless, the highest sensitivity index values and F values from one-way ANOVA for SQI-NLW demonstrate that the SQI established using the NLSM and weighted additive model is the most effective tool for evaluating SQ changes in karst regions. This finding was consistent with the previous studies by Li and Wang on the wheat-maize rotation system in Hebei Province and by Teng et al. in south-central Guizhou Province of China [6,18]. However, the effectiveness of SQI-NLW in SQ evaluation should be further tested in different ecosystems and regions.
The analysis of the four SQIs indicated that FORE and PADD had higher SQ values compared to GRA and DRYL (Figure 5). The high SQ values under FORE corroborated the findings of Yu et al. in a similar study area [2]. In comparison to other land use types, forests had higher plant biomass than cropland, leading to increased SOC and SLC contents [28,39]. The increase in SLC content, a key soil indicator of SQ in MDS in this study, improved the SQ under FORE. Similarly, the higher SLC content was the primary factor contributing to the higher SQ values under PADD compared to GRA and DRYL. In addition to the anaerobic environment, the low land use intensity was also an important reason for the higher SLC and SOC content under PADD because the crop under PADD was grown only once a year, while the DRYL was grown two or three times a year [14]. The lowest SQI values were consistently observed under DRYL, primarily due to low SLC content and high MIC content. In DRYL, regular plowing breaks the macroaggregates, leading to increased MIC content and the loss of macroaggregate protection on SOC [2]. In addition, regular plowing also created a good habitat for the growth of microorganisms and enhanced the decomposition of SOC [40,41].
On the whole, the higher SOC content, soil aggregate stability, and soil nutrient contents under FORE and PADD indicated that the land uses of FORE and PADD were to benefit soil carbon sequestration and soil and water conservation in karst regions. The high SQ values under FORE and PADD represented that the soils under FORE and PADD were more conducive to sustainable regional development. Therefore, the land uses of FORE and PADD might be good choices for the local farmers and local government to restore the degraded ecosystems and prevent soil rock desertification in vulnerable karst regions.

5. Conclusions

Four SQIs were established using MDS with different scoring methods and additive models, and SQs under different land uses were assessed using four SQIs in the present study. Land use types significantly affected the 12 soil properties measured in this study. The values of MAC, GMD, MWD, soil pH, and free MAOC were highest under FORE, while the highest SOC, MACC, SLC, TN, and TP values were found under PADD. The high values of soil properties under FORE and PADD indicated that FORE and PADD were better than the other land uses in soil organic carbon sequestration and soil conversion in the study area. Three soil indicators, including SLC, C/N, and MIC, were chosen as members of MDS, and these three soil indicators should be used in future studies to evaluate the SQ evaluation in karst regions. Although the four establishing SQIs were significantly correlated with each other, the sensitivity index and the F value of one-way ANOVA of SQI-NLW were higher than that of other SQIs. These findings indicated that the SQI-NLW was better than other SQIs to evaluate the SQ under different land use types in karst regions. Therefore, the SQI was established using the NLSM, and the weighted additive model was suggested as a suitable SQI to assess SQ under different land use types in Southwest China. However, the SQI-NLW was likely to be soil- and site-specific as other SQIs used in the previous studies. Therefore, more studies were needed to test and verify the applicability and accuracy of SQ assessment in other ecosystems. The four SQIs all showed that the values of SQ under FORE and PADD were higher than that under GRA and DRYL, indicating that FORE and PADD might be the suitable land use types in karst regions to improve the SQ. Therefore, the land use types of FORE and PADD were suggested for the local residents to increase soil carbon sequestration and restore rock desertification, thereby improving the sustainable use of soil resources in karst regions. However, this study only compared the SQ under four land use types, and the SQ under other land uses (e.g., vegetable land, shrub land, and grassland) was unknown. Therefore, more land use types should be selected to assess the SQ changes in future studies.

Author Contributions

Conceptualization, L.M., H.S. and P.Y.; methodology, L.M., M.L., C.L., D.Z., Y.Y., K.J. and P.Y.; software, L.M., M.L., C.L., D.Z., Z.M., Y.Y. and P.Y.; validation, L.M., H.S., D.Z., Y.Y., K.J. and P.Y.; formal analysis, L.M., M.L. and K.J.; investigation, L.M., M.L., D.Z., Z.M., Y.Y. and K.J.; resources, L.M., D.Z. and Z.M.; data curation, L.M., H.S., C.L., Z.M., Y.Y. and P.Y.; writing—original draft preparation, L.M., H.S., K.J. and P.Y.; writing—review and editing, L.M. and P.Y.; visualization, L.M. and Z.M.; supervision, L.M., M.L. and C.L.; project administration, L.M., H.S. and C.L. All authors have read and agreed to the published version of the manuscript.

Funding

This research was funded by the Technological Innovation and Application Development Key Projects of Chongqing Municipality, China (grant No. CSTB2022TIAD-KPX0202), and the Natural Science Foundation of Chongqing (grant No. CSTB2022NSCQ-MSX1529, CSTB2022NSCQ-MSX1121, CSTB2022NSCQ-MSX0280).

Data Availability Statement

The data presented in this study are available on request from the corresponding author.

Conflicts of Interest

The authors declare no conflicts of interest.

Abbreviations

SQI, soil quality index; SQ, soil quality; PCA, principal component analysis; PC, principal component; SI, sensitivity index; MDS, minimum data set; WRB, world reference base; LSM, linear scoring method; NLSM, nonlinear scoring method; FORE, forest; GRA, grapefruit orchard; PADD, paddy; DRYL, dryland; MAC, macroaggregate; MIC, microaggregate; GMD, geometric mean diameter; MWD, mean weight diameter; SOC, soil organic carbon; MACC, macroaggregate-associated carbon; Free MAOC, free mineral-associated organic carbon; SLC, soil labile carbon; TN, total nitrogen; TP, total phosphorus; C/N, ratio of soil organic carbon and total nitrogen; C/P, ratio of soil organic carbon and total phosphorus; SQI-LE, soil quality index using linear and averaging method; SQI-NLE, soil quality index using nonlinear and averaging method; SQI-LA, soil quality index using linear and weighted method; SQI-NLA, soil quality index using nonlinear and weighted method.

References

  1. Fu, R.Y.; Dai, L.C.; Zhang, Z.H.; Hu, G. Community assembly along a successional chronosequence in the northern tropical karst mountains, South China. Plant Soil 2023, 491, 317–331. [Google Scholar] [CrossRef]
  2. Yu, P.J.; Liu, J.L.; Tang, H.Y.; Sun, X.Z.; Liu, S.W.; Tang, X.G.; Ding, Z.; Ma, M.G.; Ci, E. Establishing a soil quality index to evaluate soil quality after afforestation in a karst region of Southwest China. Catena 2023, 230, 107237. [Google Scholar] [CrossRef]
  3. Febles-Gonzalez, J.M.; Vega-Carreno, M.B.; Tolon-Becerra, A.; Lastra-Bravo, X. Assessment of soil erosion in karst regions of Havana, Cuba. Land Degrad. Dev. 2012, 23, 465–474. [Google Scholar] [CrossRef]
  4. Peng, J.; Jiang, H.; Liu, Q.H.; Green, S.M.; Quine, T.A.; Liu, H.Y.; Qiu, S.J.; Liu, Y.X.; Meersmans, J. Human activities vs. climate change: Distinguishing dominant drivers on LAI dynamics in karst region of southwest China. Sci. Total Environ. 2021, 769, 144297. [Google Scholar] [CrossRef] [PubMed]
  5. Li, D.J.; Wen, L.; Xiao, K.C.; Song, T.Q.; Wang, K.L. Responses of soil gross nitrogen transformations to three vegetation restoration strategies in a subtropical karst region. Land Degrad. Dev. 2021, 32, 2520–2527. [Google Scholar] [CrossRef]
  6. Teng, L.D.; Jiang, G.H.; Ding, Z.L.; Wang, Y.; Liang, T.B.; Zhang, J.Z.; Dai, H.X.; Cao, F.B. Evaluation of tobacco-planting soil quality using multiple distinct scoring methods and soil quality indices. J. Clean. Prod. 2024, 441, 140883. [Google Scholar] [CrossRef]
  7. Yu, P.J.; Han, K.X.; Li, Q.; Zhou, D.W. Soil organic carbon fractions are affected by different land uses in an agro-pastoral transitional zone in Northeastern China. Ecol. Indic. 2017, 73, 331–337. [Google Scholar] [CrossRef]
  8. Alaboz, P.; Odabas, M.S.; Dengiz, O. Soil quality assessment based on machine learning approach for cultivated lands in semi-humid environmental condition part of Black Sea region. Arch. Agron. Soil Sci. 2023, 69, 3514–3532. [Google Scholar] [CrossRef]
  9. Özkan, B.; Dengiz, O.; Alaboz, P.; Kaya, N.S. A new hybrid approach to assessing soil quality using neutrosophic fuzzy-AHP and support vector machine algorithm in sub-humid ecosystem. J. Mt. Sci. 2023, 20, 3186–3202. [Google Scholar] [CrossRef]
  10. Karaca, S.; Dengiz, O.; Turan, İ.D.; Özkan, B.; Dedeoğlu, M.; Gülser, F.; Sargin, B.; Demirkaya, S.; Ay, A. An assessment of pasture soils quality based on multi-indicator weighting approaches in semi-arid ecosystem. Ecol. Indic. 2021, 121, 107001. [Google Scholar] [CrossRef]
  11. Dengiz, O.; Turan, D. Soil quality assessment for desertification based on multi-indicators with the best-worst method in a semi-arid ecosystem. J. Arid Land 2023, 15, 779–796. [Google Scholar] [CrossRef]
  12. Khasi, Z.; Askari, M.S.; Amanifar, S.; Moravei, K. Assessing soil structural quality as an indicator of productivity under semi-arid climate. Soil Tillage Res. 2024, 236, 105945. [Google Scholar] [CrossRef]
  13. Zahedifar, M. Assessing alteration of soil quality, degradation, and resistance indices under different land uses through network and factor analysis. Catena 2023, 222, 106807. [Google Scholar] [CrossRef]
  14. Yang, E.J.; Zhao, X.L.; Qin, W.; Jian, J.; Han, J.Q.; Zhang, M. Temporal impacts of dryland-to-paddy conversion on soil quality in the typical black soil region of China: Establishing the minimum data set. Catena 2023, 231, 107303. [Google Scholar] [CrossRef]
  15. Negis, H.; Seker, C.; Gumus, I.; Erci, V. Establishment of a minimum dataset and soil quality assessment for multiple reclaimed areas on a wind-eroded region. Catena 2023, 229, 107208. [Google Scholar] [CrossRef]
  16. Ferretti, G.; Rosinger, C.; Diaz-Pines, E.; Faccini, B.; Coltorti, M.; Keiblinger, K.M. Soil quality increases with long-term chabazite-zeolite tuff amendments in arable and perennial cropping systems. J. Environ. Manag. 2024, 354, 120303. [Google Scholar] [CrossRef]
  17. Damiba, W.A.; Gathenya, J.M.; Raude, J.M.; Home, P.G. Soil quality index (SQI) for evaluating the sustainability status of Kakia-Esamburmbur catchment under three different land use types in Narok County, Kenya. Heliyon 2024, 10, e25611. [Google Scholar] [CrossRef]
  18. Wang, Z.; Jia, L.; Yang, L.; Guo, Z.; Sang, W.; Lu, L.; Xiao, C. Assessment of the effects of fencing enclosure on soil quality based on minimum data set in Biru County of the Qinghai–Tibet Plateau, China. Agronomy 2023, 13, 1558. [Google Scholar] [CrossRef]
  19. Gabhane, V.V.; Ramteke, P.; Chary, G.R.; Patode, R.S.; Ganvir, M.M.; Chorey, A.; Tupe, A.R. Effects of long-term nutrient management in semi-arid Vertisols on soil quality and crop productivity in a cotton-greengram intercropping system. Field Crops Res. 2023, 303, 109115. [Google Scholar] [CrossRef]
  20. Nasir, M.J.; Haider, M.F.; Ali, Z.; Akhtar, W.; Alam, S. Evaluation of soil quality through simple additive soil quality index (SQI) of Tehsil Charsadda, Khyber Pakhtunkhwa, Pakistan. J. Saudi Soc. Agric. Sci. 2024, 23, 42–54. [Google Scholar]
  21. Bravo-Medina, C.; Goyes-Vera, F.; Arteaga-Crespo, Y.; Garcia-Quintana, Y.; Changoluisa, D. A soil quality index for seven productive landscapes in the Andean-Amazonian foothills of Ecuador. Land Degrad. Dev. 2021, 32, 2226–2241. [Google Scholar] [CrossRef]
  22. Okolo, C.; Gebresamuel, G.; Zenebe, A.; Haile, M.; Eze, P.N. Accumulation of carbon in various soil aggregate sizes under different land use systems in a semi-arid environment. Agric. Ecosyst. Environ. 2020, 297, 106924. [Google Scholar] [CrossRef]
  23. Yu, P.J.; Li, Y.X.; Liu, S.W.; Liu, J.L.; Ding, Z.; Ma, M.G.; Tang, X.G. Afforestation influences soil organic carbon and its fractions associated with aggregates in a karst region of Southwest China. Sci. Total Environ. 2022, 814, 152710. [Google Scholar] [CrossRef] [PubMed]
  24. Yu, P.J.; Liu, S.W.; Zhang, L.; Li, Q.; Zhou, D.W. Selecting the minimum data set and quantitative soil quality indexing of alkaline soils under different land uses in northeastern China. Sci. Total Environ. 2018, 616–617, 564–571. [Google Scholar] [CrossRef] [PubMed]
  25. Li, F.F.; Zhang, X.S.; Zhao, Y.; Song, M.J.; Liang, J. Soil quality assessment of reclaimed land in the urban-rural fringe. Catena 2023, 220, 106692. [Google Scholar] [CrossRef]
  26. Mamehpour, N.; Rezapour, S.; Ghaemian, N. Quantitative assessment of soil quality indices for urban croplands in a calcareous semi-arid ecosystem. Geoderma 2021, 382, 114781. [Google Scholar] [CrossRef]
  27. Yu, P.J.; Liu, J.L.; Tang, H.Y.; Ci, E.; Tang, X.G.; Liu, S.W.; Ding, Z.; Ma, M.G. The increased soil aggregate stability and aggregate-associated carbon by farmland use change in a karst region of Southwest China. Catena 2023, 231, 107284. [Google Scholar] [CrossRef]
  28. Bhatt, R.; Singh, P.; Sharma, S. Changes in soil organic pool and carbon preservation capacity of macro- and micro-aggregates in response to land use change in North-Western India. J. Soil Sci. Plant Nutr. 2023, 23, 2849–2867. [Google Scholar] [CrossRef]
  29. Vasilchenko, A.V.; Galaktionova, L.V.; Tretyakov, N.Y.; Dyachkov, S.M.; Vasilchenko, A.S. Impact of agricultural land use on distribution of microbial biomass and activity within soil aggregates. Soil Use Manag. 2023, 39, 618–633. [Google Scholar] [CrossRef]
  30. Han, C.; Song, M.X.; Tang, Q.; Wei, J.; He, X.B.; Collins, A.L. Post-farming land restoration schemes exhibit higher soil aggregate stability and organic carbon: Evidence in the Three Gorges Reservoir Area, China. Catena 2023, 227, 107099. [Google Scholar] [CrossRef]
  31. Zhong, Z.K.; Wu, S.J.; Lu, X.Q.; Ren, Z.X.; Wu, Q.M.; Xu, M.P.; Ren, C.J.; Yang, G.H.; Han, X.H. Organic carbon, nitrogen accumulation, and soil aggregate dynamics as affected by vegetation restoration patterns in the Loess Plateau of China. Catena 2021, 196, 104867. [Google Scholar] [CrossRef]
  32. Chen, Y.; Han, M.G.; Yuan, X.; Zhou, H.K.; Zhao, X.Q.; Schimel, J.P.; Zhu, B. Long-term warming reduces surface soil organic carbon by reducing mineral-associated carbon rather than “free” particulate carbon. Soil Biol. Biochem. 2023, 177, 108905. [Google Scholar] [CrossRef]
  33. Lin, S.X.; Liu, Z.J.; Wang, Y.C.; Li, J.Y.; Wang, G.G.; Zhang, W.; Wang, H.B.; He, H.B. Soil acidification associated with changes in inorganic forms of N reduces the yield of tea (Camellia sinensis). Arch. Agron. Soil Sci. 2023, 69, 1660–1673. [Google Scholar] [CrossRef]
  34. Liu, J.A.; Shu, A.P.; Song, W.F.; Shi, W.C.; Li, M.C.; Zhang, W.X.; Li, Z.Z.; Liu, G.R.; Yuan, F.S.; Zhang, S.X.; et al. Long-term organic fertilizer substitution increases rice yield by improving soil properties and regulating soil bacteria. Geoderma 2021, 404, 115287. [Google Scholar] [CrossRef]
  35. Yu, P.J.; Liu, S.W.; Xu, Q.; Fan, G.H.; Huang, Y.X.; Zhou, D.W. Response of soil nutrients and stoichiometric ratios to short-term land use conversions in a salt-affected region, northeastern China. Ecol. Eng. 2019, 129, 22–28. [Google Scholar] [CrossRef]
  36. Zhao, F.Z.; Kang, D.; Han, X.H.; Yang, G.H.; Feng, Y.Z.; Ren, G.X. Soil stoichiometry and carbon storage in long-term afforestation soil affected by understory vegetation diversity. Ecol. Eng. 2015, 74, 415–422. [Google Scholar] [CrossRef]
  37. Liu, S.B.; Li, F.D.; Zhang, Q.Y.; Li, Z.; Tian, C.; Qiao, Y.F.; Du, K.; Cheng, H.F.; Chen, G.; Li, X.Y. Soil quality improvement with increasing reclamation years in the Yellow River Delta. Agronomy 2023, 13, 2576. [Google Scholar] [CrossRef]
  38. Aranguren, R.; Canon, J. Assessing differential land use impacts on soil quality: A method based on log-response ratios and polygonal projections. J. Environ. Manag. 2023, 348, 119442. [Google Scholar] [CrossRef] [PubMed]
  39. Iskandar, I.; Suryaningtyas, D.T.; Baskoro, D.P.T.; Budi, S.W.; Gozali, I.; Saridi, S.; Masyhuri, M.; Dultz, S. The regulatory role of mine soil properties in the growth of revegetation plants in the post-mine landscape of East Kalimantan. Ecol. Indic. 2022, 139, 108877. [Google Scholar] [CrossRef]
  40. Dong, X.D.; Yang, L.Y.; Harbo, L.S.; Yan, X.Y.; Chen, J.; Zhao, C.C.; Xiao, Y.T.; Liu, H.; Wang, S.L.; Miao, Y.; et al. Effects of land use on soil microbial community structure and diversity in the Yellow River floodplain. J. Plant Ecol. 2023, 16, rtac075. [Google Scholar] [CrossRef]
  41. Sahu, C.; Mishra, R.; Basti, S. Land use change affects carbon storage and lability in tropical soil of India. Geoderma Reg. 2023, 32, e00621. [Google Scholar] [CrossRef]
Figure 1. The map of the study area and sampling sites.
Agronomy 14 00882 g001
Figure 2. The Pearson correlation matrix for the selected soil indicators. MAC, macroaggregate; MIC, microaggregate; GMD, geometric mean diameter; MWD, mean weight diameter; SOC, soil organic carbon; MACC, macroaggregate-associated carbon; Free MAOC, free mineral-associated organic carbon; SLC, soil labile carbon; TN, total nitrogen; TP, total phosphorus; C/N, ratio of soil organic carbon and total nitrogen. *** p < 0.001, ** p < 0.01, * p < 0.05.
Agronomy 14 00882 g002
Figure 3. The sensitivity index (SI) of different soil quality index. SQI-LS, linear and simple additive soil quality index; SQI-LW, linear and weighted additive soil quality index; SQI-NLS, the nonlinear and simple additive soil quality index; and SQI-NLW, nonlinear and weighted additive soil quality index.
Agronomy 14 00882 g003
Figure 4. The Pearson correlation matrix for the soil quality indexes. SQI-LS, linear and simple additive soil quality index; SQI-LW, linear and weighted additive soil quality index; SQI-NLS, the nonlinear and simple additive soil quality index; and SQI-NLW, nonlinear and weighted additive soil quality index. *** p < 0.001.
Agronomy 14 00882 g004
Figure 5. The soil quality values under different land use types. Different capital letters within the same soil quality index and lowercase letters within land use types indicate significant differences (LSD test, p < 0.05). FORE, forest; GRA, grapefruit orchard; PADD, paddy; DRYL, dryland; SQI-LE, soil quality index using linear and averaging method; SQI-NLE, soil quality index using the nonlinear and averaging method; SQI-LA, soil quality index using the linear and weighted method; SQI-NLA, soil quality index using the nonlinear and weighted method.
Agronomy 14 00882 g005
Table 1. The measured soil indicators under the four land use types.
Soil IndicatorsFORGRAPADDDRYLANOVA
Fp
MAC63.32 ± 1.69 A52.38 ± 3.25 B47.77 ± 0.49 B23.42 ± 1.77 C67.62<0.001 ***
MIC22.79 ± 1.37 D28.77 ± 1.11 C33.17 ± 0.59 B43.00 ± 0.42 A80.32<0.001 ***
GMD0.73 ± 0.04 A0.50 ± 0.07 B0.43 ± 0.01 B0.17 ± 0.01 C31.65<0.001 ***
MWD1.70 ± 0.04 A1.42 ± 0.08 B1.31 ± 0.01 B0.69 ± 0.05 C64.28<0.001 ***
Soil pH7.27 ± 0.06 A6.33 ± 0.12 B6.30 ± 0.08 B5.46 ± 0.05 C82.87<0.001 ***
SOC31.55 ± 1.07 A26.76 ± 0.29 B32.94 ± 0.27 A26.89 ± 0.20 B29.89<0.001 ***
MACC33.61 ± 1.52 A27.02 ± 0.37 B34.96 ± 0.34 A29.11 ± 0.17 B21.56<0.001 ***
Free MAOC27.54 ± 0.51 A25.81 ± 0.23 B27.37 ± 0.26 A25.18 ± 0.22 B12.570.001 **
SLC5.73 ± 0.36 A3.32 ± 0.13 B6.44 ± 0.22 A2.79 ± 0.14 B59.02<0.001 ***
TN2.15 ± 0.14 B1.57 ± 0.08 C2.73 ± 0.06 A1.66 ± 0.03 C36.90<0.001 ***
TP0.54 ± 0.03 B0.49 ± 0.03 B0.67 ± 0.05 A0.49 ± 0.01 B7.340.005 **
C/N14.74 ± 0.53 B17.16 ± 0.69 A12.09 ± 0.24 C16.17 ± 0.24 AB22.13<0.001 ***
C/P58.74 ± 2.22 A54.90 ± 2.88 AB49.74 ± 3.21 B55.14 ± 1.39 AB2.150.147
Note: Different capital letters within land use types indicate significant differences (LSD test, p < 0.05). FORE, forest; GRA, grapefruit orchard; PADD, paddy; DRYL, dryland; MAC, macroaggregate; MIC, microaggregate; GMD, geometric mean diameter; MWD, mean weight diameter; SOC, soil organic carbon; MACC, macroaggregate-associated carbon; Free MAOC, free mineral-associated organic carbon; SLC, soil labile carbon; TN, total nitrogen; TP, total phosphorus; C/N, ratio of soil organic carbon and total nitrogen; C/P, ratio of soil organic carbon and total phosphorus. *** p < 0.001, ** p < 0.01.
Table 2. The results of PCA analysis.
Soil IndicatorsPC1PC2
MAC0.770.62
MIC−0.720.68
GMD0.730.67
MWD0.770.62
Soil pH0.780.52
SOC0.91−0.38
MACC0.82−0.49
Free MAOC0.91−0.02
SLC0.95−0.26
TN0.80−0.58
TP0.64−0.58
C/N−0.710.68
Eigenvalue7.643.52
Variance63.6329.34
Cumulative63.6392.97
Note: PC, principal component. Boldface values were the highly weighted loading values. Soil indicators with boldface and italics values were selected as the minimum data set. See Table 1 for abbreviations.
Disclaimer/Publisher’s Note: The statements, opinions and data contained in all publications are solely those of the individual author(s) and contributor(s) and not of MDPI and/or the editor(s). MDPI and/or the editor(s) disclaim responsibility for any injury to people or property resulting from any ideas, methods, instructions or products referred to in the content.

