Article

Effects of Straw Amendment in Combination with Synthetic N Fertilizer Addition on N2O, N2, and Their Stoichiometric Ratios in Three Different Agro-Ecosystems

1
Key Laboratory of Agricultural Water Resources, Hebei Key Laboratory of Soil Ecology, Center for Agricultural Resources Research, Institute of Genetics and Developmental Biology, Chinese Academy of Sciences, 286 Huaizhong Road, Shijiazhuang 050021, China
2
University of Chinese Academy of Sciences, 19A Yuquan Road, Beijing 100049, China
*
Authors to whom correspondence should be addressed.
Agronomy 2024, 14(5), 887; https://doi.org/10.3390/agronomy14050887
Submission received: 22 March 2024 / Revised: 21 April 2024 / Accepted: 22 April 2024 / Published: 24 April 2024
(This article belongs to the Section Agroecology Innovation: Achieving System Resilience)

Abstract

:
Nitrogen (N) fertilizer and crop residue amendments are important agricultural practices that could increase soil health, fertility, and crop yield. Such practices may also change soil denitrification processes where contradictory observations have been reported on soil N2O emissions with fewer studies on N2 emissions due to its large atmospheric background concentrations limiting its soil-borne measurement. This study aims to investigate N2O production and reduction of N2 emissions under a conducive denitrifying environment (like anaerobic microsites, 80% WFPS, available N and C) after rice straw amendment and KNO3 application to three different soil types (fluvo-aquic, black, and paddy soils). In this regard, three treatments for three different soil types were set consisting of (a) a non-amended treatment (control), (b) a KNO3 treatment (KNO3, 20 mM KNO3), and (c) a straw plus KNO3 treatment (2.5 g rice straw kg−1 dry soil and 20 mM KNO3), which were incubated under 80% WFPS. Moreover, direct N2O and N2 fluxes were measured over 17 days in the current incubation experiment with a robotized incubation system using a helium atmosphere. Results showed that rice straw amendment combined with N fertilizer increased both N2O and N2 fluxes compared with control or KNO3 treatments in all three soil types. Overall, compared with the black and paddy soils, the N2O and N2 fluxes were higher in the fluvo-aquic soil, with a maximum of 234.2 ± 6.3 and 590.1 ± 27.3 g N ha−1 from F_SK treatment, respectively, during the incubation period. The general trends in three soil types of both N2O and N2 emissions were control < KNO3 < rice straw plus KNO3 treatments. Straw amendment in combination with KNO3 can stimulate a high denitrification rate (less N2O and higher N2), whereas their effect on stoichiometric ratios of N2O/(N2O + N2) highly depends on soil nitrate concentration, oxygen level, soil moisture content, and labile C. The current study underscores that the rice straw amendment in combination with N fertilizer can trigger denitrification with less increment on soil N2O but higher N2 emissions under conditions favoring denitrification.

1. Introduction

Nitrogen (N) is an important agricultural macronutrient for plant growth and a yield-limiting nutrient in agricultural production [1], and its remarkable contributions to food production worldwide to enhance food security are highly recognized. Since the discovery of the Haber–Bosch process in the early 20th century, whereby atmospheric dinitrogen (N2) is artificially fixed for the production of synthetic N fertilizer, the consumption of global synthetic N increased mainly over the last five decades (1961–2020) from 11.5 to 113.3 Tg (teragram = 1012 g) N year−1 [2]. This artificial N fixation has converted a substantial amount of unreactive dinitrogen (N2) to reactive N forms, allowing farmers to change infertile croplands to fertile croplands [3]. However, a high and uncontrolled supply of N into agricultural soil with reduced N use efficiency (NUE) pollutes the environment through air pollution, eutrophication in water bodies, and depletion of the ozone layer in the stratosphere causing global warming [4,5].
Agricultural soils are one of the major anthropogenic sources of N2O emissions to the atmosphere, mainly due to the related intensive management practices including fertilization, irrigation, and residue incorporation [6,7,8]. Fertilized agricultural soils are estimated to emit 4.1 Tg N2O annually [9], which makes it a significant anthropogenic source of N2O emissions. The growing evidence has shown that soil N2O production mainly results from nitrification and denitrification processes where denitrification is considered the main biological process [5,10,11,12]. Denitrification is a reduction process of nitrate (NO3) and nitrite (NO2− through nitric oxide (NO) and N2O to N2 [13,14,15], enabling the removal of accumulated reactive N in the biosphere [16]. Previous literature studies reported high uncertainties concerning the quantification of how much reactive N is converted back into N2 via denitrification due to the lack of accurate or unbiased N2 measurement techniques against high atmospheric N2 background [17,18]. Since, N is one of the macronutrient limiting factors for crop growth [19], increasing rates of N fertilizer applications will also increase N2O and N2 losses from agricultural soil [20]. Moreover, complete denitrification is a main environmentally useful pathway for converting reactive N into stable molecules of N2 emissions. However, N2O measured simultaneously with N2 after the addition of N fertilizer and rice straw amendment has not been well documented in agricultural soils. Therefore, the present study will shed more light on denitrification losses (N2O and N2 emissions) when synthetic N fertilizer is concomitantly applied with rice straw in agricultural soils.
Straw return is generally considered an effective practice to improve soil health, soil quality, and crop yield [8,21]. In China, it has been highly encouraged to return crop straws due to the prohibition of burning them [21,22]. Therefore, crop straw return should be highly considered as an important agricultural practice to better utilize resources and protect the environment. Previous literature reported that agricultural soils amended with straw receive labile carbon (C) and N together with other micronutrients where microbial growth and activity are also stimulated due to high SOC enhancement [8,23]. This microbial growth and activity stimulation due to straw return are also beneficial for enhancing the complete denitrification process. In the meta-analysis, Liu et al. [24] reported that straw return has been widely recommended as an environmentally friendly practice to manage carbon sequestration in agricultural ecosystems. Chen et al. [25], in their research work about soil fertility and crop performance in winter wheat–summer maize crop rotation, reported that returning only wheat straw and removing maize straw would maintain improved soil nutrient contents. Straw amendment can stimulate denitrification by providing organic C as the energy source for microbial respiration, which also enhances anaerobic conditions, hence denitrification. However, contradictory observations concerning denitrification have been reported, showing positive or negative effects of straw amendment in combination with N fertilizer on N2O emissions [21,26,27,28,29], while the final denitrification product has not been included in the studies. For example, Zhou et al. [29] reported a 150% increase in N2O emissions in 2010 and a 35% decrease in 2011 in the maize season from the same field. Yao et al. [30] reported that straw return can stimulate N2O emissions by providing bioavailable C and N to soil denitrifiers, while Zhou et al. [31] indicated that straw return may inhibit N2O emissions by increasing the N2/N2O ratio during denitrification and may also enhance biological N fixation. Bai et al. [21], after a two-year study of straw amendment combined with different N fertilizers, concluded that straw return is an environmentally friendly, high-crop-yielding, high-economic-benefit, and low-N2O-emission production technology for arid and semiarid areas. Previous studies have reported that N2O emissions from soils can be lowered under conditions favoring N2O reduction to N2 [8,32,33]; however, it is still not clear to what extent straw amendment combined with N fertilizer would affect both production and reduction rate of N2O. Interactive effects of straw amendment combined with N fertilizer under a controlled conducive denitrifying environment will help us better understand the environmental benefits of straw management and develop specific management practices to mitigate N2O emission.
Our current study will help us understand the influence of straw amendment combined with N fertilizer addition to N2O and N2 emissions. In general, the incorporation of crop residue may affect soil temperature and moisture, soil N content, DOC content, and microbial activity, thus regulating soil N2O and N2 emissions in a complex manner [8,34,35]. The helium direct measurement method is advantageous since it does not change soil properties by adding extra substrates such as 15N-labeled substrates or C2H2 in the 15N isotope labeling method and C2H2 inhibition technique, respectively [36]. Predominantly, straws from rice, corn, and wheat have been reported to account for 90% of the total straw production in China [37], which is why—and also due to its high C/N ratio—rice straw was selected to be used in the current study. The main objectives of the current study are as follows: (a) to assess the influence of straw amendment in combination with synthetic N fertilizer addition on N2O and N2 emissions; (b) to explore the main bacterial community composition stimulated by the rice straw amendment combined with synthetic N fertilizer addition, hence affecting N2O production and its reduction to N2.

2. Materials and Methods

2.1. Experimental Sites

In the current study, the three soil types sampled from different fields were known as two upland soils and one paddy soil. Soil samples collected were as follows: upland soil samples collected from long-term summer maize–winter wheat crop rotation (fluvo-aquic soil), upland black soil samples from summer maize monocropping (black soil), and paddy soil samples from rice monocropping (paddy soil).
Fluvo-aquic soil samples were collected from the Luanchenghe agro-ecosystem experimental station in Hebei Province, China (37°53′ N, 114°41′ E, 50 m). The soil category in this region is known as a silt loam Haplic Cambisol [38] with a temperate semiarid typical monsoon climate. The yearly average precipitation and temperature are 540 mm and 12.7 °C, respectively. This soil type received synthetic annual N fertilizer of 200 kg ha−1.
Black soil samples were collected from Gongzhuling, Jilin Province, China (43°510′ N, 124°820′ E, 300 m). The soil category in this region is known as a Haplic Chernozem with a mollic horizon [38,39] with a cool temperate, subhumid continental monsoon climate. The yearly average precipitation is around 614 mm, where 75% occurs mainly in the summer season (June–September). The average yearly temperature is 6.9 °C, with monthly average temperatures ranging from −13.5 °C in January to 23.7 °C in July. The black soil in northeastern China is one of the dominant soils and it represents an important maize cultivation area in China, significantly contributing to the national maize production. This soil type also received synthetic annual N fertilizer of 200 kg ha−1.
Paddy soil samples were collected from Hubei Province, China (31°10′ N, 114°58′ E). This rice riparian of the southeast region belongs to the middle and lower reaches of the Yangtze River with a long history of rice cultivation. This study area is characterized by a typical subtropical monsoon climate with a mean annual temperature of 16.8 °C, and a mean annual rainfall of 1258 mm, of which 60–70% occurs during the summer. This soil type also received synthetic annual N fertilizer of 200 kg ha−1. The paddy soil in this region is classified as Lixisols [38,39].

2.2. Measurement of Soil Parameters

The topsoil samples were collected from 0–20 cm from the three different soil types mentioned above with respect to three replicates for each soil type in 2022. Soil samples for each soil type were divided into three parts: one part was stored at −20 °C for total microbial population analysis; the second part was stored at 4 °C for the determination of soil physicochemical properties, including soil ammonium (NH4+-N), nitrate (NO3-N), dissolved organic carbon (DOC), and soil pH; and the third part was air-dried at room temperature to determine soil total nitrogen (TN) and total carbon (TC) concentrations.
NH4+ and NO3 were extracted by shaking for 1 h a mixture of 10 g of fresh soil with 50 mL of 1 mol L−1 KCl solution. Then, the soil extracts were filtered using Whatman 42 filter paper, and NH4+ and NO3 concentrations were measured using a Smartchem 140 automatic analyzer and dual wavelength ultraviolet spectrophotometer, respectively [5,40]. Soil-dissolved organic carbon (DOC) was extracted by mixing 10 g of fresh soil cores with 50 mL of deionized water. Soil extracts were centrifugated for 10 min at 8000 rpm and the mixture was finally filtered and determined by Liqui TOCII analyzer (Elementar, Hanau, Germany) [41]. Soil TC and TN were measured after the soil was air-dried and ground by an elemental analyzer (Vario MAX; Elementar, Hanau, Germany). The soil water content (%) was gravimetrically measured by drying the soil at 105 ± 0.05 °C for 24 h and, then, by soil water-filled pore space (WFPS, %) calculations based on [41]. After the onset treatments of the incubation period, soil moisture was adjusted for all soil samples of all three soil types because soil samples were air-dried prior to the incubation period. Table 1 summarizes the soil properties of three soil types used in the current study.

2.3. Incubation Experiment for Soil Gas Measurements

This study consisted of three different treatments with three different soil types. Incubation procedures began after soil samples were air-dried and sieved through a 2 mm mesh to remove plant residue and other impurities in the laboratory. For each soil type, there were controls and treatments (KNO3 only and KNO3 with straw) with three replicates. Prior to incubation, each soil type was preincubated for two days at around 45% WFPS to stabilize the microbial activity and eliminate the effect of drying soil. The experimental design for fluvo-aquic soil (F), black soil (B), and paddy soil (P) samples consisted of three treatments (n = 3) each: (a) a non-amended treatment (control); (b) KNO3 treatment; and (c) a straw plus KNO3 treatment. In total, we had 27 replicates for gas measurements only. In detail, all treatments were designed as follows: for fluvo-aquic (F): F_CK, F_K, and F_SK; for black soil: B_CK, B_K, and B_SK and for paddy soil (P): P_CK, P_K, and P_SK).
Oven-dried rice straw was ground through a 2 mm mesh sieve with 0.7% of total N and 45% of total C. During the incubation time, the straw was mixed into the preincubated soils in the straw and straw plus KNO3 treatments at a rate of 2.5 g straw per kg of dry soil. Then, the soil was packed into 30 g in each 120 mL serum flask. In the current study, N fertilizer was applied in the form of KNO3. Therefore, KNO3 was used as the N source to avoid other significant contributions of N2O emitting processes during the experiment. The soils were then flooded with 20 mM KNO3 solution in the KNO3 and straw plus KNO3 treatments (KNO3 and KNO3 plus straw treatments: equivalent to 112 mg of NO3-N per kg soil addition) or distilled water in the control and drained to approximately 80% WFPS by weighing the soil to keep the weight constant. The room temperature was set to 21 °C throughout the whole incubation period.
The serum flasks were then closed with butyl rubber and aluminum caps. Furthermore, these serum flasks were flushed with pure helium (99.99%) four times to make the headspace environment free from N2 and oxygen (O2 < 450 ppm). In each treatment, 3 replicated serum flasks were used for measuring the concentration of accumulated N2O and N2 gases 3 times every day during the incubation period of 17 days. The cumulative concentrations of N2O and N2 in the serum flasks were measured every 24 h using a robotized sampling and analysis system, which consisted of an autosampler, a peristaltic pump, and a gas chromatograph (GC, Agilent 7890A; Santa Clara, CA, USA). The N2O concentrations were analyzed using an electron capture detector while N2 concentrations were also analyzed using a thermal conductivity detector. Therefore, direct N2O and N2 fluxes were measured over 17 days in the current incubation experiment with a robotized incubation system using a helium atmosphere. The system details and the gas concentration computations were described previously [42]. Cumulative N2O and N2 emissions were calculated by linear interpolation between measured fluxes.

2.4. DNA Extraction and 16s rRNA Sequencing

For determining the denitrifying bacterial community, original soil samples were collected and stored at 20 °C before air-drying other portions of soil samples while incubated soil samples were collected at the end of the incubation experiment. DNA extraction for soil samples was performed using FastDNA Spin Kit for Soil (MP Biomedicals, Santa Ana, CA, USA) per the manufacturer’s instructions. Soil total DNA was extracted from 0.5 g of soil using FastDNA Spin Kit for Soil (MP Biomedicals, USA) per the manufacturer’s instructions with little modifications. The gDNA was checked for quantity and quality using a Nanodrop one spectrophotometer (NanoDrop, Thermo Fisher Scientific, Madison, WI, USA) and gel agarose electrophoresis, respectively. The DNA samples were then sent for 16s rRNA gene sequence at Personalbio Laboratories, Shanghai, China.
For 16s rRNA sequencing, the V3-V4 region of the bacterial 16S rRNA gene was amplified using primer sets 1369F, (5′-CGGTGAATACGTT CYCGG-3′) and 1492R, (5′-GGWTACCTTGTTACGACTT-3′) to investigate the bacterial community diversity and structure using high throughput sequencing technology. The main aim of the study was to analyze the denitrification rate and its product stoichiometry in this intensively managed soil type where nitrate was the major inorganic N form.

2.5. Statistical Analysis

To compare cumulative N2O and N2 emissions among treatments for each soil type and the three soil types, we performed a one-way ANOVA with Turkey’s test. The difference was considered significant when p < 0.05. All figures and statistical tests were conducted using Origin Pro8 software.

3. Results

3.1. Soil Mineral N Variables from the Three Soil Types

In straw plus N fertilized (KNO3) treatments for all three soil types, final NO3 concentrations were below 2 mg NO3-N per kg, while in control and KNO3 treatments for all three soil types, the concentrations were below 5 and 16 mg NO3-N per kg, respectively (Table 2). At the end of the incubation period, the order of soil NO3 concentrations was observed following the trend below: KNO3 > Control > Straw plus KNO3. Overall, in the three soil types, the soil NO3 concentrations were more depleted in straw plus KNO3, at more than 99%. Final soil NH4+ concentrations were low in all treatments for all three soil types with values ranging between 1 to 3 mg N per kg (Table 2) and they were slightly higher than initial concentrations.

3.2. Temporal Emissions of N2O and N2 Emissions from Three Different Soil Types

The N2O emissions increased in all treatments of the three soil types (fluvo-aquic, black, and paddy soils) shortly after KNO3 was applied to each soil core, especially in the fluvo-aquic soil treatments (Figure 1). Comparing all fertilized KNO3 plus straw amendment treatments from the three different soil types to unfertilized treatments, without straw amendment, the fertilized KNO3 with straw amendment greatly enhanced N2O emissions (Figure 1). Generally, N2O emissions were the highest from SK treatments and lowest from CK treatments in all three soil types. Compared with the paddy soil and black soils, the N2O flux was higher in the fluvo-aquic soil, with a maximum of 27.3 ± 3 g N ha−1 day−1 from F_SK treatment. The average values of N2O emissions were 4.3 ± 0.4, 9.7 ± 1.2, and 13.8 ± 1.2 g N ha−1 d−1 from F_CK, F_K, and F_SK of fluvo-aquic soil treatments, respectively. The peak of N2O emissions of fluvo-aquic soil treatments was observed on the third day of the experiment. The average values of N2O emissions were 4.0 ± 0.4, 8.5 ± 1.1, and 12.1 ± 1.5 g N ha−1 d−1 from B_CK, B_K, and B_SK of black soil treatments, respectively. The peak of N2O emissions from black soil was also observed on the third day of the experiment. The average values of N2O emissions were 3.3 ± 0.4, 6.8 ± 0.8, and 10.6 ± 1.3 g N ha−1 d−1 from P_CK, P_K, and P_SK of paddy soil treatments, respectively. The peak of N2O emissions from paddy soil was also observed on the fourth day of the experiment.
N2 emission peaks in all three soil types increased when the soil denitrifying environment was conducive a few days after KNO3 was applied with straw addition (Figure 2) and then gradually decreased till the end of the incubation period. Our results showed that N2 emissions observed from KNO3-fertilized plus straw amendment treatments of the three soil types were higher than from other treatments. This is obvious due to the fact that organic C from straw enhanced the electron donor for N2O reduction where C availability also increased microbial respiration in soils along with a decreased O2, thus creating anaerobic microsites for denitrifying microorganisms. Overall, compared with the black and paddy soils, the N2 flux was higher in the fluvo-aquic soil, with a maximum of 57.0 ± 8.0 g N ha−1 day−1 from F_SK treatment. The average values of N2 emissions were 14.3 ± 2.5, 18.3 ± 2.3, and 34.7 ± 4.6 g N ha−1 d−1 from F_CK, F_K, and F_SK of fluvo-aquic soil treatments, respectively. The peak of N2 emissions of fluvo-aquic soil treatments was observed on the fifth day of the incubation period. The average values of N2 emissions were 12.5 ± 2.3, 16.6 ± 2.3, and 30.0 ± 4.5 g N ha−1 d−1 from B_CK, B_K, and B_SK of black soil treatments, respectively. The peak of N2 emissions from black soil was observed on the seventh day of the incubation period. The average values of N2 emissions were 9.4 ± 2.0, 15.0 ± 2.0, and 25.0 ± 3.4 g N ha−1 d−1 from P_CK, P_K, and P_SK of paddy soil treatments, respectively. The peak of N2 emissions from paddy soil was observed on the sixth day of the incubation period.

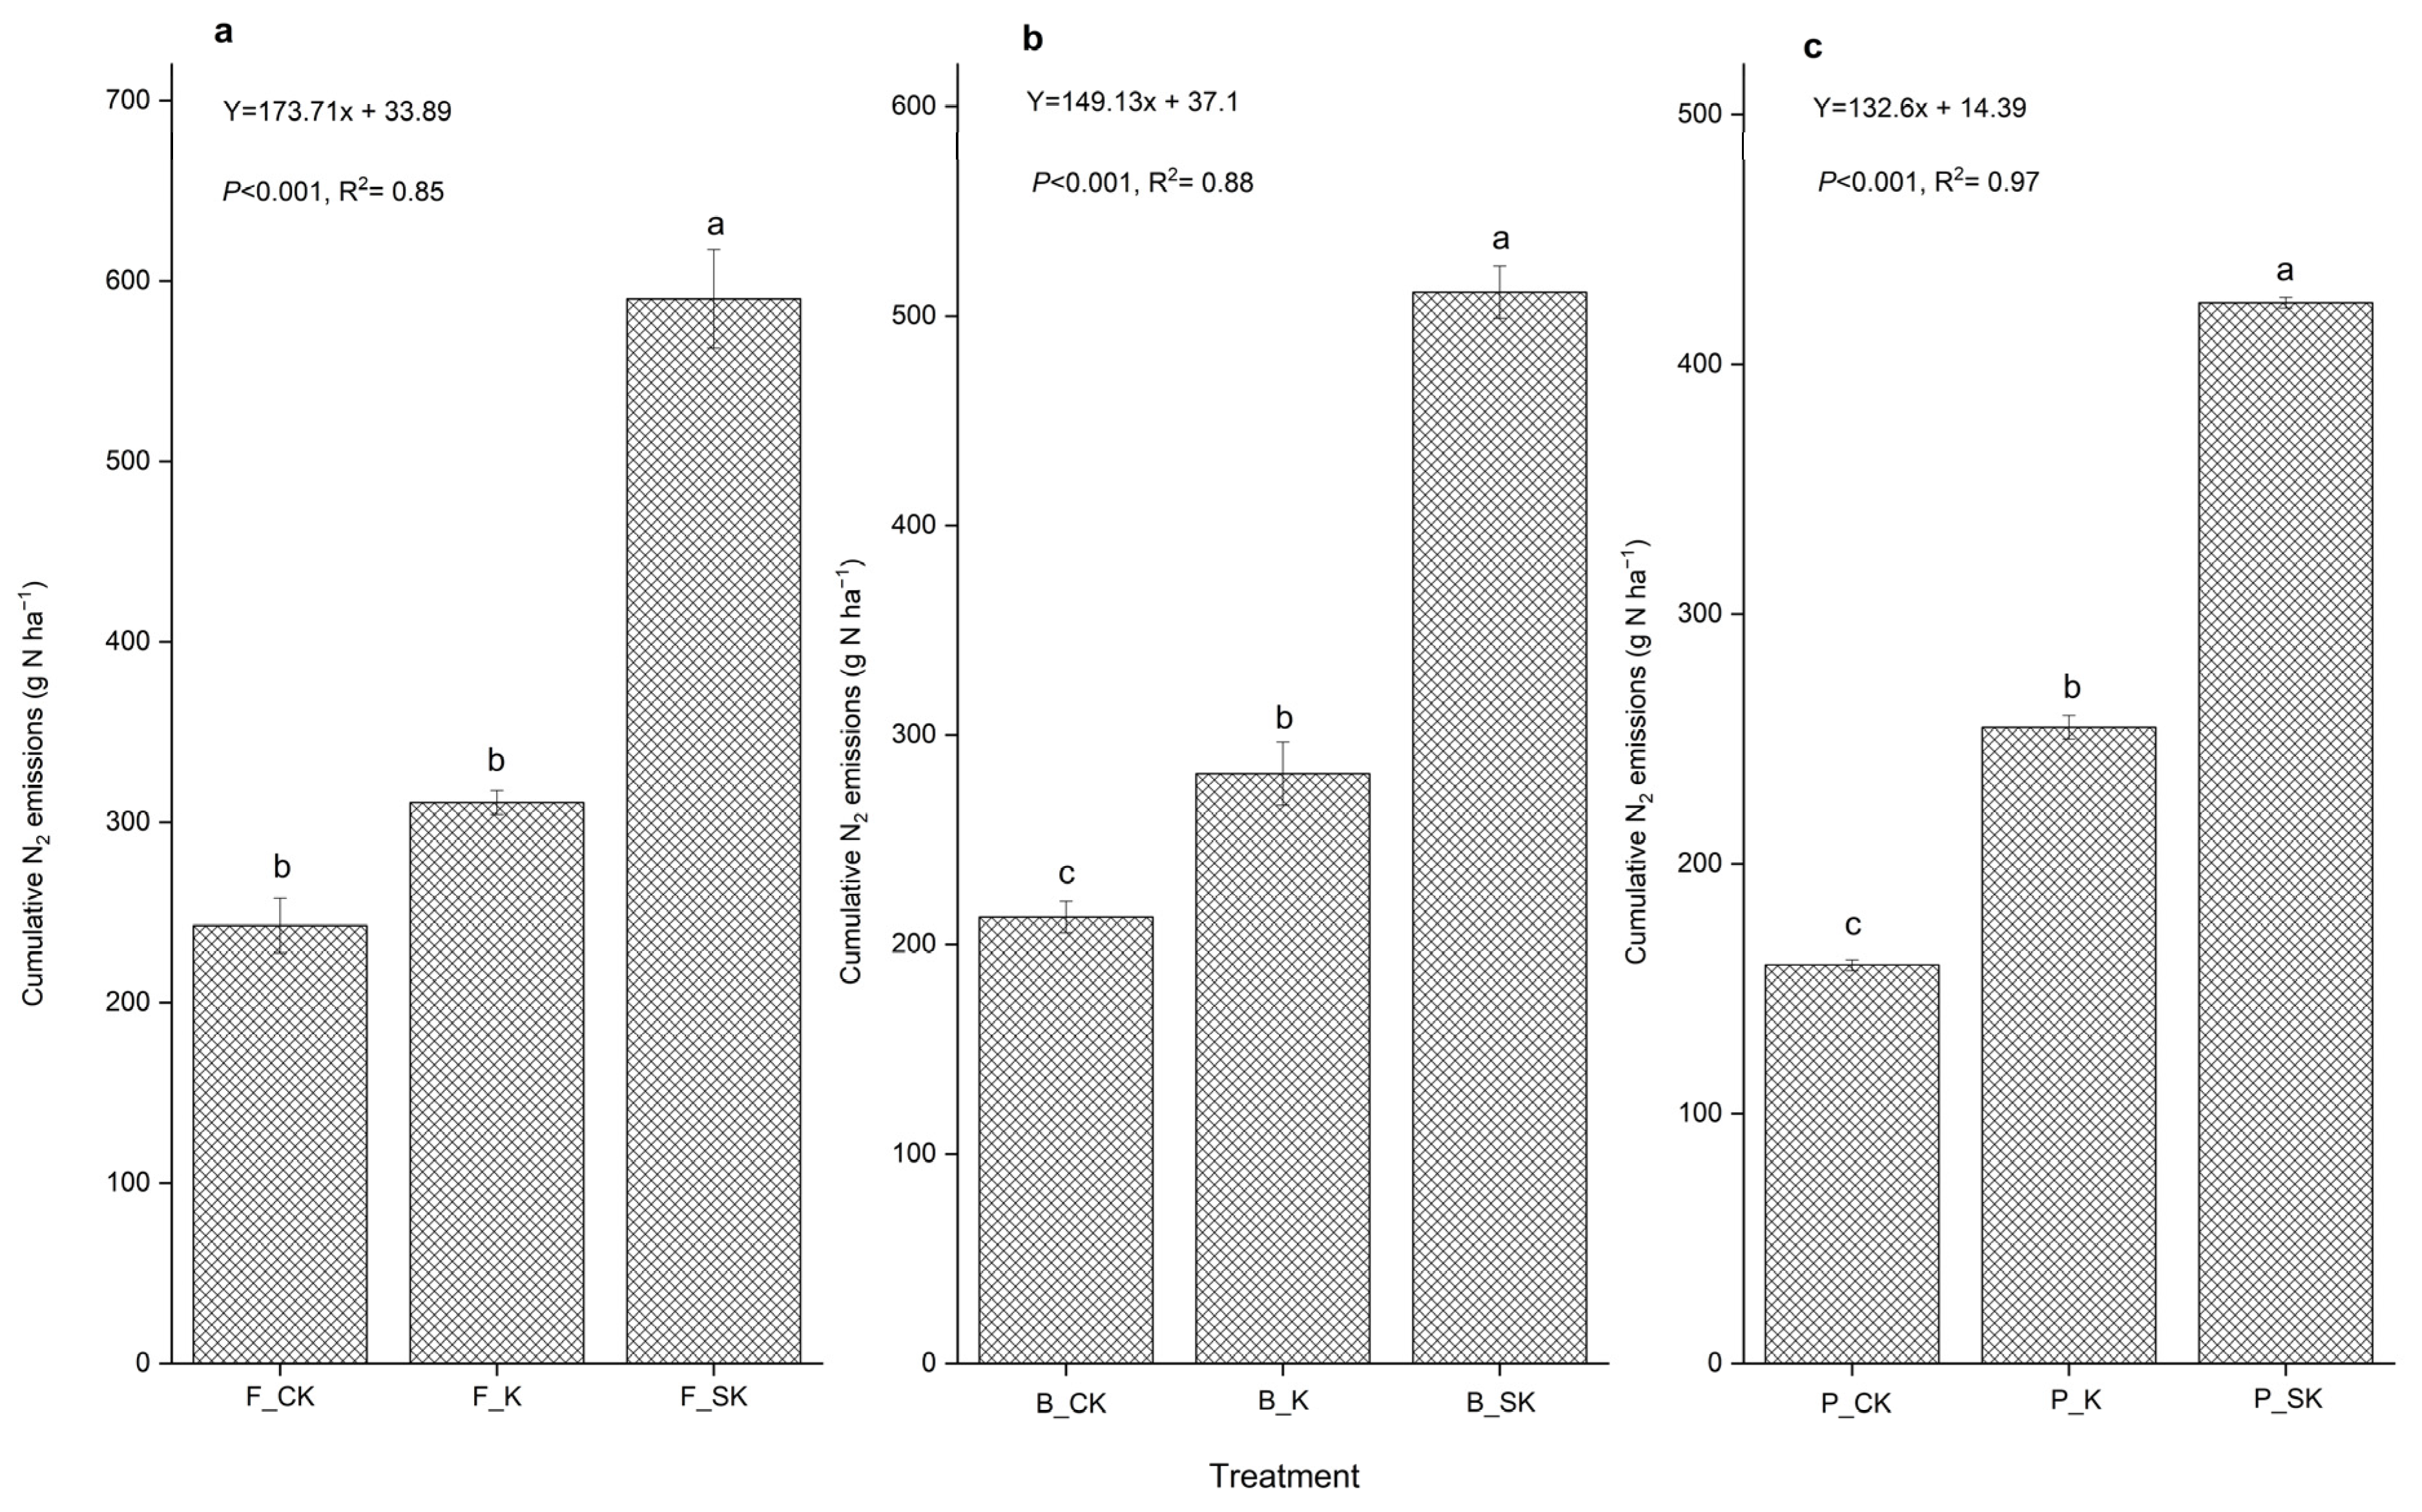
3.3. Cumulative N2O and N2 Emissions from Three Different Soil Types

The cumulative emissions of both N2O and N2 from the three different soil types (fluvo-aquic, black, and paddy soils) were investigated during the incubation period of 17 days in our current study (Figure 3 and Figure 4). Overall, compared with the black and paddy soils, the N2O and N2 fluxes were higher in the fluvo-aquic soil, with a maximum of 234.2 ± 6.3 and 590.1 ± 27.3 g N ha−1 from F_SK treatment, respectively, during the incubation period. The higher emissions observed from fluvo-aquic soil type were boosted by the availability of a conducive denitrifying environment like higher soil pH and C/N ratio where soil moisture and required nitrate and temperature were also in acceptable ranges. The cumulative emissions of N2O were significantly different among all treatments and average values obtained were 73.6 ± 2.2, 164.2 ± 3.2, and 234.2 ± 6.3 g N ha−1 from F_CK, F_K, and F_SK of fluvo-aquic soil treatments, respectively, during the incubation period. Annual average cumulative N2 emissions were 242.7 ± 15.3, 311.0 ± 6.6, and 590.1 ± 27.3 g N ha−1 from F_CK, F_K, and F_SK of fluvo-aquic soil treatments, respectively, during the incubation period. Second, the annual cumulative emissions of N2O were significantly different among all treatments and average values obtained were 68.3 ± 1.2, 144.0 ± 3.6, and 205.7 ± 13.2 g N ha−1 from B_CK, B_K, and B_SK of black soil treatments, respectively, during the incubation period. Annual average cumulative N2 emissions were 213.1 ± 7.6, 281.6 ± 15.0, and 511.4 ± 12.5 g N ha−1 from B_CK, B_K, and B_SK of black soil treatments, respectively, during the incubation period. Third, the annual cumulative emissions of N2O were significantly different among all treatments and average values obtained were 56.7 ± 1.0, 115.6 ± 8.4, and 180.1 ± 6.4 g N ha−1 from P_CK, P_K, and P_SK of paddy soil treatments, respectively, during the incubation period. Annual average cumulative N2 emissions were 159.4 ± 2.1, 254.6 ± 4.7, and 424.6 ± 2.1 g N ha−1 d−1 from P_CK, P_K, and P_SK of paddy soil treatments, respectively, during the incubation period.
The total cumulative N2O plus N2 emissions were higher in fluvo-aquic soils and the lowest in paddy soil while more emissions were evident in KNO3 plus straw treatments in all three soil types (Table 3). The total annual cumulative N2O and N2 emissions in each soil type were significantly different between controls and the amended treatments with KNO3 and KNO3 plus straw treatments throughout the incubation period (Table 3).

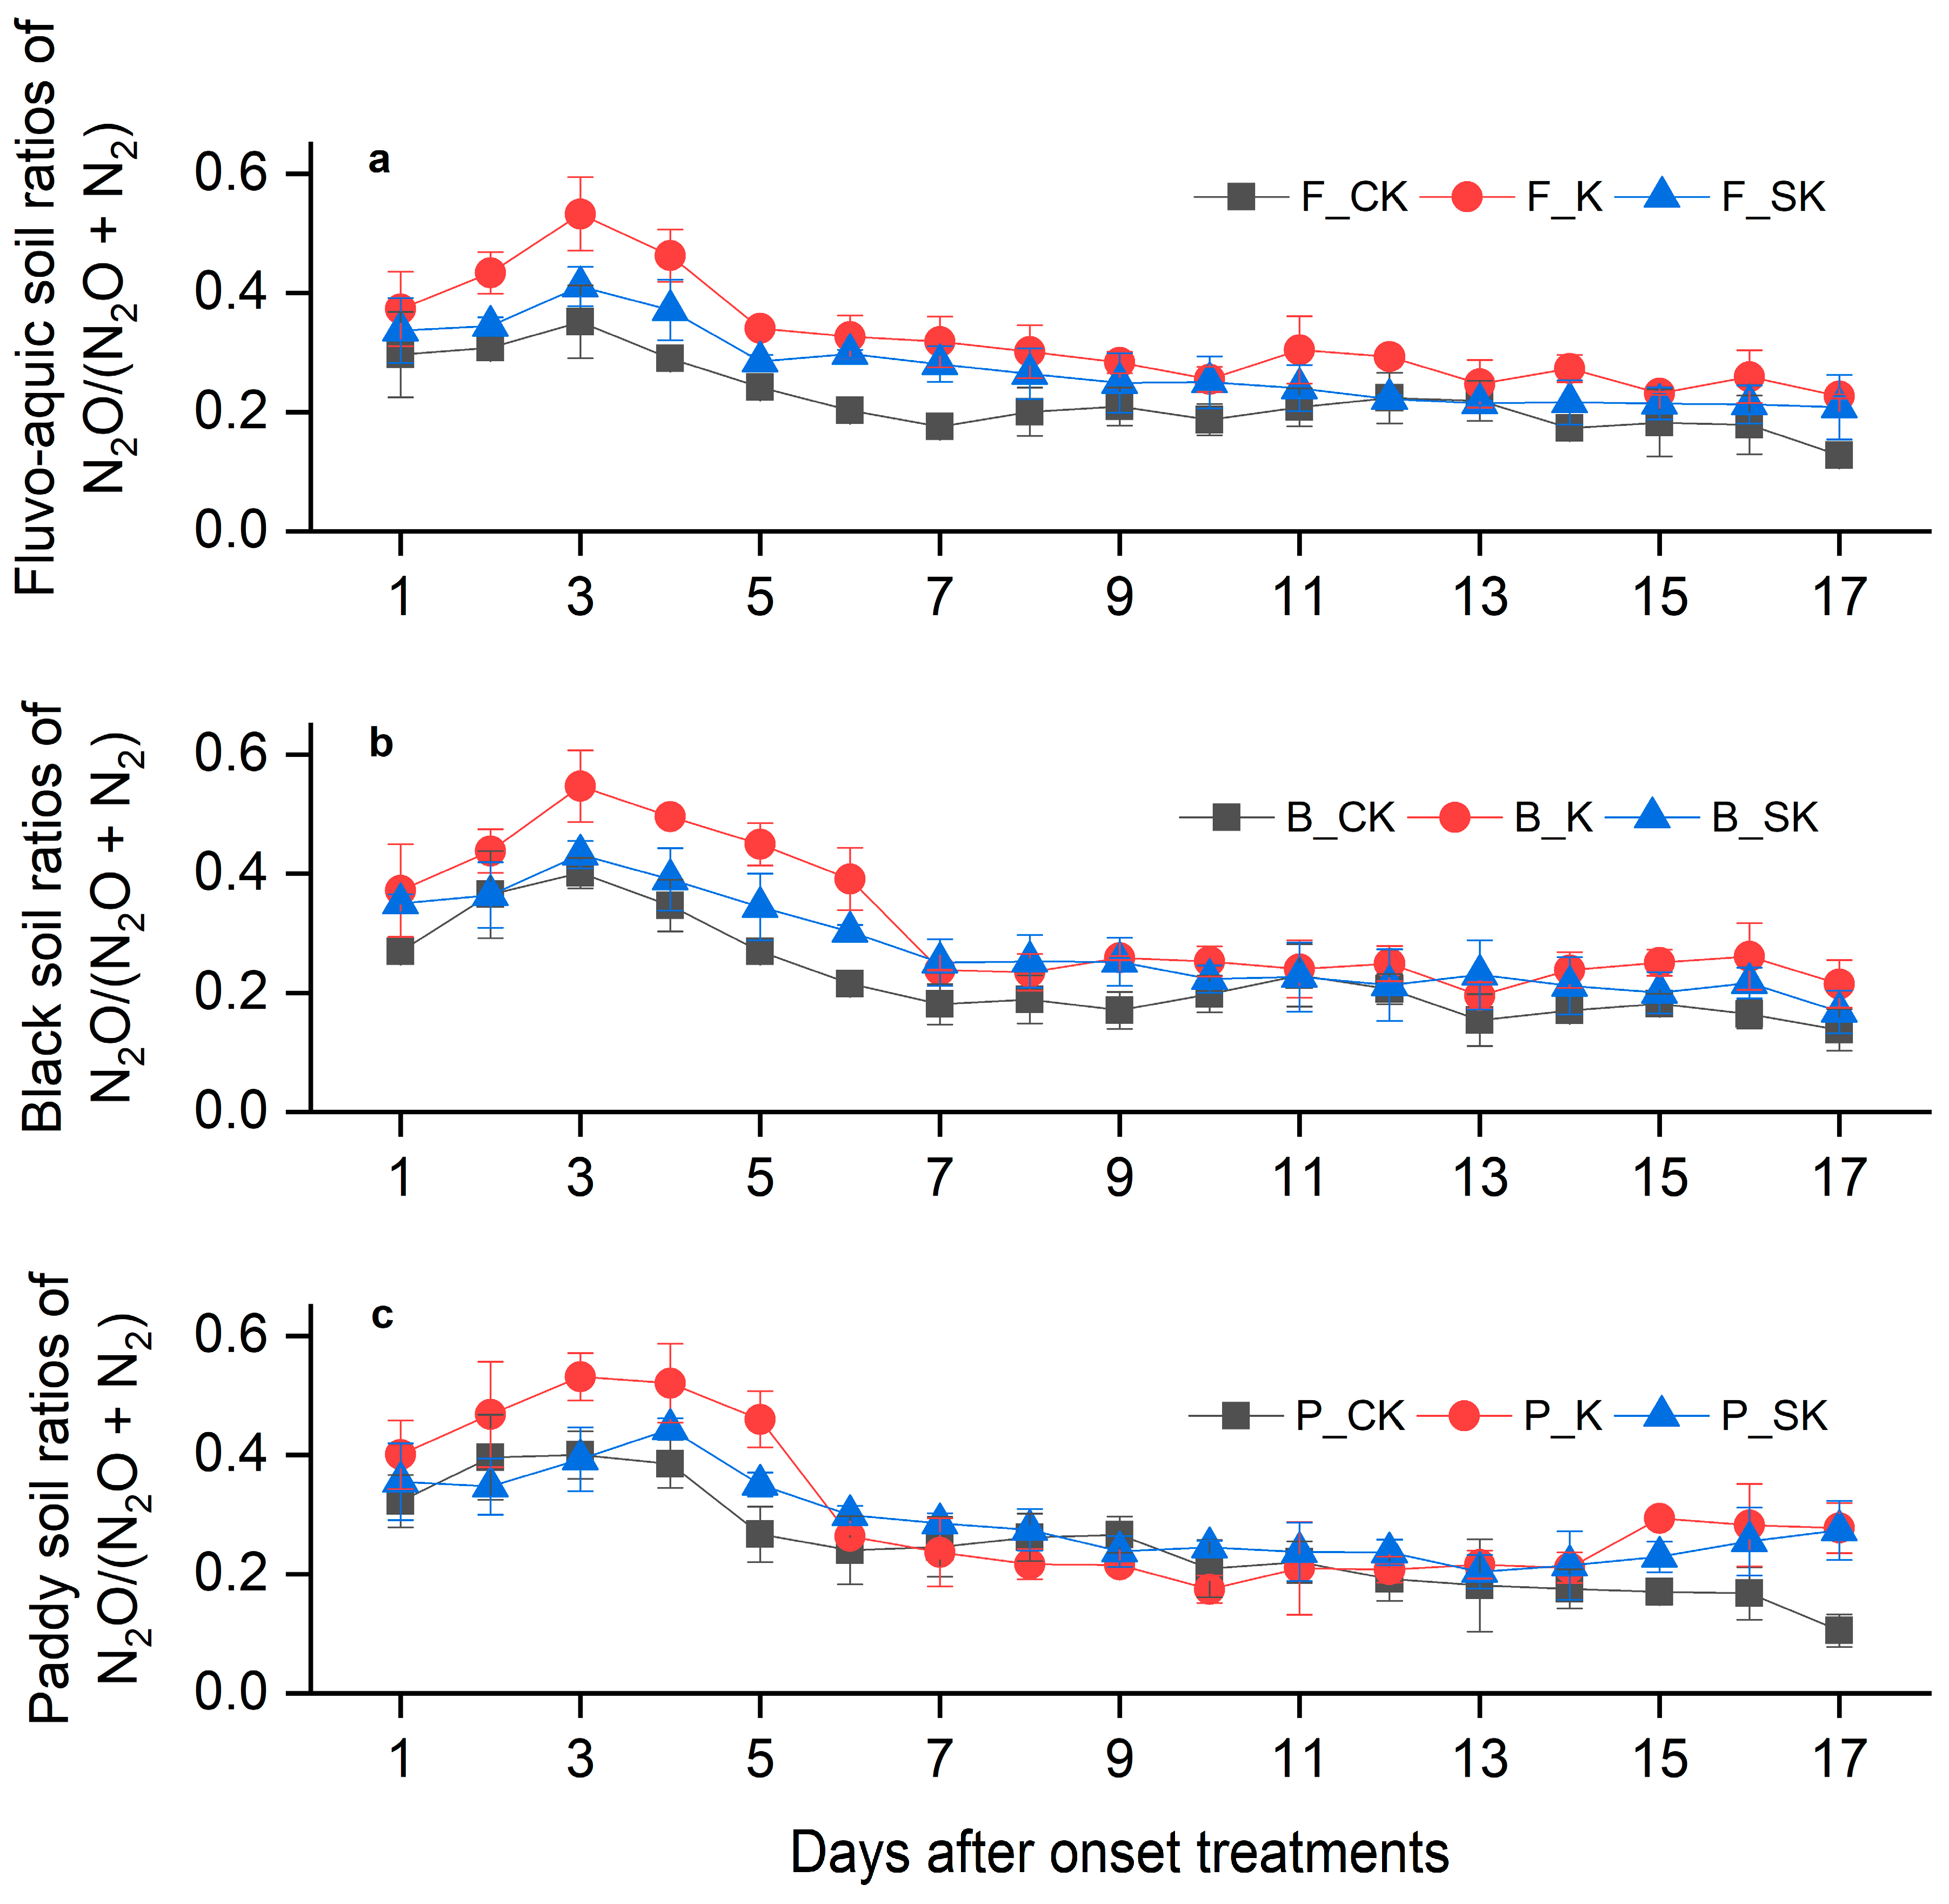
3.4. Stoichiometric Ratios of N2O/(N2O + N2) from the Three Different Soil Types

Overall, compared with all soil types in the current study, the N2O/(N2O + N2) product ratio was higher in the black soil with a maximum of 0.55, while in paddy soil, there was a minimum of 0.11. The daily emission ratios of N2O/(N2O + N2) were the highest in F_K and lowest in F_CK for fluvo-aquic soil type in the current study (Figure 5), while the average values were 0.22, 0.32, and 0.27 from F_CK, F_K, and F_SK treatments, respectively, with minimum and maximum ratios of 0.13 and 0.53.
The daily emission ratios of N2O/(N2O + N2) were the highest in B_K and lowest in B_CK for the black soil type in the current study (Figure 5), while the average values were 0.23, 0.31, and 0.27 from B_CK, B_K, and B_SK treatments, respectively, with minimum and maximum ratios of 0.14 and 0.55.
The daily emission ratios of N2O/(N2O + N2) were the highest in P_K and lowest in P_CK for the black soil type in the current study (Figure 5), while the average values were 0.25, 0.31, and 0.29 from P_CK, P_K, and P_SK treatments, respectively, with minimum and maximum ratios of 0.11 and 0.53. In fact, after onset treatments, the product stoichiometric ratios increased in all treatments, with the effect being more pronounced in K treatments for all three soil types; then, the emission ratios gradually decreased till the end of the incubation period. Higher stoichiometric ratios of N2O/(N2O + N2) were observed in KNO3 treatments and the lowest in controls for all three soil types. The differences in the stoichiometric ratios of N2O/(N2O + N2) between the soil types were small and insignificant (Table 3).

4. Discussion

4.1. Effect of Straw and Nitrate Amendments on N2O and N2 Emissions and Their Stoichiometric Ratios

It has been reported that straw application together with nitrate can increase the rate of denitrification [28] by supplying extra substrates known as electron donors in the form of an energy source [43,44]. In our experiment, with the increase in incubation time, straw amendment combined with KNO3 caused a slight increase in N2O emissions (Figure 1) where the peaks occurred on the third incubation day and then gradually decreased to the minimum till the end of incubation in all treatments for all three soil types. At the same time, N2 emissions (Figure 2) drastically increased with the increment being more significant in the straw plus KNO3 treatments for all three soil types; after the peaks, the emissions slowly decreased till the end of incubation. This phenomenon probably occurred because N2O reduction began to exceed N2O production after the soil had met certain conducive denitrification conditions [5] and NO3 content fell below a certain threshold level [45]. In the current study, we observed a decreasing trend between initial and final soil NO3 (Table 2) where NO3 depletion was attributed to the production and reduction of N2O emissions causing high N2 emissions as a final denitrification product. This is a valid phenomenon because in our study, the soil moisture was set at 80% WFPS in anaerobic conditions, resulting in more N2 emissions. Our findings are in agreement with the previous studies that reported that the addition of crop residues could decrease and/or slightly increase N2O emissions and drastically increase N2 emissions by lowering the stoichiometric ratio of N2O/(N2O + N2) and stimulating microbial immobilization in soil [8,46]. Our results contradicted denitrification observations that were previously reported by saying that high nitrate concentrations and high organic C inputs could still inhibit N2O reduction [44]. Perhaps because in moist soils, electron donors like labile C are known to be limiting factors for denitrification, thereby controlling the denitrification rate directly [27]. Another fact is that microorganisms responsible for denitrification use labile C as an electron donor for all reduction steps, especially from NO3 to N2 [18,47].
Due to the fact that lower N2O emissions coupled with significantly higher N2 emissions were observed in all treatments for all three soil types. The highest N2 emissions were more pronounced in the straw plus KNO3 treatments for all three soil types where a more rapid decrease in soil NO3 concentrations was caused by high denitrification loss. It was previously reported that N2O was not utilized by denitrifiers as a terminal electron acceptor [45,48]. However, the current results showed that straw plus KNO3 treatments emitted gaseous N, which sightly increased N2O with a drastic increase in N2 emissions due to more increment of N2O reduction rates with high nitrate. This was explained by a more rapid decrease in NO3 content compared with the KNO3 treatments alone for all three soil types (Table 2). Therefore, the results show that organic matter amendment can mitigate N2O emissions in soils with high NO3 content due to higher N2O reduction to N2 in the presence of conducive denitrifying conditions. The previous studies about straw return to soils reported controversial straw effects on mitigation of N2O emissions, mainly based on the nature of the soil—either paddy or upland—and, also, NO3 content in the soil. For example, some studies showed that straw return can mitigate N2O emissions [30,49], while others showed that straw return can significantly increase N2O emissions [50,51]. Wei et al. [8] reported an increase in N2O and N2 emissions from straw incorporation combined with synthetic N fertilizer.
Moreover, lower N2O (Figure 1) but higher N2 (Figure 2) emissions in all treatments were observed during the whole incubation period for all three soil types (fluvo-aquic, black, and paddy soils), especially in straw plus KNO3 treatments in the presence of conducive denitrification conditions (high soil moisture, high labile C, favorable temperature, etc). Our results also showed that straw plus KNO3 treatments resulted in more N2O and N2 emissions compared with controls, mainly because they favored more bacterial growth so that they could facilitate denitrification to occur in all three soil types. To sustainably obtain desired soil fertility, which facilitates crop production, the combination of straw plus KNO3 in the same field should be promoted instead of burning straw regardless of the initial amount of NO3 in the soil. However, the previous study reported that when the initial NO3 is very high in the intensively managed soils, it was previously recommended to not simultaneously apply NO3 with straw in order to avoid high N2O emissions [8]. This observation was due to the very high N fertilizer that was applied to that particular vegetable soil. Appropriate N use efficiency should be maintained where supplying the amount of N fertilizer that is needed by the crops at the right time should be encouraged just to avoid overloading NO3 into farmlands. This will help to mitigate very high N2O emissions that may be emitted into the atmosphere.

4.2. Effects of Soil Moisture on N2O, N2 and Their Stoichiometric Ratios of N2O/(N2O + N2)

Gaseous N losses such as N2O and N2 emitted from managed soil are due to the reduction in N available in the soil, potentially representing a substantial loss of applied N fertilizers [5,52]. In the current study, NO3 concentrations were more depleted at a rate of more than 99% in treatments that combined both KNO3 and straw for all three soil types (Table 2). One of the main factors for this high reduction with more N2 emissions was a high soil moisture content of around 80% WFPS. In our current study, when compared with the black and paddy soils, the cumulative N2O and N2 fluxes were higher in the fluvo-aquic soil, with a maximum of 234.2 ± 6.3 and 590.1 ± 27.3 g N ha−1 from F_SK treatment, respectively, during the incubation period. Additionally, average cumulative N2O and N2 fluxes also showed the same trend (Table 3). Our findings were consistent with the previous literature where higher reductions of N2O to N2 emissions were reported due to high soil moisture content compared with low soil moisture content [53,54]. Soil moisture is known to control microbial activities and is an important soil variable for soil gas emissions. Soils with less WFPS emit N2O emissions by nitrification with a maximum of 20% WFPS [55,56], while conducive microbial denitrification to produce and reduce N2O to N2 emissions requires more than 60% WFPS [18,53,55]. When WFPS is greater than 60%, the soil pores are filled with water and this phenomenon limits the amount of available O2 in those soil pores, leading to soil anaerobic conditions that are conducive to the production of N2O and even reduction of N2 emissions. Under such conditions, the soil NO3 is reduced by facultative anaerobic bacteria to NO2, NO2 to N2O, and then N2O to N2 emissions (Figure 6 and Figure 7) [18,56,57]. However, the optimum WFPS for nitrification and denitrification processes to occur varies with different soil types [33,58]. Using German fine-loamy soil, Ruser et al. [59] analyzed how soil moisture levels between 40% and 98% WFPS affected N2O emissions, and the results showed that denitrification (N2O and N2 emissions) increased when soil moisture was more than 60% WFPS. Nitrification was the main process producing N2O at 35–60% WFPS, while almost all N2O emitted through denitrification at 70% WFPS [55]. The study was conducted about the effects of different soil moisture levels on N2O and N2 emissions in Australian soil [53]. Their results showed that when the soil was at 80% and 100% WFPS, N2 emissions were more than N2O emissions by a factor of 8 and 17, respectively. It should be noted that optimum WFPS for N2O production and reduction of N2 emissions to occur may vary with climatic zones.
In the current study, stoichiometric ratios of N2O/(N2O + N2) were also influenced by the trends of N2O and N2 emissions, with observed low values ranging from 0.11 to 0.55 for all three soil types. This observation is consistent with the previous literature that reported both N2O and N2 emissions after straw and KNO3 amendment [8].

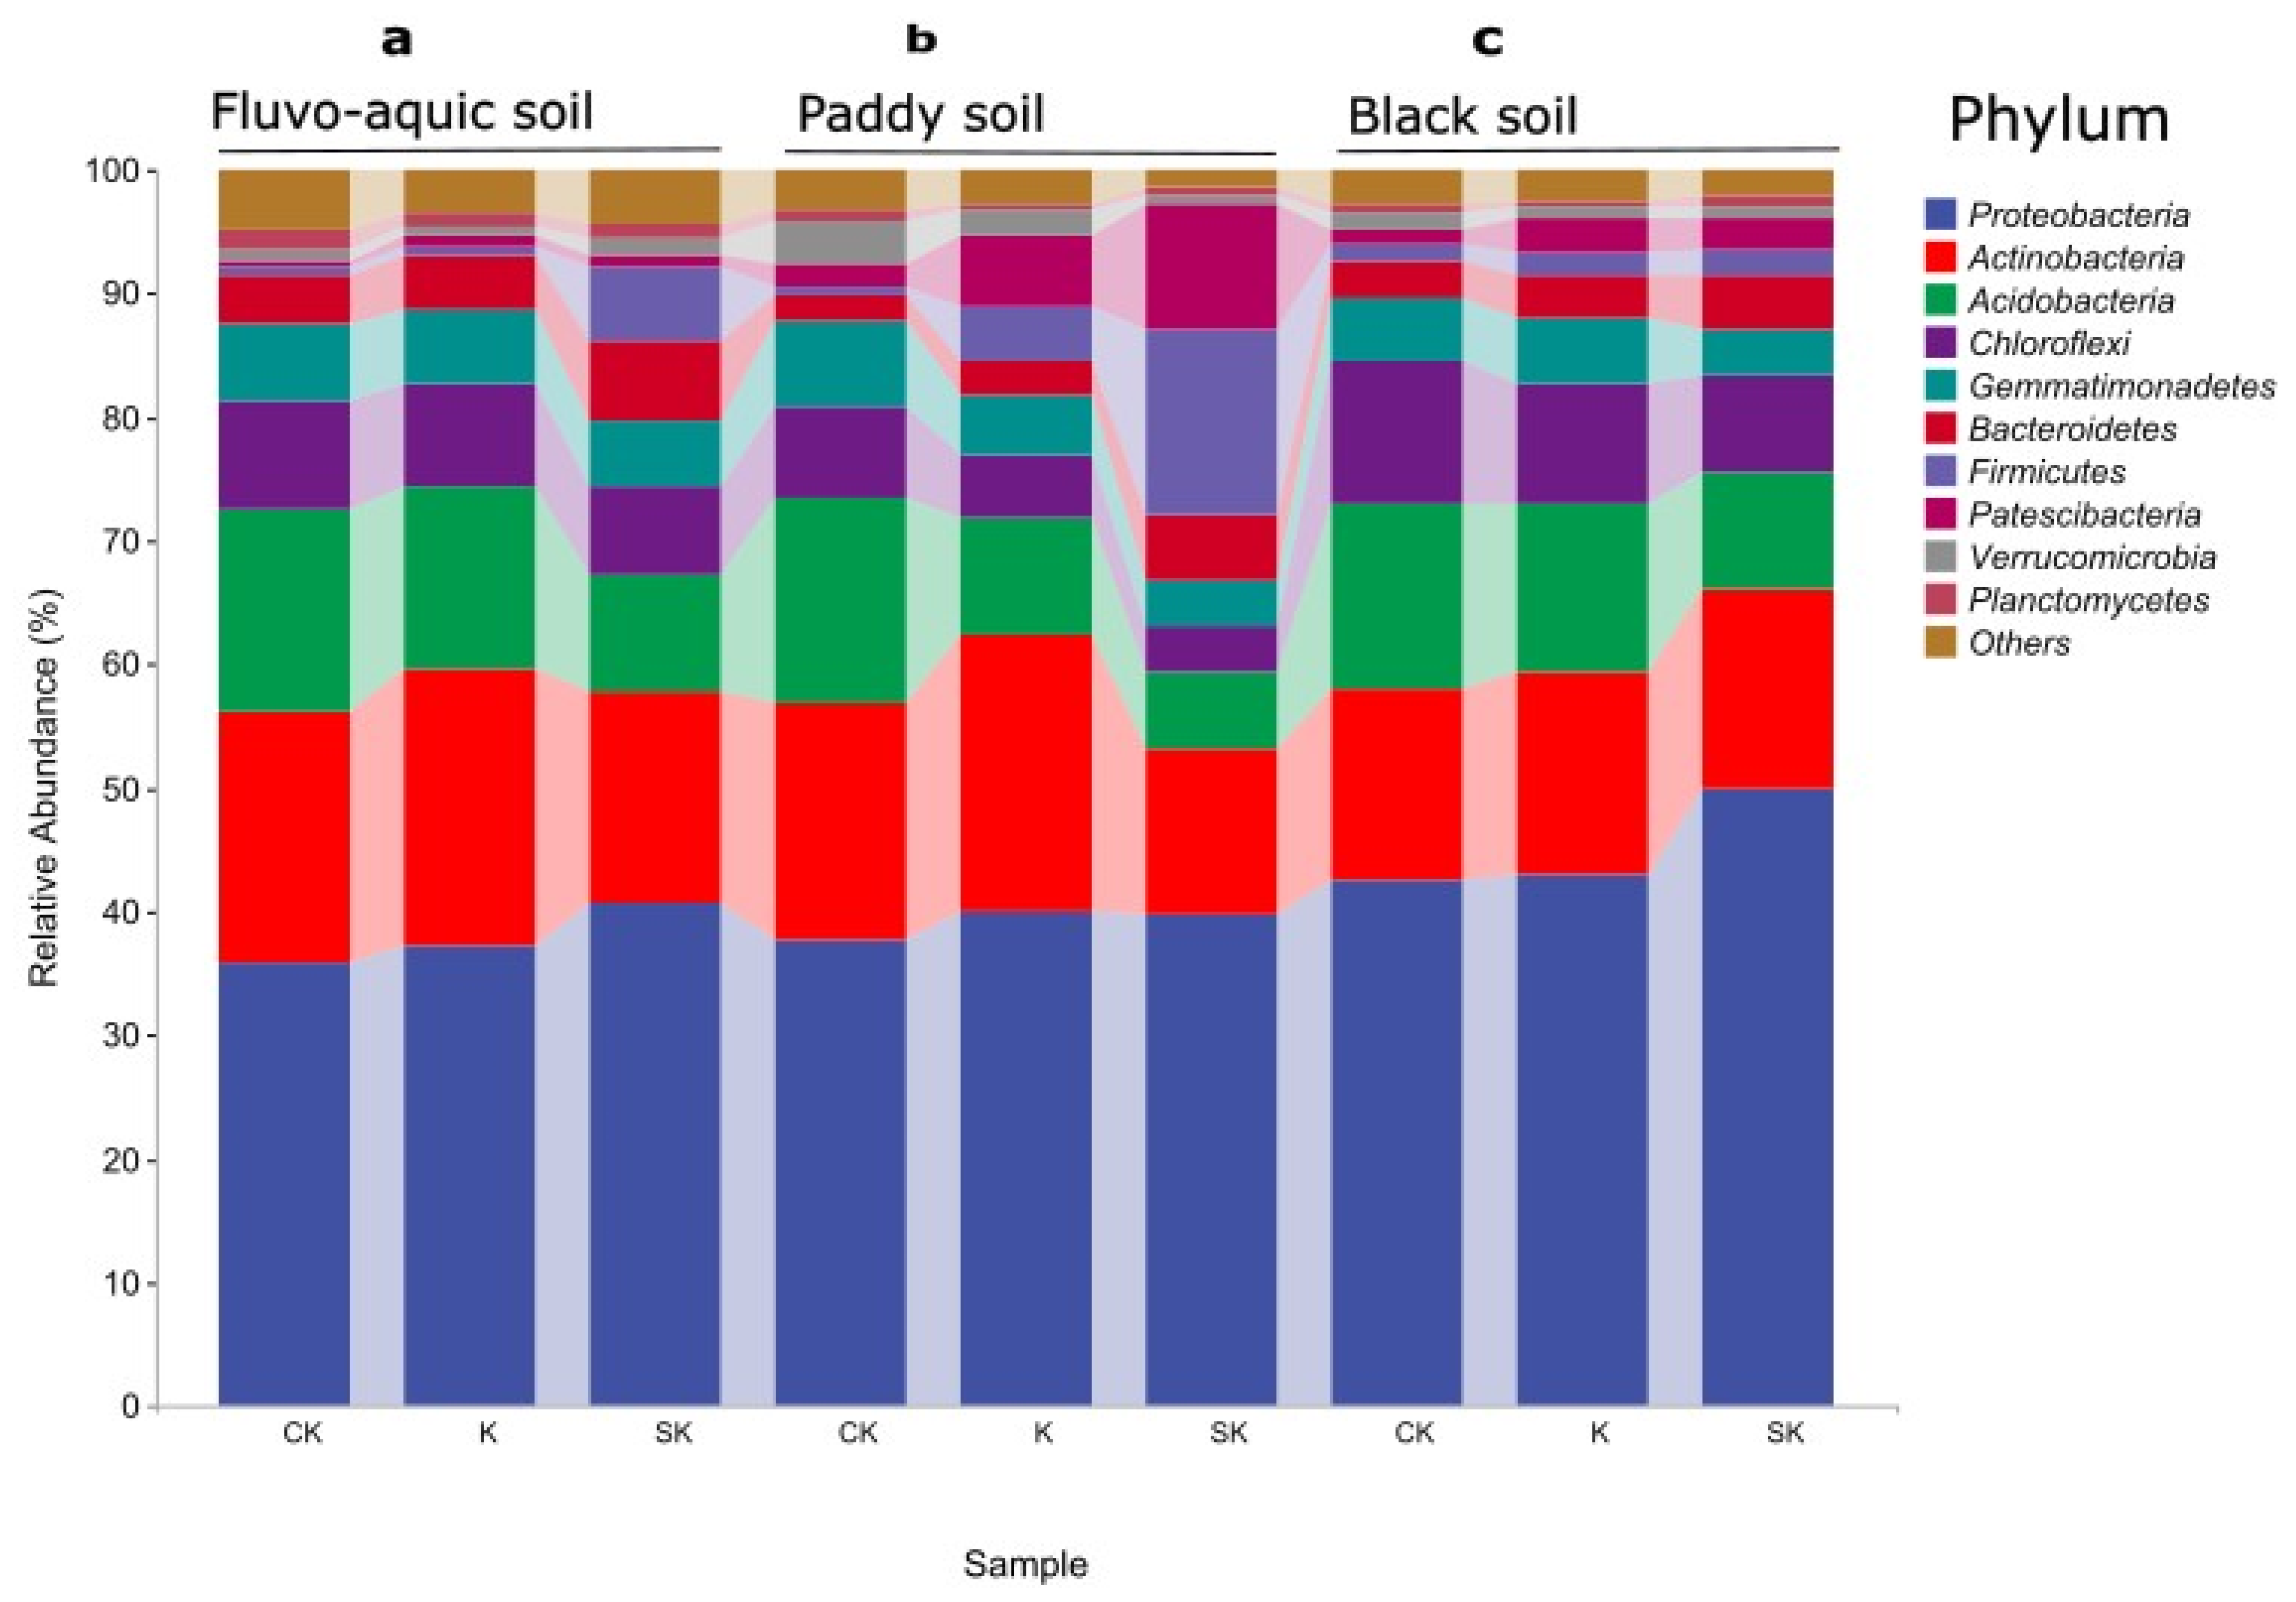
4.3. Effect of Straw and Nitrate Amendments on Bacterial Community Composition

Overall, cumulative N2O and N2 emissions were higher in the fluvo-aquic soil compared with the black and paddy soils during the incubation period (Table 3). The higher emissions observed from the fluvo-aquic soil type were boosted by the availability of a conducive denitrifying environment like higher soil moisture, soil pH and C/N ratio, and required nitrate and temperature in acceptable ranges. This is obviously due to the fact that organic C from straw enhanced the electron donor for N2O reduction where C availability also increased microbial respiration in soils along with a decreased O2, thus creating anaerobic microsites for denitrifying microorganisms in all three soil types. In our current results, bacterial community composition at the phylum level was dominated by Proteobacteria, Actinobacteria, Acidobacteria, Chloroflexi, and Gemmatimonadetes (Figure 6). At the genus level, bacterial community composition was dominated by Subgroup_6, Sphingomonas, and Gemmatimonas (Figure 7). Microbial populations of any particular soil type are responsible for nitrification and denitrification processes [8,60,61]. The denitrification process is mainly carried out by microorganisms like phototrophs, organotrophs, and lithotrophs, which are responsible for delivering energy from light, organic carbon, and inorganic N, respectively [61]. In our results, more microbial populations observed were for denitrification mostly—such as Subgroup_6, Sphingomonas, Saccharimonadales, Paenibacillus, Bacillus, and Pseudolabrys. On the contrary, Rhodanobacter and Saccharimonadales were present more in paddy soil. However, autotrophic bacteria like Nitrosomonas and Nitrobacter that mainly carry out nitrification [62] were not observed in our studied soil types. Other soil environmental factors also play a key role in microbial activity whereby there are some suitable ranges for denitrifiers to operate. The influence of soil environmental factors—for example, soil moisture, soil pH, temperature, C/N ratio, and dissolved O2—were reported [5,54], but the suitable ranges for better denitrifying microorganisms to operate smoothly may vary from soil to soil.
Further evidence to support our current N2O and N2 emissions was previously reported: e.g., Pan et al. [27] reported that straw amendment could significantly increase nosZ gene abundance, which was related to more N2 production in agricultural soils. It was previously reported in studies that there was an inhibitory effect of N2O reduction to N2 due to high NO3 concentrations (over 40–50 mg NO3-N kg−1 dry soil), arguing that N2O was not utilized by denitrifiers as a terminal electron acceptor [32,45]. However, our current results clearly show that N2O was utilized by denitrifiers as a terminal electron acceptor, hence resulting in high N2 emissions and low N2O/(N2O + N2) ratios in the current study. This may be because of high soil moisture (80% WFPS), available carbon due to straw amendment, and even more abundance and increased activity of recently identified clade II nosZ genes of denitrifiers for N2O reductase enzymes. These clade II nosZ genes of denitrifiers were reported to potentially consume N2O in soils and emit more N2 [63,64]. In further research, straw quantity and quality, types of synthetic N fertilizers, and their rates may be compared when evaluating the impacts of crop straw incorporation on denitrification (N2O and N2 emissions).

5. Conclusions

Rice straw amendment combined with N fertilizer increased both N2O and N2 fluxes compared with control or KNO3 treatments in all three soil types (fluvo-aquic, black, and paddy soils). The overall trends in the three soil types for both N2O and N2 emissions were as follows: control < KNO3 < rice straw plus KNO3 treatments. Therefore, this indicates that straw amendment in combination with KNO3 can stimulate a high denitrification rate (lower N2O and higher N2), whereas their effect on stoichiometric ratios of N2O/(N2O + N2) highly depends on soil nitrate concentration, oxygen level, soil moisture content, and labile C. The current study underscores that rice straw amendment in combination with N fertilizer can generally trigger denitrification with less increment on soil N2O but higher N2 emissions under conditions favoring denitrification regardless of the soil type. Therefore, we recommend incorporating crop straws and combining them with chemical N fertilizer in order to enhance agricultural economic benefits.

Author Contributions

Conceptualization, F.B. and C.H.; methodology, F.B.; software, F.B.; validation, C.H.; formal analysis, F.B.; investigation, F.B., A.T. and W.D.; resources, W.D. and X.L.; writing—original draft preparation, F.B.; writing—review and editing, F.B., W.D., A.T., M.R., X.L., Y.Z. and C.H.; visualization, F.B., A.T. and M.R.; supervision, C.H.; project administration, W.D., X.L., Y.Z. and C.H.; funding acquisition, C.H. and X.L. All authors have read and agreed to the published version of the manuscript.

Funding

This work was funded by the National Key R&D Program of China (2022YFD1900300, 2023YFC3707401, 2023YFD1900103), the Strategic Priority Research Program of the Chinese Academy of Sciences (XDA0440000), the Natural Science Foundation of Hebei Province (C2022503009). The first author was financially supported by the ANSO fellowship program.

Data Availability Statement

Dataset available on request from the authors.

Conflicts of Interest

The authors declare no conflicts of interest.

References

  1. Elrys, A.S.; Desoky, E.S.M.; Ali, A.; Zhang, J.B.; Cai, Z.C.; Cheng, Y. Sub-Saharan Africa’s food nitrogen and phosphorus footprints: A scenario analysis for 2050. Sci. Total Environ. 2021, 752, 141964. [Google Scholar] [CrossRef] [PubMed]
  2. FAO. Statistics Division; Food and Agriculture Organization of the United Nations: Rome, Italy, 2020; Available online: www.fao.org/faostat/en/#data (accessed on 30 March 2023).
  3. Galloway, J.N.; Dentener, F.J.; Capone, D.G.; Boyer, E.W.; Howarth, R.W.; Seitzinger, S.P.; Vöosmarty, C.J. Nitrogen cycles: Past, present, and future. Biogeochemistry 2004, 70, 153–226. [Google Scholar] [CrossRef]
  4. Oita, A.; Wirasenjaya, F.; Liu, J.; Webeck, E.; Matsubae, K. Trends in the food nitrogen and phosphorus footprints for Asia’s giants: China, India, and Japan. Resour. Conserv. Recycl. 2020, 157, 104752. [Google Scholar] [CrossRef]
  5. Bizimana, F.; Timilsina, A.; Dong, W.; Uwamungu, J.Y.; Li, X.; Wang, Y.; Hu, C. Effects of long-term nitrogen fertilization on N2O, N2 and their yield-scaled emissions in a temperate semi-arid agro-ecosystem. J. Soils Sediments 2021, 21, 1659–1671. [Google Scholar] [CrossRef]
  6. IPCC. Climate Change 2007: The Physical Science Basis. Working Group I Contribution to the Fourth Assessment Report of the Intergovernmental Panel on Climate Change; Cambridge University Press: Cambridge, UK, 2007; Volume 4. [Google Scholar]
  7. Tilman, D.; Cassman, K.G.; Matson, P.A.; Naylor, R.; Polasky, S. Agricultural sustainability and intensive production practices. Nature 2002, 418, 671–677. [Google Scholar] [CrossRef] [PubMed]
  8. Wei, Z.; Shan, J.; Chai, Y.; Well, R.; Yan, X.; Senbayram, M. Regulation of the product stoichiometry of denitrification in intensively managed soils. Food Energy Secur. 2020, 9, e251. [Google Scholar] [CrossRef]
  9. IPCC. Climate Change 2013: The Physical Science Basis. Contribution of Working Group I to the Fifth Assessment Report of the Intergovernmental Panel on Climate Change; Cambridge University Press: Cambridge, UK; New York, NY, USA, 2013. [Google Scholar]
  10. Baggs, E.M. A review of stable isotope techniques for N2O source partitioning in soils: Recent progress, remaining challenges and future considerations. Rapid Commun. Mass Spectrom. 2008, 22, 1664–1672. [Google Scholar] [CrossRef] [PubMed]
  11. Timilsina, A.; Bizimana, F.; Pandey, B.; Yadav, R.K.P.; Dong, W.; Hu, C. Nitrous oxide emissions from paddies: Understanding the role of rice plants. Plants 2020, 9, 180. [Google Scholar] [CrossRef]
  12. Timilsina, A.; Oenema, O.; Luo, J.; Wang, Y.; Dong, W.; Pandey, B.; Hu, C. Plants are a natural source of nitrous oxide even in field conditions as explained by 15N site preference. Sci. Total Environ. 2022, 805, 150262. [Google Scholar] [CrossRef]
  13. Firestone, M.K.; Davidson, E.A. Microbiological basis of NO and NO production and consumption in soil. In Exchange of Trace Gases between Terrestrial Ecosystems and the Atmosphere; Andreae, M.O., Schimel, D.S., Eds.; Wiley: New York, NY, USA, 1989; pp. 7–212. [Google Scholar]
  14. Wang, R.; Willibald, G.; Feng, Q.; Zheng, X.; Liao, T.; Brüggemann, N.; Butterbach-Bahl, K. Measurement of N2, N2O, NO, and CO2 emissions from soil with the gas-flow-soil-core technique. Environ. Sci. Technol. 2011, 45, 6066–6072. [Google Scholar] [CrossRef]
  15. Timilsina, A.; Zhang, C.; Pandey, B.; Bizimana, F.; Dong, W.; Hu, C. Potential pathway of nitrous oxide formation in plants. Front Plant Sci. 2020, 11, 1177. [Google Scholar] [CrossRef] [PubMed]
  16. Davidson, E.A.; Seitzinger, S. The enigma of progress in denitrification research. Ecol. Appl. 2006, 16, 2057–2063. [Google Scholar] [CrossRef] [PubMed]
  17. Galloway, J.N.; Townsend, A.R.; Erisman, J.W.; Bekunda, M.; Cai, Z.; Freney, J.R.; Sutton, M.A. Transformation of the nitrogen cycle: Recent trends, questions, and potential solutions. Science 2008, 320, 889–892. [Google Scholar] [CrossRef] [PubMed]
  18. Butterbach-Bahl, K.; Baggs, E.M.; Dannenmann, M.; Kiese, R.; Zechmeister-Boltenstern, S. Nitrous oxide emissions from soils: How well do we understand the processes and their controls? Philos. Trans. R. Soc. B Biol. Sci. 2013, 368, 20130122. [Google Scholar] [CrossRef] [PubMed]
  19. Bizimana, F.; Dong, W.; Li, X.; Timilsina, A.; Zhang, Y.; Aluoch, S.O.; Hu, C. Estimating food nitrogen and phosphorus footprints and budgeting nitrogen and phosphorus flows of Rwanda’s agricultural food system during 1961–2020. Sci. Total Environ. 2024, 906, 167693. [Google Scholar] [CrossRef] [PubMed]
  20. Wang, R.; Pan, Z.; Zheng, X.; Ju, X.; Yao, Z.; Butterbach-Bahl, K.; Huang, B. Using field-measured soil N2O fluxes and laboratory scale parameterization of N2O/(N2O+N2) ratios to quantify field-scale soil N2 emissions. Soil Biol. Biochem. 2020, 148, 107904. [Google Scholar] [CrossRef]
  21. Bai, J.; Li, Y.; Zhang, J.; Xu, F.; Bo, Q.; Wang, Z.; Yue, S. Straw returning and one-time application of a mixture of controlled release and solid granular urea to reduce carbon footprint of plastic film mulching spring maize. J. Clean. Prod. 2021, 280, 124478. [Google Scholar] [CrossRef]
  22. Li, C.; Xiong, Y.; Qu, Z.; Xu, X.; Huang, Q.; Huang, G. Impact of biochar addition on soil properties and water-fertilizer productivity of tomato in semi-arid region of inner Mongolia, China. Geoderma 2018, 331, 100–108. [Google Scholar] [CrossRef]
  23. Badía, D.; Martí, C.; Aguirre, A.J. Straw management effects on CO2 efflux and C storage in different Mediterranean agricultural soils. Sci. Total Environ. 2013, 465, 233–239. [Google Scholar] [CrossRef] [PubMed]
  24. Liu, C.; Lu, M.; Cui, J.; Li, B.; Fang, C. Effects of straw carbon input on carbon dynamics in agricultural soils: A meta-analysis. Glob. Change Biol. 2014, 20, 1366–1381. [Google Scholar] [CrossRef]
  25. Chen, S.; Zhang, X.; Shao, L.; Sun, H.; Niu, J.; Liu, X. Effects of straw and manure management on soil and crop performance in North China Plain. Catena 2020, 187, 104359. [Google Scholar] [CrossRef]
  26. Baggs, E.M.; Rees, R.M.; Smith, K.A.; Vinten, A.J.A. Nitrous oxide emission from soils after incorporating crop residues. Soil Use Manag. 2000, 16, 82–87. [Google Scholar] [CrossRef]
  27. Pan, F.; Chapman, S.J.; Li, Y.; Yao, H. Straw amendment to paddy soil stimulates denitrification but biochar amendment promotes anaerobic ammonia oxidation. J. Soils Sediments 2017, 17, 2428–2437. [Google Scholar] [CrossRef]
  28. Xiao, Y.; Zhang, F.; Li, Y.; Li, T.; Che, Y.; Deng, S. Influence of winter crop residue and nitrogen form on greenhouse gas emissions from acidic paddy soil. Eur. J. Soil Biol. 2018, 85, 23–29. [Google Scholar] [CrossRef]
  29. Zhou, Y.; Zhang, Y.; Tian, D.; Mu, Y. The influence of straw returning on N2O emissions from a maize-wheat field in the North China Plain. Sci. Total Environ. 2017, 584, 935–941. [Google Scholar] [CrossRef]
  30. Yao, Z.; Yan, G.; Zheng, X.; Wang, R.; Liu, C.; Butterbach-Bahl, K. Straw return reduces yield-scaled N2O plus NO emissions from annual winter wheat-based cropping systems in the North China Plain. Sci. Total Environ. 2017, 590, 174–185. [Google Scholar] [CrossRef] [PubMed]
  31. Zhou, M.; Zhu, B.; Brüggemann, N.; Bergmann, J.; Wang, Y.; Butterbach-Bahl, K. N2O and CH4 emissions, and NO3 leaching on a crop-yield basis from a subtropical rain-fed wheat–maize rotation in response to different types of nitrogen fertilizer. Ecosystems 2014, 17, 286–301. [Google Scholar] [CrossRef]
  32. Firestone, M.K. Biological denitrification. Nitrogen Agri. Soils 1982, 22, 289–326. [Google Scholar]
  33. Weier, K.L.; Doran, J.W.; Power, J.F.; Walters, D.T. Denitrification and the dinitrogen/nitrous oxide ratio as affected by soil water, available carbon, and nitrate. Soil Sci. Soc. Am. J. 1993, 57, 66–72. [Google Scholar] [CrossRef]
  34. Miller, M.N.; Zebarth, B.; Dandie, C.E.; Burton, D.L.; Goyer, C.; Trevors, J.T. Crop residue influence on denitrification, N2O emissions and denitrifier community abundance in soil. Soil Biol. Biochem. 2008, 40, 2553–2562. [Google Scholar] [CrossRef]
  35. Chen, L.; Sun, S.; Yao, B.; Peng, Y.; Gao, C.; Qin, T.; Quan, W. Effects of straw return and straw biochar on soil properties and crop growth: A review. Front Plant Sci. 2022, 13, 986763. [Google Scholar] [CrossRef]
  36. Friedl, J.; Cardenas, L.M.; Clough, T.J.; Dannenmann, M.; Hu, C.; Scheer, C. Measuring denitrification and the N2O/(N2O+N2) emission ratio from terrestrial soils. Curr. Opin. Environ. Sustain. 2020, 47, 61–71. [Google Scholar] [CrossRef]
  37. Ma, Y.; Shen, Y.; Liu, Y. State of the art of straw treatment technology: Challenges and solutions forward. Bioresour. Technol. 2020, 313, 123656. [Google Scholar] [CrossRef]
  38. Wieder, W.R.; Boehnert, J.; Bonan, G.B.; Langseth, M. Regridded Harmonized World Soil Database v1.2; ORNL DAAC: Oak Ridge, TN, USA, 2014. [Google Scholar] [CrossRef]
  39. Liu, X.; Lee Burras, C.; Kravchenko, Y.S.; Duran, A.; Huffman, T.; Morras, H.; Studdert, G.; Zhang, X.; Cruse, R.M.; Yuan, X. Overview of Mollisols in the world: Distribution, land use and management. Can. J. Soil Sci. 2012, 92, 383–402. [Google Scholar] [CrossRef]
  40. Timilsina, A.; Dong, W.; Luo, J.; Lindsey, S.; Wang, Y.; Hu, C. Nitrogen isotopic signatures and fluxes of N2O in response to land-use change on naturally occurring saline–alkaline soil. Sci. Rep. 2020, 10, 21253. [Google Scholar] [CrossRef] [PubMed]
  41. Bizimana, F.; Luo, J.; Timilsina, A.; Dong, W.; Gaudel, G.; Ding, K.; Hu, C. Estimating field N2 emissions based on laboratory-quantified N2O/(N2O+N2) ratios and field-quantified N2O emissions. J. Soils Sediments 2022, 22, 2196–2208. [Google Scholar] [CrossRef]
  42. Molstad, L.; Dörsch, P.; Bakken, L.R. Robotized incubation system for monitoring gases (O2, NO, N2O, N2) in denitrifying cultures. J. Microbiol. Methods 2007, 71, 202–211. [Google Scholar] [CrossRef]
  43. Giles, M.E.; Daniell, T.J.; Baggs, E.M. Compound driven differences in N2 and N2O emission from soil; the role of substrate use efficiency and the microbial community. Soil Biol. Biochem. 2017, 106, 90–98. [Google Scholar] [CrossRef]
  44. Senbayram, M.; Well, R.; Bol, R.; Chadwick, D.R.; Jones, D.L.; Wu, D. Interaction of straw amendment and soil NO3 content controls fungal denitrification and denitrification product stoichiometry in a sandy soil. Soil Biol. Biochem. 2018, 126, 204–212. [Google Scholar] [CrossRef]
  45. Senbayram, M.; Chen, R.; Budai, A.; Bakken, L.; Dittert, K. N2O emission and the N2O/(N2O+N2) product ratio of denitrification as controlled by available carbon substrates and nitrate concentrations. Agric. Ecosyst. Environ. 2012, 147, 4–12. [Google Scholar] [CrossRef]
  46. Frimpong, K.A.; Baggs, E.M. Do combined applications of crop residues and inorganic fertilizer lower emission of N2O from soil? Soil Use Manag. 2010, 26, 412–424. [Google Scholar] [CrossRef]
  47. Stein, L.Y.; Klotz, M.G. The nitrogen cycle. Curr. Biol. 2016, 26, R94–R98. [Google Scholar] [CrossRef] [PubMed]
  48. Morley, N.; Baggs, E.M. Carbon and oxygen controls on N2O and N2 production during nitrate reduction. Soil Biol. Biochem. 2010, 42, 1864–1871. [Google Scholar] [CrossRef]
  49. Zou, J.; Huang, Y.; Jiang, J.; Zheng, X.; Sass, R.L. A 3-year field measurement of methane and nitrous oxide emissions from rice paddies in China: Effects of water regime, crop residue, and fertilizer application. Glob. Biogeochem. Cycles 2005, 19. [Google Scholar] [CrossRef]
  50. Wu, D.; Wei, Z.; Well, R.; Shan, J.; Yan, X.; Bol, R.; Senbayram, M. Straw amendment with nitrate-N decreased N2O/(N2O+N2) ratio but increased soil N2O emission: A case study of direct soil-born N2 measurements. Soil Biol. Biochem. 2018, 127, 301–304. [Google Scholar] [CrossRef]
  51. Pinheiro, P.L.; Recous, S.; Dietrich, G.; Weiler, D.A.; Schu, A.L.; Bazzo, H.L.S.; Giacomini, S.J. N2O emission increases with mulch mass in a fertilized sugarcane cropping system. Biol. Fert. Soil. 2019, 55, 511–523. [Google Scholar] [CrossRef]
  52. Zistl-Schlingmann, M.; Feng, J.; Kiese, R.; Stephan, R.; Zuazo, P.; Willibald, G.; Dannenmann, M. Dinitrogen emissions: An overlooked key component of the N balance of montane grasslands. Biogeochemistry 2019, 143, 15–30. [Google Scholar] [CrossRef]
  53. Friedl, J.; Scheer, C.; Rowlings, D.W.; McIntosh, H.V.; Strazzabosco, A.; Warner, D.I.; Grace, P.R. Denitrification losses from an intensively managed sub-tropical pasture–Impact of soil moisture on the partitioning of N2 and N2O emissions. Soil Biol. Biochem. 2016, 92, 58–66. [Google Scholar] [CrossRef]
  54. Wei, Z.; Shan, J.; Well, R.; Yan, X.; Senbayram, M. Land use conversion and soil moisture affect the magnitude and pattern of soil-borne N2, NO, and N2O emissions. Geoderma 2022, 407, 115568. [Google Scholar] [CrossRef]
  55. Bateman, E.J.; Baggs, E.M. Contributions of nitrification and denitrification to N2O emissions from soils at different water-filled pore space. Biol. Fert. Soil. 2005, 41, 379–388. [Google Scholar] [CrossRef]
  56. Dalal, R.C.; Wang, W.; Robertson, G.P.; Parton, W.J. Nitrous oxide emission from Australian agricultural lands and mitigation options: A review. Soil Res. 2003, 41, 165–195. [Google Scholar] [CrossRef]
  57. Butterbach-Bahl, K.; Dannenmann, M. Denitrification and associated soil N2O emissions due to agricultural activities in a changing climate. Curr. Opin. Environ. Sust. 2011, 3, 389–395. [Google Scholar] [CrossRef]
  58. Parton, W.J.; Mosier, A.R.; Ojima, D.S.; Valentine, D.W.; Schimel, D.S.; Weier, K.; Kulmala, A.E. Generalized model for N2 and N2O production from nitrification and denitrification. Glob. Biogeochem. Cycle 1996, 10, 401–412. [Google Scholar] [CrossRef]
  59. Ruser, R.; Flessa, H.; Russow, R.; Schmidt, G.; Buegger, F.; Munch, J.C. Emission of N2O, N2 and CO2 from soil fertilized with nitrate: Effect of compaction, soil moisture and rewetting. Soil Biol. Biochem. 2006, 38, 263–274. [Google Scholar] [CrossRef]
  60. Blackmer, A.M.; Bremner, J.M. Inhibitory effect of nitrate on reduction of N2O to N2 by soil microorganisms. Soil Biol. Biochem. 1978, 10, 187–191. [Google Scholar] [CrossRef]
  61. Wang, C.; Amon, B.; Schulz, K.; Mehdi, B. Factors that influence nitrous oxide emissions from agricultural soils as well as their representation in simulation models: A review. Agronomy 2021, 11, 770. [Google Scholar] [CrossRef]
  62. Parton, W.J.; Holland, E.A.; Del Grosso, S.J.; Hartman, M.D.; Martin, R.E.; Mosier, A.R.; Schimel, D.S. Generalized model for NO x and N2O emissions from soils. J. Geophys. Res. Atmos. 2001, 106, 17403–17419. [Google Scholar] [CrossRef]
  63. Hallin, S.; Philippot, L.; Löffler, F.E.; Sanford, R.A.; Jones, C.M. Genomics and ecology of novel N2O-reducing microorganisms. Trends Microbiol. 2018, 26, 43–55. [Google Scholar] [CrossRef]
  64. Senbayram, M.; Wei, Z.; Wu, D.; Shan, J.; Yan, X.; Well, R. Inhibitory effect of high nitrate on N2O reduction is offset by long moist spells in heavily N loaded arable soils. Biol. Fert. Soils 2021, 58, 77–90. [Google Scholar] [CrossRef]
Figure 1. Daily N2O emissions during the incubation period in the non-amended treatment (CK), KNO3, and straw plus KNO3 treatments collected from (a) fluvo-aquic soil, (b) black soil, and (c) paddy soil. Error bars show the standard error of each treatment (n = 3).
Agronomy 14 00887 g001
Figure 2. Daily N2 emissions during the incubation period in the non-amended treatment (CK), KNO3, and straw plus KNO3 treatments collected from (a) fluvo-aquic soil, (b) black soil, and (c) paddy soil. Error bars show the standard error of each treatment (n = 3).
Agronomy 14 00887 g002
Figure 3. Cumulative N2O emissions during the incubation period in non-amended treatment (CK), KNO3, and straw plus KNO3 treatments collected from (a) fluvo-aquic soil, (b) black soil, and (c) paddy soil. Error bars show the standard error of each treatment (n = 3). Data are expressed as mean ± standard error (n = 3). Lowercase letters denote a significant difference between average values at p = 0.05.
Agronomy 14 00887 g003
Figure 4. Cumulative N2 emissions during the incubation period in non-amended treatment (CK), KNO3, and straw plus KNO3 treatments collected from (a) fluvo-aquic soil, (b) black soil, and (c) paddy soil. Error bars show the standard error of each treatment (n = 3). Data are expressed as mean ± standard error (n = 3). Lowercase letters denote a significant difference between average values at p = 0.05.
Agronomy 14 00887 g004
Figure 5. N2O/(N2O + N2) emission ratios during the incubation period in the non-amended treatment (CK), KNO3, and straw plus KNO3 treatments collected from (a) fluvo-aquic soil, (b) black soil, and (c) paddy soil. Error bars show the standard error of each treatment (n = 3).
Agronomy 14 00887 g005
Figure 6. Bacterial community composition at phylum level at the end of incubation period in the non-amended treatment (CK), KNO3, and straw plus KNO3 treatments collected from (a) fluvo-aquic soil, (b) paddy soil, and (c) black soil.
Agronomy 14 00887 g006
Figure 7. Bacterial community composition at genus level at the end of incubation period in the non-amended treatment (CK), KNO3, and straw plus KNO3 treatments collected from (a) fluvo-aquic soil, (b) paddy soil, and (c) black soil.
Agronomy 14 00887 g007
Table 1. Soil physicochemical properties. Data are expressed as mean ± standard error (n = 3). Lowercase letters in the same column denote a significant difference between tested average values at p < 0.05.
ParameterDOC
(mg C kg−1)
NO3
(mg N kg−1)
NH4+
(mg N kg−1)
pHTC
(g C kg−1)
TN
(g N kg−1)
C/NBulk Density
(g cm−3)
Fluvo-aquic soil50.1 ± 2.4 a36.0 ± 0.8 a1.9 ± 0.6 a8.0 ± 0.1 a21.9 ± 0.8 a1.2 ± 0.1 a17.8 ± 1.5 a1.3 ± 0.1 a
Black soil48.3 ± 1.0 b31.9 ± 1.2 b1.2 ± 0.4 b6.6 ± 0.1 b16.8 ± 1.2 b1.1 ± 0.1 b15.0 ± 0.2 b1.2 ± 0.1 b
Paddy soil41.7 ± 1.1 c28.0 ± 1.1 c0.8 ± 0.3 c6.1 ± 0.1 c10.8 ± 0.5 c0.9 ± 0.1 c12.1 ± 1.9 c1.1 ± 0.1 c
Table 2. Soil NO3 and NH4+ concentrations at the end of the experiment in the non-amended treatments (CK), KNO3, and straw plus KNO3 treatments. Data are expressed as mean ± standard error (n = 3).
ParameterFinal (mg N kg−1)
NH4+NO3
Fluvo-aquic soilF_CK2.4 ± 0.14.2 ± 0.6
F_K2.2 ± 0.214.8 ± 0.1
F_SK2.9 ± 0.21.3 ± 0.1
Black soilB_CK2.3 ± 0.23.5 ± 0.6
B_K2.1 ± 0.115.9 ± 0.3
B_SK2.6 ± 0.31.4 ± 0.1
Paddy soilP_CK1.3 ± 0.22.7 ± 0.5
P_K1.1 ± 0.113.2 ± 0.1
P_SK1.7 ± 0.21.3 ± 0.1
Table 3. Comparison of cumulative N2O and N2 emissions and their stoichiometric ratios for the three soil types considering the column of the similar treatment (control, KNO3, or straw plus KNO3). Data are expressed as mean ± standard error (n = 3). Lowercase letters in the same column denote a significant difference between tested average values at p = 0.05.
ParameterN2O (g N ha−1)N2 (g N ha−1)N2O + N2 (g N ha−1)N2O/(N2O + N2)
Control (CK)KNO3 (K)Straw + KN3O (SK)Control (CK)KNO3 (K)Straw + KN3O (SK)Control (CK)KNO3 (K)Straw + KN3O (SK)Control (CK)KNO3 (K)Straw + KN3O (SK)
Fluvo-aquic soil 73.6 ± 2.2 a164.2 ± 3.2 a234.2 ± 6.3 a242.7 ± 15.3 a311.0 ± 6.6 a590.1 ± 27.3 a316.4 ± 17.4 a475.2 ± 9.3 a824.4 ± 24.9 a0.23 ± 0.01 c 0.35 ± 0.0 a0.28 ± 0.01 a
Black soil 68.3 ± 1.2 b144.0 ± 3.6 b205.7 ± 13.2 b213.1 ± 7.6 b281.6 ± 15.0 b511.4 ± 12.5 b281.4 ± 8.3 b425.6 ± 18.2 b717.1 ± 14.0 b0.24 ± 0.01 bc0.34 ± 0.01 a0.29 ± 0.02 a
Paddy soil 56.7 ± 1.0 c115.6 ± 8.4 c180.1 ± 6.4 c159.4 ± 2.1 c254.6 ± 4.7 c424.6 ± 2.1 c216.1 ± 1.3 c370.3 ± 8.1 c604.7 ± 7.8 c0.26 ± 0.01 ab0.31 ± 0.02 a0.30 ± 0.01 a
Disclaimer/Publisher’s Note: The statements, opinions and data contained in all publications are solely those of the individual author(s) and contributor(s) and not of MDPI and/or the editor(s). MDPI and/or the editor(s) disclaim responsibility for any injury to people or property resulting from any ideas, methods, instructions or products referred to in the content.

