Article

Yield, Protein Content and Water-Related Physiologies of Spring Wheat Affected by Fertilizer System and Weather Conditions

1
Agricultural Research and Development Station Turda, Agriculturii Street 27, 401100 Turda, Romania
2
Department of Technical and Soil Sciences, Faculty of Agriculture, University of Agricultural Sciences and Veterinary Medicine Cluj-Napoca, Mănăstur Street 3–5, 400372 Cluj-Napoca, Romania
*
Authors to whom correspondence should be addressed.
Agronomy 2024, 14(5), 921; https://doi.org/10.3390/agronomy14050921
Submission received: 18 March 2024 / Revised: 11 April 2024 / Accepted: 25 April 2024 / Published: 27 April 2024

Abstract

:
Technological and climatic factors significantly influence the expression of quality and quantity properties of spring wheat. This study aims to quantify the effects of weather conditions and fertilizer systems on spring wheat yield, quality (protein content), and physiological indicators (leaf vapor pressure deficit, evapotranspiration, surface temperature of the flag leaf) and to identify a suitable spring wheat genotype for the Transylvanian Plain. The experimental factors were: Y represents the year (Y1, 2019; Y2, 2020); F represents the fertilizer variant (F1, a single rate of fertilization: 36 kg ha−1 of nitrogen; F2, two rates of fertilization: 36 kg ha−1 of nitrogen + 72 kg ha−1 of nitrogen; F3, two rates of fertilization: 36 kg ha−1 of nitrogen + 105 kg ha−1 of nitrogen); and S represents the genotype (S1, Pădureni; S2, Granny; S3, Triso; S4, Taisa; S5, Ciprian; and S6, Lennox). This multifactorial experiment with three factors was conducted on Phaeozem soil. Regardless of weather conditions, fertilization with N100–110 at the head swollen sheath (stage 10, Feeks Growth Scale for Wheat) is deemed the most suitable variant because it yields an average grain yield of 5000 kg ha−1 of good quality (13.84% protein) with a considerable flag leaf area (29 cm2) where physiological processes can optimally support the well-being of the spring wheat plants. Beyond this level of fertilization, the average grain yield tends to plateau, but the protein content considerably increases by 13–23%, depending on the genotype. High yields were achieved in the Lennox and Triso genotypes.

1. Introduction

Wheat stands as a paramount crop [1], occupying vast tracts of farmland and reigning as the most extensively cultivated plant globally [2], surpassing even rice and maize [3]. Its grains serve a multifaceted purpose [4,5]: as a crucial raw material in the food industry (encompassing bread, pastries, and noodles), within the livestock sector (utilized either whole or ground grains, including bran), and across various other industries for producing starch, alcoholic beverages, and bio-ethanol [6]. Wheat straw finds utility as animal feed, in the pulp and paper sector, and as organic fertilizer, with or without soil incorporation [7]. The crop’s cultivation is entirely mechanized, aligning well with conservative tillage methods [8,9,10]. Increasing consumption of wheat-based foods is documented [11,12,13], attributed to the grains’ beneficial components [14]—namely proteins, B, PP, E, K vitamins, and minerals such as K, Mg, and Cu—which boast significant health impacts [15]. Furthermore, incorporating wheat into crop rotations diminishes the prevalence of harmful agents like diseases, weeds, and pests, thereby enhancing soil health [16,17].
The winter wheat vegetation period extends approximately 280 days, rendering it unsuitable for mountainous regions characterized by prolonged, frosty winters and significantly low temperatures [18]. Under such conditions, spring wheat emerges as a more viable option, sown between March and April, boasting a shorter vegetation period of 100–120 days [19]. Recent years have witnessed breeders achieving notable successes in developing high-yielding spring wheat varieties, capable of producing about 6 tons per hectare within a growing period of under 100 days [20]. Additionally, the trend of dry autumns coupled with favorable spring rainfall has prompted farmers to expand their cultivation areas for spring cereals [21].
The success of wheat cultivation largely hinges on timely sowing at the onset of warmer temperatures that permit field access, utilizing certified seeds [22], and adhering to essential technological practices, namely sowing, fertilization, crop maintenance, and harvesting [23].
Test weight (TW) is a critical quality parameter influenced by various factors, including fluctuations in grain moisture at harvest [24], the absence or presence of impurities [25], and the grains’ size, shape, and density [26]. Additionally, the surface characteristics of the grains, soil type, and weather conditions (such as rain or heat) during the grain filling period [27], as well as diseases and pest infestations [28], play significant roles in determining TW.
Spring wheat boasts a significant advantage over winter wheat: “higher grain quality” [29]. Proteins, vital for nutritional value and baking qualities, vary in concentration within the wheat grain due to factors like species, variety, climatic conditions, soil fertility, and nitrogen fertilizer application [30]. Among these, climatic conditions are particularly crucial [31]. In dry and warm climates, protein accumulation in grains is enhanced. Such conditions shorten the grain formation and filling periods, accelerate ripening, and, consequently, increase the proportional content of proteins in the grain composition [32,33].
Chemical fertilizers, notably nitrogen-based ones, play a pivotal role in protein synthesis, significantly affecting crop quality [34]. Wheat varieties characterized by low levels of oils, starch, sugars, enzyme activity, and metabolizing energy tend to exhibit higher concentrations of protein, fiber, and ash [35]. Generally, fertilization has a positive effect on the levels of water, protein, fibers, and ash in wheat, while it inversely affects the content of oils, starch, sugars, enzyme activity, and metabolizing energy [36,37].
The quality indices of spring wheat, including protein accumulation and overall grain quality, are significantly influenced by variations in temperature and humidity [38,39]. Water loss can reduce leaf water potentials, leading to decreased turgor, stomatal conductance, and photosynthesis rates. Consequently, this can hinder growth and result in lower yields [40]. The grain filling period is particularly critical, as is the harvest time, when excessive rainfall can cause sprouting within the spike. This increases enzymatic activity, degrades grain quality, and thereby affects the wheat’s suitability for baking [41].
The flag leaf plays a pivotal role in the wheat plant’s overall productivity, notable for being the last part of the plant to dry [42]. It captures a significant amount of light energy, converting it into carbohydrates that are then translocated to the grain [43]. Extensive research supports the flag leaf’s critical contribution to the wheat plant’s lifecycle and productivity. It is responsible for approximately 75–80% of the total photosynthates produced, contributing 75% during grain filling and influencing 41–43% of the grain’s dry matter content at maturity [44,45,46].
This study aimed to quantify the yield, quality, and certain physiological indicators of spring wheat as influenced by weather conditions and fertilizer systems. Additionally, it sought to identify an optimal spring wheat genotype suited to the conditions of the Transylvanian Plain.

2. Materials and Methods

2.1. Biological Materials

Field experiments were conducted over two growing seasons, 2019 and 2020, utilizing six spring wheat genotypes: Pădureni, Granny, Triso, Taisa, Ciprian, and Lennox, as detailed in the Official Catalog of Varieties [47].
The Pădureni genotype (var. ferrugineum) boasts a vegetation period of 113–130 days, with plant heights ranging from 105 to 120 cm, and has awn spikes that are reddish. Thousand kernel weight (TKW) varies between 29 and 38 g, and test weight (TW) can reach 75–80 kg hl−1. It exhibits a medium tillering capacity (2.1 tillers plant−1), moderate tolerance to Erysiphe graminis, Puccinia striiformis, and Septoria tritici, sensitivity to Puccinia recondite, resistance to Fusarium sp., and medium-low lodging resistance.
Granny genotype (var. erythrospermum) has a vegetation period of 107–129 days, with plant heights reaching 80–95 cm, and features white spikes. TKW is between 40 and 41 g with medium TW values. It has an average tillering capacity, good tolerance to Erysiphe graminis, Puccinia recondita, Septoria tritici, and medium tolerance to Puccinia striiformis; high resistance to sprouting; and average lodging resistance.
The Triso genotype (var. lutescens) has a vegetation period of 103–128 days. Plant heights often exceed 100 cm, featuring white spikes. TKW is approximately 37 g, with TW presenting medium values. This genotype is noted for its very good tillering capacity and good tolerance to Erysiphe graminis, Puccinia recondita, Septoria tritici, and Fusarium sp. It has a medium tolerance to Puccinia striiformis, is very resistant to sprouting, and exhibits excellent lodging resistance.
Taisa genotype (var. erythrospermum), a facultative type, spans a vegetation period of 130–270 days. Plant heights range from 90 to 100 cm, with white spikes. TKW values lie between 43 and 47 g, while TW reaches 74–79 kg hl−1. Taisa is characterized by a good tillering capacity (1.7–2.5 tillers plant−1), medium tolerance to Erysiphe graminis, Puccinia recondita, Puccinia striiformis, and Septoria tritici, and a medium-low tolerance to Fusarium sp. It is resistant to sprouting and shows good lodging resistance.
The Ciprian genotype (var. erythrospermum), another facultative type, has a vegetation period ranging from 109 to 265 days. Plants reach heights of 82–85 cm and feature white spikes. TKW varies from 40 to 45 g and TW from 70 to 84 kg hl−1. Ciprian has a very good tillering capacity, with a medium to low tolerance to Erysiphe graminis, medium tolerance to Puccinia striiformis, good tolerance to Puccinia recondita and Fusarium sp., sensitivity to Septoria tritici, and resistance to both sprouting and lodging.
The Lennox genotype (var. lutescens), a facultative type, exhibits a vegetation period ranging from 107 to 271 days. The plants’ height varies between 90 and 100 cm, with spikes that are white. TKW is expected to be between 45 and 50 g, while TW can achieve values of 79–81 kg hl−1. Lennox is distinguished by its very good tillering capacity and exhibits good tolerance to Erysiphe graminis, very good tolerance to Puccinia striiformis, and medium tolerance to Puccinia recondita, Septoria tritici, and Fusarium sp. It also presents resistance to both sprouting and lodging.

2.2. Research Methods

The experiments were conducted at the Agricultural Research and Development Station Turda (ARDS Turda), located in the Transylvania Plain, Romania, at coordinates 46°35′ N latitude and 23°47′ E longitude, and an elevation ranging from 345 to 493 m above Adriatic Sea level. The experimental field is representative of the research area [48], the type of soil being a Phaeozem soil with a loamy-clay texture [49], a neutral pH of 6.8–7.2 (measured potentiometrically in distilled water), clay content between 51.8% and 55.5%, humus content of 2.20–3.12% (determined using the Walkley-Black method), total nitrogen of 0.162–0.124% (measured using the Kjeldhal method), phosphorus levels of 0.9–5 ppm, and potassium levels well supplied at 126–140 ppm (analyzed using the Egner-Riehm-Domingo extraction method) [50,51]. Agrochemical analyzes were conducted on soil samples collected from the arable layer (0–20 cm).
The experimental layout was a randomized block design with three replications. Sowing was conducted on March 4th during both 2019 and 2020, within the optimal sowing window of March 1st to 15th for this region. We utilized a Wintersteiger Plot Seed Drill (Wintersteiger Seedmech GmbH Winter—Steigerstrasse 1, 4910 Ried im Innkreis, Austria) for precise sowing at a seeding rate of 550 germinating grains m−2, with a sowing depth of 4 cm and a row spacing of 12.5 cm. Each harvestable plot covered an area of 7.5 m−2. The previous crop was unfertilized peas.
Additional fertilization was conducted in two stages: in autumn (decade III of September in both experimental years) with N36P92K0 kg ha−1 active substance (F1) and in spring, at head swollen sheath [52], with two different doses (N72 kg ha−1 a.s. and N105 kg ha−1 a.s.).
Weed management was conducted using a foliar herbicide application of 0.12 L ha−1 (Sekator OD), which contains amidosulfuron 100 g L−1 + iodosulfuron—methyl—Na 25 g L−1 + mefenpyr diethyl 250 g L−1 (Safener) + 0.6 L ha−1 (Amino 600), a 2.4 D acid-based product derived from dimethylamine salt. This application occurred when the wheat was in the late tillering phase (BBCH 24–25, according to the Biologische Bundesanstalt, Bundessortenamt und 97 Chemische Industrie) and dicotyledonous weeds were in the 2–4 leaves (BBCH-12–14).
For disease and pest management, two treatments were applied during the growing season. The first treatment consisted of 0.6 L ha−1 (Falcon Pro) fungicide based on prothioconazole 53 g L−1 + spiroxamine 224 g L−1 + tebuconazole 148 g L−1 + 0.2 L ha−1 (Apis 200 SE, Innvigo Sp. zo.o. A. Jerozolimskie 178 02-486, Varșovia, Poland); insecticide based on 200 g L−1 acetamiprid. The second treatment involved 0.7 L ha−1 Nativo 300 SC (trifloxystrobin 100 g L−1 + tebuconazole 200 g L−1) and 0.2 L ha−1 Mavrik 2F (insecticide based on tau-fluvalinate 240 g L−1).
Harvesting was performed using a Wintersteiger Plot Combine (Wintersteiger AG, Ried im Innkreis, Austria) equipped with a 1.4 m working width.
Physiological indicators, including the temperature of flag leaf (T leaf), vapor pressure deficit (VPD), and evapotranspiration (Evap), were measured two weeks after heading using a CIRAS-3, a portable high-precision instrument [53].
The flag leaf area was calculated with the formula A = b × leaf length × max leaf width, where the coefficient b is 0.75 [54]. These measurements were conducted using the classical method at the flowering stage on samples from 30 wheat plants/plot.
Protein content was determined with the Perten Inframatic 9500 analyzer (Perten PerkinElmer Company, U.S. LLC).
The experimental design incorporated three main factors:
Factor Y—Year with 2 graduations: Y1—2019; Y2—2020;
Factor F—Fertilization System with 3 graduations:
F1 = N36P92K0 kg ha−1 active substance (a.s.) applied in autumn (third decade of September in both experimental years);
F2 = F1 (N36P92K0 kg ha−1 in autumn) + N72 kg ha−1 a.s. applied at head swollen sheath;
F3 = F1 (N36P92K0 kg ha−1 in autumn) + N105 kg ha−1 a.s. applied at head swollen sheath;
Factor S—Genotype (variety) with 6 graduations (with different vegetation period):
S1—Pădureni; S2—Granny; S3—Triso; S4—Taisa, S5—Ciprian; S6—Lennox.
Weather conditions (rainfall, temperatures) at the experimental site (March to August 2019 and 2020) were recorded by the Turda Meteorological Station (Table 1; longitude: 23′47—latitude 46′35′—altitude 427 m) [55].
The six-month study period each year showed deviations from the 60-year multi-annual average, both positive and negative. Notably, precipitation peaks were observed in May 2019 (+83.7 mm) and June 2020 (+81.8 mm), while significant temperature deviations occurred in May of both years (−1.5 °C in 2019 and −1.3 °C in 2020), indicating cooler conditions. In 2019, March, June, and July were marked by drought and higher temperatures, compared to 2020. In June 2020, abundant rainfall and high temperatures in the last two decades of the month promoted disease development, leading to premature leaf drying.

2.3. Statistical Analysis

The collected data were analyzed statistically by the standard analysis of variance (ANOVA), using the Poly Fact program Software 2020 [56] and Microsoft Excel Software 2012. The Poly Fact program allowed the execution of Least Significant Difference (LSD) tests at significance levels of 5%, 1%, and 0.1%. The relationship between two variables was determined by the Pearson correlation coefficient using the average of the two continuous years. Biplot analysis in Past 4.03 was used to determine the optimal nitrogen dose at which wheat genotypes achieve high yields under different environmental conditions.

3. Results and Discussions

3.1. Influence of Experimental Factors on Yield, Quality, and Some Physiological Indicators of Spring Wheat

3.1.1. F-Test and Statistical Probability Levels from Analysis of Variance

The analysis of calculated F-values (Table 2) suggests that grain yield across the two experimental years predominantly depended on the year, genotype, and their interaction, with fertilization and the Y × F interaction exerting a lesser effect. No significant variance was observed among F × S and Y × F × S interactions for the grain yield. The results obtained by Kadar et al. [57] show that the experimental years were more important in the interactions with the genotypes than was the N fertilization. Following the research conducted by Szmigiel et al. [58], it was found that grain yield significantly depended on the genotype, nitrogen doses, and weather conditions during the wheat vegetative phase, as well as on the interactions among these factors.
The analysis of variance for protein content indicated variance across all experimental factors and their interactions (Y × F, Y × S). In their studies, Kadar et al. [57] and Sasani et al. [59], concluded that the protein content was significantly influenced by both the year and the genotype. Furthermore, additional research has demonstrated that the protein content in spring wheat varies considerably depending on the wheat genotype and nitrogen dose [57,58,60,61,62].
TKW is chiefly determined by genotype characteristics and environmental conditions, especially water and heat supply during grain formation and filling phases. Disease and pest attacks (notably Fusarium and Septoria), cereal bugs, and trips also influence TKW, a key grain quality indicator, which is notably affected by nitrogen fertilization [63,64]. According to the data obtained, the greatest influence on this quality parameter is attributed to the genotype and to the F × S interaction. In a study carried out by Dobrova et al. [65] conducted was revealed that mineral fertilization, environmental conditions and their interaction significantly impacted TKW.
Year, genotype, and the interaction between year and genotype (Y × S) were the primary sources of variation for test weight, as shown in Table 2. Additionally, N fertilization positively influenced test weight. Our findings are consistent with those of Dobreva et al. [65], who concluded that N fertilization significantly impacts test weight. A higher test weigh was observed in spring wheat fertilized at the flag leaf stage [66].
The F-test values for FLA indicate significant variance attributable to genotype, climatic conditions during the vegetation period, the amount of fertilizer, and the interaction between year and genotype (Y × S).
Data processing reveals that the studied physiological indicators (leaf temperature, vapor pressure deficit, and evapotranspiration) significantly interacted with the experimental factors, as demonstrated by variance analysis. Vapor pressure deficit (VPD), fundamentally important in crop physiology, is a critical variable that drives evapotranspiration [67]. It significantly influences plant growth and is primarily affected by temperature and humidity [68]; specifically, VPD increases as external temperatures rise and air humidity decreases. When exposed to high VPD levels, plants exhibit high transpiration demands, leading to the development of leaves with smaller or less frequent stomata [69], or they may partially close their stomata [70,71]. Furthermore, evapotranspiration regulates energy flow distribution at the leaf surface, which, in turn, influences leaf temperature [72].

3.1.2. The Influence of the Year Factor

Over the two years of study, grain yield varied on average from 4780 to 5000 kg ha−1, with the higher value recorded in 2020. Although, the increase of 200 kg ha−1 observed in 2020 is modest, significant differences between varieties were noted (Table 3).
2020 was a year in which the weather conditions favored significant assimilation of protein substances, averaging to 14.64%. The rainfall in June and temperatures above the multiannual average had a significant contribution to the absorption, metabolism, and translocation of nitrogen into protein assimilates in the grain. These weather conditions also favored good grain, as expressed by the test weight value (77.91 kg hl−1).
FLA had values ranging from 21.09 to 31.26 cm2, as shown in Table 3. The highest value was recorded in 2019, which can be attributed to the amount of rainfall and lower temperatures in May; these conditions led to an extension of the wheat growth and vegetation period.
In all of the study years, TKW (thousand kernel weight) and T leaf (leaf temperature) showed no significant differences compared to the control (Y0—average of the years).
The weather conditions of 2019 ensured lower VPD values than those of the following year, with 1.64 and 2.95 kPa, respectively. The specialized literature indicates that a too low VPD value is generally associated with lower growth rates due to mineral deficiency caused by poor assimilation of soil nutrients [69]. In contrast, between the two experimental years, a difference of 1 mmol m−2 s−1 was registered in Evap. In 2019, evapotranspiration rates significantly increased with flag leaf area [73], achieving mean values of 1.83 mmol m−2 s−1.

3.1.3. The Influence of Nitrogen Fertilization

Nitrogen is a crucial nutrient for the growth, development, and grain quality of wheat plants [74]. Table 3 shows that increasing nitrogen doses resulted in average yield increases of 392 kg ha−1 in F2 and 616 kg ha−1 in F3, respectively, when compared to the control (F1). According to other researchers’ results, a norm of 120 kg N ha−1 was identified as the most effective for enhancing grain yield, achieving a 76.2% increase over the control [65]. Similarly, Kadar et al. [57] reported production increases of over 600 kg ha−1 when using N100 fertilize compared to N50.
The protein content of spring wheat can be improved by adjusting the N dose [75]. Data in Table 3 indicate that protein content increased with rising N doses from 12.41 to 14.72%, with the lower value attributed to the control (F1). Nitrogen has been proven to be an effective tool for increasing protein content, as evidenced by the findings of Kadar et al. [57], who reported an increase from 11.5 to 13.2%, Szmigiel et al. [58], who observed an increase from 13.06 to 15.18%, and Jahan et al. [63], who documented an increase from 10.06 to 11.38%.
Compared to the control, fertilization levels F2 and F3 showed significant increases in test weight by 0.78 kg hl−1 and 1.02 kg hl−1, respectively. However, other studies have reported that nitrogen fertilization did not have a significant impact on test weight [66].
Increasing the fertilizer amount resulted in a TKW increase of only 1.74 g at the F2 fertilization level, with these differences not being statistically significant when compared to the control (F1).
Compared to the control (F1), the largest flag leaf area measuring 29 cm2 was observed at the F2 fertilization level, significantly enhancing evapotranspiration to 1.44 mmol m−2 s−1 [73]. Furthermore, at this same fertilization level (F2), the average leaf temperature (T leaf) and vapor pressure deficit (VPD) significantly decreased by 0.39 °C and 0.17 kPa, respectively, in comparison to the control.

3.1.4. The Influence of the Genotype Factor

Upon analyzing the influence of the genotype factor (S), it’s observed that the Triso and Lennox genotypes outperformed the control (S0—average of the genotypes) by 13.8% and 11.5%, respectively. In contrast, the Pădureni and Taisa genotypes showed yield decreases of 12.5% and 16.5%, respectively, compared to the control’s average yield. The average protein content was recorded at 13.65%. Against this average, Pădureni, Taisa, and Ciprian exhibited the highest protein contents. Among them, Ciprian was the only genotype to show a significant increase in TKW by 3.1 g (9.1%) compared to the control.
Triso and Lenox distinguished themselves with the highest TW values, exceeding 78 kg hl−1. In contrast, Taisa exhibited the lowest TW at 74.53 kg hl−1. Ciprian’s TW, recorded at 77.44 kg hl−1, was close to the average across the varieties, with the differences deemed insignificant.
Taisa and Pădureni exhibited the highest flag leaf area (FLA) values at 33.81 cm2 and 29.81 cm2, respectively, whereas Lennox and Triso showed the lowest FLA values at 18.75 cm2 and 19.89 cm2, respectively. In terms of vapor pressure deficit (VPD), Lennox and Granny had the lowest values, 2.21 kPa and 2.24 kPa, respectively, compared to the control. Taisa recorded the highest VPD value at 2.35 kPa. Leaf evapotranspiration intensity varied by genotype, with Granny and Lennox statistically surpassing the control, while the results for Pădureni and Taisa were lower compared to the control (S0—average of the genotypes).

3.2. Influence of Double Interactions on Yield, Quality, and Some Physiological Indicators of Spring Wheat

The yield of the Triso and Lennox genotypes increased with N doses, reaching up to 6000 kg ha−1, as depicted in Figure 1a. In contrast, compared to the control (F1), the Taisa and Ciprian genotypes did not exhibit significant increases in grain yield with increased nitrogen application.
The average yields at fertilization levels F2 and F3 were closely matched, at 4953 and 5178 kg ha−1, respectively. This outcome suggests that the highest rate of N does not necessarily justify its use. (Figure 1b). The data indicate an optimal N dose for increasing spring wheat yield is around 110 kg N ka−1. These findings align with previous studies [57,58,65,76], which also observed a plateau in grain yield beyond this N dose. For instance, Jahan et al. [62] found that grain yield increased with N application up to 150 kg urea ha−1, beyond which it showed a declining trend up to a 200 kg ha−1 N application.
The biplot analysis depicted in Figure 2a explains 98.2% of the variance and illustrates that the Triso, Lennox, and Taisa genotypes achieve high yields at the F2 fertilization level, suggesting that applying a higher nitrogen dose is not beneficial. The Ciprian and Granny genotypes are minimally affected by the highest nitrogen dose (F3). Pădureni was the sole genotype that showed a significant yield increase in response to the highest nitrogen dose.
In the analysis of genotype × weather conditions interaction (Figure 2a), the principal component analysis reveals that 99.9% of the variance is accounted for, indicating that genotypes positioned closer to the PC2 line of the biplot (Triso and Lennox) exhibit no susceptibility to environmental interactions. Conversely, genotypes positioned further from the origin of the biplot are more sensitive and demonstrate significant interaction effects [77,78]. This genotype × weather conditions interaction results in differential responses among genotypes: Ciprian and Taisa yielded higher in the 2019 conditions, whereas Granny and Pădureni performed better in 2020. Notably, Pădureni and Taisa produced the lowest yields in both years.
Compared to the control (F1), an increase in N doses led to higher protein content across all studied genotypes, showing a rise of 8–13% in F2 and by 13–23% in F3. Specifically, the Ciprian, Pădureni, and Taisa genotypes exhibited the highest protein increases, at 16%, 15.68%, and 15.43%, respectively (Figure 3a). Similarly, Subedi et al. [76] observed protein content increases of 6–17% in the AC Brio spring wheat variety with higher N doses in Ottawa. Szmigiel et al. [58] found that the protein content in the Bombona and Tybalt genotypes increased from 13.06 to 15.18% with the application of the highest dose of 150 N kg ha−1. Additionally, other research corroborates that wheat grain protein content escalates with the amount of N applied, aligning with our findings [79,80,81].
Although the mean value of the protein content increases with the increase in N dose, at the same dose of N applied, wheat genotypes with higher yield potential, such as Granny, Triso, and Lennox, tend to have lower protein contents than genotypes with lower yield potential. Even at the highest N dose, these genotypes barely achieve 14% protein content (Figure 3b). Our findings are consistent with those of those who reported similar results [61,82].
Orloff [61] found that late-season N applications, specifically between the boot and flowering stages, were crucial for increasing grain protein content but had a minimal impact on yield. Our results align with this observation, notably because the additional N was applied before the heading stage. In essence, with a suitable nitrogen level, the grain protein content can be boosted without causing a decline in yield [75].
Typically, spring wheat genotypes exhibit a low TKW. However, the Pădureni, Granny and Ciprian genotypes show a significant increase in their TKW when nitrogen levels are supplemented, as demonstrated in Figure 4a. Conversely, although Taisa starts with the highest TKW at the F1 fertilization level, its TKW significantly decreases with increased nitrogen doses (F3). This trend can be attributed to Taisa’s late-maturing nature, characterized by a longer growth cycle. The application of nitrogen extends the vegetation period and delays heading, making grain filling more susceptible to the impact of the summer drought.
Increasing the dose of N resulted in a higher mean value of TKW by 1.09 g in F2 and by 1.74 g in F3 compared to the control (F1). However, this does not imply that the additional N was utilized equally by all studied genotypes. When compared to the control (S0—the mean of genotypes), at increased N levels, only Ciprian (39.18 g in F2) and Grany (39.70 g in F3) exhibited higher mean values for TKW, as shown in Figure 4b. Therefore, this quality parameter is primarily dependent on the genotype and is not significantly influenced by N fertilization.
Dobreva et al. [65] found that TKW was most affected by N160, showing a 13.3% increase over the control (N0). Contrarily, a study by Noor et al. in 2023 observed a decrease in TKW with higher nitrogen application rates, specifically from N150 to N210 [71]. Szmigiel et al. [83], reported that N fertilization levels positively influenced TKW up to a dose of 60 kg N ha−1.
The impact of nitrogen on test weight varied among genotypes [84,85]. Besides genotype, the timing of fertilizer application was critical for increasing test weight. In our study, nitrogen supplementation at stage 10—boot, head swollen in steath [52]—had a positive impact on the genotypes Pădureni, Triso, and Lennox (Figure 5a). This finding aligns with other studies where nitrogen application at the anthesis stage [86] or later in the growing season [85] yielded similar benefits. Conversely, Taisa, a late-maturing genotype, exhibited a negative response to additional nitrogen application, recording values 1.8% lower (equivalent to 1.35 kg hl−1) than the control (F1), a trend also observed in other research [87].
Relative to the control (S0—mean of genotypes), the increased doses of nitrogen (F2 and F3) significantly enhanced the test weight for the Pădureni, Triso, and Lennox genotypes, as illustrated in Figure 5b. Accordingly, by the standards set by the Order of the Agriculture and Rural Development Minister no. 228/2017 [88], these three genotypes are classified under quality grade 1 (>77 kg hl−1). Meanwhile, Granny and Ciprian are categorized under quality grade 2 (75–77 kg hl−1), and Taisa falls into quality grade 3 (72–75 kg hl−1).
Walsh and Walsh [66] reported higher test weights at both experimental locations (Teton and Pondera) for plots fertilized with 140 kg N ha−1 at the flag leaf stage. Similarly, Protic et al. [26] observed significant increases in test weight with N60 and N90 doses, especially when the preceding crop was sunflower and the basic fertilization regimen included N30P60K40.
The flag leaf area of the studied genotypes reached its highest mean values at the F2 fertilization level, ranging from 20.4 cm2 (Lennox) to 37.47 cm2 (Taisa). At the F1 (control) and F3 fertilization levels, the Triso and Lennox genotypes exhibited the smallest flag leaf areas, which did not exceed 19 cm2 (Figure 6a).
In Figure 6b, it is evident that the flag leaf area of the Triso and Lennox genotypes experienced significant reductions compared to the control (S0—mean of genotypes). For Triso, these differences ranged from 5.96 to 6.72 cm2, and for Lennox, from 5.52 to 8.6 cm2. Notably, in the Lennox genotype, the highest N dose appeared to inhibit leaf growth, with a decrease of 3 cm2 in F3 compared to F2, and 1 cm2 compared to F1.
Plants in different environments have different strategies for regulating leaf temperature, such as smaller leaves, spiny or succulent leaves to minimize transpiration, and hairs that reflect radiation, while the contribution of transpiration to leaf cooling is often ignored. Leaf temperature is influenced by air temperature and controlled by leaf traits [89]. Flag leaf temperature responses to nitrogen doses varied among genotypes, with temperatures ranging from 26.3 to 26.88 °C in Pădureni, 26.27 to 27.20 °C in Granny, 26.30 to 27.20 °C in Triso, 26.70 to 27.45 °C in Taisa, 26.43 to 27.18 °C in Ciprian, and 26.45 to 26.90 °C in Lennox, as illustrated in Figure 7a. Increasing the N dose to F2 resulted in a cooling effect on the flag leaves of the Granny, Triso, Taisa, and Ciprian genotypes. This cooling effect remained consistent in Taisa, even at the highest N dose. Conversely, in Pădureni, an increase in N dose led to a significant rise in leaf temperature, by 0.50 °C at F2 and by 0.58 °C at F3.
The average flag leaf temperature was consistent between the F1 and F3 fertilization levels, whereas it was approximately 0.4 °C lower at the F2 level, as depicted in Figure 7b. At the F1 level, compared to the control (S0—mean of genotypes), Pădureni and Lennox exhibited the lowest leaf temperature, whereas Taisa recorded the highest. With increased N doses, the leaf temperature values were close to those of the control (S0—mean of the genotypes) [51].
According to Figure 8a, at the F2 fertilization level, compared to the control (F1), the Granny, Triso, Taisa, and Ciprian genotypes recorded the lowest VPD values, with decreases ranging from 0.32 to 0.35 kPa. These reductions are linked to the lower leaf temperatures observed (refer to Figure 7a). Furthermore, at the highest N dose (F3), these values did not surpass the control. Additional N fertilization resulted in a significant rise in flag leaf temperature for the Pădureni and Lennox genotypes, leading to notable increases in VPD values by 0.15 (F3) to 0.22 (F2) kPa for Pădureni and by 0.09 (F2) to 0.23 (F3) kPa for Lennox, as shown in Figure 8a).
The lowest mean value of VPD, at 2.18 kPa, was observed at the F2 fertilization level, as shown in Figure 8b. At this level, Granny and Ciprian exhibited the lowest VPD values, whereas Pădureni recorded the highest VPD at 2.41 kPa, surpassing the control by 0.23 kPa. While the average VPD values at the F1 and F3 fertilization levels were consistent at 2.35 kPa, F1 presented significant genotype-dependent differences.
Lennox stands out as the only spring wheat genotype exhibiting a linear increase in leaf temperature and VPD with each increment in nitrogen dose.
The existing literature suggests that high VPD correlates with low Evap rates, and conversely, low VPD is associated with high Evap rates [90]. This relationship is emphasized in our findings, as illustrated in Figure 9. When comparing with the control (F1), significant differences at the F2 level were statistically validated: positive changes for the Granny, Triso, Taisa, and Ciprian genotypes, and negative for Pădureni and Lennox. At the highest doses of nitrogen (F3), all the studied genotypes exhibited lower evapotranspiration rates than the control variant (F1), with these differences being statistically very significant (Figure 9a).
Evapotranspiration plays a crucial role in regulating energy flux partitioning at the leaf surface, which, in turn, can reduce leaf temperature by consuming energy [72].
The most pronounced leaf evapotranspiration was observed at the F2 fertilization level, whereas the lowest evapotranspiration rate was noted at the highest nitrogen dose, as depicted in Figure 9b. At the lowest nitrogen dose, Pădureni and Lennox exhibited increased evapotranspiration intensity, significantly surpassing the control (S0—mean of genotypes). At the intermediate level of fertilization (F2), Granny, Triso, and Ciprian were distinguished by the highest evapotranspiration rates, notably exceeding the genotype average (S0). Conversely, the Pădureni and Taisa genotypes demonstrated the least intense evapotranspiration, with these differences being statistically very significant. At the highest level of fertilization (F3), leaf-level evapotranspiration was most intense in the Granny and Lennox varieties, while Taisa showed the lowest rate, with the differences compared to the control (S0) being very significant.

3.3. Influence of Triple Interactions on Yield, Quality, and Some Physiological Indicators of Spring Wheat

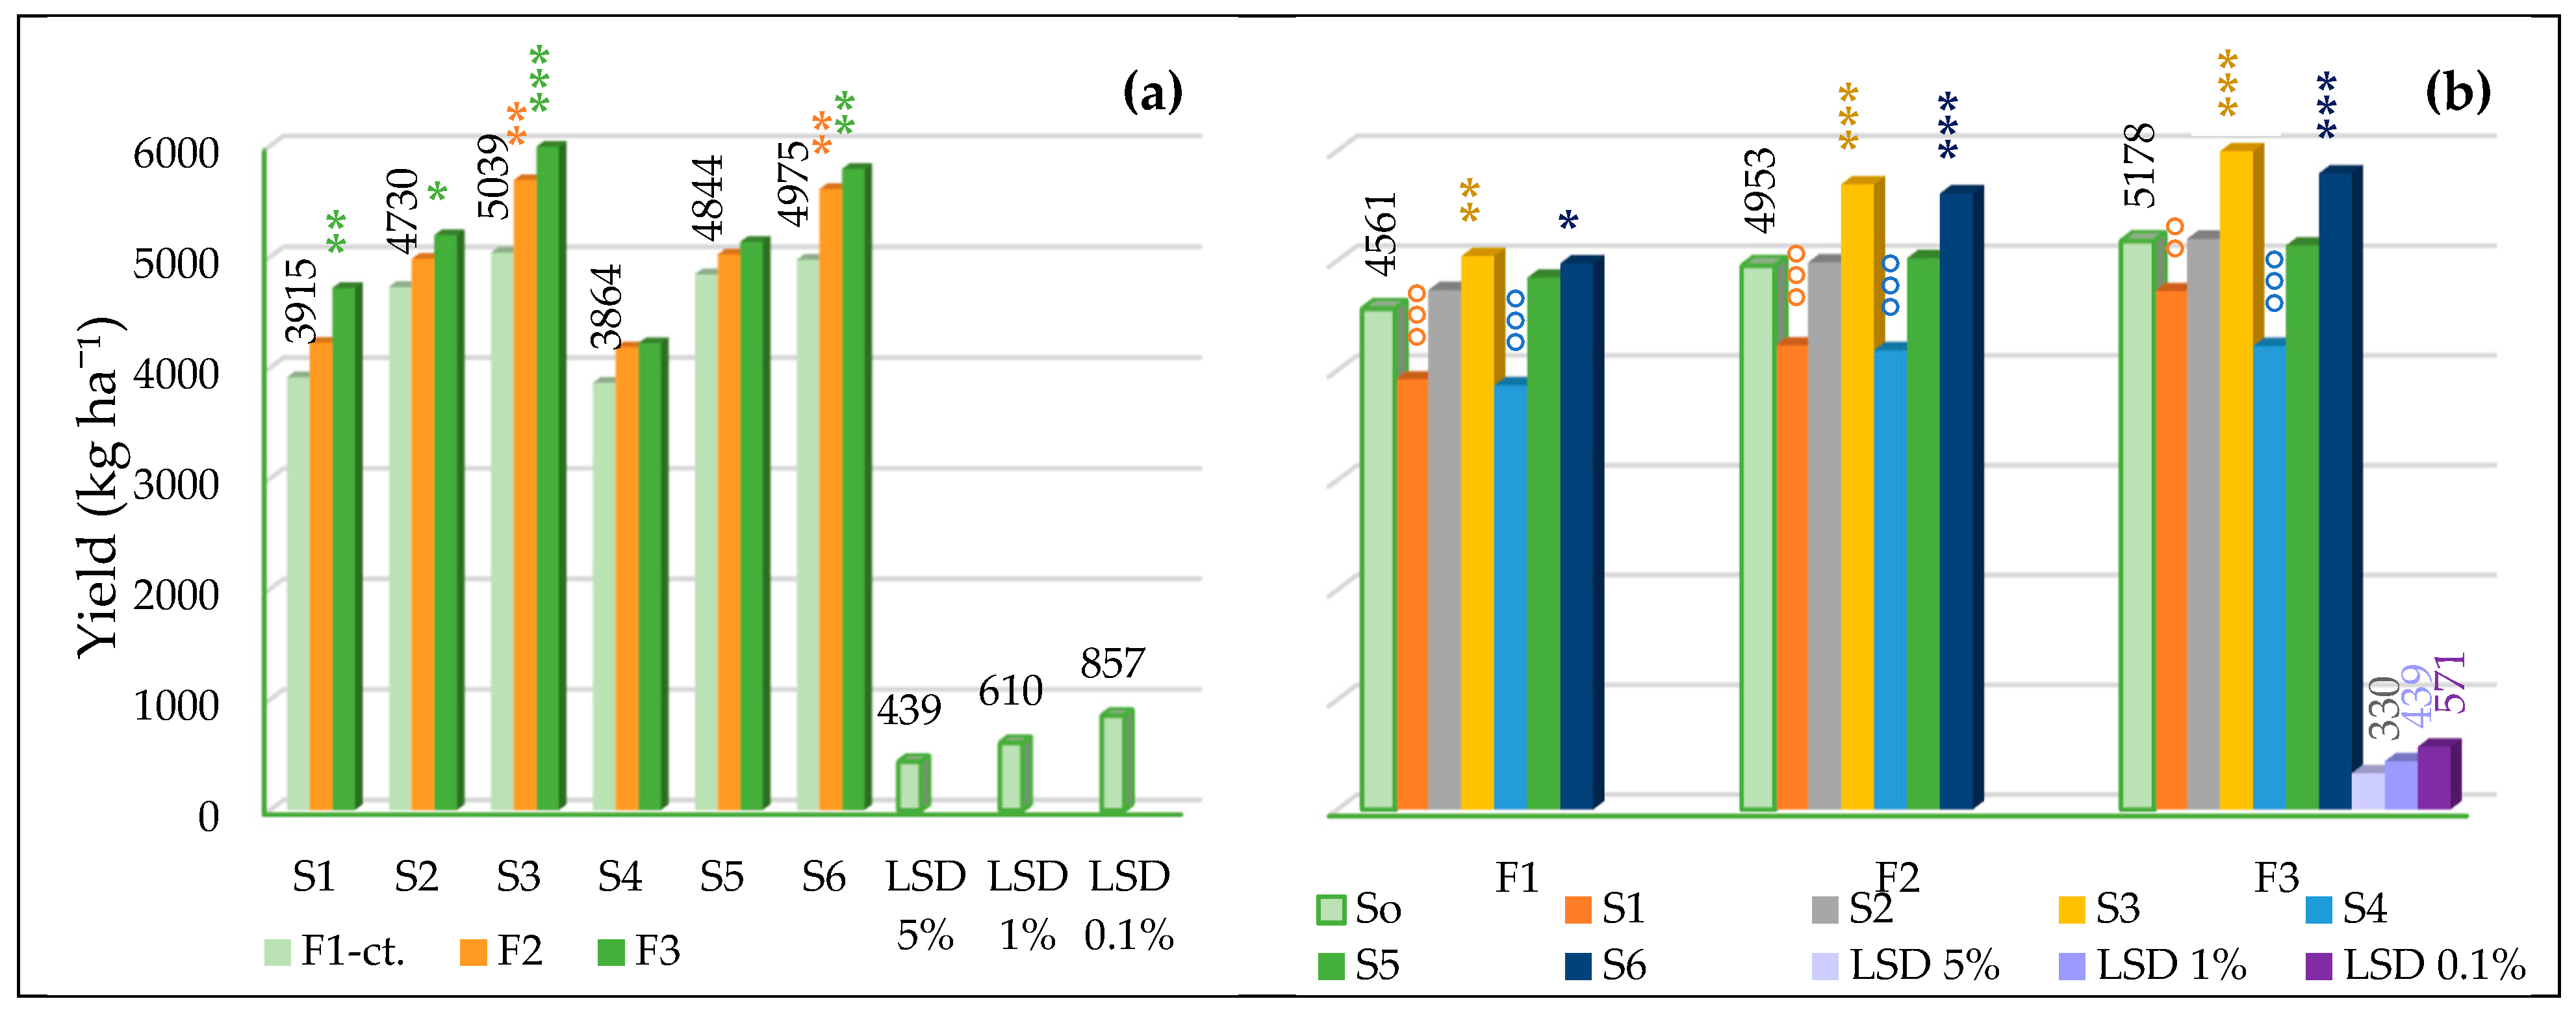
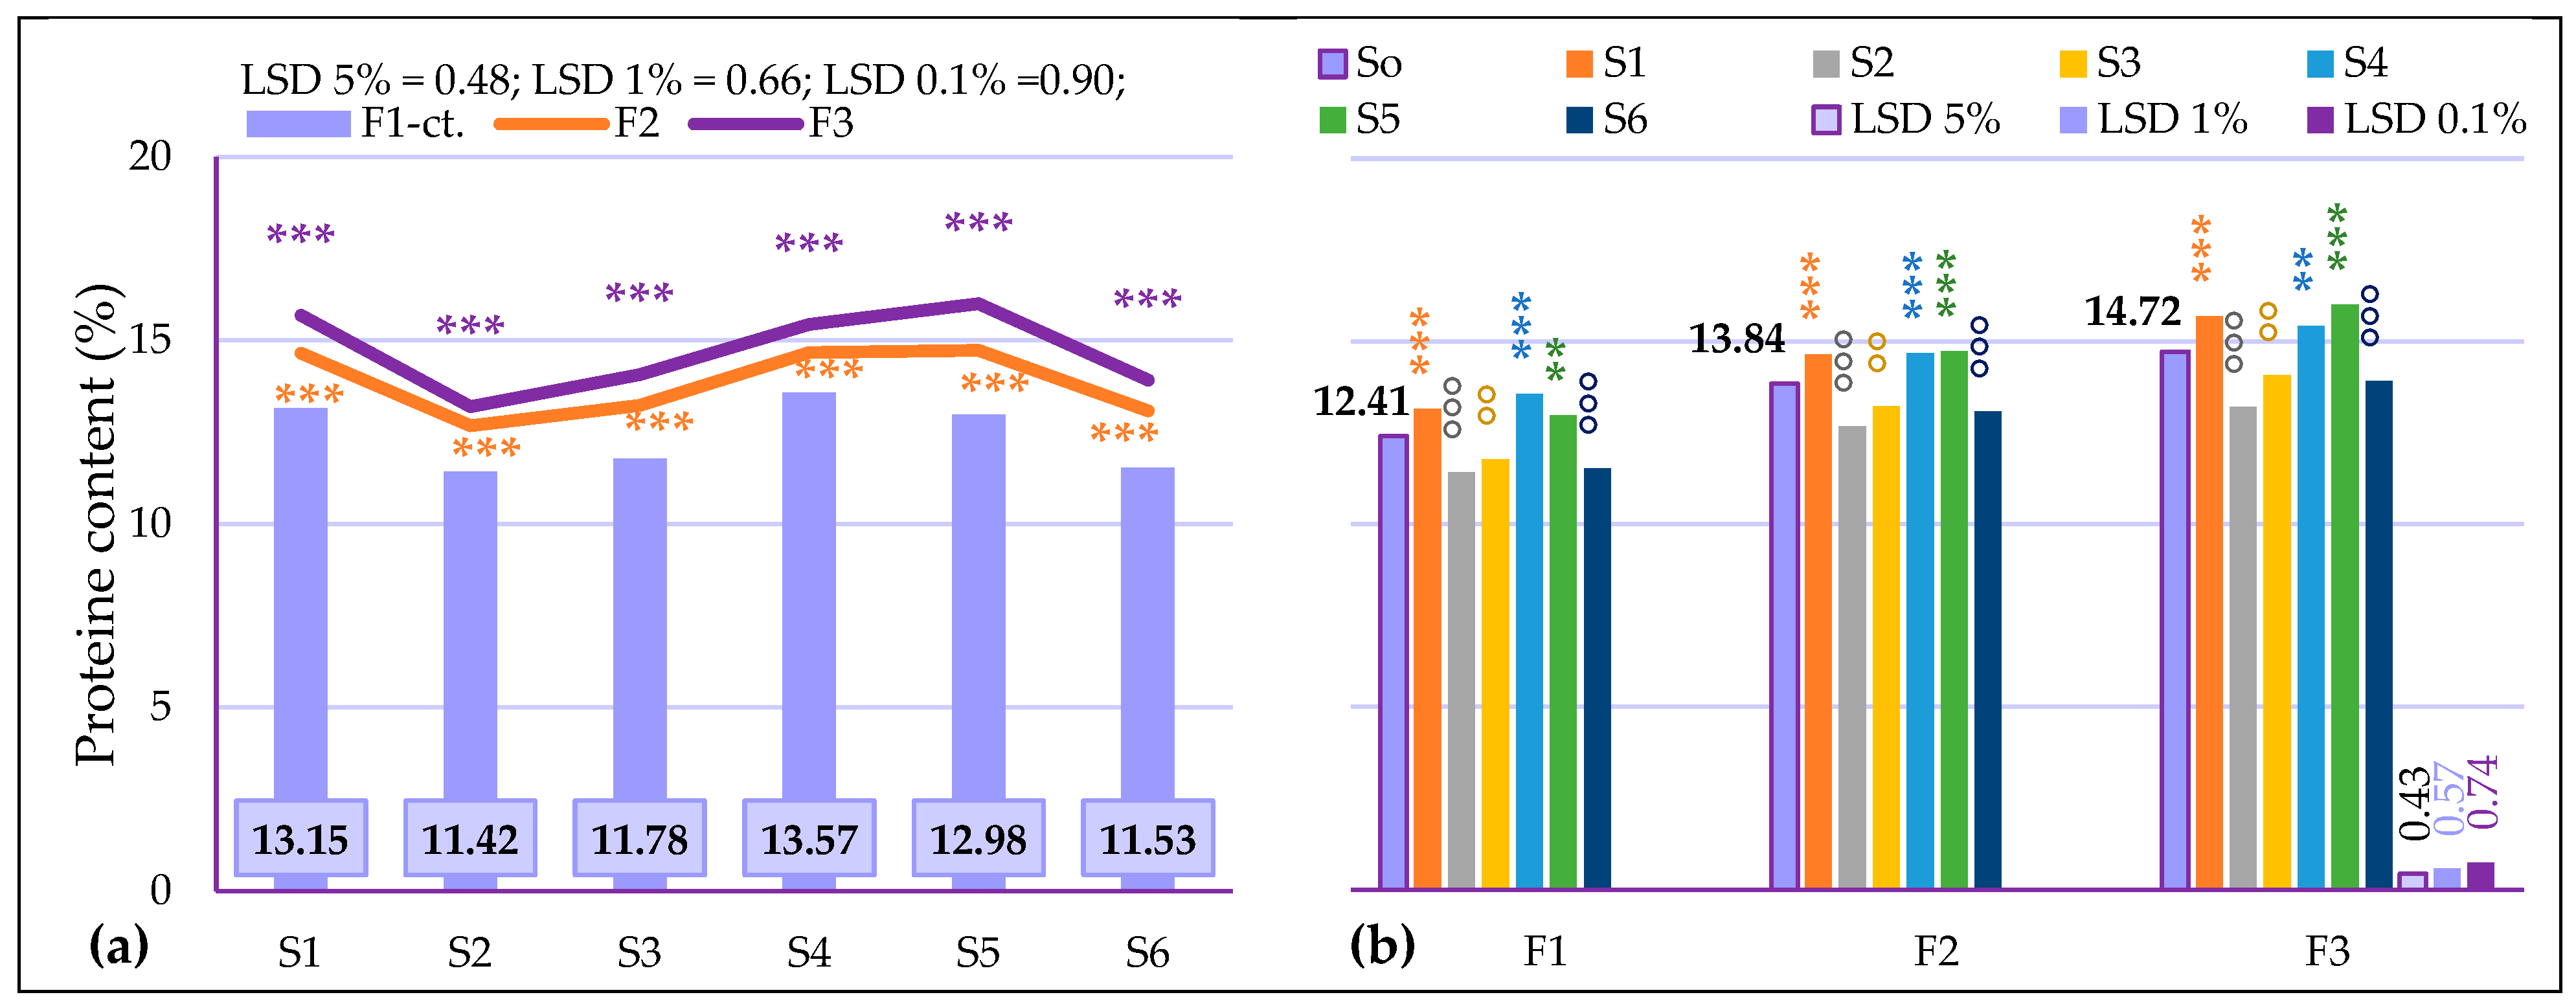
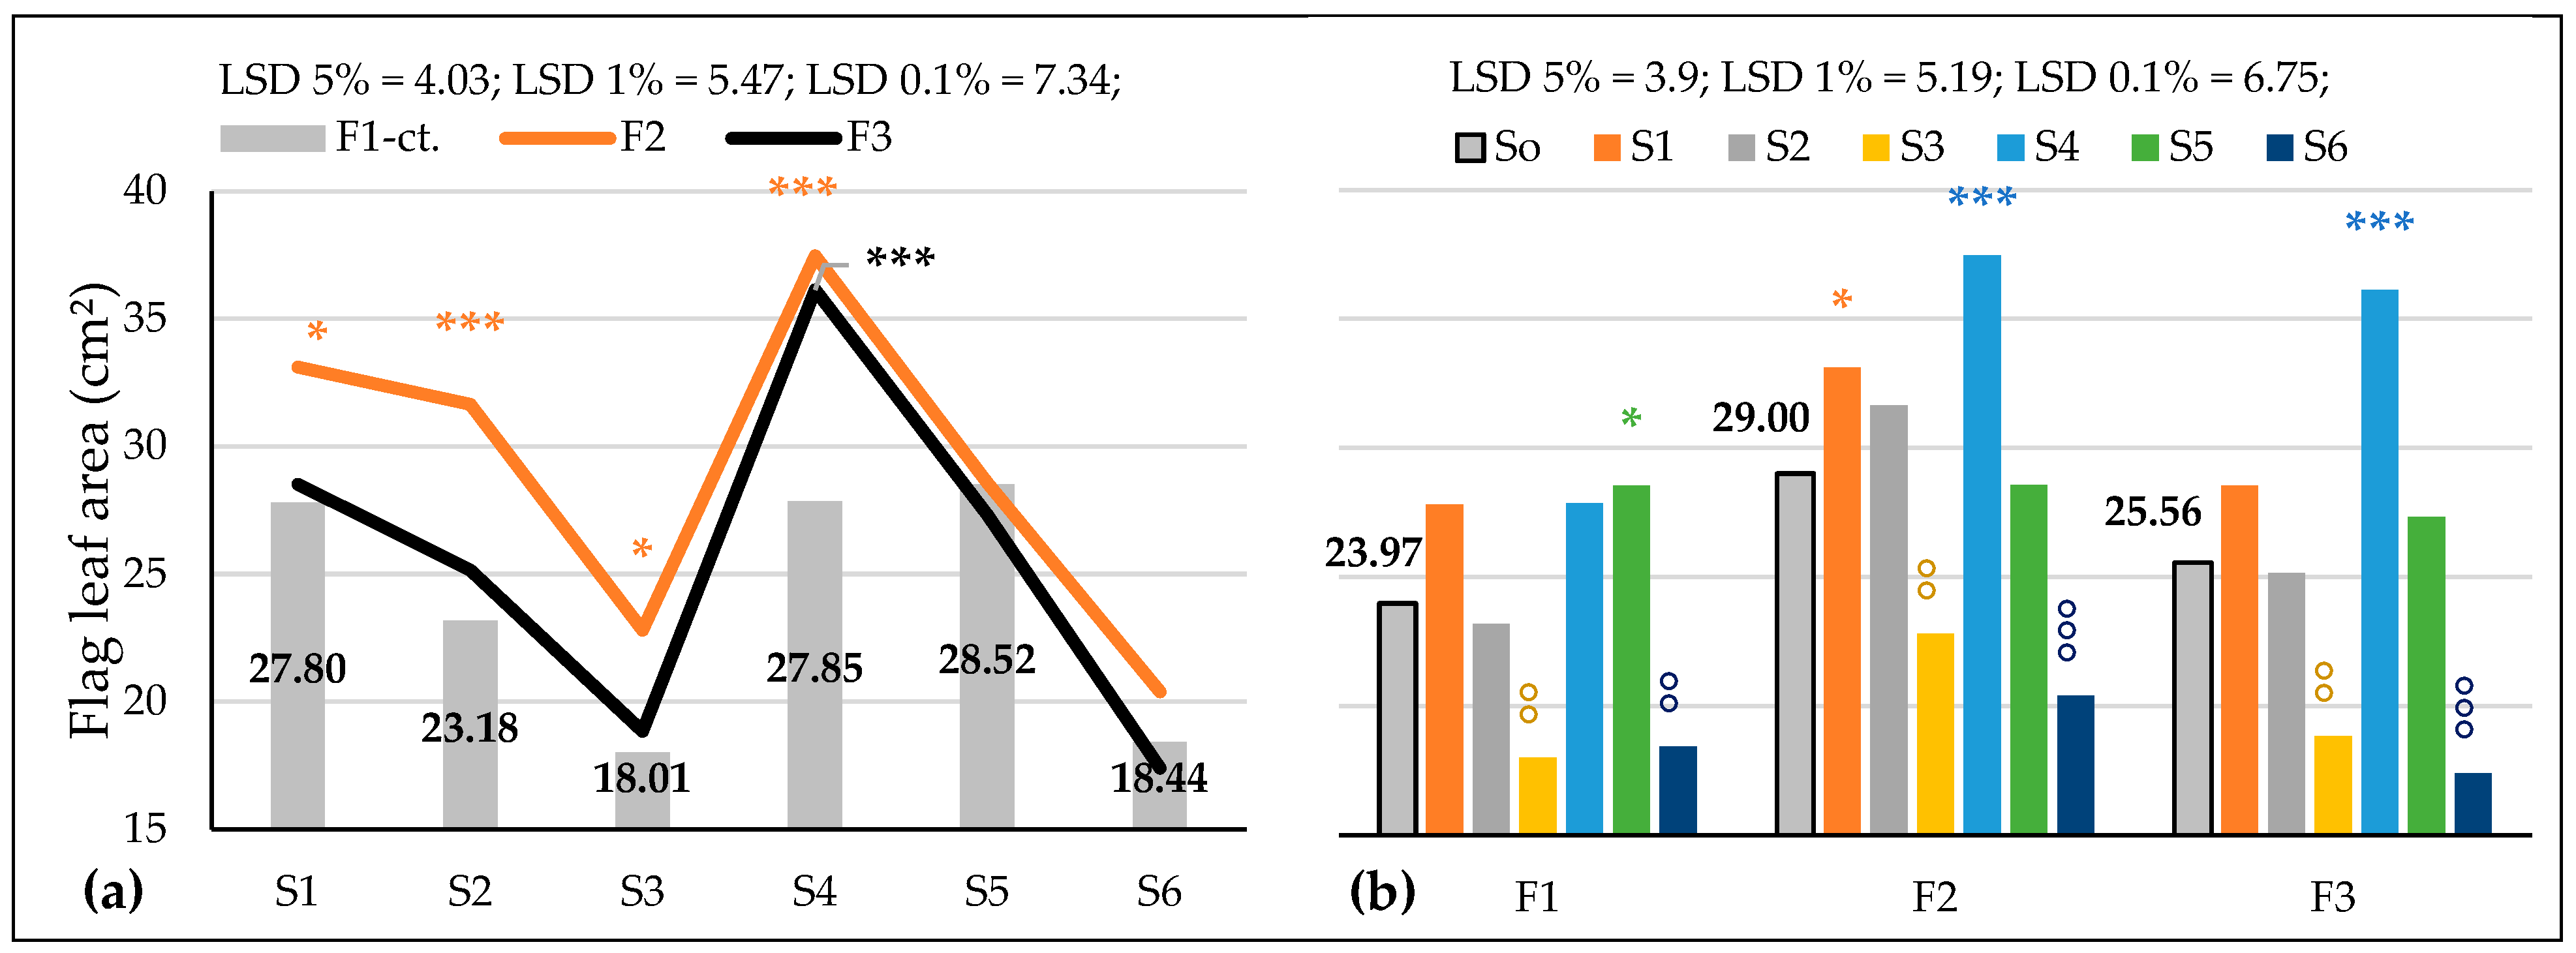
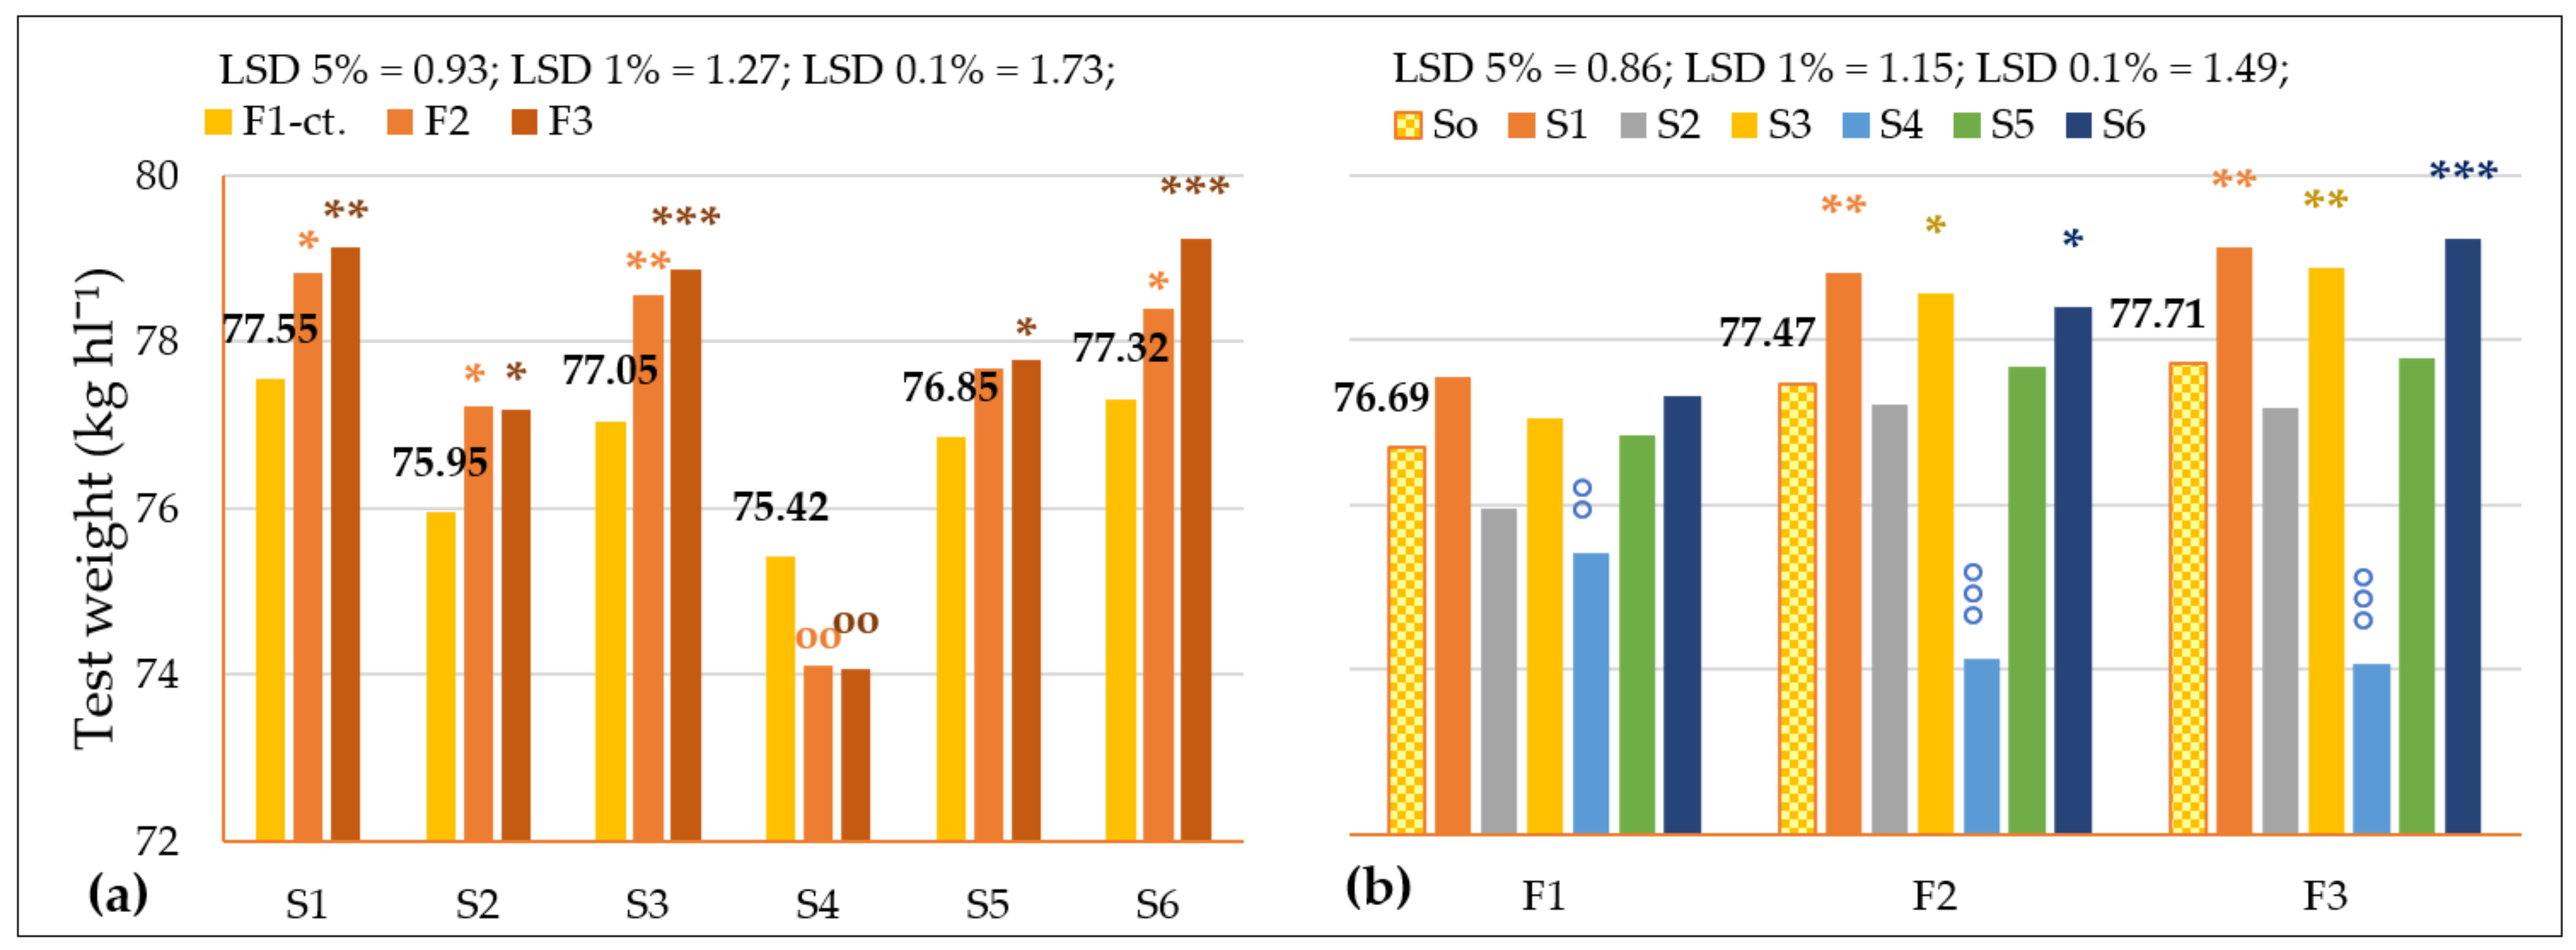
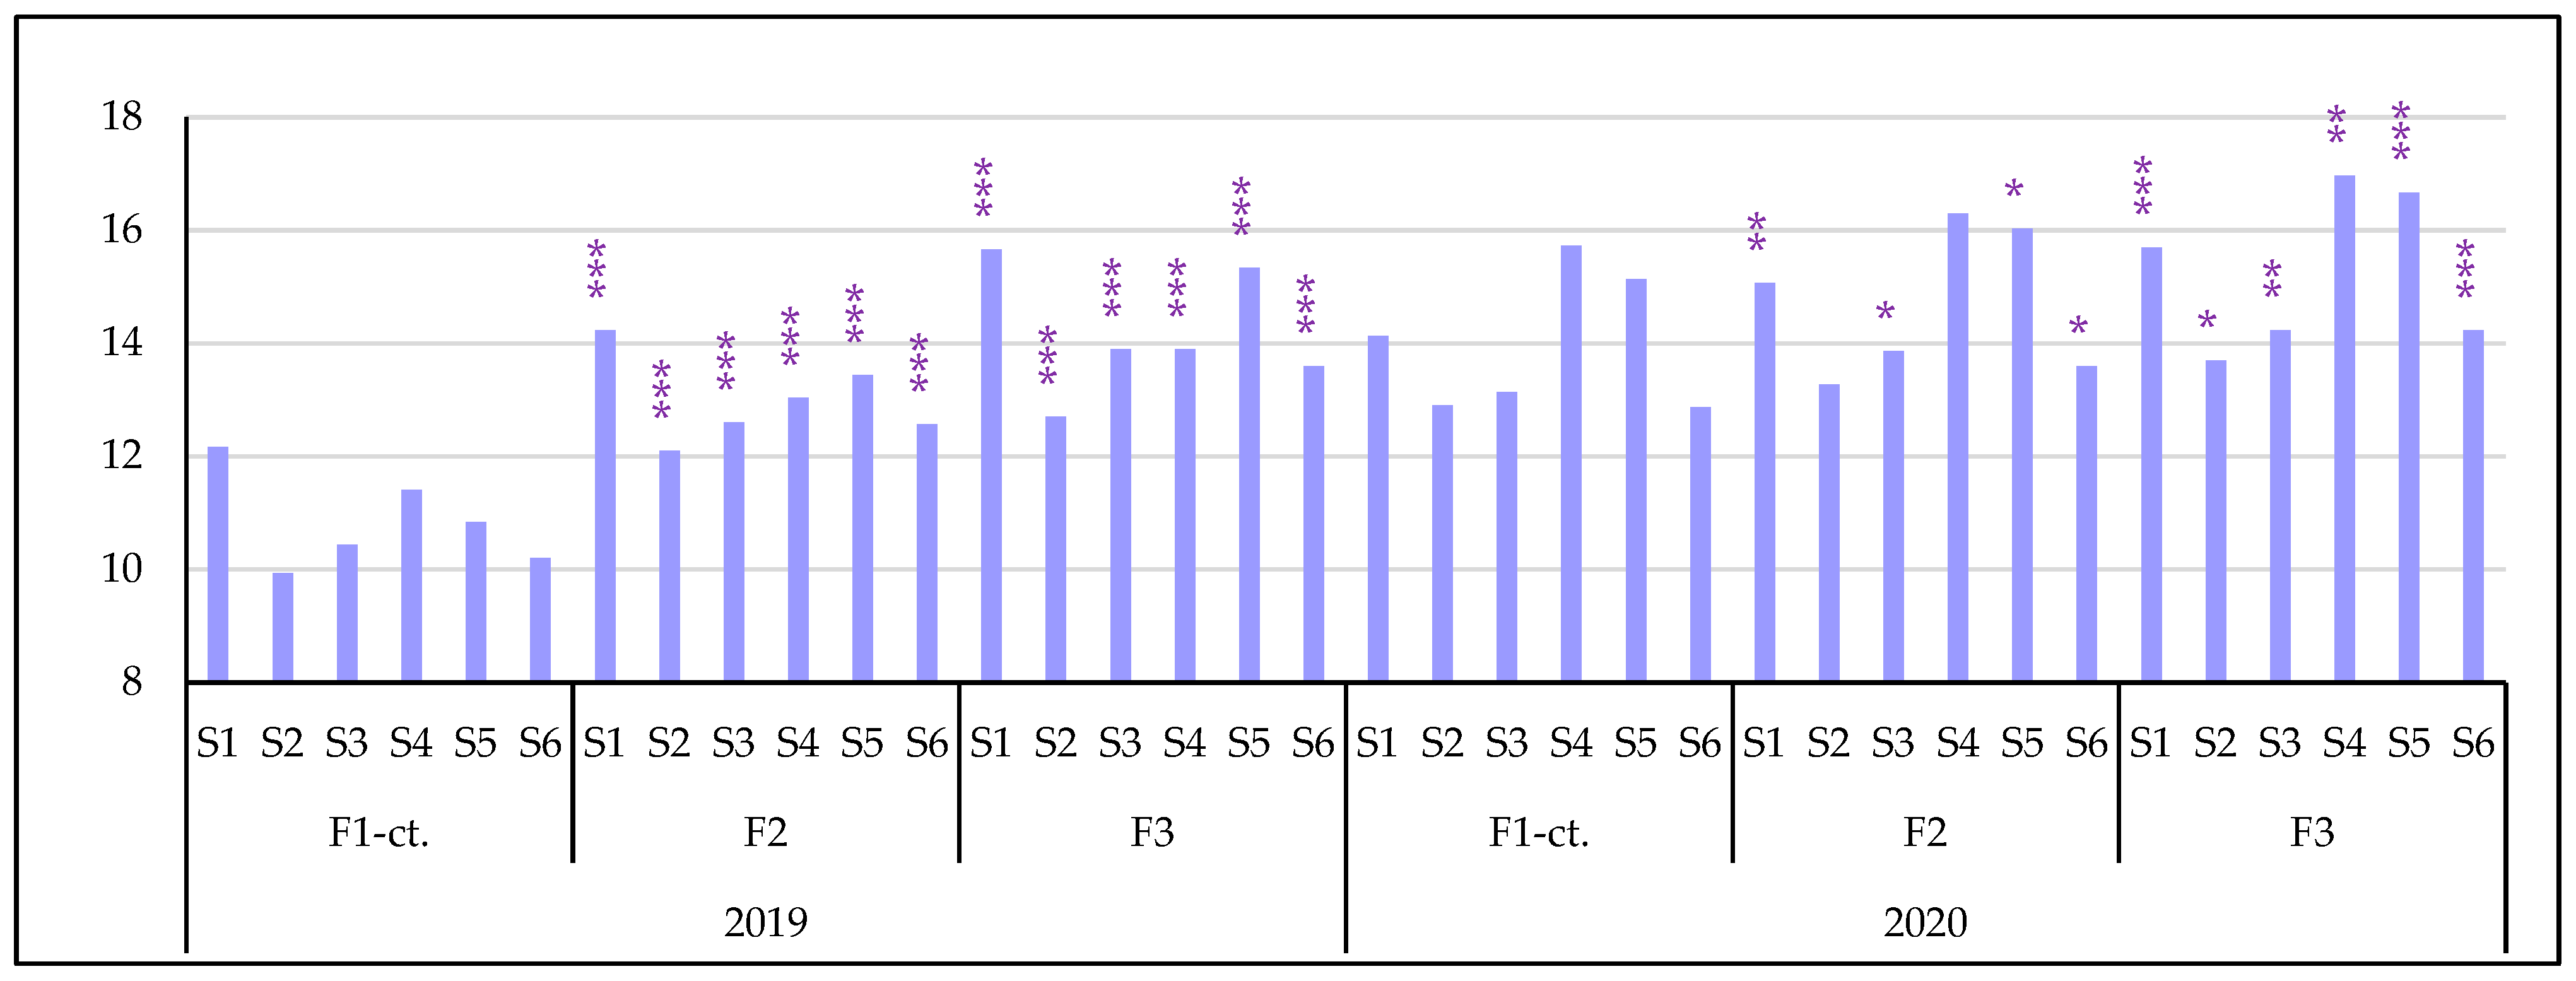
3.3.1. The Influence of the Triple Interactions on Yield and Quality of Spring Wheat

Weather conditions and fertilizer systems had distinct impacts on the studied genotypes [57,65,66,71,75], yet they did not significantly alter the average yields observed across the two experimental years (4796 kg ha−1 in 2019, 4999 kg ha−1 in 2020). In 2019, excessive rainfall in May (83.4 mm) promoted the robust growth and vegetative development of spring wheat. This, in conjunction with increased nitrogen doses, led to notable improvements in yield and test weight, as shown in Figure 10. Similarly, in June 2020, precipitation exceeded the multi-year average by 81.8 mm, facilitating uniform yields across enhanced nitrogen levels without statistical discrepancies. This also positively influenced grain filling and density, as indicated by the average values of TKW and TW. The genotypic response to weather conditions varied, with the Triso and Lennox genotypes achieving higher yields in both years. Contrasting with our findings, Warechowska et al. [84] reported significant variations in grain yield among varieties across two growing seasons (2009 and 2011), which markedly affected overall crop yield.
TW was influenced by a combination of weather conditions, the fertilization system, and the genotype itself, with the Lennox and Triso genotypes reporting higher TW values. The addition of fertilization at the F3 level yielded the highest TW in both seasons (2019 and 2020). A similar pattern of increased TW in response to foliar urea application was observed in the Radunia variety, as reported by another study [84].
The precipitation in June 2020, in combination with the increased doses of nitrogen, led to an extended vegetation period for the Taisa genotype, a late-maturing variety. As a result, while TKW saw an average increase of 6.61 g, the average yield experienced a significant decrease of 418 kg ha−1. This reduction can be attributed to inadequate filling of grains at the spike’s top, impacted by high temperatures in July, and a decline in grain density/weight due to rainfall during the ripening period (from the end of July to the beginning of August). These factors collectively contributed to an average decrease in test weight (TW) by 6 kg hl−1.
The triple interaction of factors—fertilization, year, and genotype (F × Y × S)—demonstrates that in 2019, additional fertilization (F2, F3) notably enhanced crop quality, showing significant improvements over the control (F1). In 2020, particularly at the F3 fertilization level, there were very significant increases in protein content, as illustrated in Figure 11.

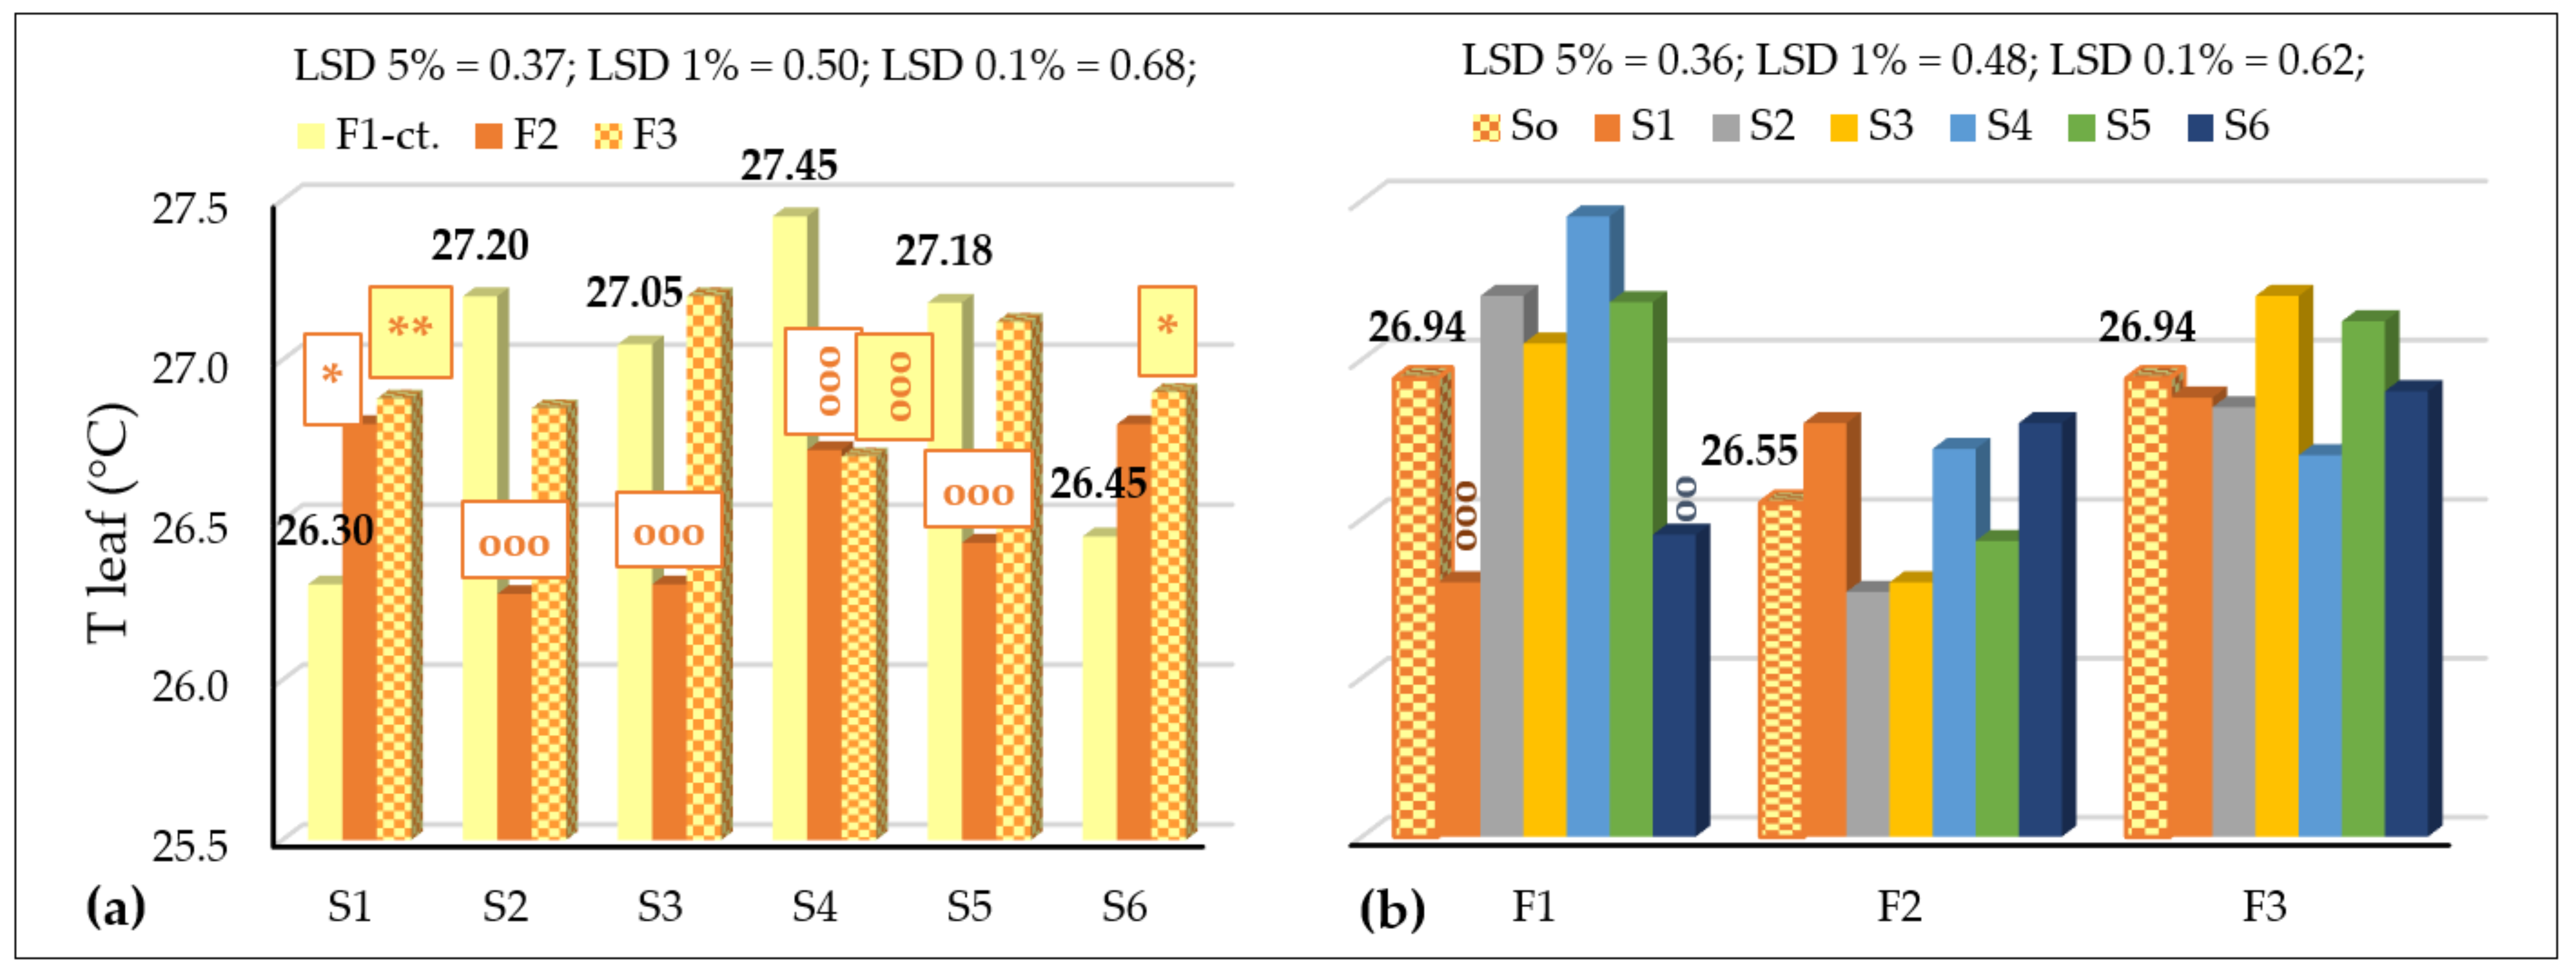
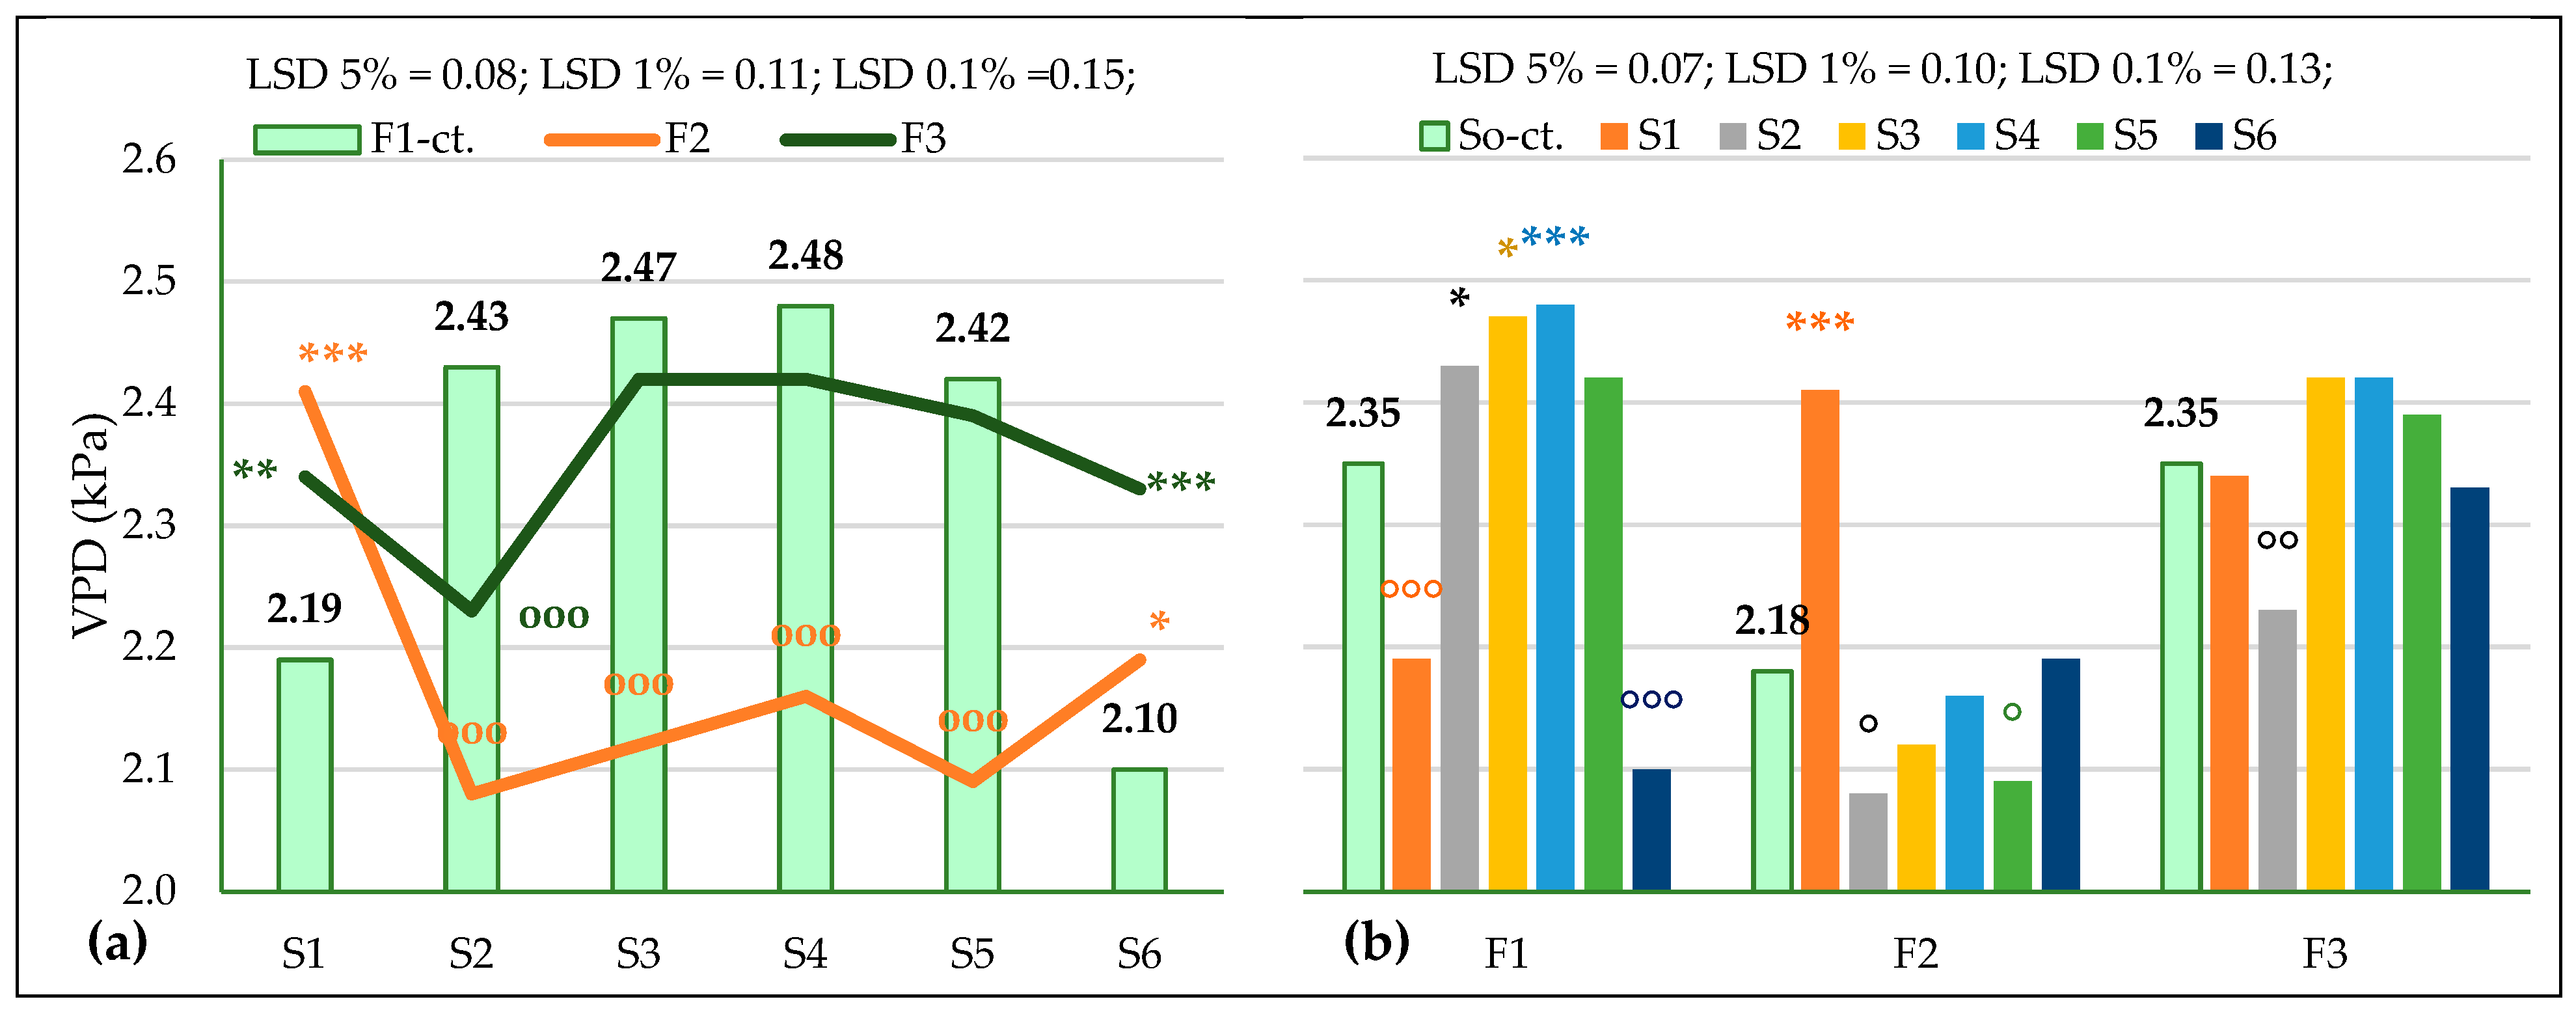
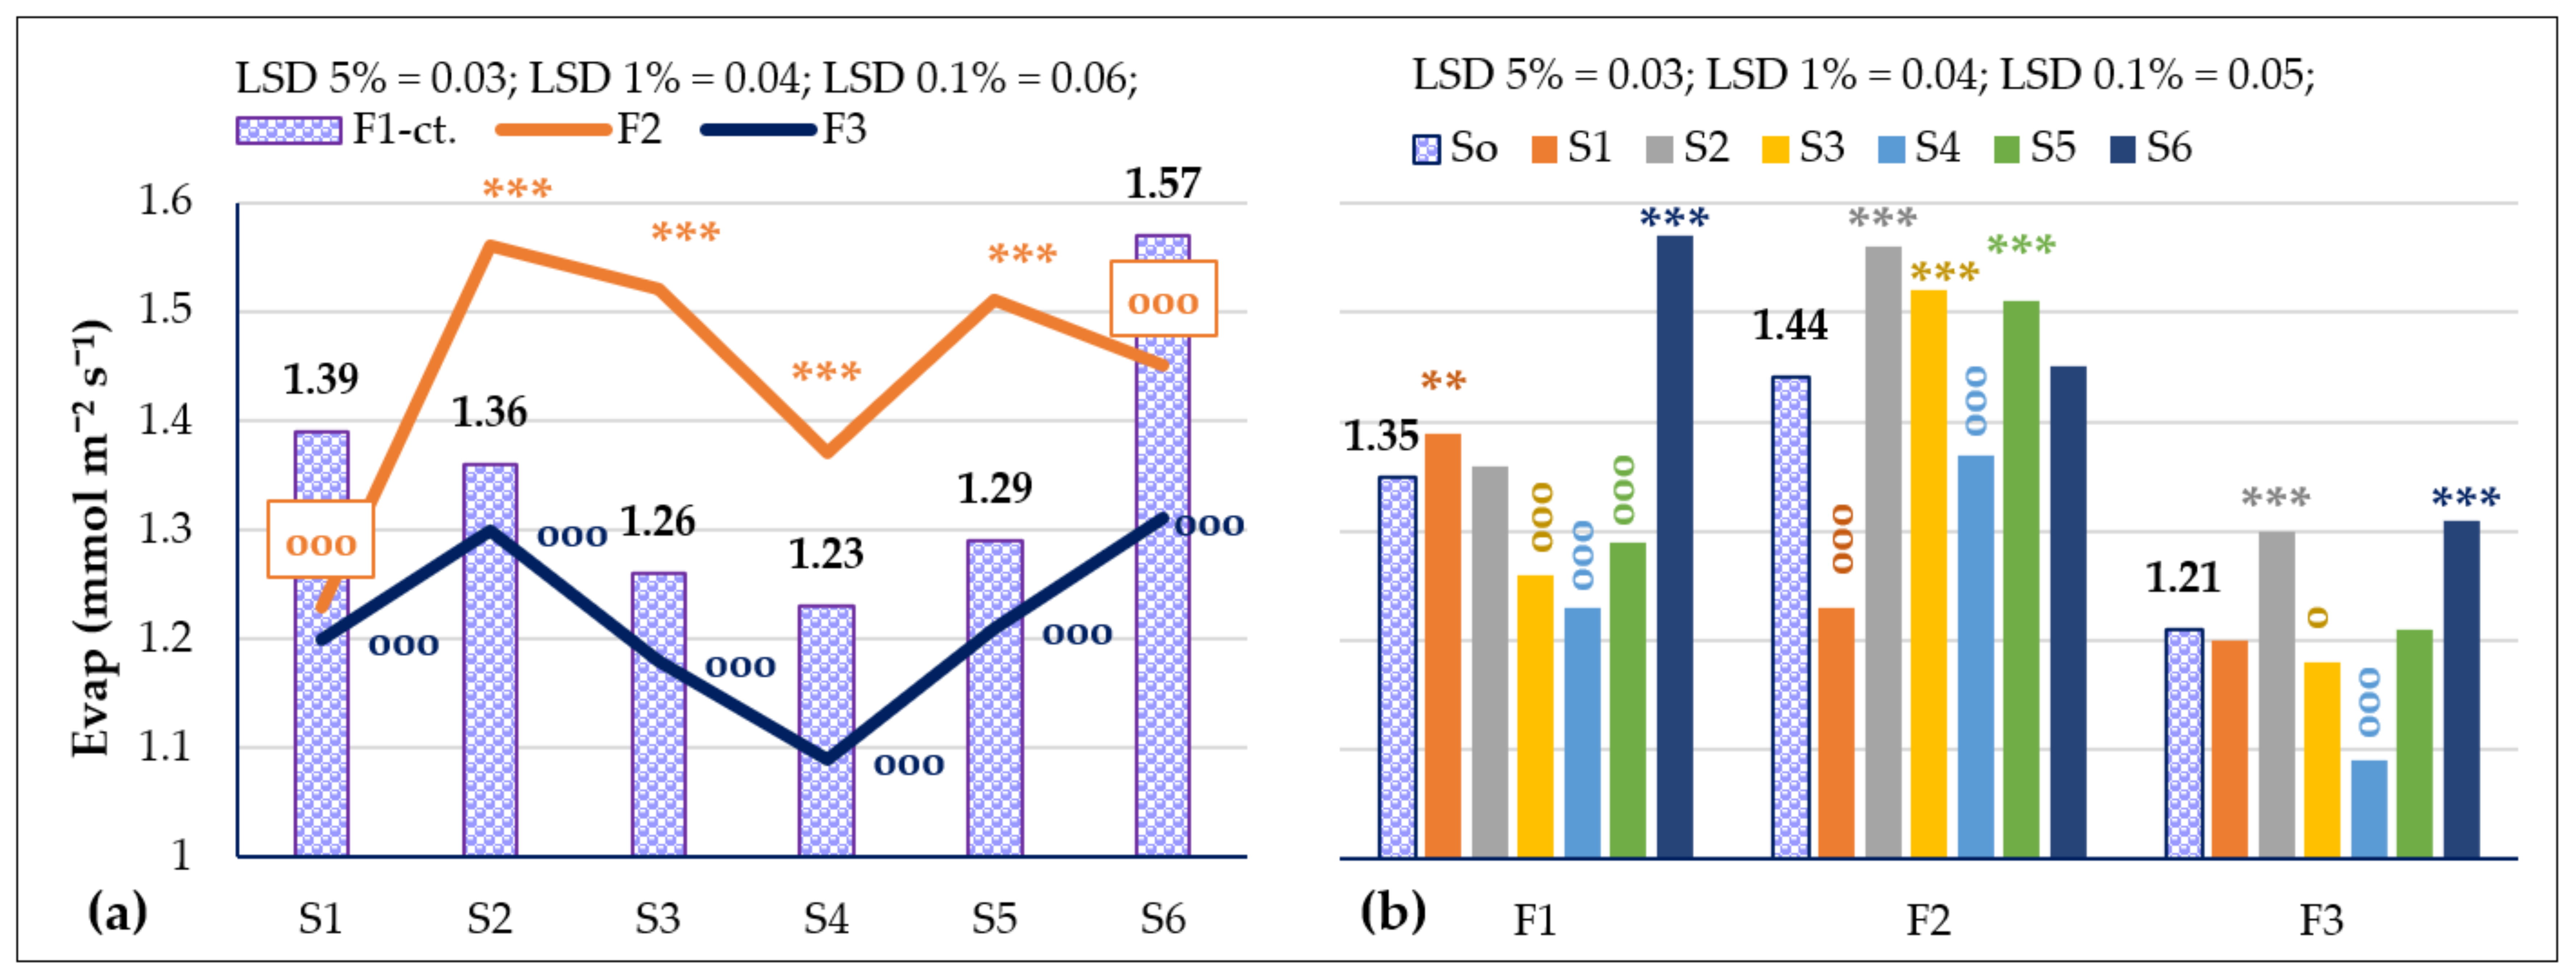
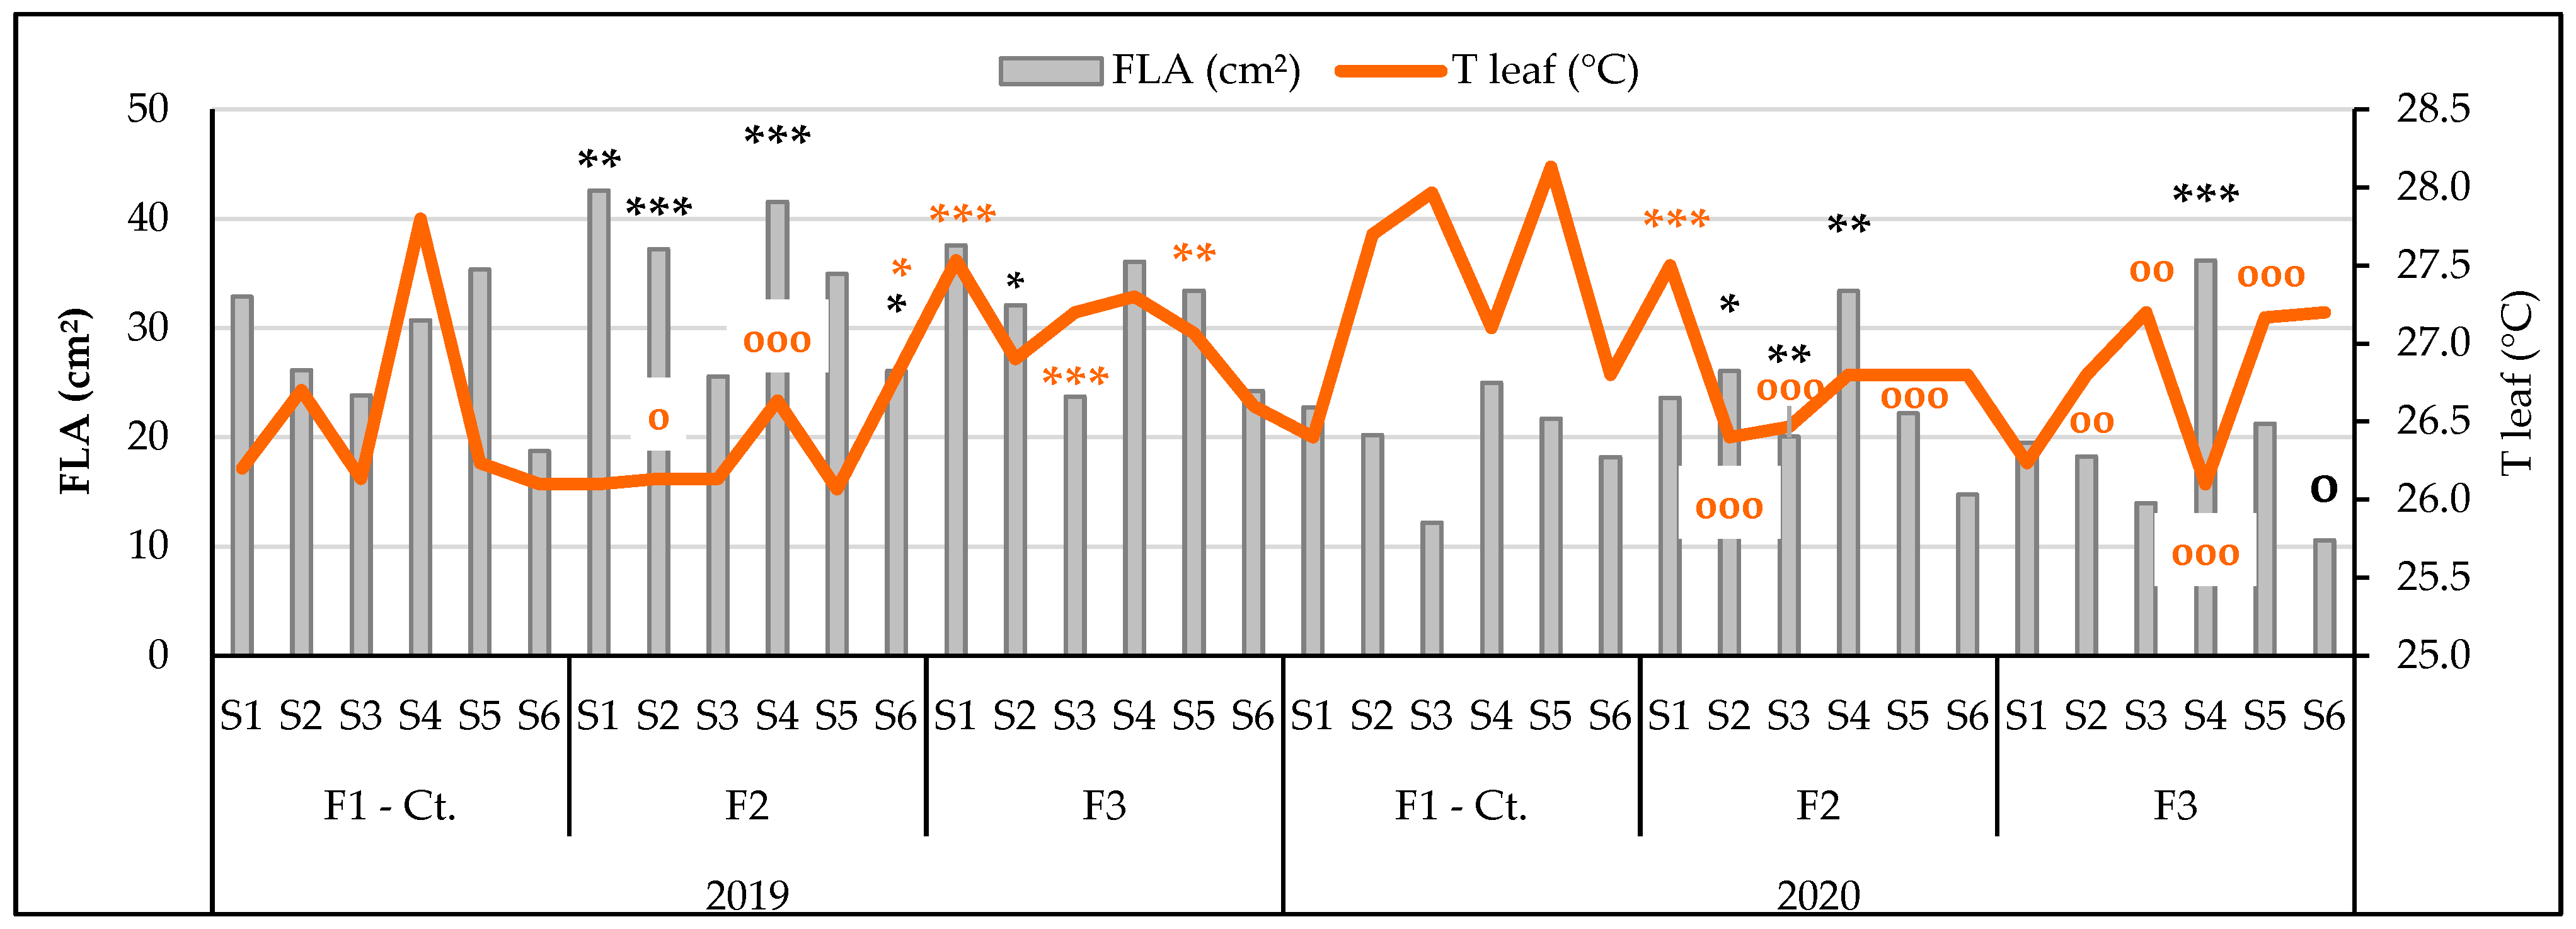
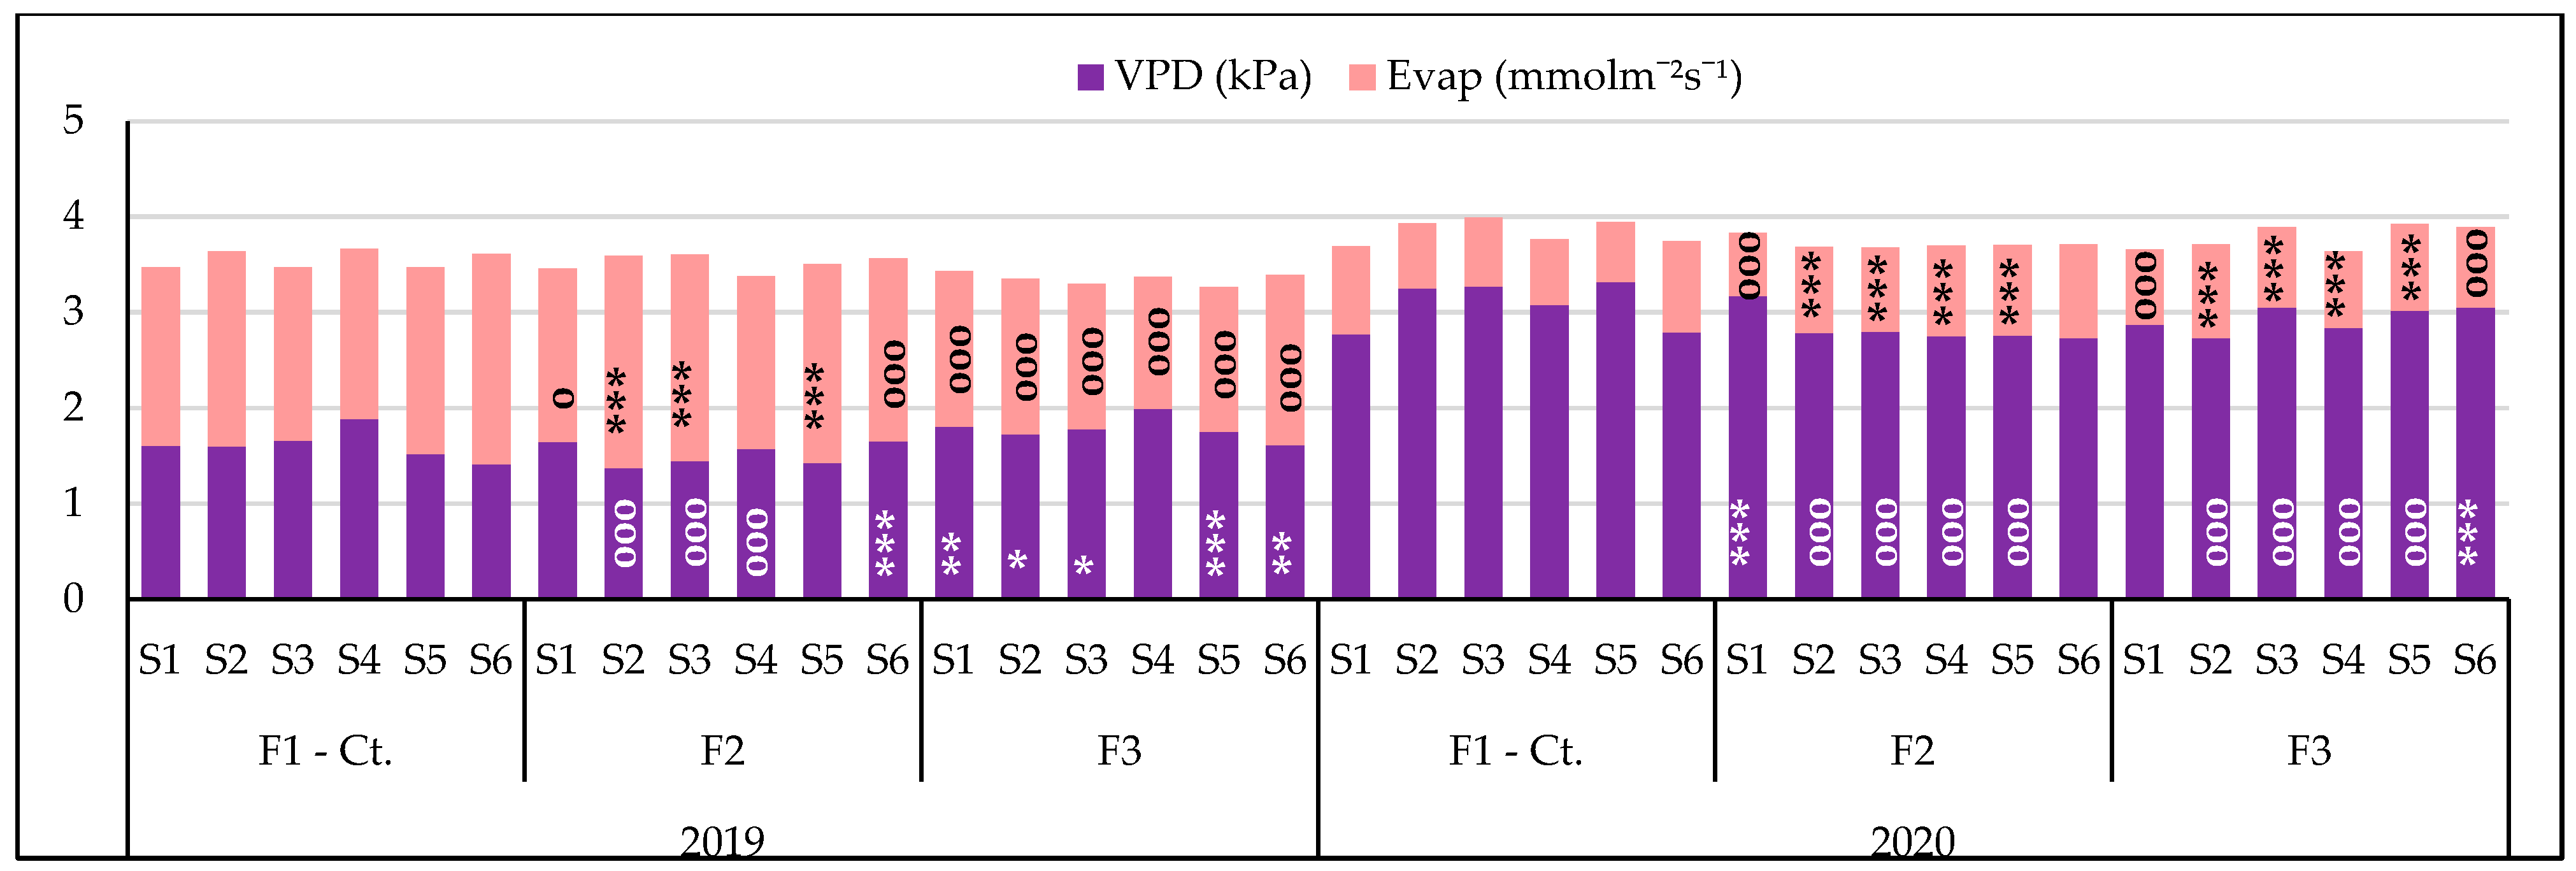
3.3.2. The Influence of the Triple Interactions on Some Physiological Indicators of Spring Wheat

Leaves serve as a crucial interface for water, energy, and carbon fluxes in terrestrial ecosystems [72]. The T leaf is instrumental in regulating the rates of mass and energy fluxes at the leaf surface [91], impacting several key physical processes including VPD [68], thermal conductance, emittance, net photosynthetic assimilation, and leaf respiration [72]. Moreover, leaf temperature creates the microenvironment surrounding the plants, significantly affecting the leaf photosynthetic rate [92]. Notably, leaf temperature can differ substantially from air temperature, varying between species due to physical and physiological plant characteristics. It is primarily determined by air temperature and humidity but is also modulated by leaf physical traits and transpiration [90].
The interactions between experimental factors and their influence on FLA and T leaf are depicted in Figure 12. The significant rainfall in May 2019, alongside increased nitrogen doses, greatly benefited vegetative growth, evident from the high average FLA of 31.3 cm2, marking a 10.2 cm2 increase compared to 2020. In 2019, FLA ranged from 23 cm2 (Lennox) to 37.7 cm2 (Pădureni). In contrast, the range in 2020 was between 14.5 cm2 (Lennox) and 31.5 cm2 (Taisa). The scarcity of rainfall in May 2020 contributed to a marked decrease in FLA, with variations averaging from 4.6 cm2 (Taisa) to 15.7 cm2 (Pădureni).
The average T leaf oscillated between 26.6 °C in 2019 and 27 °C in 2020. Notably, in 2020, at the fertilization levels F2 and F3, Granny, Triso, Taisa, and Ciprian genotypes exhibited a significant reduction in T leaf.
VPD plays a crucial role in regulating 5 interconnected plant physiological processes, including stomatal opening, CO2 uptake, transpiration, nutrient intake at the roots, and overall plant stress. As VPD increases, plants experience greater stress [93], leading to decreased stomatal conductance and increased transpiration up to a certain VPD threshold. This scenario can result in diminished photosynthesis and growth [68]. Optimal VPD for plant growth generally ranges from 0.8 to 1.2 kPa but can vary across different growth stages, reaching up to 1.6 kPa during flowering [93]. Across the study period, the mean VPD fluctuated from 1.64 kPa in 2019 to 2.95 kPa in 2020. Notably, the Lennox genotype consistently exhibited the lowest mean VPD value under various conditions—weather, nitrogen fertilization, and their interactions—in both years, as shown in Figure 13.
As Yang et al. [90], noted, an increase in the mean value of VPD is linearly associated with a decrease in the mean value of Evap., a trend also evident in Figure 13. In 2019, Taisa exhibited the lowest mean Evap. rate (1.65 mmol m−2 s−1), while Granny had the highest average (1.96 mmol m−2 s−1). The subsequent year saw markedly lower mean Evap. rates, ranging from 0.79 mmol m−2 s−1 (Pădureni) to 0.92 mmol m−2 s−1 (Lennox), attributed to both elevated temperatures and specific humidity conditions. These readings, taken after a biweekly period of significant rainfall, resulted in wet conditions that led to stomatal closure [70,71] thereby increasing VPD and substantially reducing Evap., as depicted in Figure 13.

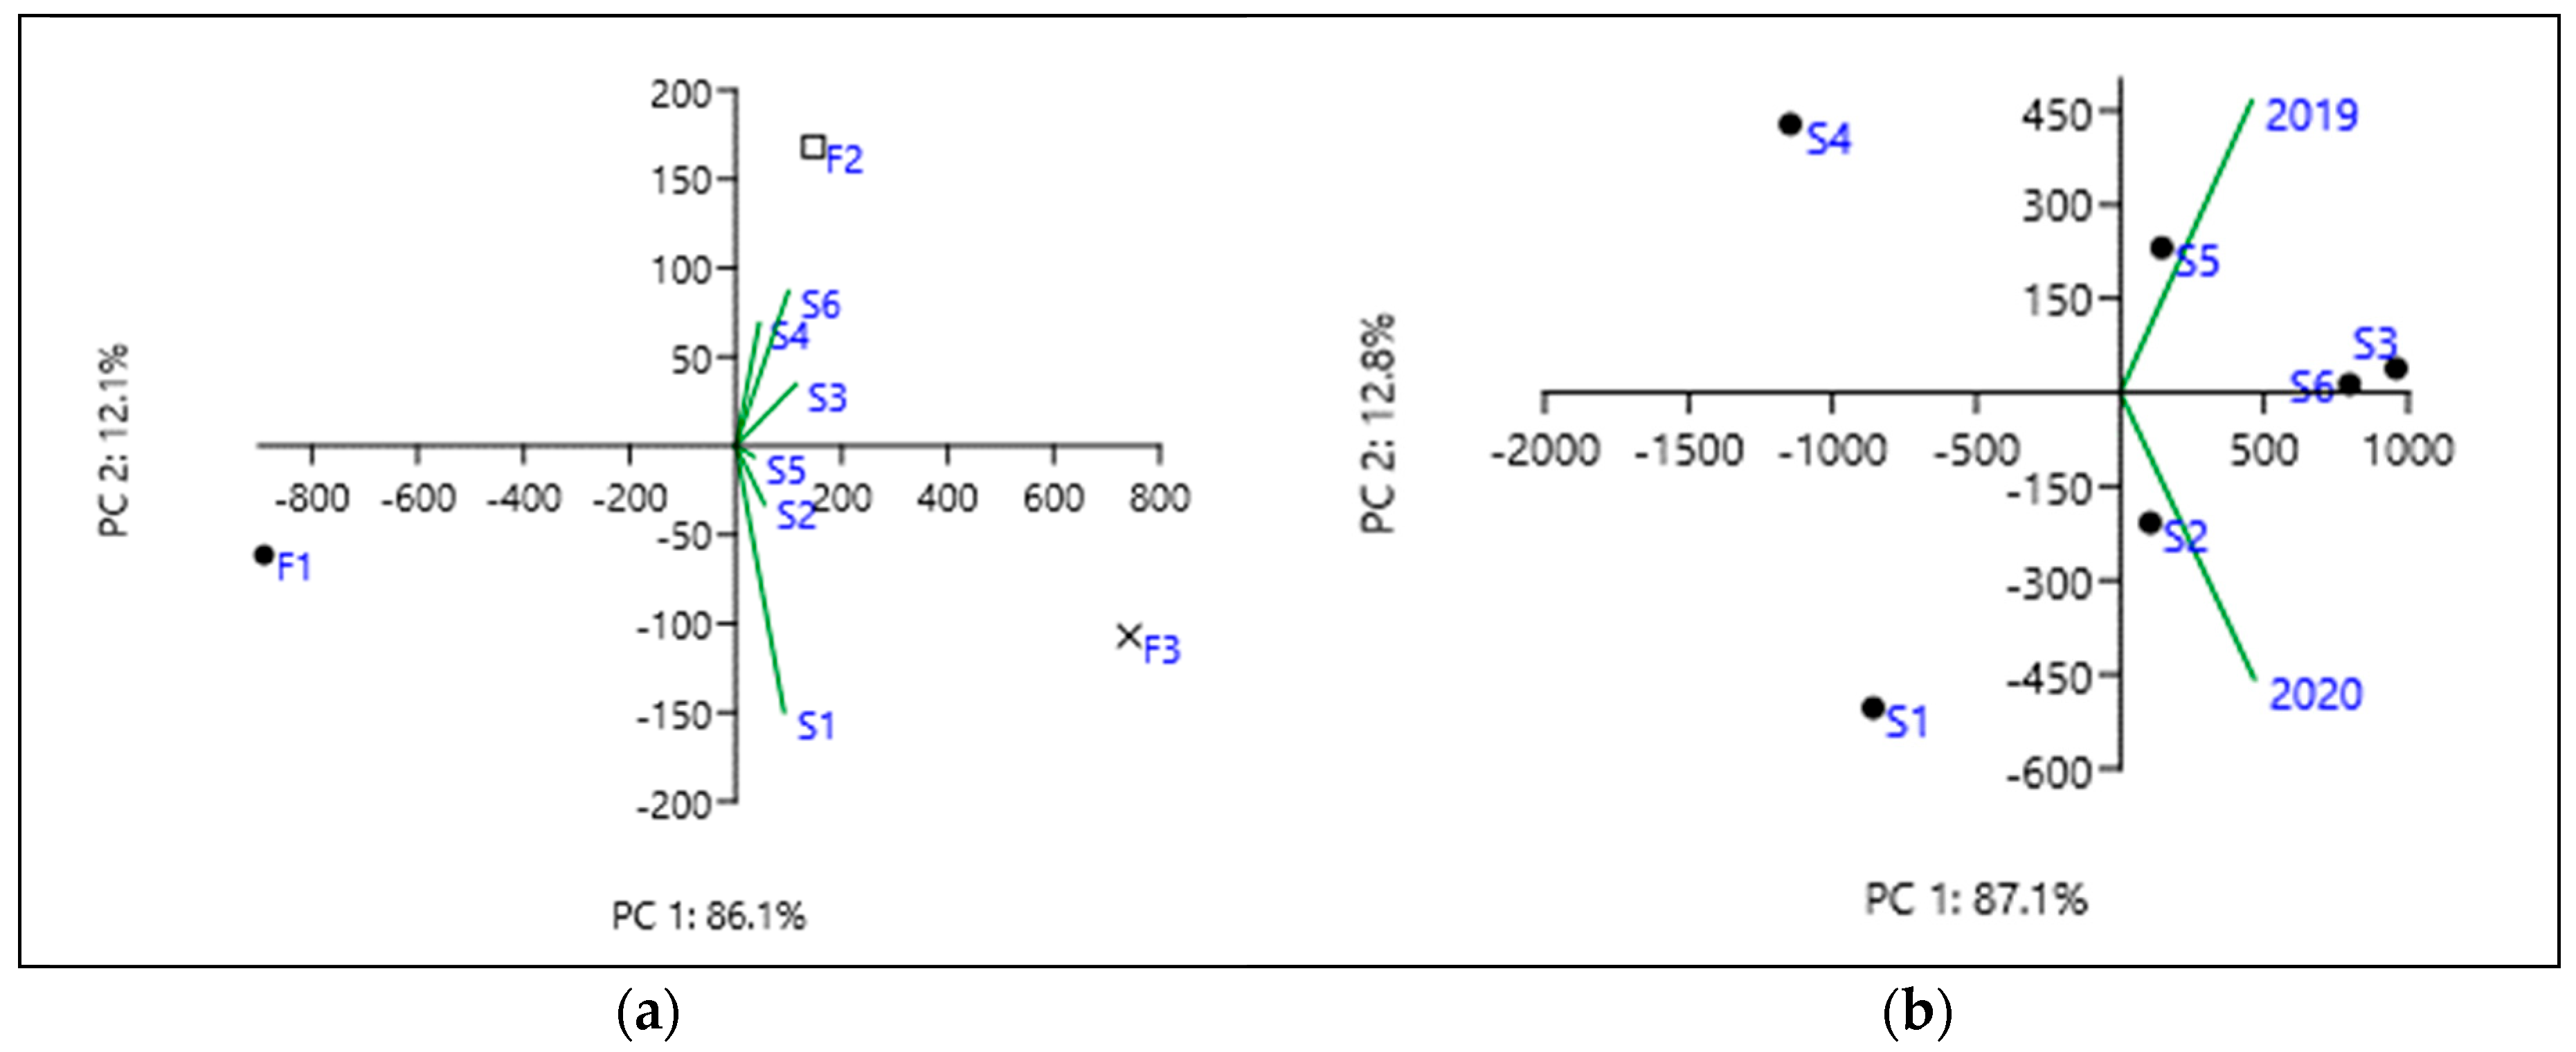
3.4. The Correlations Established between the Studied Parameters in Spring Wheat

The correlation coefficient between grain GY and TW, valued at r = 0.617, signifies a strong, positive relationship, suggesting that spring wheat genotypes with larger grains tend to yield higher. Conversely, Ruske et al. [86] reported a negative correlation between yield and TW, implying that lower test weight could be associated with reduced kernel filling.
Despite the lack of a proportional relationship between leaf surface area and evapotranspiration, it’s evident that larger leaf surfaces correlate with higher Evap. rates [94]. This strong, positive association between evapotranspiration and leaf surface has been recognized since 1974, notably for Gossypium barbadense L. and Dolichos lablab L [73]. Interestingly, genotypes characterized by wide, well-developed leaves tend to produce lower yields, as indicated by a correlation coefficient (r) of −0.702. Such genotypes, with expansive leaf apparatuses, are typically later maturing, leading to suboptimal grain filling, a relationship underscored by a Pearson correlation coefficient of r = −0.548. However, these genotypes play a significant role in the assimilation of protein in grains, as demonstrated by a correlation coefficient (r) of 0.538.
Among the physiological parameters studied—T leaf, VPD, and Evap.—tight relationships were established (Table 4), illustrating their coordinated influence on optimizing plant functions. Pearson correlation coefficients provide insight into the intricate ways these factors interact [95].

4. Conclusions

Weather conditions and fertilization systems influenced the studied genotypes in distinct ways, yet they did not significantly alter the average yields across the two experimental years.
The biplot analysis reveals that the Triso, Lennox, and Taisa genotypes produced high yields with the application of N108P92 a.s. This suggests that utilizing a higher dose of N is not justified. Conversely, the Ciprian and Granny genotypes showed only a weak response to the highest tested nitrogen dose of N140 a.s. kg ha−1.
Biplot analysis indicates that the Triso and Lennox genotypes exhibit a lack of sensitivity to environmental interactions, consistently achieving the highest yields in both years of the study. The interaction between genotype and climate significantly influences how genotypes respond, resulting in Ciprian and Taisa producing higher yields in the 2019 conditions, whereas Granny and Pădureni performed better in 2020. Pădureni and Taisa yielded the lowest in both years.
Protein content saw increases of up to 23% under fertilization with N140 a.s. kg ha−1, with the Pădureni, Ciprian, and Taisa genotypes experiencing the most notable enhancements.
Fertilization and weather conditions positively affected the TW in the Lennox and Triso genotypes, while the Taisa genotype experienced a negative impact. These changes in TW are directly reflected in the yield outcomes for these genotypes.
In genotypes characterized by large FLA, increased evapotranspiration contributes to a reduction in T leaf, which in turn lowers VPD.

Author Contributions

Conceptualization, F.C.; methodology, D.H. and T.R.; software, D.H.; formal analysis, F.C. and A.Ș.; investigation, F.C. and T.R.; resources, C.C. and M.B.; data curation, D.H. and C.C.; writing-original draft preparation, F.C.; writing-review and editing, T.R. and D.H.; visualization, C.C., P.I.M. and A.Ș.; supervision, T.R. and M.B.; project administration, F.C.; funding acquisition, T.R. and P.I.M. All authors have read and agreed to the published version of the manuscript.

Funding

This research was funded by the Ministry of Agriculture and Rural Development, Project ADER no. 123/2023: Conservation of soil resources through the use of technological components of regenerative agriculture in order to obtain economic and sustainable harvests of straw cereals in the Transylvanian Plateau.

Data Availability Statement

Data are contained within the article.

Conflicts of Interest

The authors declare no conflict of interest.

References

  1. Pandey, M.; Shrestha, J.; Subedi, S.; Shah, K.K. Role of Nutrients in Wheat: A Review. Trop. Agrobiodivers. 2020, 1, 18–23. [Google Scholar] [CrossRef]
  2. Rebouh, N.Y.; Khugaev, C.V.; Utkina, A.O.; Isaev, K.V.; Mohamed, E.S.; Kucher, D.E. Contribution of Eco-Friendly Agricultural Practices in Improving and Stabilizing Wheat Crop Yield: A Review. Agronomy 2023, 13, 2400. [Google Scholar] [CrossRef]
  3. Erenstein, O.; Jaleta, M.; Mottaleb, K.A.; Sonder, K.; Donovan, J.; Braun, H.-J. Global Trends in Wheat Production, Consumption and Trade. In Wheat Improvement; Reynolds, M.P., Braun, H.J., Eds.; Springer: Midtown Manhattan, NY, USA, 2022; pp. 47–66. [Google Scholar]
  4. Alomari, D.Z.; Schierenbeck, M.; Alqudah, A.M.; Alqahtani, M.D.; Wagner, S.; Rolletschek, H.; Borisjuk, L.; Röder, M.S. Wheat Grains as a Sustainable Source of Protein for Health. Nutrients 2023, 15, 4398. [Google Scholar] [CrossRef] [PubMed]
  5. Ficco, D.B.M.; Borrelli, G.M. Nutritional Components of Wheat Based Food: Composition, Properties, and Uses. Foods 2023, 12, 4010. [Google Scholar] [CrossRef] [PubMed]
  6. De Sousa, T.; Ribeiro, M.; Sabença, C.; Igrejas, G. The 10,000-Year Success Story of Wheat. Foods 2021, 10, 2124. [Google Scholar] [CrossRef] [PubMed]
  7. Wang, Y.; Shan, Q.; Wang, C.; Feng, S.; Li, Y. Research Progress and Application Analysis of the Returning Straw Decomposition Process Based on CiteSpace. Water 2023, 15, 3426. [Google Scholar] [CrossRef]
  8. Cheţan, F.; Cheţan, C.; Rusu, T.; Moraru, P.I.; Ignea, M.; Şimon, A. The Influence of Unconventional Tillage Systems on Soil Water Conservation, Economic Efficiency and Yield of Winter Wheat, in Turda Area. Ser. A Agron. 2017, LX, 42–48. [Google Scholar]
  9. Castellini, M.; Fornaro, F.; Garofalo, P.; Giglio, L.; Rinaldi, M.; Ventrella, D.; Vitti, C.; Vonella, A.V. Effects of No-Tillage and Conventional Tillage on Physical and Hydraulic Properties of Fine Textured Soils under Winter Wheat. Water 2019, 11, 484. [Google Scholar] [CrossRef]
  10. Chiriţă, S.; Rusu, T.; Urdă, C.; Cheţan, F.; Racz, I. Winter Wheat Yield and Quality Depending on Chemical Fertilization, Different Treatments and Tillage Systems. AgroLife Sci. J. 2023, 12, 34–39. [Google Scholar] [CrossRef]
  11. Shewry, P.R.; Hey, S.J. The Contribution of Wheat to Human Diet and Health. Food Energy Secur. 2015, 4, 178–202. [Google Scholar] [CrossRef] [PubMed]
  12. Iqbal, Z.; Pasha, I.; Abrar, M.; Masih, S.; Hanif, M.S. Physicochemical, Functional and Rheological Properties of Wheat Varieties. J. Agric. Res. 2015, 53, 253–267. [Google Scholar]
  13. Hussain, N.; Mahmood, T.; Liaquat, M.; Safdar, N.; Ahmed, W.; Qayyum, A.; Abbasi, K.S.; Imran, M. Rheometry Nutrition and Gluten Microstructure Trends in Wheat Cultivars. Food Sci. Technol. 2022, 42, e60920. [Google Scholar] [CrossRef]
  14. Garg, M.; Sharma, A.; Vats, S.; Tiwari, V.; Kumari, A.; Mishra, V.; Krishania, M. Vitamins in Cereals: A Critical Review of Content, Health Effects, Processing Losses, Bioaccessibility, Fortification, and Biofortification Strategies for their Improvement. Front. Nutr. 2021, 8, 586815. [Google Scholar] [CrossRef] [PubMed]
  15. Khalid, A.; Hameed, A.; Tahir, M.F. Wheat Quality: A Review on Chemical Composition, Nutritional Attributes, Grain Anatomy, Types, Classification, and Function of Seed Storage Proteins in Bread Making Quality. Front. Nutr. 2023, 10, 1053196. [Google Scholar] [CrossRef] [PubMed]
  16. Shahzad, M.; Hussain, M.; Jabran, K.; Farooq, M.; Farooq, S.; Gašparovič, K.; Barboricova, M.; Aljuaid, B.S.; El-Shehawi, A.M.; Zuan, A.T.K. The Impact of Different Crop Rotations by Weed Management Strategies’ Interactions on Weed Infestation and Productivity of Wheat (Triticum aestivum L.). Agronomy 2021, 11, 2088. [Google Scholar] [CrossRef]
  17. Auzins, A.; Leimane, I.; Krievina, A.; Morozova, I.; Miglavs, A.; Lakovskis, P. Evaluation of Environmental and Economic Performance of Crop Production in Relation to Crop Rotation, Catch Crops, and Tillage. Agriculture 2023, 13, 1539. [Google Scholar] [CrossRef]
  18. Esaulko, A.; Sitnikov, V.; Pismennaya, E.; Vlasova, O.; Golosnoi, E.; Ozheredova, A.; Ivolga, A.; Erokhin, V. Productivity of Winter Wheat Cultivated by Direct Seeding: Measuring the Effect of Hydrothermal Coefficient in the Arid Zone of Central Fore-Caucasus. Agriculture 2023, 13, 55. [Google Scholar] [CrossRef]
  19. Chai, Y.; Zhao, Z.; Lu, S.; Chen, L.; Hu, Y. Field Evaluation of Wheat Varieties Using Canopy Temperature Depression in Three Different Climatic Growing Seasons. Plants 2022, 11, 3471. [Google Scholar] [CrossRef] [PubMed]
  20. Tanaka, D.L.; Liebig, M.A.; Krupinsky, J.M.; Merrill, S.D. Crop Sequence Influences on Sustainable Spring Wheat Production in the Northern Great Plains. Sustainability 2010, 2, 3695–3709. [Google Scholar] [CrossRef]
  21. Nhamo, L.; Matchaya, G.; Mabhaudhi, T.; Nhlengethwa, S.; Nhemachena, C.; Mpandeli, S. Cereal Production Trends under Climate Change: Impacts and Adaptation Strategies in Southern Africa. Agriculture 2019, 9, 30. [Google Scholar] [CrossRef]
  22. Hussain, J.; Khaliq, T.; Rahman, M.H.U.; Ullah, A.; Ahmed, I.; Srivastava, A.K.; Gaiser, T.; Ahmad, A. Effect of Temperature on Sowing Dates of Wheat under Arid and Semi-Arid Climatic Regions and Impact Quantification of Climate Change through Mechanistic Modeling with Evidence from Field. Atmosphere 2021, 12, 927. [Google Scholar] [CrossRef]
  23. Thorup-Kristensen, K.; Salmerón Cortasa, M.; Loges, R. Winter Wheat Roots Grow Twice as Deep as Spring Wheat Roots, is this Important for N Uptake and N Leaching Losses? Plant Soil 2009, 322, 101–114. [Google Scholar] [CrossRef]
  24. Joshi, P.; Dhillon, G.S.; Gao, Y.; Kaur, A.; Wheeler, J.; Chen, J. An Optimal Model to Improve Genomic Prediction for Protein Content and Test Weight in a Diverse Spring Wheat Panel. Agriculture 2024, 14, 347. [Google Scholar] [CrossRef]
  25. Manley, M.; Engelbrecht, M.L.; Williams, P.C.; Kidd, M. Assessment of Variance in the Measurement of Hectolitre Mass of 701. Wheat, using Equipment from Different Grain Producing and Exporting Countries. Biosyst. Eng. 2009, 103, 176–186. [Google Scholar] [CrossRef]
  26. Protic, R.; Miric, M.; Protic, N.; Jovanovic, Ž.; Jovin, P. The Test Weight of Several Winter Wheat Genotypes under Various Sowing Dates and Nitrogen Fertilizer Rates. Rom. Agric. Res. 2007, 24, 43–46. [Google Scholar]
  27. Marinciu, C.M.; Șerban, G.; Mandea, V.; Săulescu, N.N. Cultivar and Crop Management Effects on Test Weight in Winter Wheat (Triticum aestivum). Rom. Agric. Res. 2021, 38, 46. Available online: https://new.incda-fundulea.ro/images/rar/nr38/rar3814.pdf (accessed on 10 March 2024). [CrossRef]
  28. Muntean, L.S.; Cernea, S.; Morar, G.; Duda, M.M.; Vârban, D.I.; Muntean, S.; Moldovan, C. Phytotechnics; Risoprint: Cluj-Napoca, Romania, 2014; pp. 74–145. [Google Scholar]
  29. Wyzińska, M.; Grabiński, J. The Influence of Autumn Sowing date on the Productivity of Spring Wheat (Triticum aestivum L.). In Proceedings of the Research for Rural Development. Agricultural Sciences (Crop Sciences, Animal Sciences); 2018; Volume 2, pp. 35–41. Available online: https://www.researchgate.net/publication/331711853_The_influence_of_autumn_sowing_date_on_the_productivity_of_spring_wheat_Triticum_aestivum_L (accessed on 17 March 2024).
  30. Hlisnikovský, L.; Menšík, L.; Kunzová, E. Development and the Effect of Weather and Mineral Fertilization on Grain Yield and Stability of Winter Wheat following Alfalfa—Analysis of Long-Term Field Trial. Plants 2023, 12, 1392. [Google Scholar] [CrossRef]
  31. Afuye, G.A.; Kalumba, A.M.; Orimoloye, I.R. Characterisation of Vegetation Response to Climate Change: A Review. Sustainability 2021, 13, 7265. [Google Scholar] [CrossRef]
  32. Moayedi, S.; Elias, E.M.; Manthey, F.A. Effect of Weather on Grain Quality Traits of Durum Wheat Grown in the Northern Plains of USA. Am. J. Plant Sci. 2021, 12, 1894–1911. [Google Scholar] [CrossRef]
  33. Clauw, H.; Van de Put, H.; Sghaier, A.; Kerkaert, T.; Debonne, E.; Eeckhout, M.; Steppe, K. The Impact of a Six-Hour Light–Dark Cycle on Wheat Ear Emergence, Grain Yield, and Flour Quality in Future Plant-Growing Systems. Foods 2024, 13, 750. [Google Scholar] [CrossRef]
  34. Swify, S.; Mažeika, R.; Baltrusaitis, J.; Drapanauskaitė, D.; Barčauskaitė, K. Review: Modified Urea Fertilizers and Their Effects on Improving Nitrogen Use Efficiency (NUE). Sustainability 2024, 16, 188. [Google Scholar] [CrossRef]
  35. Roumia, H.; Kókai, Z.; Mihály-Langó, B.; Csobod, É.C.; Benedek, C. Ancient Wheats—A Nutritional and Sensory Analysis Review. Foods 2023, 12, 2411. [Google Scholar] [CrossRef] [PubMed]
  36. Kim, K.-H.; Kim, J.-Y. Understanding Wheat Starch Metabolism in Properties, Environmental Stress Condition, and Molecular Approaches for Value-Added Utilization. Plants 2021, 10, 2282. [Google Scholar] [CrossRef] [PubMed]
  37. Bianchi, A.; Sanmartin, C.; Taglieri, I.; Macaluso, M.; Venturi, F.; Napoli, M.; Mancini, M.; Fabbri, C.; Zinnai, A. Effect of Fertilization Regime of Common Wheat (Triticum aestivum) on Flour Quality and Shelf-Life of PDO Tuscan Bread. Foods 2023, 12, 2672. [Google Scholar] [CrossRef] [PubMed]
  38. Mitura, K.; Cacak-Pietrzak, G.; Feledyn-Szewczyk, B.; Szablewski, T.; Studnicki, M. Yield and Grain Quality of Common Wheat (Triticum aestivum L.) Depending on the Different Farming Systems (Organic vs. Integrated vs. Conventional). Plants 2023, 12, 1022. [Google Scholar] [CrossRef] [PubMed]
  39. Xie, W.; Yan, X. Responses of Wheat Protein Content and Protein Yield to Future Climate Change in China during 2041–2060. Sustainability 2023, 15, 14204. [Google Scholar] [CrossRef]
  40. Chen, X.; Donghong, M.; Tauqeer, A.Y.; Yin-Gang, H. Evaluation of 14 morphological, yield-related and physiological traits as indicators of drought tolerance in Chinese winter bread wheat revealed by analysis of the membership function value of drought tolerance (MFVD). Field Crops Res. 2012, 137, 195–201. [Google Scholar] [CrossRef]
  41. Sobolewska, M.; Wenda-Piesik, A.; Jaroszewska, A.; Stankowski, S. Effect of Habitat and Foliar Fertilization with K, Zn and Mn on Winter Wheat Grain and Baking Qualities. Agronomy 2020, 10, 276. [Google Scholar] [CrossRef]
  42. Mureșan, D.; Varadi, A.; Racz, I.; Kadar, R.; Ceclan, A.; Duda, M.M. Effect of Genotype and Sowing Date on Yield and Yield Components of Facultative Wheat in Transylvania Plain. AgroLife Sci. J. 2020, 9, 237–247. [Google Scholar]
  43. Dobre, S.P.; Lazăr, C. Surface Determinations of Flag Leaf for a Set of Mutant DH Wheat Lines. In Genetics and Plant Breeding; INCDA: Fundulea, Romania, 2014; Volume LXXXII, pp. 7–16. Available online: https://www.incda-fundulea.ro/anale/82/82.1.pdf (accessed on 17 March 2024).
  44. Berdhal, J.D.; Rasmusson, D.C.; Moss, D.N. Effect of Leaf Area on Photosynthetic Rates, Light Penetration and Grain Yield in Barley. Crop Sci. 1972, 20, 117–180. [Google Scholar]
  45. Ibrahim, H.; Elenein, R.A.A. The Relative Contribution of Different Wheat Leaves and Awns to the Grain Yield and its Protein Content. Z. Acker Pflanzenbau 1977, 144, 1–7. [Google Scholar]
  46. Liu, Y.; Li, M.J.; Li, J.; Li, X.; Yang, X.; Tong, Y.; Zhang, A.; Li, B.; Lin, J.; Kuang, T.; et al. Dynamic Changes in Flag Leaf Angle Contribute to High Photosynthetic Capacity. Chin. Sci. Bull. 2009, 54, 3045–3052. [Google Scholar] [CrossRef]
  47. Available online: https://istis.ro/catalog-oficial/ (accessed on 15 March 2024).
  48. Grecu, C.; Haş, I.; Nagy, C. ARDS Turda, 50th Anniversary 1957–2007. In Research and Development Results; SC Ela Design SRL: Bucharest, Romania, 2007; pp. 9–12. [Google Scholar]
  49. SRTS. The Romanian System of Soil Taxonomy; Estfalia: Bucharest, Romania, 2012. [Google Scholar]
  50. Chețan, F.; Chețan, C. Researches Regarding the Influence of the Unconventional Soil Tillage Systems upon Weeding and Soybean Yield, in Pedoclimatic Conditions in the Transylvanian Plain. In Agrarian Economy and Rural Development—Realities and Perspectives for Romania; Volume of International Symposium; ICEADR: Bucharest, Romania, 2020; Volume 11, pp. 91–99. Available online: https://symposium.iceadr.ro/wp-content/uploads/2023/03/Volum-simpozion-ICEADR-2020-ENG-compressed.pdf (accessed on 10 March 2024).
  51. Bardas, M.; Rusu, T.; Popa, A.; Russu, F.; Simon, A.; Chețan, F.; Racz, I.; Popescu, S.; Topan, C. Effect of Foliar Fertilization on the Physiological Parameters, Yield and Quality Indices of the Winter Wheat. Agronomy 2024, 14, 73. [Google Scholar] [CrossRef]
  52. Available online: https://i0.wp.com/www.mississippi-crops.com/wp-content/uploads/2015/02/Wheat_FeekesScale_graphic.png?ssl=1 (accessed on 15 March 2024).
  53. Available online: https://www.terra-preta.ro/produse/pp-systems (accessed on 15 March 2024).
  54. Chanda, S.; Singh, Y. Estimation of Leaf Area in Wheat using Linear Measurements. Plant Breed. Seed Sci. 2002, 46, 75–79. [Google Scholar]
  55. Turda Meteorological Station, Longitude: 23′47-Latitude 46′35′-Altitude 427 m.
  56. PolyFact. ANOVA Test PC Program for Variant Analyses; USAMV: Cluj-Napoca, Romania, 2020. [Google Scholar]
  57. Kadar, R.; Muntean, L.; Racz, I.; Ona, A.D.; Ceclan, A.; Hirișcău, D. The Effect of Genotype, Climatic Conditions and Nitrogen Fertilization on Yield and Grain Protein Content of Spring Wheat (Triticum aestivum L.). Not. Bot. Horti Agrobot. 2019, 47, 515–521. [Google Scholar] [CrossRef]
  58. Szmigiel, A.; Kołodziejczyk, M.; Oleksy, A.; Kulig, B. Efficiency of Nitrogen Fertilization in Spring Wheat. Int. J. Plant Prod. 2016, 10, 447–456. [Google Scholar]
  59. Sasani, S.; Amiri, R.; Sharifi, H.R.; Lotfi, A. Impact of Sowing date on Bread Wheat Kernel Quantitative and Qualitative Traits under Middle East Climate Conditions. Zemdirb. Agric. 2020, 107, 279–286. [Google Scholar] [CrossRef]
  60. Gauer, L.E.; Grant, C.A.; Gehl, D.T.; Bailey, L.D. Effects of Nitrogen Fertilization on Grain Protein Content, Nitrogen Uptake, and Nitrogen use Efficiency of Six Spring Wheat (Triticum aestivum L.) Cultivars, in Relation to Estimated Moisture Supply. Can. J. Plant Sci. 1992, 72, 235–241. [Google Scholar] [CrossRef]
  61. Orloff, S. Effect of Nitrogen Fertilization Practices on Spring Wheat Protein Content. Final Report. 2011. Available online: http://cawheat.org/uploads/resources/542/wheatcommissionfinalrptnfert12.pdf (accessed on 15 March 2024).
  62. Jahan, A.H.S.; Hossain, A.; Alam, N.; Ali, A.; Saif, H.B.; Kizilgeci, F.; Omer, K.; Barutcular, C.; Sabagh, A.E. Yield and Grain Protein of Wheat (Triticum Aestivum L.) Is Influenced by The Application of Different Levels of Nitrogen. Fresenius Environ. Bull. 2020, 29, 5704–5714. [Google Scholar]
  63. Protic, R.; Jovin, P.; Protic, N.; Jankovics, S.; Jovanovic, Z. Mass of 1000 Grains in Several Winter Wheat Genotypes, at Different Dates of Sowing and Rates of Nitrogen Fertilizer. Rom. Agric. Res. 2007, 24, 39–43. [Google Scholar]
  64. Wu, W.; Zhou, L.; Chen, J.; Qiu, Z.; He, Y. Gain TKW: A Measurement System of Thousand Kernel Weight Based on the Android Platform. Agronomy 2018, 8, 178. [Google Scholar] [CrossRef]
  65. Dobreva, S.S.; Muhova, A.; Bonchev, B. Nitrogen and Phosphorus Fertilizers Affecting the Quality and Quantity of the Durum Wheat. Sci. Pap. Ser. A Agron. 2022, LXV, 533–539. [Google Scholar]
  66. Walsh, O.S.; Walsh, W.L. Nitrogen Fertilizer Rate and Time Effect on Dryland No-till Hard Red Spring Wheat Production. Agrosyst. Geosci. Environ. 2020, 3, e20093. [Google Scholar] [CrossRef]
  67. Ghanem, M.E.; Kehel, Z.; Marrou, H.; Sinclair, T.R. Seasonal and Climatic Variation of Weighted VPD for Transpiration Estimation. Eur. J. Agron. 2020, 113, 125966. [Google Scholar] [CrossRef]
  68. Grossiord, C.; Buckley, T.N.; Cernusak, L.A.; Novick, K.A.; Poulter, B.; Siegwolf, R.T.W.; Sperry, J.S.; McDowell, N.G. Plant Responses to Rising Vapor Pressure Deficit. New Phytol. 2020, 226, 1550–1566. [Google Scholar] [CrossRef] [PubMed]
  69. Cutress, D. The Importance of Vapour Pressure Deficits (VPD) in Agricultural Plant Growth, Technical Articles, Key Sector: Forestry, Horticulture, Organic; Theme: Business, Land. 2021. Available online: https://businesswales.gov.wales/farmingconnect/news-and-events/technical-articles/importance-vapour-pressure-deficits-vpd-agricultural-plant-growth (accessed on 15 March 2024).
  70. Pettigrew, W.T.; Hesketh, J.D.; Peters, D.B.; Wolley, J.T. A Vapor Pressure Deficit Effect on Crop Canopy Photosynthesis. Photosynth. Res. 1990, 24, 27–34. [Google Scholar] [CrossRef] [PubMed]
  71. Noor, H.; Yan, Z.; Sun, P.; Zhang, L.; Ding, P.; Li, L.; Ren, A.; Sun, M.; Gao, Z. Effects of Nitrogen on Photosynthetic Productivity and Yield Quality of Wheat (Triticum aestivum L.). Agronomy 2023, 13, 1448. [Google Scholar] [CrossRef]
  72. Kibler, C.L.; Trugman, A.T.; Dar, A.R.; Still, J.C.; Russell, L.; Scott, K.K.; Caylor, J.C.S.; Singer, M.B. Evapotranspiration Regulates Leaf Temperature and Respiration in Dryland Vegetation. Agric. For. Meteorol. 2023, 339, 109560. [Google Scholar] [CrossRef]
  73. El Nadi, A.H. The Significance of Leaf Area in Evapotranspiration. Ann. Bot. 1974, 38, 607–611. [Google Scholar] [CrossRef]
  74. Litke, L.; Zinta, G.; Ruža, A. Nitrogen Fertilizer Influence on Winter Wheat Yield and Yield components depending on soil tillage and forecrop. Res. Rural Dev. 2017, 2, 54–61. [Google Scholar] [CrossRef]
  75. Wang, R.; Wang, H.; Jiang, G.; Yin, H.; Che, Z. Effects of Nitrogen Application Strategy on Nitrogen Enzyme Activities and Protein Content in Spring Wheat Grain. Agriculture 2022, 12, 1891. [Google Scholar] [CrossRef]
  76. Subedi, K.D.; Ma, B.L.; Xue, A.G. Planting Date and Nitrogen Effects on Grain Yield and Protein Content of Spring Wheat. Crop Sci. 2007, 47, 36–44. [Google Scholar] [CrossRef]
  77. Erdemci, I. Investigation of genotype x environment interaction in chickpea genotypes using AMMI and GGE biplot analysis. Turk. J. Field Crop 2018, 23, 20–26. [Google Scholar] [CrossRef]
  78. Wodebo, K.Y.; Tolemariam, T.; Demeke, S.; Garedew, W.; Tesfaye, T.; Zeleke, M.; Gemiyu, D.; Bedeke, W.; Wamatu, J.; Sharma, M. AMMI and GGE Biplot Analyses for Mega-Environment Identification and Selection of Some High-Yielding Oat (Avena sativa L.) Genotypes for Multiple Environments. Plants 2023, 12, 3064. [Google Scholar] [CrossRef] [PubMed]
  79. Ravier, C.; Meynard, J.M.; Cohan, J.P.; Gate, P.; Jeuffroy, M.H. Early Nitrogen Deficiencies Favor High Yield, Grain Protein Content and N Use Efficiency in Wheat. Eur. J. Agron. 2017, 89, 16–24. [Google Scholar] [CrossRef]
  80. Wu, W.; Ma, B.L.; Fan, J.J.; Sun, M.; Yi, Y.; Guo, W.S.; Voldeng, H.D. Management of Nitrogen Fertilization to Balance Reducing Lodging Risk and Increasing Yield and Protein Content in Spring Wheat. Field Crops Res. 2019, 241, 107584. [Google Scholar] [CrossRef]
  81. Horvat, D.; Šimić, G.; Dvojković, K.; Ivić, M.; Plavšin, I.; Novoselović, D. Gluten Protein Compositional Changes in Response to Nitrogen Application Rate. Agronomy 2021, 11, 325. [Google Scholar] [CrossRef]
  82. Clarke, J.M.; Campbell, C.A.; Cutforth, H.W.; DePauw, R.M.; Wilkleman, G.E. Nitrogen and Phosphorus Uptake, Translocation, and Utilization Efficiency of Wheat in Relation to Environment and Cultivar Yield and Protein Levels. Can. J. Plant Sci. 1990, 70, 965–977. [Google Scholar] [CrossRef]
  83. Szmigiel, A.; Oleksy, A.; Kołodziejczyk, M. Effect of Nitrogen Fertilization on Quality and Quantity in Spring Wheat. Electron. J. Pol. Agric. Univ. 2014, 17, 1–10. [Google Scholar]
  84. Warechowska, M.; Stepien, A.; Wojtkowiak, K.; Nawrocka, A. The Impact of Nitrogen Fertilization Strategies on Selected Qualitative Parameters of Spring Wheat Grain and Flour. Pol. J. Nat. Sci. 2019, 34, 199–212. [Google Scholar]
  85. Blandino, M.; Marinaccio, F.; Reyneri, A. Effect of late-season nitrogen fertilization on grain yield and on flour rheological quality and stability in common wheat, under different production situations. Ital. J. Agron. 2016, 11, 107–113. [Google Scholar] [CrossRef]
  86. Ruske, R.E.; Gooding, M.J.; Jones, S.A. The effects of adding picoxystrobin, azoxystrobin and nitrogen to a triazole programme on disease control, flag leaf senescence, yield and grain quality of winter wheat. Crop Prot. 2003, 22, 975–987. [Google Scholar] [CrossRef]
  87. Kosmolak, F.G.; Crowle, W.L. An Effect of Nitrogen Fertilization on the Agronomic Traits and Dough Mixing Strength of Five Canadian Hard Red Spring Wheat Cultivars. Can. J. Plant Sci. 1980, 60, 1071–1076. Available online: https://cdnsciencepub.com/doi/10.4141/cjps80-157 (accessed on 17 March 2024). [CrossRef]
  88. Ministry of Agriculture and Rural Development (MARD). Order 228/July 5th, 2017 Regarding the Approval of the Grading Handbook for Seeds for Consumption. 2017. Available online: https://www.madr.ro/comunicare/3919-a-fost-aprobat-manualul-de-gradare-pentru-semintele-de-consum.html (accessed on 15 March 2024).
  89. Lin, H.; Chen, Y.J.; Zhang, H.L.; Fu, P.L.; Fan, Z.X. Stronger cooling effects of transpiration and leaf physical traits of plants from a hot dry habitat than from a hot wet habitat. Funct. Ecol. 2017, 31, 2202–2211. Available online: https://besjournals.onlinelibrary.wiley.com/doi/10.1111/1365-2435.12923 (accessed on 17 March 2024). [CrossRef]
  90. Yang, F.; Zhang, Q.; Wang, R.; Zhou, J. Evapotranspiration Measurement and Crop Coefficient Estimation over a Spring Wheat Farmland Ecosystem in the Loess Plateau. PLoS ONE 2014, 9, e100031. [Google Scholar] [CrossRef] [PubMed]
  91. Vinod, N.; Slot, M.; McGregor, I.R.; Ordway, E.M.; Smith, M.N.; Taylor, T.C.; Sack, L.; Buckley, T.N.; Anderson-Teixeira, K.J. Thermal sensitivity across forest vertical profiles: Patterns, mechanisms, and ecological implications. New Phytol. 2022, 237, 22–47. [Google Scholar] [CrossRef] [PubMed]
  92. Li, Y.; Zhou, L.; Wang, S.; Chi, Y.; Chen, J. Leaf Temperature and Vapour Pressure Deficit (VPD) Driving Stomatal Conductance and Biochemical Processes of Leaf Photosynthetic Rate in a Subtropical Evergreen Coniferous Plantation. Sustainability 2018, 10, 4063. [Google Scholar] [CrossRef]
  93. The Ultimate Vapor Pressure Deficit (VPD) Guide. Available online: https://pulsegrow.com/blogs/learn/vpd (accessed on 15 March 2024).
  94. Gâdea, Ș. Plant Physiology; Academic Press: Cambridge, MA, USA, 2013; p. 97. [Google Scholar]
  95. Bramley, H.; Ranawana, S.R.W.M.C.J.K.; Palta, J.A.; Stefanova, K.; Siddique, K.H.M. Transpirational Leaf Cooling Effect Did Not Contribute Equally to Biomass Retention in Wheat Genotypes under High Temperature. Plants 2022, 11, 2174. [Google Scholar] [CrossRef]
Figure 1. Yield (kg ha−1) of spring wheat as affected by F × S (a)/S × F (b) interactions. Note: *, **,°°, ***,°°°—significant at the 5%, 1%, and 0.1% positive and negative probability levels respectively; LSD—least significant difference. F1 (control) = N36P92; F2 = F1 + N72; F3 = F1 + N105; S0—mean of genotypes (control); S1—Pădureni; S2—Granny; S3—Triso; S4—Taisa; S5—Ciprian; S6—Lennox.
Agronomy 14 00921 g001
Figure 2. Graphics of Past4.03.exe biplot analysis of grain yield of spring wheat genotypes in terms of determining: (a) which is the best amount of nitrogen fertilizer for what wheat genotype; (b) genotype x weather conditions interaction; S1—Pădureni; S2—Granny; S3—Triso; S4—Taisa; S5—Ciprian; S6—Lennox; F1 = N36P92; F2 = F1 + N72; F3 = F1 + N105.
Agronomy 14 00921 g002
Figure 3. Protein content (%) of spring wheat as affected by F × S (a)/S × F (b) interaction. Note: **,°°, ***,°°°—significant at the 5%, 1%, and 0.1% positive and negative probability levels respectively; LSD—least significant difference. F1 (control) = N36P92; F2 = F1 + N72; F3 = F1 + N105; S0—mean of genotypes (control); S1—Pădureni; S2—Granny; S3—Triso; S4—Taisa; S5—Ciprian; S6—Lennox.
Agronomy 14 00921 g003
Figure 4. Thousand kernel weights (g) of spring wheat as affected by the F × S (a)/S × F (b) interaction. Note: *,°, **, ***—significant at the 5%, 1%, and 0.1% positive and negative probability levels respectively; LSD—least significant difference. F1 (control) = N36P92; F2 = F1 + N72; F3 = F1 + N105; S0—mean of genotypes (control); S1—Pădureni; S2—Granny; S3—Triso; S4—Taisa; S5—Ciprian; S6—Lennox.
Agronomy 14 00921 g004
Figure 5. Test weight (kg hl−1) of spring wheat as affected by the F × S (a)/S × F (b) interaction. Note: *, **,°°, ***,°°°—significant at the 5%, 1%, and 0.1% positive and negative probability levels respectively; LSD—least significant difference. F1 (control) = N36P92; F2 = F1 + N72; F3 = F1 + N105; S0—mean of genotypes (control); S1—Pădureni; S2—Granny; S3—Triso; S4—Taisa; S5—Ciprian; S6—Lennox.
Agronomy 14 00921 g005
Figure 6. Flag leaf area (cm2) of spring wheat as affected by F × S (a)/S × F (b) interaction. Note: *, °°, ***,°°°—significant at the 5%, 1%, and 0.1% positive and negative probability levels, respectively; LSD—least significant difference. F1 (control) = N36P92; F2 = F1 + N72; F3 = F1 + N105; S0—mean of genotypes (control); S1—Pădureni; S2—Granny; S3—Triso; S4—Taisa; S5—Ciprian; S6—Lennox.
Agronomy 14 00921 g006
Figure 7. Leaf temperature (°C) of spring wheat as affected by F × S (a)/S × F (b) interaction. Note: *, **,°°, °°°—significant at the 5%, 1%, and 0.1% positive and negative probability levels, respectively; LSD—least significant difference. F1 (control) = N36P92; F2 = F1 + N72; F3 = F1 + N105; S0—mean of genotypes (control); S1—Pădureni; S2—Granny; S3—Triso; S4—Taisa; S5—Ciprian; S6—Lennox.
Agronomy 14 00921 g007
Figure 8. Vapor pressure deficit (kPa) of spring wheat as affected by F × S (a)/S × F (b) interaction. Note: *,°, **,°°, ***,°°°—significant at the 5%, 1%, and 0.1% positive and negative probability levels, respectively; LSD—least significant difference. F1 (control) = N36P92; F2 = F1 + N72; F3 = F1 + N105; S0—mean of genotypes (control); S1—Pădureni; S2—Granny; S3—Triso; S4—Taisa; S5—Ciprian; S6—Lennox.
Agronomy 14 00921 g008
Figure 9. Evapotranspiration (mmol m−2 s−1) of spring wheat as affected by F × S (a)/S × F (b) interaction. Note: °, **, ***,°°°—significant at the 5%, 1%, and 0.1% positive and negative probability levels, respectively; LSD—least significant difference. F1 (control) = N36P92; F2 = F1 + N72; F3 = F1 + N105; S0—mean of genotypes (control); S1—Pădureni; S2—Granny; S3—Triso; S4—Taisa; S5—Ciprian; S6—Lennox.
Agronomy 14 00921 g009
Figure 10. Influence of triple interaction (F × Y × S) on yield, TKW, and TW of spring wheat. Note: *,°, **,°°, ***—significant at the 5%, 1%, and 0.1% positive and negative probability levels, respectively; LSD—least significant difference. S1—Pădureni; S2—Granny; S3—Triso; S4—Taisa; S5—Ciprian; S6—Lennox; F1-ct. (control variant) = N36P92; F2 = F1 + N72; F3 = F1 + N105; LSD 5% = 620.27; LSD 1% = 863.13; LSD 0.1% = 1211.53; LSD 5% = 4.76; LSD 1% = 6.40; LSD 0.1% = 8.47; LSD 5% = 1.32; LSD 1% = 1.80; LSD 0.1% = 2.44.
Agronomy 14 00921 g010
Figure 11. Influence of triple interaction (F × Y × S) on protein content (%) of spring wheat. Note: *, **, ***—significant at the 5%, 1%, and 0.1% probability levels, respectively; LSD—least significant difference. S1—Pădureni; S2—Granny; S3—Triso; S4—Taisa; S5—Ciprian; S6—Lennox; F1-ct. (control variant) = N36P92; F2 = F1 + N72; F3 = F1 + N105; LSD 5% = 0.68; LSD 1% = 0.93; LSD 0.1% = 1.27.
Agronomy 14 00921 g011
Figure 12. Influence of triple interaction (F × Y × S) on FLA and T leaf of spring wheat. Note: *,°, **,°°, ***,°°°—significant at the 5%, 1%, and 0.1% positive and negative probability levels, respectively; LSD—least significant difference. S1—Pădureni; S2—Granny; S3—Triso; S4—Taisa; S5-Ciprian; S6—Lennox; F1-ct. (control variant) = N36P92; F2 = F1 + N72; F3 = F1 + N105; LSD 5% = 5.71; LSD 1% = 7.73; LSD 0.1% = 10.38; LSD 5% = 0.52; LSD 1% = 0.71; LSD 0.1% = 0.95.
Agronomy 14 00921 g012
Figure 13. Influence of triple interaction (F × Y × S) on VPD and evapotranspiration of spring wheat. Note: *,°, **, ***,°°°—significant at the 5%, 1%, and 0.1% positive and negative probability levels, respectively; LSD—least significant difference. S1—Pădureni; S2—Granny; S3—Triso; S4—Taisa; S5—Ciprian; S6—Lennox; F1-ct. (control variant) = N36P92; F2 = F1 + N72; F3 = F1 + N105; LSD 5% = 0.11; LSD 1% = 0.15; LSD 0.1% = 0.21; LSD 5% = 0.04; LSD 1% = 0.06; LSD 0.1% = 0.08.
Agronomy 14 00921 g013
Table 1. Weather conditions of the experimental area, Turda Meteorological Station, 2019–2020.
Month2019202060 Years Average
Rainfall, [mm]Temperatures, [°C]Rainfall, [mm]Temperatures, [°C]Rainfall, [mm]Temperatures,
[°C]
m.a.dev.m.a.dev.m.a.dev.m.a.dev.
March12.3−11.37.32.63410.46.11.423.64.7
April62.616.711.31.417.8−28.110.30.445.99.9
May152.483.713.6−1.444.4−24.313.7−1.368.715.0
June68.8−16.021.83.9166.681.819.11.284.817.9
July35.0−42.120.40.786.89.720.20.577.119.7
August63.87.222.12.8581.521.52.256.519.3
Note: m.a. = monthly average; dev. = deviation.
Table 2. F-test and statistical probability levels from analysis of variance for yield, quality and some physiological indicators of spring wheat.
Source of VarianceYear
(Y)
Fertilization
(F)
Genotype
(S)
Y × FY × SF × SY × F × S
GY, kg ha−1
Probability levels, [%]
19.843
5
10.133
1
79.996
1
5.881
5
11.766
1
1.758
NS
1.123
NS
P, %
Probability levels, [%]
1299.228
0.1
181.415
0.1
128.080
0.1
38.265
1
31.346
1
2.336
5
1.093
NS
TKW, g
Probability levels, [%]
66.058
5
5.675
5
7.549
1
4.272
NS
1.622
NS
4.215
1
3.189
1
TW, kg hl−1
Probability levels, [%]
120.499
0.1
11.870
1
72.181
0.1
22.119
1
102.219
0.1
4.818
1
4.571
1
FLA, cm2
Probability levels, [%]
163.463
1
19.402
1
53.671
0.1
2.724
NS
5.777
1
2.603
5
2.493
5
T leaf, °C
Probability levels, [%]
21.761
5
17.086
1
2.452
5
29.184
1
12.977
1
8.330
1
7.824
1
VPD, kPa
Probability levels, [%]
18,667.82
0.1
61.951
0.1
13.006
1
38.970
1
20.645
1
25.755
1
14.722
1
Evap, mmol m−2 s−1
Probability levels, [%]
5262.036
0.1
642.407
0.1
168.062
0.1
792.707
0.1
51.747
0.1
80.095
0.1
64.164
0.1
Note: GY = grain yield; P = protein content; TKW = thousand kernel weight; TW = test weight; FLA = flag leaf area; T leaf = temperature of flag leaf; VPD = vapor pressure deficit; Evap = evapotranspiration; 5%, 1%, and 0.1% probability levels; NS—non-significant.
Table 3. The influence of experimental factors on yield, quality, and some physiological indicators of spring wheat.
Source of VariationGY,
[kg ha−1]
P,
[%]
TKW,
[g]
TW,
[kg hl−1]
FLA,
[cm2]
T leaf,
[°C]
VPD,
[kPa]
Evap,
[mmol m−2 s−1]
YearY0–ct.4897.3913.6533.8377.2926.1726.812.291.33
20194795.9612.67 °°31.3376.67 °31.26 *26.651.64 °°°1.83 ***
20204998.8214.64 **36.3377.91 *21.09 °26.982.95 ***0.83 °°°
LSD5%195.820.242.650.483.420.300.040.06
1%452.200.546.111.127.890.700.090.14
0.1%1439.021.7319.443.5525.122.230.300.43
FertilizationF1–ct.4561.3312.4132.8976.6923.9726.942.351.35
F24953.08 *13.84 ***33.9877.47 **29.00 ***26.55 °°°2.18 °°°1.44 ***
F35177.75 **14.72 ***34.63 *77.71 **25.5626.942.351.21 °°°
LSD5%320.150.281.210.511.910.180.040.01
1%465.670.411.750.742.770.260.060.02
0.1%698.500.622.631.104.160.390.090.03
GenotypeS0–ct.4897.3913.6533.8377.2926.1726.812.291.33
S14287.11 °°°14.49 ***32.1978.50 ***29.81 **26.662.311.28 °°°
S24970.1712.43 °°°35.2176.78 °26.6626.772.24 °1.40 ***
S35575.56 ***13.03 °°°32.3178.16 ***19.89 °°°26.852.331.32
S44089.89 °°°14.56 ***34.0074.53 °°°33.81 ***26.962.35 **1.23 °°°
S55001.2214.57 ***36.93 **77.4428.1326.912.301.33
S65460.39 ***12.84 °°°32.3778.32 ***18.75 °°°26.722.21 °°°1.44 ***
LSD5%190.660.251.990.502.250.210.040.02
1%253.580.332.650.663.000.270.060.02
0.1%329.840.433.440.863.900.360.070.03
Note: *,°, **,°°, ***,°°°—significant at the 5%, 1%, and 0.1% positive and negative probability levels respectively; LSD—least significant difference. GY = grain yield; P = protein content; TKW = thousand kernel weight; TW = test weight; FLA = flag leaf area; T leaf = temperature of flag leaf; VPD = vapor pressure deficit; Evap = evapotranspiration; Y0—average of the years (control); F1 (control) = N36P92; F2 = F1 + N72; F3 = F1 + N105; S1—Pădureni; S2—Granny; S3—Triso; S4—Taisa; S5—Ciprian; S6—Lennox; S0—mean of genotypes (control).
Table 4. The established correlations between yield, quality, and some physiological indices in spring wheat.
GYPTKWTWFLAT leafVPDEvap
GY1
P−0.1331
TKW0.0460.1601
TW0.6170.048−0.1251
FLA−0.7020.538−0.127−0.5481
T leaf−0.0040.0570.443−0.122−0.1821
VPD−0.1730.1380.167−0.120−0.0540.8601
Evap0.210−0.521−0.1660.149−0.198−0.679−0.8581
GY = grain yield; P = protein content; TKW = thousand kernel weight; TW = test weight; FLA = flag leaf area; T leaf = temperature of flag leaf; VPD = vapor pressure deficit; Evap = evapotranspiration. α 5% = 0.400; α 1% = 0.468; α 0.1% = 0.590.
Disclaimer/Publisher’s Note: The statements, opinions and data contained in all publications are solely those of the individual author(s) and contributor(s) and not of MDPI and/or the editor(s). MDPI and/or the editor(s) disclaim responsibility for any injury to people or property resulting from any ideas, methods, instructions or products referred to in the content.

