A Calculation Tool for Analyzing Nitrogen Use Efficiency in Annual and Perennial Crops

Department of Crop Production Ecology, Swedish University of Agricultural Sciences, 75007 Uppsala, Sweden
Agronomy 2014, 4(4), 470-477; https://doi.org/10.3390/agronomy4040470
Submission received: 10 September 2014
/
Revised: 18 October 2014
/
Accepted: 31 October 2014
/
Published: 5 November 2014
(This article belongs to the Special Issue Towards a Better Understanding of Agronomic Efficiency of Nitrogen in Different Agro-Ecosystems)
Abstract
:Assessment of crop nitrogen use efficiency (NUE) is important in agricultural research. Various approaches exist to analyze NUE. A recently proposed NUE concept is further developed and a calculation tool for practical use presented. A critical component in the NUE concept is the plants’ mean nitrogen (N) content during the main growth period (N’). The N’ is delimited by the critical crop phenology stages initiating and terminating accelerated crop N uptake. Especially when experimental treatments and/or crop cultivars cause great variation in phenology, it is often not feasible to perform destructive plant harvests at the critical phenology stages for all treatments and cultivars, which may result in inaccurate estimates of N’ and, ultimately, the NUE components N uptake efficiency and yield-specific N efficiency. A method is proposed to accurately calculate the crop N contents at the relevant critical phenology stages even when sampling is made at other time points. The only requirements are two separate destructive plant harvests performed within the main growth period, together with the time points for the critical phenology events. The method was exemplified using data from wheat and the perennial energy crop Salix, and an electronic calculation tool for the various NUE components is provided.
1. Introduction
Nitrogen (N) is frequently regarded the single most important mineral nutrient limiting crop production in many agricultural crops worldwide. In addition, N-efficient crops will be important for maintaining or improving crop yields in the future [1,2,3]. Crops are often fertilized with large amounts of N fertilizer, but only a small fraction of this fertilizer (roughly 5% to 50%, e.g., [4]) is taken up by the plants. Applied N not taken up by the crop or immobilized in the soil by e.g., microorganisms is lost by volatilization, denitrification, leaching and runoff, and can cause serious environmental problems [5]. The N losses can be reduced by enhancing the plants’ N uptake efficiency, which greatly affects the overall N use efficiency (NUE) of a crop. Other possible routes for improving the overall NUE of a crop are modifying the efficiencies in plant-internal N use (e.g., more yield per N taken up by the plant) and N translocation from non-harvested into the harvested plant parts.
A prerequisite for any improvement of overall NUE of crops grown in different agro-ecosystems is the appropriate assessment of NUE and its underlying components using methods that allow fair comparisons across different crops, varieties, experimental setups and agro-ecological environments. Many different approaches for assessing NUE have been published during the last few years (reviewed in [4,6]). Moll et al. [7] developed an agronomic approach based on cereals and separated NUE into the components N uptake efficiency and N utilization efficiency; and Ågren [8] presented the ecological concept of N productivity that in principle applies to all growing plants. Weih et al. [6] reviewed the current NUE concepts in agronomy and ecology, and developed a new flexible concept for analyzing NUE in annual and perennial crops by integrating elements from [7,8]. The NUE concept by Weih et al. [6] has been applied and evaluated in different contexts (e.g., [9,10]), and some critical methodology issues were identified. For example, great differences in plant development timing between crops, varieties and experimental treatments can cause inaccurate estimates of NUE components especially when destructive plant samplings to detect plant N contents are not feasible to be made accurately at the relevant developmental stages for each genotype and treatment [9]. Asplund et al. [9] suggested that this problem could be overcome by appropriate method development.
The objectives of this work are to develop the NUE concept by Weih et al. [6] towards a more feasible and robust method, to illustrate the improved method with data from an annual and a perennial crop (wheat and Salix grown on agricultural land), and to introduce an electronic calculation tool (Microsoft Excel) for all NUE components under consideration of the improved method. The calculation tool is provided in the supplementary material to this work.
2. Material and Methods
2.1. Assessment of NUE and Its Components
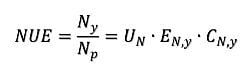
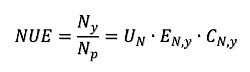
The overall NUE (g g−1) is the N accumulation capacity from the initial perennial plant parts (e.g., seed grain in cereals, winter shoots in woody perennials) to the harvested plant parts (grain or shoot yield), and decomposed into the following three components, according to Weih et al. [6]:
Ny is the yield N content (g N) and Np is the N content in the perennial plant parts (seed grain or winter shoots) (g N); for cereals the Np is equivalent to the Ns by Weih et al. [6]; UN is the N uptake efficiency (g g−1):
with N’ representing the mean plant N content during the main growth period; EN,y is the yield-specific N efficiency (g g−1):
with By being the yield biomass; CN,y is the yield N concentration (g g−1):
Mean plant N content during the main growth period (N’) thus is a major determinant of the NUE components UN and EN,y (Equations (2) and (3)) and is consequently most critical in analyzing NUE. In cereals, the main growth period can be defined as the period from the start of accelerated plant N uptake and growth in spring (BBCH 11 to 13 according to Lancashire et al. [11]) to the beginning of anthesis (BBCH 61), where major plant N uptake and growth ceases and factors other than nutrients limit plant growth and development. The corresponding phenology stages can be defined also for other crops. For example in willow, the start and end of the main growth period is defined by the bud break and bud set, respectively.
2.2. Assessment of the Mean Plant N Content during the Main Growth Period (N’)
An accurate estimate of N’ can be made when plants are destructively sampled and N content is determined exactly at the time points of the critical phenology stages that represent the start and end of the main growth period. For practical reasons, destructive sampling often is not feasible to be made on exactly the dates of the critical phenology stages, but an accurate estimate of N’ can still be made assumed near-exponential N accumulation rate in the plant and provided that destructive plant harvests are performed at two separate occasions during the main growth period. Based on the plant N contents determined at the first harvest (N’H1) and the second harvest (N’H2), the mean relative N accumulation rate (RN) between the two sampling occasions is calculated according to classical growth analysis [12]:
with tH1 and tH2 being the days of the first and second harvest.
The RN represents the slope of the line connecting the plant N contents (loge transformed) between the first and second harvest. Based on that slope and a fixed point at time tH1, the constant c of the corresponding linear equation can be derived:
With that information the plant N content for any given point in time (Nt) can be calculated:
Following that procedure, the plant N contents can be calculated for the time point of the phenology stage initiating the main growth period (tN’i) and the time point of the phenology stage terminating the main growth period (tN’f), although no sampling has been performed at the exact dates of those stages. The mean N during the main growth period is then calculated as the mean of the plant N contents at the start and end of the main growth period, as defined by the dates of the critical phenology stages.
2.3. Data Material Used for the Case Study
Two data sets available from a greenhouse study on spring wheat (Triticum aestivum L.) and a field study on biomass willows (Salix spp.) grown on agricultural land in Sweden were used to illustrate and discuss the calculation procedure previously described.
In the wheat experiment, the varieties “Diskett”, “Granary”, “Quarna”, “Stilett”, “Vinjett”, and a landrace from Dalecarlia were greenhouse-grown at two nutrient fertilization and three drought treatments in a full-factorial design (see [9] for details).
3. Results and Discussion
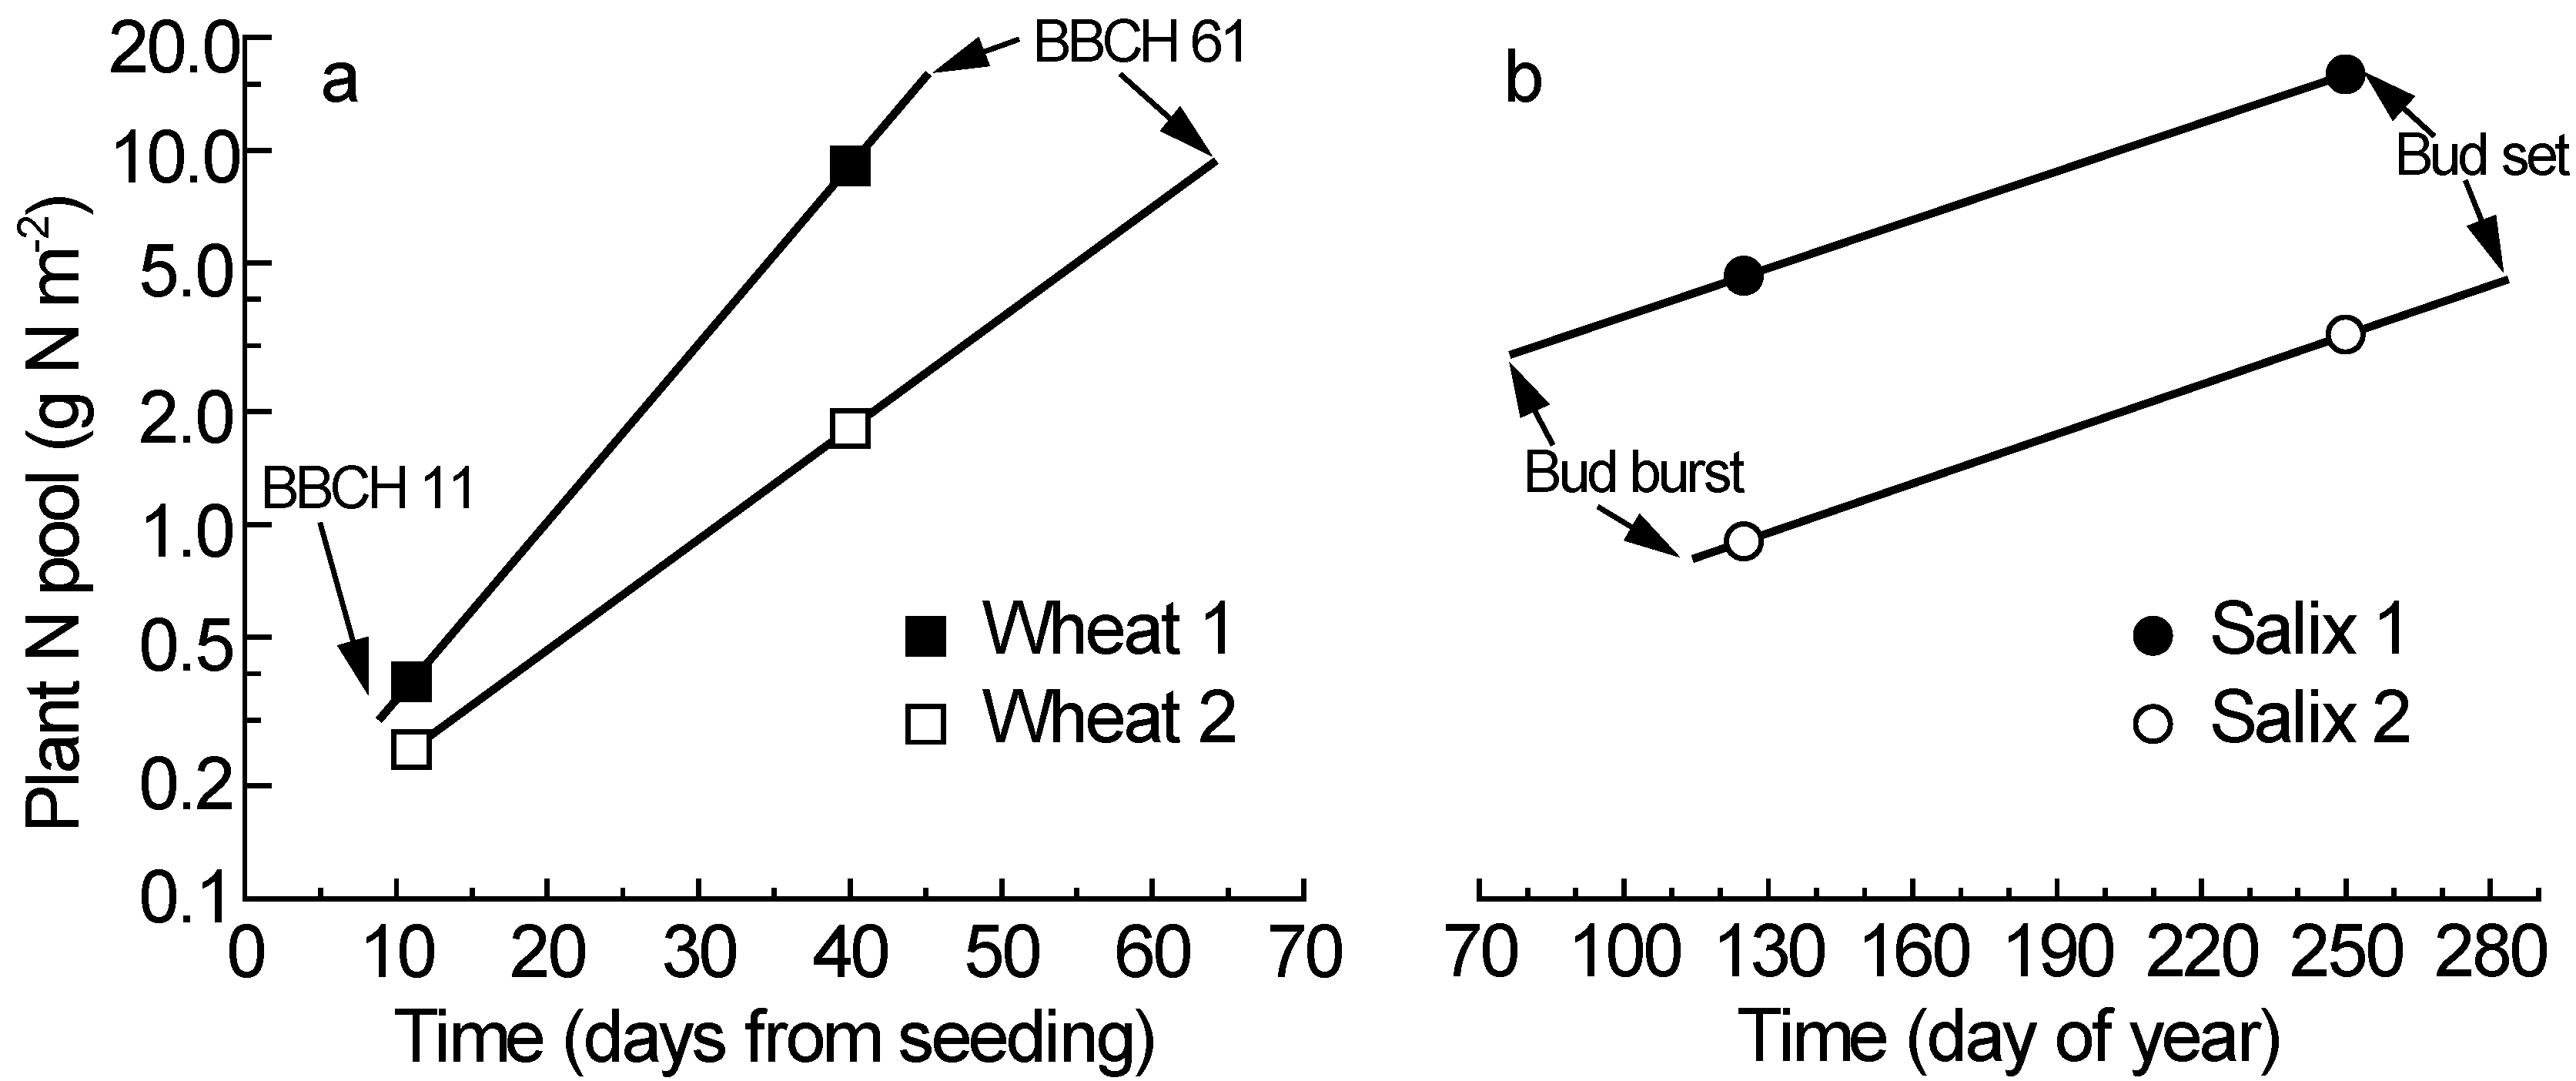
In the wheat experiment, the first destructive plant harvest closely reflected the plant N contents at the start of the main growth period (N’H1), because that harvest was made when the first leaves were unfolded (BBCH 11), which here occurred on days (after planting) 9 to 11 across all varieties and treatments. This means that N’H1 is similar to N’i in this experiment (Table 1, Figure 1a). In contrast, the phenology stage terminating the main growth period (BBCH 61) varied greatly across the varieties and treatments (range: day 45 to 64), and the second plant harvest was made on day 40, when most plants had not reached the critical anthesis stage (BBCH 61). This means that N’H2 differed considerably from N’f for most of the plants in this experiment, and accurate values of N’f must be calculated to accommodate the genetic and treatment variation in phenology. The calculations of N’i and N’f are here illustrated with two scenarios representing the extreme values observed in the wheat experiment [9], i.e., BBCH 11 at day 9 and 11 for N’i, and BBCH 61 at day 45 and 64 for N’f (Figure 1a). Thus, the fictional variety here called “Wheat 1” represents an early-starting, fast-growing and early-flowering variety, whilst “Wheat 2” combines the characteristics late starting, slow growing and late flowering. The construction of fictional varieties is indeed based on true observations from real experiments, and an illustrative attempt to clarify the methodology proposed here.
In the willow experiment, the critical phenology stage for N’i is bud burst and the critical phenology stage for N’f is bud set [14]. Also in the willow data, the calculations of N’i and N’f are based on two scenarios with the extreme values covering the observed genetic and treatment variation in the critical phenology stages (early phenology in “Salix 1” and late phenology in “Salix 2”). Among the genotypes and treatments, bud burst varied from day (of year) 77 to 115, and the first destructive plant harvest was carried out on day 125 (Figure 1b). The second harvest was made on day 250, and bud set occurred from day 252 to 283 depending on variety and treatment. The similar slopes of the two willow scenarios indicate similar relative N accumulation rate (RN), despite great differences in total plant N pools and thus the mean N during the main growth period (N’).
Figure 1.
The increase of total plant N content during the main growth period for two scenarios in wheat (a) and willow (b) (scenario description see main text); note the loge scale for the plant N pool; BBCH 11 and BBCH 61 indicate the critical phenology stages in wheat; bud burst and bud set are the corresponding stages for willow; the symbols (squares for wheat and circles for willow) indicate the plant N contents at two destructive plant harvests; data from [9] for wheat and [13,14] for willow.


Table 1.
The calculation of the mean N content during the main growth period (N’) according to Equations (5)–(7) for two wheat and two Salix scenarios (scenario description see main text); shaded background indicates input variables, and light background indicates the calculated output; t = time (day after seeding in wheat, day of year in Salix); N’i and N’f = initial and final plant N contents with respect to the main growth period; H1 and H2 = destructive harvest 1 and 2; RN = relative N accumulation rate during the main growth period; data from [9] for wheat and [13,14] for Salix.
| Variable (unit) | Wheat 1 | Wheat 2 | Salix 1 | Salix 2 |
|---|---|---|---|---|
| tN’i (day) | 9 | 11 | 77 | 115 |
| tN’f (day) | 45 | 64 | 252 | 283 |
| tH1 (day) | 11 | 11 | 125 | 125 |
| tH2 (day) | 40 | 40 | 250 | 250 |
| N’H1 (g N m−2) | 0.4 | 0.3 | 4.6 | 0.9 |
| N’H2 (g N m−2) | 9.1 | 1.8 | 15.9 | 3.2 |
| RN (day−1) * | 0.1095 | 0.0681 | 0.0099 | 0.0102 |
| Constant c § | −2.172 | −2.135 | 0.286 | −1.374 |
| N’i (g N m−2) | 0.3 | 0.3 | 2.9 | 0.8 |
| N’f (g N m−2) | 15.7 | 9.2 | 16.2 | 4.5 |
| N’ (g N m−2) | 8.0 | 4.7 | 9.5 | 2.6 |
| N’H1H2 (g N m−2) | 4.7 | 1.0 | 10.3 | 2.1 |
* The RN values represent the slopes of the lines connecting the plant N pools in Figure 1; § cf. Equation (6).
In some of the scenarios, the accurate N’ values calculated with the extrapolation procedure (i.e., N’ in Table 1) differ greatly from the corresponding values calculated on basis of the original harvest dates (i.e., N’H1H2 in Table 1). For example in the wheat scenarios, the RN is much greater than in the willow scenarios, which results in greater differences between the two ways of N’ calculation in the wheat. The scenario comparison reveals that any comparison of N’ (and thus the NUE components UN and EN,y; Equations (2) and (3)) among different crops is sensitive to the method of N’ calculation. Therefore, fair NUE comparisons among different crops should be based on the procedure proposed here or similar methods that consider the exact timing of the critical phenology stages for the main growth period.
The calculation method described here assumes that the RN is similar during the period between the two destructive harvests and the short time period(s) before and/or after, i.e., the days between the critical phenology stages and the destructive harvests. That assumption can be regarded valid as long as the environmental conditions are normal in the sense that no exceptional weather events in terms of temperature and precipitation occur during the short time period(s) over which the RN is extrapolated. In addition, as a rule, the accumulated duration of the extrapolated period should not be longer than approximately one third of the length of the whole main growth period. If exceptional weather conditions do occur and/or the accumulated length of the extrapolated period exceeds the above limit, additional destructive harvest(s) should be considered to ensure correct estimates of the N’.
In a recent paper, Asplund et al. [9] concluded a necessity of method improvement to ensure the accurate estimation of N’ (and thereby UN and EN,y) also in situations in which genotypes and treatments produce great variation in the timing of the critical developmental stages for the main growth period. The present paper provides the required method improvement. Judged from the scenarios presented here, it appears likely that the UN values in Asplund et al. [9] are generally underestimates, and the EN,y values are overestimates, because they are based on inaccurate (under)estimates of N’ (i.e., N’H1H2). The inaccurate estimate of N’ has no effect on the overall NUE (cf. Equation (1)), but is still important since the NUE components UN and EN,y are often most interesting in terms of crop NUE comparisons and evaluation.
The calculation tool provided here (cf. supplementary material) greatly facilitates the accurate calculation of NUE and its components (sensu [6]) and requires the following input: The days of the critical phenology stages limiting the main growth period and the days and plant N contents at two destructive plant harvests within the main growth period, for the calculation of N’; the N contents in the perennial plant parts (e.g., seed in cereals, winter shoots in Salix) and the final biomass and N yields, for the calculation of the NUE and its components. Hence, this method of NUE assessment requires a few more input variables compared to for example the popular Moll et al. [7] concept often applied to cereals, but instead offers great flexibility and a functionally sound interpretation of the NUE components (e.g., EN,y) as was previously discussed [6,9]. The use of the here introduced method improvement for the accurate assessment of N’ (e.g., Equations (5)–(7)) is especially important when crops with high N acquisition rates (i.e., high RN) are to be evaluated and/or when destructive plant harvests, e.g., for feasibility reasons, cannot be carried out exactly at the time points of the critical phenology stages for the main growth period.
Another advantage of the NUE concept [6] is that it does not necessarily require any estimates of soil N contents, which generally are very much linked to the method being used [15]. Thus, the plant-based perspective of this approach allows a clear separation of plant characteristics and environmental factors affecting NUE, which is often required in research. However, NUE in terms of the accumulation capacity from the initial to the harvested plant parts (e.g., Equation (1)) is not always an appropriate measure for evaluation and comparison. Therefore, the calculation tool provided in the supplement also allows for the calculation of soil N-based NUE (i.e., NUESoil in the calculation tool), which indicates the net N accumulation over the whole growing season per soil N and requires an estimate of soil N content as an additional input.
The NUE assessment method presented here assumes near-exponential plant growth and N accumulation rate during the main growth period (e.g., Equation (5)), which is justified when integrated over extended periods of active plant growth [8,12]. In concert with a low time resolution of plant sampling, this can be a limitation for more detailed physiological analyses of N uptake dynamics over shorter time intervals of hours or days, for which other approaches are more appropriate. However, the strength of the method is its flexibility in the comparison of different crops and cropping systems and the whole-plant approach applicable at field level, which should make the method a useful tool for example in the validation of plant breeding progress or management techniques targeting improvements of crop NUE. Possible applications are therefore in crop improvement programs (e.g., crop breeding) and cropping systems research with focus on both improved yields and environmental performance, for which crop NUE is important [1,2,3,4,5]. Thus, particularly with the improvements presented here and when applying the NUE calculation tool, the NUE method [6] should now be easy to use in various experimental and agro-ecological contexts where assessment of NUE is desired e.g., for the validation of techniques to improve the NUE of crops. In addition to the assessment of NUE, the assessment method and the calculation tool can also be used for the evaluation of the efficiencies of plant nutrients other than nitrogen, for example phosphorus.
4. Conclusions
The proposed method improves the NUE assessment concept [6] and allows more accurate and robust calculations especially when crops, varieties and/or treatments are used that generate considerable variation in plant development. The NUE calculation tool provided in the supplementary material should make the method feasible to use in practice.
Acknowledgments
This work was partly funded by the Swedish Energy Agency (project No. 36654-1). I also thank Friderike Beyer, Stefanie Hoeber and Fereshteh Pourazari for valuable comments to the manuscript.
Conflict of Interest
The author declares no conflict of interest.
References
- Good, A.G.; Shrawat, A.K.; Muench, D.G. Can less yield more? Is reducing nutrient input into the environment compatible with maintaining crop production? Trends Plant Sci. 2004, 9, 597–605. [Google Scholar]
- Dobermann, A. Nitrogen use efficiency—State of the art. In Proceedings of the IFA International Workshop on Enhanced Efficiency Fertilizers, Frankfurt, Germany, 28–30 June 2005; pp. 1–16.
- Fageria, N.K.; Baligar, V.C.; Li, Y.C. The role of nutrient efficient plants in improving crop yields in the twenty-first century. J. Plant Nutr. 2008, 31, 1121–1157. [Google Scholar] [CrossRef]
- Carranca, C. Nitrogen Use Efficiency by Annual and Perennial Crops. In Farming for Food and Water Security; Lichtfouse, E., Ed.; Springer Science+Business Media: Dordrecht, The Netherlands, 2012; pp. 57–82. [Google Scholar]
- Canfield, D.E.; Glazer, A.N.; Falkowski, P.G. The evolution and future of earth’s nitrogen cycle. Science 2010, 330, 192–196. [Google Scholar] [CrossRef] [PubMed] [Green Version]
- Weih, M.; Asplund, L.; Bergkvist, G. Assessment of nutrient use in annual and perennial crops: A functional concept for analyzing nitrogen use efficiency. Plant Soil 2011, 339, 513–520. [Google Scholar] [CrossRef]
- Moll, R.H.; Kamprath, E.J.; Jackson, W.A. Analysis and interpretation of factors which contribute to efficiency of nitrogen utilization. Agron. J. 1982, 74, 562–564. [Google Scholar] [CrossRef]
- Ågren, G.I. Theory for growth of plants derived from the nitrogen productivity concept. Physiol. Plant. 1985, 64, 17–28. [Google Scholar] [CrossRef]
- Asplund, L.; Bergkvist, G.; Weih, M. Proof of concept: Nitrogen use efficiency of contrasting spring wheat varieties grown in greenhouse and field. Plant Soil 2014, 374, 829–842. [Google Scholar] [CrossRef]
- Weih, M.; Hoeber, S.; Beyer, F.; Fransson, P. Traits to ecosystems: the ecological sustainability challenge when developing future energy crops. Front. Energy Res. 2014, 2, 17. [Google Scholar] [CrossRef]
- Lancashire, P.; Bleiholder, H.; van den Boom, T.; Langelüddeke, P.; Stauss, R.; Weber, E.; Witzenberger, A. A uniform decimal code for growth stages of crops and weeds. Ann. Appl. Biol. 1991, 119, 561–601. [Google Scholar] [CrossRef]
- Hunt, R. Plant Growth Curves–the Functional Approach to Plant Growth Analysis; Edward Arnold: London, UK, 1982. [Google Scholar]
- Weih, M.; Nordh, N.-E. Determinants of biomass production in hybrid willows and the prediction of field performance from pot studies. Tree Physiol. 2005, 25, 1197–1206. [Google Scholar] [CrossRef] [PubMed]
- Weih, M. Genetic and environmental variation in spring and autumn phenology of biomass willows (Salix spp.): Effects on shoot growth and nitrogen economy. Tree Physiol. 2009, 29, 1479–1490. [Google Scholar] [CrossRef] [PubMed]
- Carter, M.R.; Gregorich, E.G. Soil Sampling and Methods of Analysis, 2nd ed.; Taylor & Francis: Boca Raton, FL, USA, 2008; pp. 1–198. [Google Scholar]
© 2014 by the authors; licensee MDPI, Basel, Switzerland. This article is an open access article distributed under the terms and conditions of the Creative Commons Attribution license (http://creativecommons.org/licenses/by/4.0/).
Share and Cite
MDPI and ACS Style
Weih, M. A Calculation Tool for Analyzing Nitrogen Use Efficiency in Annual and Perennial Crops. Agronomy 2014, 4, 470-477. https://doi.org/10.3390/agronomy4040470
AMA Style
Weih M. A Calculation Tool for Analyzing Nitrogen Use Efficiency in Annual and Perennial Crops. Agronomy. 2014; 4(4):470-477. https://doi.org/10.3390/agronomy4040470
Chicago/Turabian StyleWeih, Martin. 2014. "A Calculation Tool for Analyzing Nitrogen Use Efficiency in Annual and Perennial Crops" Agronomy 4, no. 4: 470-477. https://doi.org/10.3390/agronomy4040470