Evaluating Two Crop Circle Active Canopy Sensors for In-Season Diagnosis of Winter Wheat Nitrogen Status
by
 , ,
, ,
Qiang Cao
1,2, 
Yuxin Miao
1,3,*,
Jianning Shen
1,
Fei Yuan
4,
Shanshan Cheng
1 and
Zhenling Cui
1 1
College of Resources and Environmental Sciences, China Agricultural University, Beijing 100193, China
2
National Engineering and Technology Center for Information Agriculture (NETCIA), Key Laboratory for Crop System Analysis and Decision Making, Ministry of Agriculture, Jiangsu Key Laboratory for Information Agriculture, Jiangsu Collaborative Innovation Center for the Technology and Application of Internet of Things, Nanjing Agricultural University, Nanjing 210095, China
3
Precision Agriculture Center, Department of Soil, Water and Climate, University of Minnesota, St. Paul, MN 55108, USA
4
Department of Geography, Minnesota State University, Mankato, MN 56001, USA
*
Author to whom correspondence should be addressed.
Agronomy 2018, 8(10), 201; https://doi.org/10.3390/agronomy8100201
Submission received: 21 August 2018
/
Revised: 17 September 2018
/
Accepted: 20 September 2018
/
Published: 21 September 2018
(This article belongs to the Special Issue Sensing and Automated Systems for Improved Crop Management)
Abstract
:Active crop canopy sensors can be used for non-destructive real-time diagnosis of crop nitrogen (N) status and guiding in-season N management. However, limited studies have compared the performances of two commercially available sensors with three different wavebands: Crop Circle ACS-470 (CC-470) and Crop Circle ACS-430 (CC-430). The objective of this study was to evaluate the performances of CC-470 and CC-430 sensors for estimating winter wheat (Triticum aestivum L.) N status at different measurement heights (40 cm, 70 cm and 100 cm) and growth stages. Results indicated that the canopy reflectance values of CC-470 were more affected by height compared to the CC-430 sensor. The normalized difference red edge (NDRE) and red edge chlorophyll index (CIRE) of CC-430 were stable at the three different measuring heights. The relationships between these indices and the N status indicators were stronger at the Feekes 9–10 stages than the Feekes 6–7 stages for both sensors; however, the CC-430 sensor-based vegetation indices had higher coefficient of determination (R2) values for both stages. It is concluded that the CC-430 sensor is more reliable than CC-470 for winter wheat N status estimation due to its capability of making height-independent measurements. These results demonstrated the importance of considering the influences of height when using active canopy sensors in field measurements.
1. Introduction
Winter wheat (Triticum aestivum L.) is important for China’s food security and sustainable development. However, farmers often apply nitrogen (N) fertilizer at rates much higher than required and at the wrong time. Precision N management is a promising strategy to match N supply with crop N demand in both space and time and, therefore, to improve N use efficiency and protect the environment [1,2]. The success of precision management requires the development of rapid, non-destructive technologies for in-season site-specific diagnosis of crop N status. Active canopy sensors (ACSs) are likely to play a greater role in agricultural remote sensing [2,3]. They have increased in popularity for quantifying the nutritional requirements of crops and as a tool for guiding applications of agrochemicals in real-time [4,5,6,7].
Active canopy sensors have modulated light emitting diodes that irradiate a plant canopy and measure a portion of the radiation reflected from the canopy without relying on ambient sunlight as used in passive sensors [8]. Although ACSs are independent of solar radiation, the choice of light source, viewing angle, and measuring area can still have important influences [9,10]. The measuring area depends, inter alia, on the sensor’s construction because the light signal is physically collimated, resulting in different viewing angles [10]. Thus, for a specific sensor with a given viewing angle, the measuring area changes according to the measuring distance, a potentially important factor that might affect the performance of ACSs. However, for handheld operating systems, it is difficult to maintain constant measuring distance even with fixed sensor positions [10]. In practice, ACSs have typically been used by following the manufacturers’ general use guidelines, which may need to be tailored to specific agricultural crops and production field conditions [9].
For most ACSs, the spectral readings of a single waveband change with varying distances to the target because emitted light from a point source follows the inverse square law, which means the light intensity decreases four times when the measuring distance doubles [8]. Nevertheless, not much research has demonstrated how the ACS sensors’ output values vary when the distance to the target changes, even within the ranges of measuring distances recommended by the manufacturers. Kipp, et al. [10] assessed the influence of measuring distance on the accuracy of the spectral readings from three different active sensors [GreenSeeker RT100 (Trimble Navigation Limited, Sunnyvale, CA, USA), Crop Circle ACS 470 (Holland Scientific, Inc., Lincoln, NE, USA), YARA N-Sensor ALS (Yara International ASA, Duelmen, Germany). They stated that the optimal measuring distances to crop canopies enabling stable sensor outputs were from 10 to 200 cm. However, to enable a uniform measuring area and avoid creases, Kipp, et al. [10] used fabric rather than real plant populations as a reference surface for the reflectance measurement because determining the optimal measurement height for ACSs using real plant populations was difficult [11].
If the single wavelengths are sensitive to changing distances, the measuring distance effect may be reduced by building spectral indices of two or more wavelengths. However, no studies or suppliers’ recommendations have evaluated the stability of spectral indices with respect to measuring distance. Recent advances in active canopy sensing have been the developments of Holland Scientific Crop Circle ACS-470 (CC-470) and Crop Circle ACS-430 (CC-430) with three optical measurement channels that can result in many potential spectral vegetation indices. The optimum wavelengths and vegetation indices vary for different crop biophysical parameters and growth stages [12,13,14]. Some of these indices, especially those based on red-edge bands, may perform better than the traditional normalized difference vegetation index (NDVI) for estimating crop N status [6,15,16,17,18]. Both the CC-470 and CC-430 have a red edge (730 nm) band, which permits them to calculate different red edge-based vegetation indices that have been consistently shown to perform well for estimating crop N status [19]. Thus far, several studies have compared GreenSeeker with Crop Circle ACS-210 (CC-210) or CC-470 [6,20,21]. Nevertheless, research with the CC-430 sensor is limited. In addition, the CC-430 sensor should be further evaluated and tested because, according to the manufacturer, it has the unique feature of collecting spectral reflectance measurements that are independent of height [22].
To our knowledge, little is known about the comparative assessment of the performance of CC-470 and CC-430 sensors in estimating winter wheat N status across different measuring distances, plant growth stages, and cultivars. Therefore, the objectives of the study were to (1) identify the influences of measurement heights on the values of single wavelength and vegetation indices obtained from both CC-470 and CC-430 sensors; and (2) evaluate the performances of both sensors for estimating winter wheat N status indicators and in-season N status diagnosis. The findings of this study will provide important recommendations for how to use ACSs effectively under real field conditions.
2. Materials and Methods
2.1. Study Area
This study was conducted at the Quzhou Experiment Station (115.0° E, 36.5° N) of the China Agricultural University, located in Quzhou County of the North China Plain (NCP). Quzhou County is an intensive agricultural region with more than 80% of the farmland being used for the rotation system of winter wheat and summer maize (Zea mays L.). The NCP has a warm-temperate sub-humid continental monsoon climate with cold winters and hot summers. The mean temperature is 9.6 °C and the precipitation is 118 mm during the winter wheat growing season of 2011–2012. The soil is clay loam with an organic matter content of 14.2 g kg−1, total N of 0.83 g kg−1, Olsen-P of 7.2 mg kg−1, NH4OAc-K of 125 mg kg−1, pH 8.3, and a soil bulk density of 1.36 g cm−3.
2.2. Experimental Design
The field experiment was designed as a split-plot experiment, repeated four times, with N level as the main plot and cultivar as the split-plot. The N treatments included 0 N control (CK), 70% optimal N rate (ONR), ONR based on in-season root zone N management (IRNM), 130% ONR, and farmer’s N practice (FNP). The cultivars were ‘Tainong 18’ (TN), a large spike cultivar, and ‘Liangxing 99’ (LX), a multiple spike cultivar. The two cultivars were both planted and harvested at the same time in the study. The N fertilizer rate for FNP was set at 300 kg N ha−1 (150 kg N ha−1 applied before planting and 150 kg N ha−1 applied at stem elongation stage), which is typical for this region. The ONR was determined following IRNM [23]. The rate of the ONR treatment was 134 kg N ha−1 (36 kg N ha−1 applied before planting and 98 kg N ha−1 applied during stem elongation, see Lu et al. [24] for more details), and the N fertilizer form was urea (46% N).
The main plot size was 300 m2 (15 × 20 m), and the split-plot size was 150 m2 (7.5 × 20 m). A total of 120 kg P ha−1 as triple superphosphate (45% P2O5), 100 kg K ha−1 as potassium chloride (60% K2O) and basal N fertilizers were broadcasted and incorporated into the upper 20 cm layer of soil by rotary tillage prior to sowing. The seeding density was 340 plants m−2, and the row spacing was 25 cm. Irrigation was applied up to three times: before the winter, around the stem elongation, and during the early grain filing stage, with 90 mm applied each time. No obvious weeds, pests or disease stress were observed during the wheat growing season.
2.3. Active Canopy Sensor Data Collection
Two new active canopy sensors with three wavebands were used to collect canopy reflectance information across each plot at different growth stages (from Feekes 6 (stem elongation) to Feekes 10.5 (onset of flowering) [25]). The first sensor used was the CC-470 sensor (Holland Scientific Inc., Lincoln, NE, USA), which is user configurable with a choice of up to six spectral bands covering blue (B, 450 nm), green (G, 550 nm), red (R, 650 nm, 670 nm), red edge (RE, 730 nm), and near-infrared (NIR, >760 nm) regions and three of these spectral bands can be used at a time. Filters for the G, RE and NIR bands were chosen for an extra purpose of evaluating the performances of green and red edge-based vegetation indices in addition to the objective of this study. The sensor was calibrated using the FieldCAL SC-1 calibrator. More details could be found in CC-470 User’s Guide (http://hollandscientific.com).
The second sensor was the CC-430 sensor (Holland Scientific Inc., Lincoln, NE, USA), which incorporates three fixed bands in R (670 nm), RE (730 nm) and NIR (780 nm) spectral regions. The CC-470 sensor’s field of view (FOV) was an oval of ~32° by ~6° range, while the FOV of the CC-430 sensor was an oval of ~30° by ~14° range. Spectral reflectance data can be easily recorded as a text file on a SanDisk flash card using the Holland Scientific GeoSCOUT GLS-400 data logger for both sensors.
The readings of both sensors were collected at three different measurement heights (40 cm, 70 cm and 100 cm) above winter wheat canopy at 10 Hz (10 readings per second) when walking at a constant speed in each plot. The sensor path was parallel to the seed rows with the beam of light being perpendicular to the seed row. Average reflectance values were computed to represent each plot. Single wavelength reflectance values of the NIR and RE bands were used to calculate the vegetation indices evaluated. The following formulas were used to calculate the normalized difference red edge index (NDRE) [26] and red edge chlorophyll index (CIRE) [27]:
where NIR and RE are the fractions of emitted NIR and red edge radiation reflected back from the sensed area, respectively.
2.4. Plant Sampling and Measurements
Plant samples were collected at the same stages as the remote sensing data. To understand the effect of growth stages on the relationships and performance of different single wavelengths and indices, we separated the growth stages into Feekes growth stages 6–7 (before canopy closure) and Feekes growth stages 9–10 (after canopy closure). Plant sampling was carried out as soon as sensor readings were collected. The aboveground biomass was collected by randomly clipping 1 m by 0.3 m vegetation from scanned plants. All plant samples were oven dried at 105 °C for 30 min, and then dried at 75 °C to a constant weight. Sub-samples that passed through a 1 mm screen in a sample mill were digested using H2SO4-H2O2, and the plant N concentration was determined using the standard Kjeldahl-N method [28]. The plant N uptake (PNU) was determined by multiplying plant N concentration by dry biomass. The N nutrition index (NNI) was calculated following Lemaire, et al. [29]:
where Na is the actual measured N concentration as a percentage of dry matter of the aboveground biomass and Nc is the critical N concentration for the crops of each plot given their amount of dry weight, as described by Yue, et al. [30]:
where Nc is the critical N concentration as a percentage of aboveground dry matter (%) and W is the aboveground biomass as dry matter (Mg ha−1).
2.5. Data Analysis
The standard deviation (SD), mean, and coefficient of variation (CV, %) of winter wheat N status indicators were calculated using Microsoft Excel (Microsoft Corporation, Redmond, WA, USA). Analysis of variance and the coefficient of determination (R2) relating single wavelengths and vegetation indices with N status indicators were calculated using SPSS 25 (IBM SPSS Statistics, Armonk, NY, USA), and means of measurement heights and N treatments were compared based on least significant difference (LSD) at 0.05 level of probability.
In this study, a semi-empirical approach was used to non-destructively estimate NNI directly based on active crop sensor vegetation indices. The diagnosis results of different heights were compared to those based on measured NNI using areal agreement and kappa statistics. The areal agreement is defined as the percentage of plots that share the same classification. By removing the proportion of agreement occurred by chance, the kappa statistic is a more robust measure than simple percent agreement [31]. The kappa coefficient can be calculated using Formula (5) [31]:
3. Results
3.1. Variability of the N Status Indicators
As expected, different winter wheat cultivars, growth stages, and N rate treatments caused considerable variation in the PNU and NNI estimations, as shown in Table 1. For all growth stages or a single growth stage, the PNU was more variable than the NNI. For different cultivars, PNU and NNI indicated similar trends. The NNI indicated a slightly over-supply of N at Feekes 6–7 growth stages, but under-supply at Feekes 9–10 growth stages. The high variation of PNU and NNI in the investigated field resulted in datasets that were suitable for developing regression models between vegetation indices and plant N status indicators.
3.2. Single Wavelength Reflectance at Different Measurement Heights
The readings of the three CC-470 bands varied significantly at different measurement heights at the Feekes 6–7 (before canopy closure) and Feekes 9–10 growth stages (after canopy closure) (Figure 1 and Figure 2). The reflectance values of the CC-470 bands decreased when the distance between the sensor and the target surface increased, and the values measured at 70 cm and 100 cm distances were more comparable than the ones obtained at 40 cm, which can be explained by the inverse square law aforementioned. In contrast, as shown in Figure 1 and Figure 2, the reflectance values of the three CC-430 bands were roughly consistent at different measurement distances.
3.3. Formatting of Mathematical Components
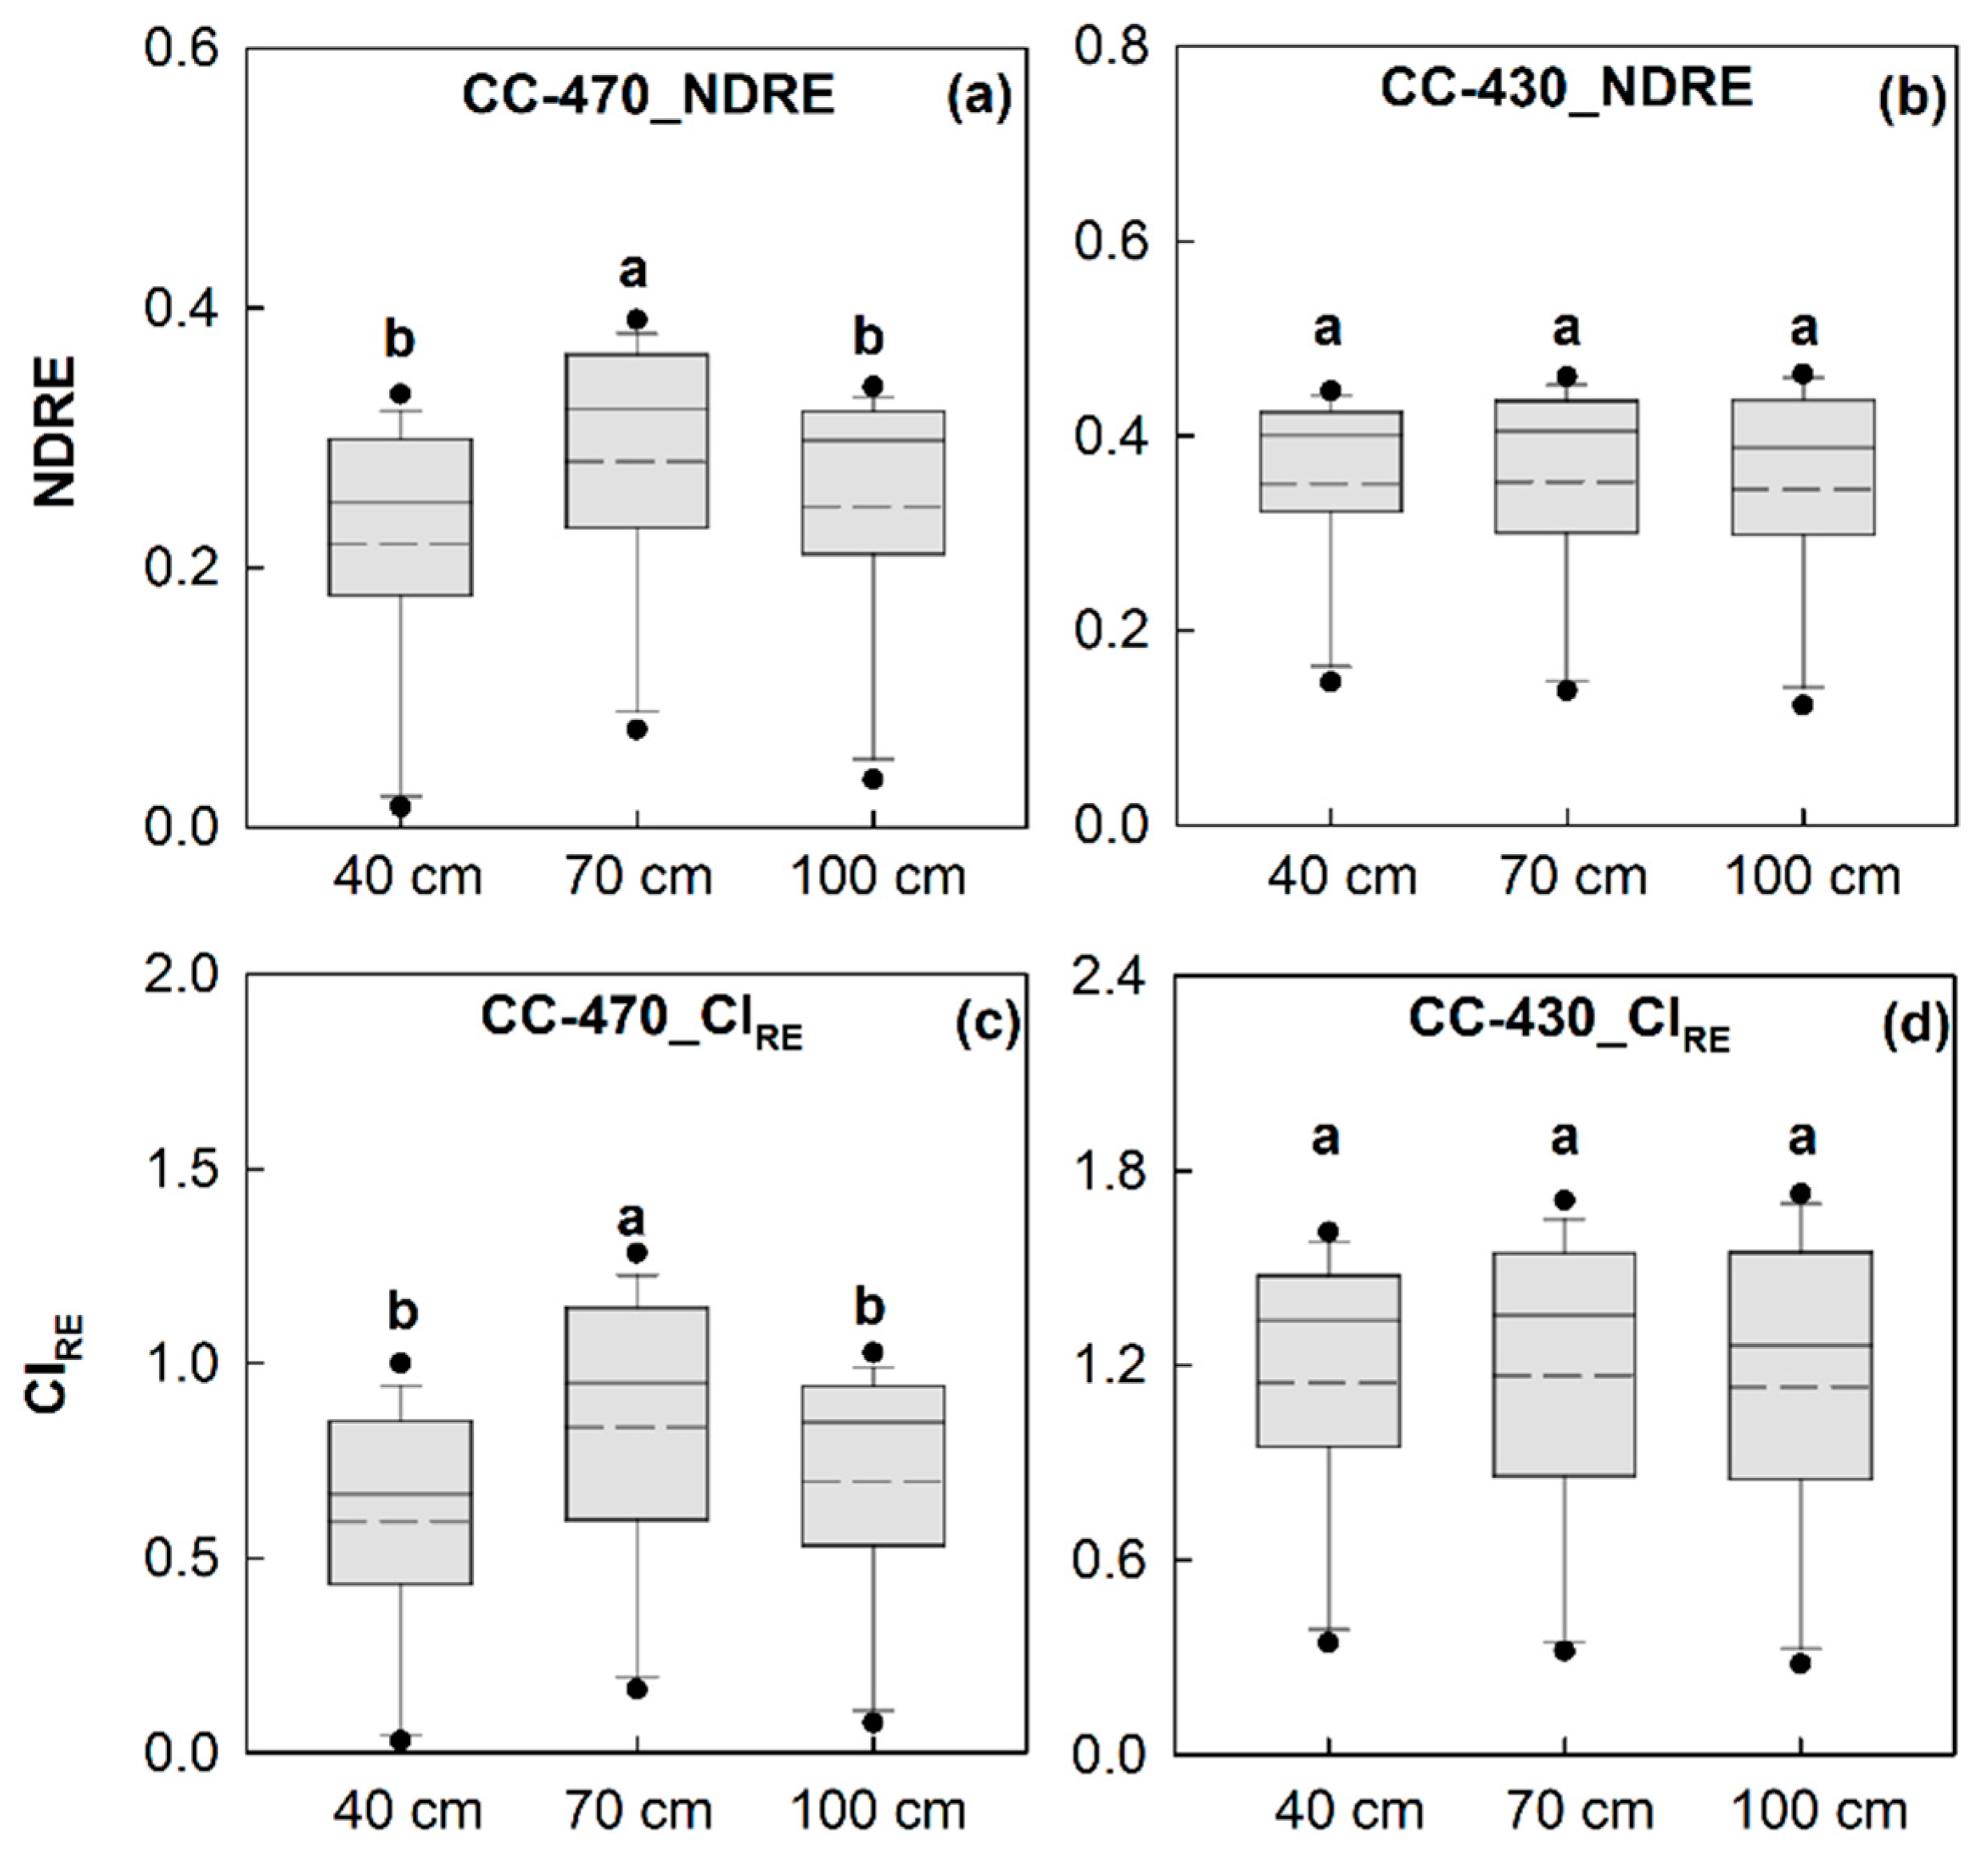
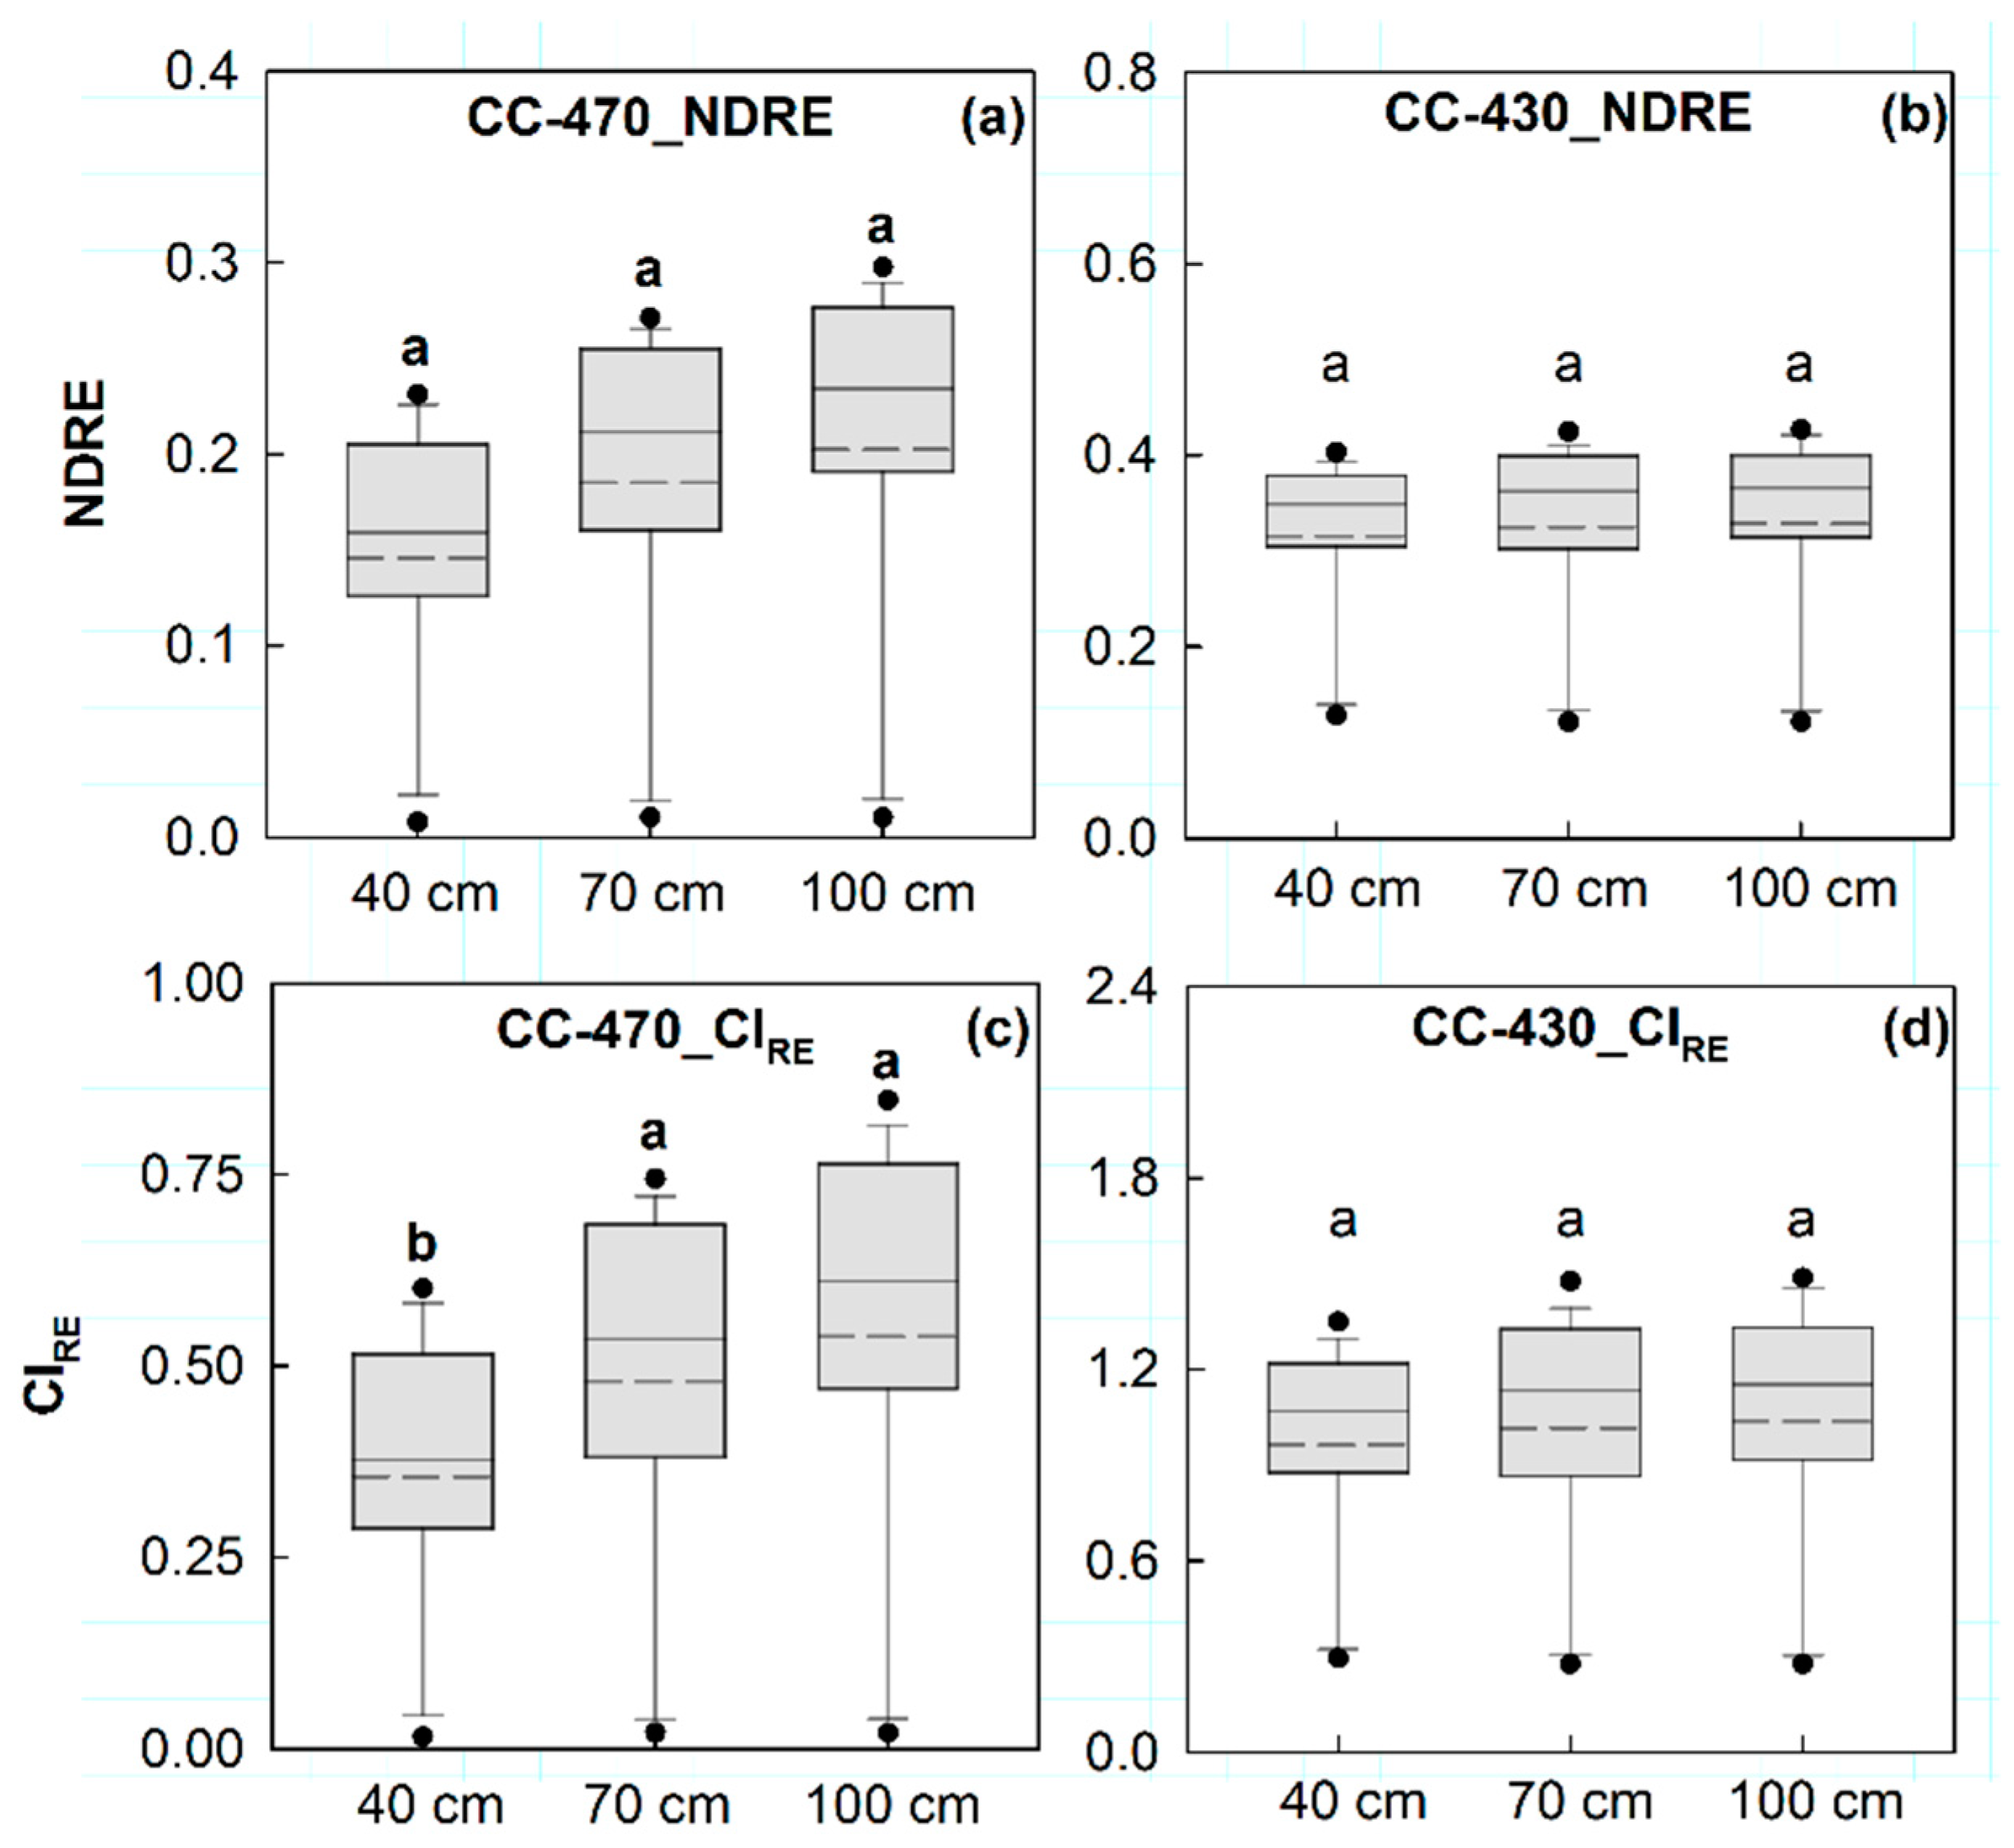
The NDRE and CIRE of the CC-470 sensor at the 70 cm sensor-object distance were significantly different from those based on the spectral collected at 40 cm and 100 cm distances during the Feekes 6–7 growth stages (before canopy closure) (Figure 3a,c). For the Feekes 9–10 growth stages, the NDRE of the CC-470 showed no significant changes over the measuring distances, while the CIRE was significantly different at the 40 cm sensor-object distance than those of the 70 cm and 100 cm (Figure 4a,c). On the contrary, for the CC-430 sensor, the vegetation indices NDRE and CIRE showed no significant differences at different measurement heights during the Feekes 6–7 growth stages (Figure 3b,d) and the Feekes 9–10 growth stages (Figure 4b,d), indicating the sensor’s capability of making height-independent spectral measurements.
3.4. Correlations between N Status Indicators and Single Wavelength
The linear relationships between the single wavelengths derived from CC-470 (R550, R730, and R760) and CC-430 (R670, R730, and R780) at different measurement heights (40, 70, and 100 cm) and N status indicators (PNU and NNI) before canopy closure (Feekes 6–7) and after canopy closure (Feekes 9–10) as well as across all the growth stages were established. Consequently, the sensitivities of the single wavelengths of both sensors for estimating N status in winter wheat cultivars were studied (Table 2). The results showed that during both before and after canopy closure stages, the R2 values of single wavelength-PNU relations at different measurement heights for the CC-470 sensor varied greatly whereas the R2 values were generally higher and more stable for the CC-430 sensor. Similar results were shown in the single wavelength-NNI relations (Table 2). The relationships were comparatively weaker when established by using the pooled data of all the growth stages. Overall, the relationships between single wavelengths and NNI showed stronger relationships as compared to that of PNU in all the cases investigated in this study. Moreover, the single wavelengths of the CC-430 sensor performed consistently better than the wavelengths of the CC-470 sensor at different measuring distances across varieties and stages for both PNU and NNI.
3.5. Correlations between N Status Indicators and Vegetation Indices
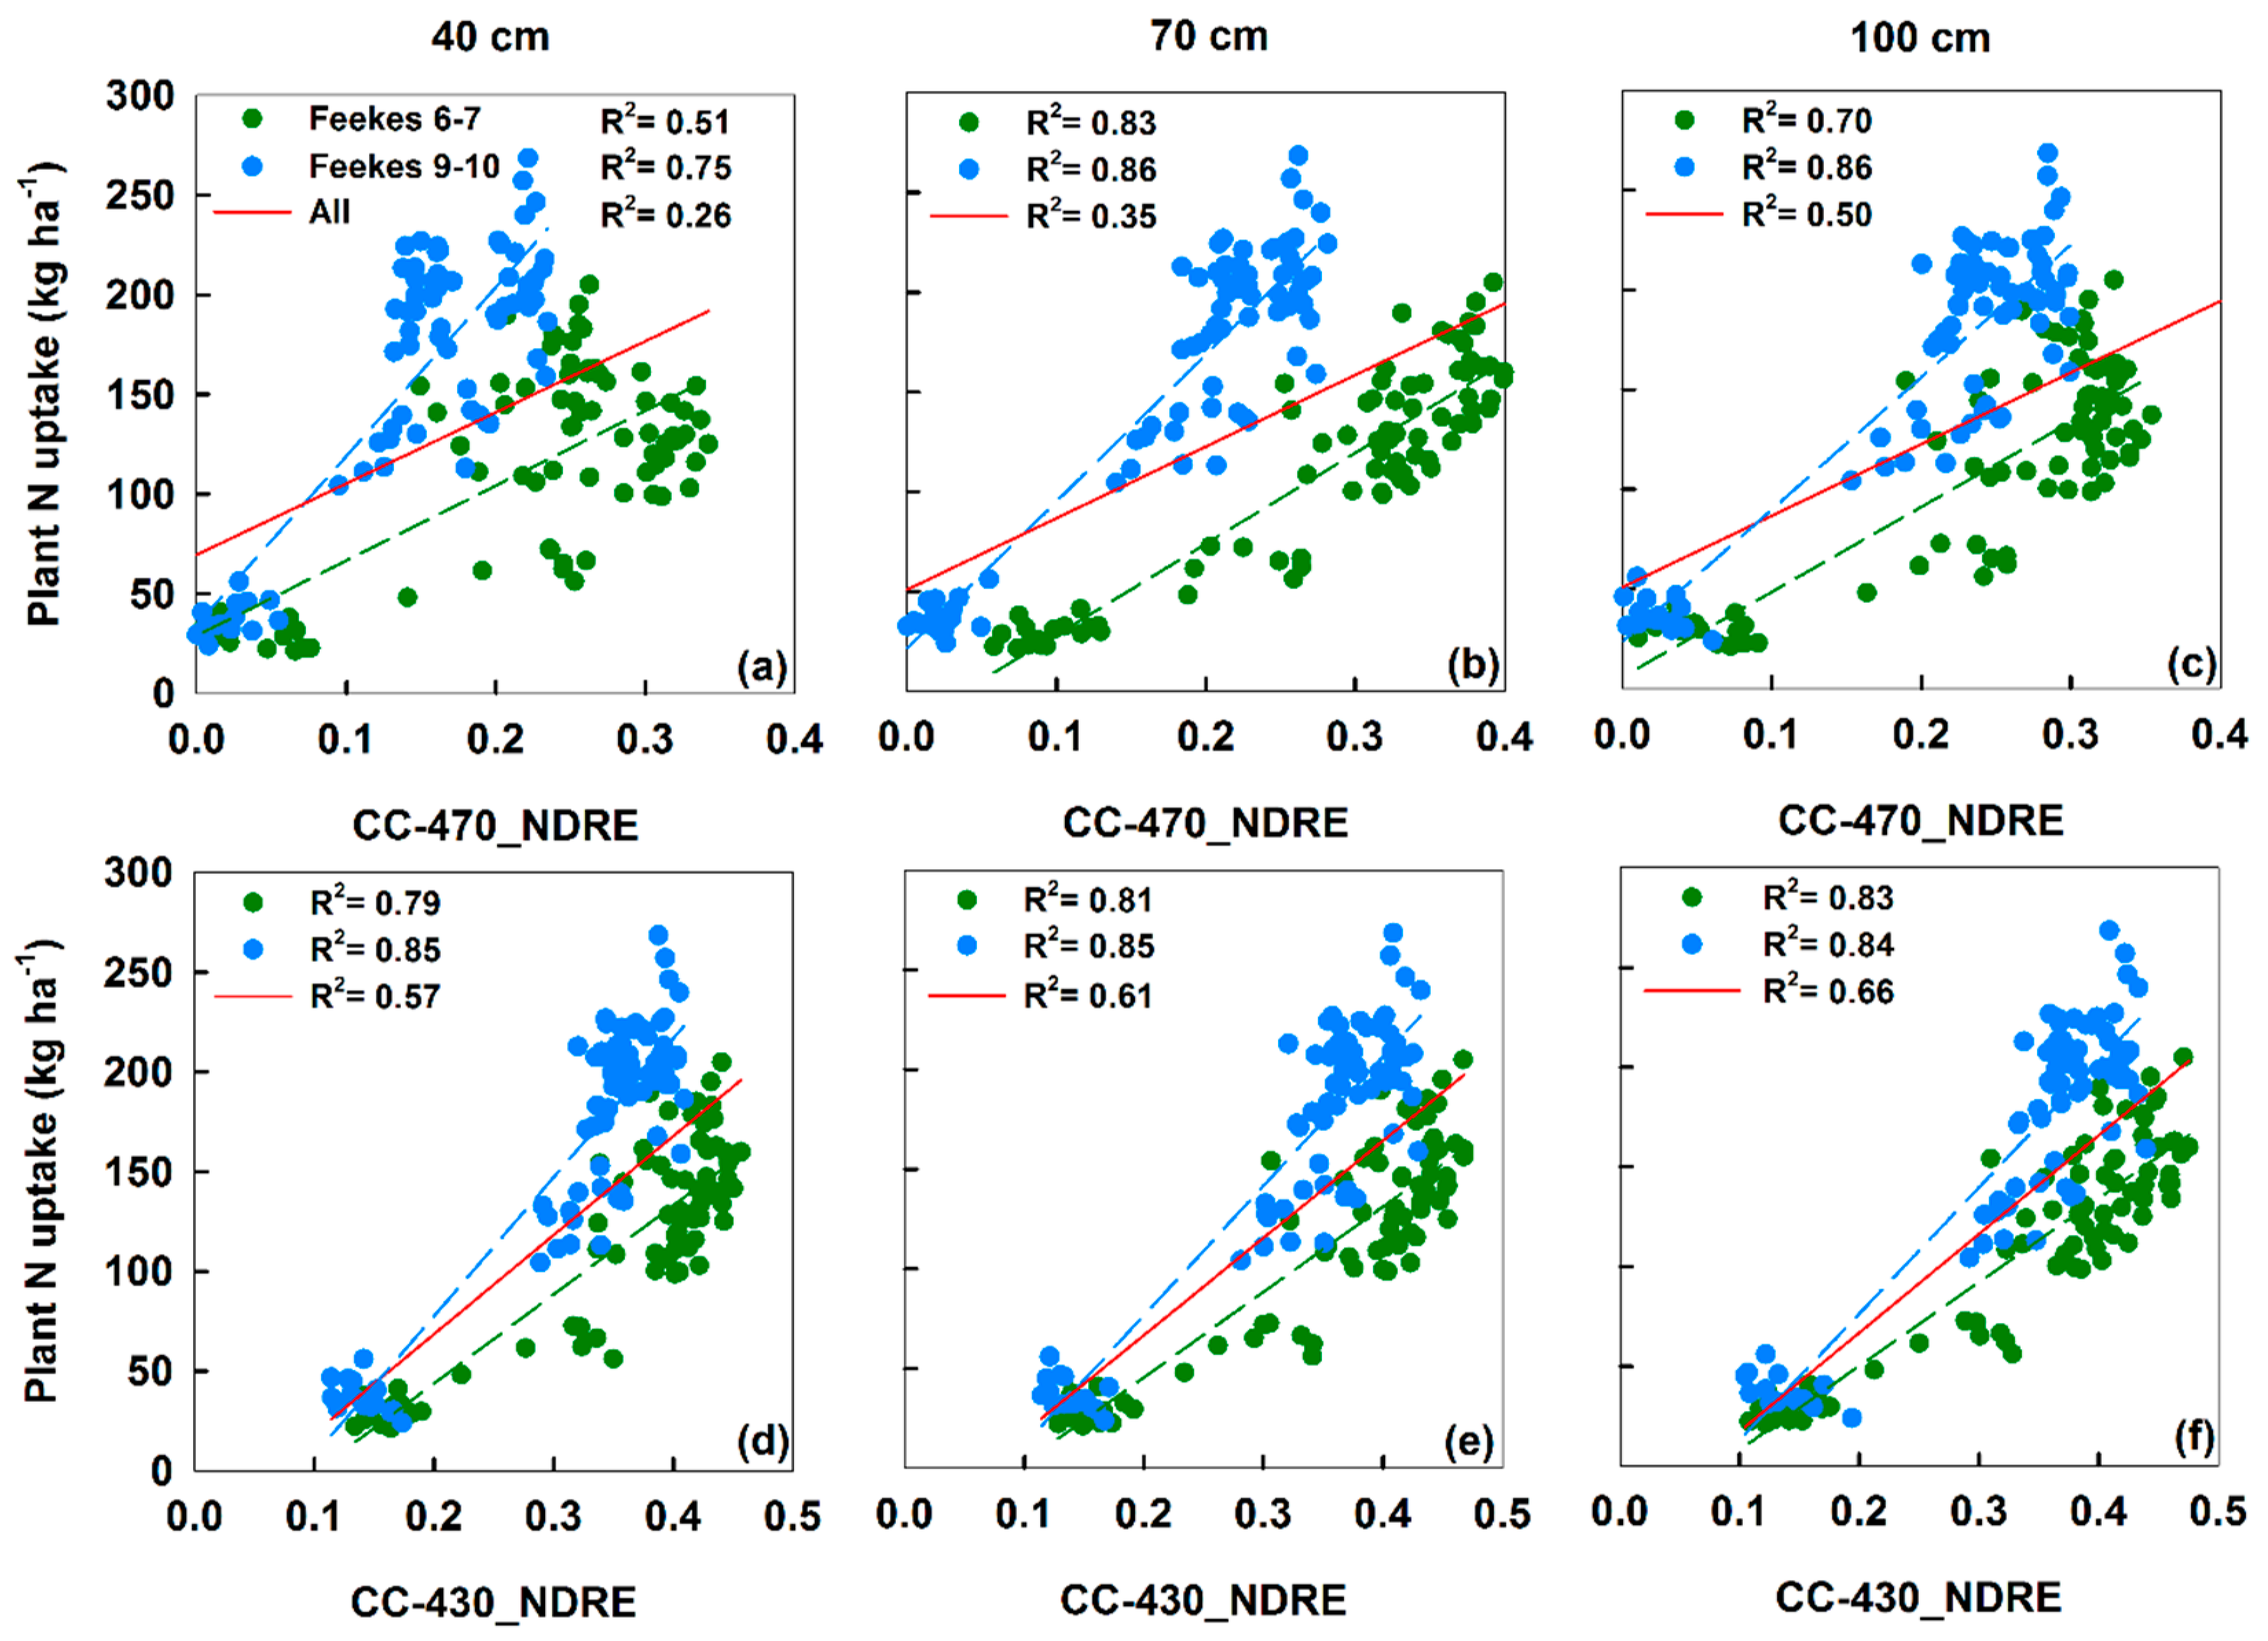
The linear relationships between the N status indicators (PNU and NNI) and the vegetation indices (NDRE and CIRE) were derived using CC-470 and CC-430 sensors at three measurement heights (40, 70, and 100 cm) and at different crop growth stages (Feekes 6–7, Feekes 9–10, and across all growth stages (Table 3). The results showed that the values of R2 for NDRE-PNU and CIRE-PNU relations during the Feekes 6–7 stages at different measurement heights ranged from 0.51 to 0.86 and 0.46 to 0.87 for CC-470, while the corresponding ranges were 0.78–0.86 and 0.79–0.86 for CC-430. The NDRE-PNU and CIRE-PNU relations were more comparable at the Feekes 9–10 growth stages with the R2 values of 0.72–0.88 and 0.68–0.88 for CC-470, as compared to 0.82–0.88 and 0.81–0.87 for CC-430.
The R2 values for NDRE-NNI and CIRE-NNI relations at different measurement heights were slightly higher than those values of the NDRE-PNU and CIRE-PNU relations during both stages (Table 3). Overall, the 70 cm measurement height gave the strongest NDRE-NNI and CIRE-NNI relationships for both sensors across the growth stages. Comparatively, the N status indicators acquired from the NDRE index performed better than the CIRE index for both sensors. The relationships between the N status indicators and vegetation indices were weaker when established by using the pooled data of all the growth stages. Additionally, the vegetation indices obtained by CC-430 consistently outperformed those of the CC-470 sensor across the measurement heights, N status indicators, and wheat cultivars.
The results showed that the relationships between NDRE and N status indicators were robust for both sensors across the cultivars and measurements heights. Therefore, the data for both winter wheat cultivars were pooled to establish these relationships for a more reliable estimation of PNU and NNI at different growth stages (Figure 5 and Figure 6). The relationships for in-season estimation of PNU and NNI were strongest at the Feekes 9–10 stages regardless of the measurement height and the sensor used.
3.6. Evaluating Nitrogen Status Diagnostic Accuracy
To evaluate the influence of measurement heights on diagnostic accuracy of CC-470_NDRE and CC-430_NDRE for N status estimation of winter wheat, the dataset was divided into N deficient (NNI ≤ 0.95), N optimal (0.95 < NNI ≤ 1.05), and N surplus (NNI > 1.05) categories. The areal agreement and kappa coefficient statistic were calculated and summarized in Table 4. The values of kappa coefficient ranged from 0.50 to 0.69 and 0.74 to 0.75 at the different measurement heights for CC-470_NDRE and CC-430_NDRE, respectively, revealing higher N status diagnostic accuracy of CC-430 sensor. In addition, relatively lower areal agreement and kappa statistic were found for CC-470_NDRE with a measurement height of 40 cm.
4. Discussion
4.1. Impacts of Measurement Heights on Single Wavelengths and Vegetation Indices
For a specific sensor with a given viewing angle, the measuring area changes according to the measuring height, which is an important factor that affects the performance of ACSs. Although ACSs are not influenced by ambient light conditions, their disadvantages of reducing light intensity with measuring distance cannot be ignored [10,32]. This limitation is of specific importance because it is difficult to maintain constant measuring height even with fixed sensor positions for handheld operating systems [10]. Active canopy sensors have typically been used by following the manufacturer’s general use guidelines, e.g. the measuring distance between the CC-470 and CC-430 sensors and the crop canopy should be 0.3–2.0 m to collect stable sensor readings (http://hollandscientific.com). Notably, the visible waveband used in CC-470 was different from CC-430 in this study whereas both sensors have red edge and NIR bands. The comparison should focus on the two common bands. The green band from CC-470 and red band from CC-430 were included to mainly show the relative impact of measurement height on the reflectance values in the visible spectrum. The study results revealed that the spectral reflectance changed significantly at different measuring heights for CC-470 sensor (Figure 1 and Figure 2), because both the light emitted by the sensor and reflected by the crop canopy follow the inverse square law [8]. However, unlike other active sensors on the market, the CC-430 sensor is designed to make height-independent measurements because the spectral reflectance bands are scaled as percentages that will not change with measurement distances, which is referred by Holland Scientific as Pseudo Solar Reflectance. This unique feature was confirmed by the results of the study as the single-band readings of the CC-430 sensor remained roughly consistent at different measuring distances (Figure 1 and Figure 2). When the single wavelengths are sensitive to measuring distances or height, ratio-based spectral indices may be used to reduce such effect. However, the results of this study revealed that the spectral indices derived from CC-470 sensor at the 70 cm sensor-object distance were significantly different from those based on spectral measurements collected at 40 cm and 100 cm distances during the Feekes 6–7 growth stages (before canopy closure) when the crop vegetation was sparse and the measured reflectance was highly affected by the soil background in the sensor’s field of view (Figure 3a,c). In contrast, these indices increased steadily with the rise of measuring height at the Feekes 9–10 growth stages (Figure 4a,c). This is because after canopy closure when the effect of soil background was minimized, the spectral readings of CC-470 decreased with the increase of measuring height following the inverse square law, but the decreasing rate of the NIR band was slightly lower than that of the RE band (Figure 2b,c), resulting in higher NDRE and CIRE values for higher measuring height.
This study indicated the CC-470 sensor performed relatively better at 70 cm and 100 cm, while the CC-430 sensor could make height-independent spectral measurements. For each ACS, there is an optimum measuring distance, where spectral indices remain stable because of the identical curve progression of the single wavelength contributing to them. The knowledge of the optimum measuring distances is crucial for the appropriate in-field applications of the ACSs, making it possible to adapt the sensor-to-target distance to specific crop heights. However, it is challenging to determine proper measuring distances between the sensor and crop canopies considering that the penetration depth of the sensor signal is unknown [10]. The optimal distance to the target depends on crop density and crop type because the penetration depth of the sensor’s radiation is dependent on canopy density, and different cultivars have different canopy architectures. For example, it would be more difficult to track optimum distances in row crops because the sensor placement in relation to the crop row (above the row vs. between rows) could change the sensor output [9]. Additionally, the optimum measuring distances vary at different growth stages due to changed plant architecture. Shaver, et al. [20] compared GreenSeeker to CC-210 under greenhouse conditions and found that growth stages affected the vegetation index values from both sensors. Further intensive investigations are necessary to evaluate complicating factors for optimum measuring distance in real plant populations.
4.2. Impacts of Growths Stages on the Estimations of N Status Indicators
Remotely sensed information regarding crop growth and vigor provides extremely valuable insights for crop management by accurately monitoring crop N status at different growth stages. Vegetation indices and N status indicators obtained from crop sensors are effective for evaluating the vigor of vegetation covers and growth dynamics, both quantitatively and qualitatively. Accurate monitoring of crop N status at different crop growth stages is crucial for precision N management in crop production. Growth stage can significantly influence the performance of vegetation indices for estimating crop canopy biophysical parameters [14,33]. Crop growth stage is a key plant characteristic for monitoring the crop N status to improve in-season N use efficiency [34]. In the present study, the relationships established between vegetation indices and crop N status indicators at different crop growth stages were robust for both CC-470 and CC-430 sensors except for the models across growth stages for estimating PNU (Figure 5). However, stronger relationships between the spectra of both sensors and N status indicators were found at the Feekes 9–10 growth stages than the Feekes 6–7 growth stages (Table 2 and Table 3). Although both the general models across growth stages and growth stage-specific models might be used for estimating NNI, for practical applications, it would be more convenient if the general models can be applied across different growth stages without the need for growth stage-specific models [35].
4.3. Nitrogen Nutrition Index-Based N Status Diagnosis
Precision agriculture techniques have the potential to provide quantitative, instantaneous and non-destructive information on agricultural production over large areas. Several indicators such as aboveground biomass, plant N concentration, PNU and NNI can be used for in-season monitoring of crop growth and N status of winter wheat, yet NNI being based on the theory of crop N dilution makes it a better indicator for diagnosing crop N nutrition [29]. The highly correlated relationships between yield, N requirement, grain quality (amylose and protein content), chlorophyll meter readings, photosynthesis, crop N partition, N use efficiency with NNI in previous studies further confirm the applicability of NNI as a reliable N diagnostic tool. However, the application of NNI at farm level is restricted due to the destructive plant sampling prerequisite for its assessment. With the advances in sensor technologies, it is feasible to estimate NNI non-destructively [36]. Researchers have attempted to estimate NNI with chlorophyll meter [37,38], active canopy sensors [35,39,40] and hyperspectral canopy sensors [36,41]. The present study employed ACSs (CC-470 and CC-430) to estimate winter wheat NNI at different measurement heights across different growth stages and results of this study indicated that NNI could be estimated well with the ACSs (Table 3). The robust relationship during later growth stages (closed canopy) as compared to early growth stages (isolated plants) in the present study are in accordance with the N dilution and canopy photosynthesis optimization theories. Similar results have been previously reported in recent rice (Oryza sativa L.) and maize studies [39,40,42]. More studies are needed to further test the Crop Circle ACS 430 sensor for different crops and develop sensor-based N recommendation algorithms to guide in-season N management.
5. Conclusions
This study evaluated the performance of two Crop Circle active sensors for estimating winter wheat N status. The results revealed that the canopy reflectance values of CC-470 were more significantly affected by the measurement height compared to the CC-430 sensor. The NDRE and CIRE indices of CC-430 were stable at the three different measuring heights. Stronger relationships were identified between these indices based on CC-430 and the N status indicators (PNU and NNI). The areal agreement and kappa statistic confirmed higher N status diagnostic accuracy of CC-430 sensor. It is concluded that the CC-430 sensor is more reliable than CC-470 for winter wheat N status estimation due to its capability to make height-independent measurements. The conclusions from this study will be beneficial for improving the applications of ACSs in production fields.
Author Contributions
Y.M., Q.C., and Z.C. conceived and designed the experiments; Q.C., J.S. and S.C. conducted the experiments; Q.C. analyzed the data and wrote the original manuscript. Y.M. and F.Y. reviewed and revised the manuscript. All authors read and approved the final manuscript.
Funding
This research was financially supported by the National Basic Research Program (2015CB150405), National Key Research and Development Program of China (2016YFD0200600, 2016YFD0200602), the National Natural Science Foundation of China (31601222), and the Natural Science Foundation of Jiangsu Province (BK20150663).
Acknowledgments
We would like to thank Dianjun Lu for his fieldwork and contributions to data collection, and Xinping Chen for his support during this research. We would also like to thank Syed Tahir Ata-UI-Karim for his constructive comments for improving this manuscript and Cadan Cummings for checking the English.
Conflicts of Interest
The authors declare no conflict of interest.
References
- Miao, Y.; Stewart, B.A.; Zhang, F. Long-term experiments for sustainable nutrient management in China. A review. Agron. Sustain. Dev. 2011, 31, 397–414. [Google Scholar] [CrossRef]
- Diacono, M.; Rubino, P.; Montemurro, F. Precision nitrogen management of wheat. A review. Agron. Sustain. Dev. 2013, 33, 219–241. [Google Scholar] [CrossRef]
- Colaço, A.; Bramley, R. Do crop sensors promote improved nitrogen management in grain crops? Field Crops Res. 2018, 218, 126–140. [Google Scholar] [CrossRef]
- Cao, Q.; Miao, Y.; Feng, G.; Gao, X.; Liu, B.; Liu, Y.; Li, F.; Khosla, R.; Mulla, D.J.; Zhang, F. Improving nitrogen use efficiency with minimal environmental risks using an active canopy sensor in a wheat-maize cropping system. Field Crops Res. 2017, 214, 365–372. [Google Scholar] [CrossRef]
- Cao, Q.; Miao, Y.; Li, F.; Gao, X.; Liu, B.; Lu, D.; Chen, X. Developing a new crop circle active canopy sensor-based precision nitrogen management strategy for winter wheat in north china plain. Precis. Agric. 2017, 18, 2–18. [Google Scholar] [CrossRef]
- Cao, Q.; Miao, Y.; Feng, G.; Gao, X.; Li, F.; Liu, B.; Yue, S.; Cheng, S.; Ustin, S.L.; Khosla, R. Active canopy sensing of winter wheat nitrogen status: An evaluation of two sensor systems. Comput. Electron. Agric. 2015, 112, 54–67. [Google Scholar] [CrossRef]
- Bushong, J.T.; Mullock, J.L.; Miller, E.C.; Raun, W.R.; Klatt, A.R.; Arnall, D.B. Development of an in-season estimate of yield potential utilizing optical crop sensors and soil moisture data for winter wheat. Precis. Agric. 2016, 17, 451–469. [Google Scholar] [CrossRef]
- Holland, K.H.; Lamb, D.W.; Schepers, J.S. Radiometry of proximal active optical sensors (aos) for agricultural sensing. IEEE J. Sel. Top. Appl. Earth Obs. Remote Sens. 2012, 5, 1793–1802. [Google Scholar] [CrossRef]
- Barker, D.W.; Sawyer, J.E. Factors affecting active canopy sensor performance and reflectance measurements. Soil Sci. Soc. Am. J. 2013, 77, 1673–1683. [Google Scholar] [CrossRef]
- Kipp, S.; Mistele, B.; Schmidhalter, U. The performance of active spectral reflectance sensors as influenced by measuring distance, device temperature and light intensity. Comput. Electron. Agric. 2014, 100, 24–33. [Google Scholar] [CrossRef]
- Solari, F. Developing a Crop Based Strategy for On-The-Go Nitrogen Management in Irrigated Cornfields. Ph.D. Thesis, University of Nebraska, Lincoln, NE, USA, August 2006. [Google Scholar]
- Hatfield, J.L.; Prueger, J.H. Value of using different vegetative indices to quantify agricultural crop characteristics at different growth stages under varying management practices. Remote Sens. 2010, 2, 562–578. [Google Scholar] [CrossRef]
- Li, F.; Miao, Y.; Hennig, S.D.; Gnyp, M.L.; Chen, X.; Jia, L.; Bareth, G. Evaluating hyperspectral vegetation indices for estimating nitrogen concentration of winter wheat at different growth stages. Precis. Agric. 2010, 11, 335–357. [Google Scholar] [CrossRef]
- Yu, K.; Li, F.; Gnyp, M.L.; Miao, Y.; Bareth, G.; Chen, X. Remotely detecting canopy nitrogen concentration and uptake of paddy rice in the northeast china plain. ISPRS J. Photogram. Remote Sens. 2013, 78, 102–115. [Google Scholar] [CrossRef]
- Eitel, J.U.H.; Keefe, R.F.; Long, D.S.; Davis, A.S.; Vierling, L.A. Active ground optical remote sensing for improved monitoring of seedling stress in nurseries. Sensors 2010, 10, 2843–2850. [Google Scholar] [CrossRef] [PubMed]
- Erdle, K.; Mistele, B.; Schmidhalter, U. Comparison of active and passive spectral sensors in discriminating biomass parameters and nitrogen status in wheat cultivars. Field Crops Res. 2011, 124, 74–84. [Google Scholar] [CrossRef]
- Shiratsuchi, L.; Ferguson, R.; Shanahan, J.; Adamchuk, V.; Rundquist, D.; Marx, D.; Slater, G. Water and nitrogen effects on active canopy sensor vegetation indices. Agron. J. 2011, 103, 1815–1826. [Google Scholar] [CrossRef]
- Amaral, L.; Molin, J.; Portz, G.; Finazzi, F.; Cortinove, L. Comparison of crop canopy reflectance sensors used to identify sugarcane biomass and nitrogen status. Precis. Agric. 2015, 16, 15–28. [Google Scholar] [CrossRef]
- Li, F.; Mistele, B.; Hu, Y.; Yue, X.; Yue, S.; Miao, Y.; Chen, X.; Cui, Z.; Meng, Q.; Schmidhalter, U. Remotely estimating aerial N status of phenologically differing winter wheat cultivars grown in contrasting climatic and geographic zones in China and Germany. Field Crops Res. 2012, 138, 21–32. [Google Scholar] [CrossRef]
- Shaver, T.M.; Khosla, R.; Westfall, D.G. Evaluation of two ground-based active crop canopy sensors in maize: Growth stage, row spacing, and sensor movement speed. Soil Sci. Soc. Am. J. 2010, 74, 2101–2108. [Google Scholar] [CrossRef]
- Cao, Q.; Miao, Y.; Shen, J.; Yu, W.; Yuan, F.; Cheng, S.; Huang, S.; Wang, H.; Yang, W.; Liu, F. Improving in-season estimation of rice yield potential and responsiveness to topdressing nitrogen application with crop circle active crop canopy sensor. Precis. Agric. 2016, 17, 136–154. [Google Scholar] [CrossRef]
- Holland Scientifc. Available online: https://hollandscientific.com/portfolio/crop-circle-acs-430/ (accessed on 11 September 2018).
- Cui, Z.; Zhang, F.; Chen, X.; Miao, Y.; Li, J.; Shi, L.; Xu, J.; Ye, Y.; Liu, C.; Yang, Z.; et al. On-farm evaluation of an in-season nitrogen management strategy based on soil Nmin test. Field Crops Res. 2008, 105, 48–55. [Google Scholar] [CrossRef]
- Lu, D.; Lu, F.; Pan, J.; Cui, Z.; Zou, C.; Chen, X.; He, M.; Wang, Z. The effects of cultivar and nitrogen management on wheat yield and nitrogen use efficiency in the north China plain. Field Crops Res. 2015, 171, 157–164. [Google Scholar] [CrossRef]
- Large, E.C. Growth stages in cereals illustration of the feekes scale. Plant Pathol. 1954, 3, 128–129. [Google Scholar] [CrossRef]
- Barnes, E.; Clarke, T.; Richards, S.; Colaizzi, P.; Haberland, J.; Kostrzewski, M.; Waller, P.; Choi, C.; Riley, E.; Thompson, T.; et al. Coincident detection of crop water stress, nitrogen status and canopy density using ground based multispectral data. In Proceedings of the 5th International Conference on Precision Agriculture, Bloomington, MN, USA, 16–19 July 2000. [Google Scholar]
- Gitelson, A.A.; Viña, A.S.; Ciganda, V.N.; Rundquist, D.C. Remote estimation of canopy chlorophyll content in crops. Geophys. Res. Lett. 2005, 32, L08403. [Google Scholar] [CrossRef]
- Horwitz, W. Official Methods of Analysis; Association of Official Agricultural Chemists: Washington, DC, USA, 1970; pp. 17–18. [Google Scholar]
- Lemaire, G.; Jeuffroy, M.-H.; Gastal, F. Diagnosis tool for plant and crop n status in vegetative stage. Eur. J. Agron. 2008, 28, 614–624. [Google Scholar] [CrossRef]
- Yue, S.; Meng, Q.; Zhao, R.; Li, F.; Chen, X.; Zhang, F.; Cui, Z. Critical nitrogen dilution curve for optimizing nitrogen management of winter wheat production in the north china plain. Agron. J. 2012, 104, 523–529. [Google Scholar] [CrossRef]
- Lillesand, T.M.; Kiefer, R.W.; Chipman, J. Remote Sensing and Image Interpretation, 7th ed.; John Wiley & Sons: Hoboken, NJ, USA, 2015; pp. 575–581. ISBN 978-1-118-34328-9. [Google Scholar]
- Winterhalter, L.; Mistele, B.; Schmidhalter, U. Evaluation of active and passive sensor systems in the field to phenotype maize hybrids with high-throughput. Field Crops Res. 2013, 154, 236–245. [Google Scholar] [CrossRef]
- Miao, Y.; Mulla, D.J.; Randall, G.W.; Vetsch, J.A.; Vintila, R. Combining chlorophyll meter readings and high spatial resolution remote sensing images for in-season site-specific nitrogen management of corn. Precis. Agric. 2009, 10, 45–62. [Google Scholar] [CrossRef]
- Ata-Ul-Karim, S.T.; Liu, X.; Lu, Z.; Zheng, H.; Cao, W.; Zhu, Y. Estimation of nitrogen fertilizer requirement for rice crop using critical nitrogen dilution curve. Field Crops Res. 2017, 201, 32–40. [Google Scholar] [CrossRef]
- Cao, Q.; Miao, Y.; Wang, H.; Huang, S.; Cheng, S.; Khosla, R.; Jiang, R. Non-destructive estimation of rice plant nitrogen status with crop circle multispectral active canopy sensor. Field Crops Res. 2013, 154, 133–144. [Google Scholar] [CrossRef]
- Mistele, B.; Schmidhalter, U. Estimating the nitrogen nutrition index using spectral canopy reflectance measurements. Eur. J. Agron. 2008, 29, 184–190. [Google Scholar] [CrossRef]
- Prost, L.; Jeuffroy, M.-H. Replacing the nitrogen nutrition index by the chlorophyll meter to assess wheat N status. Agron. Sustain. Dev. 2007, 27, 321–330. [Google Scholar] [CrossRef] [Green Version]
- Cao, Q.; Cui, Z.; Chen, X.; Khosla, R.; Dao, T.H.; Miao, Y. Quantifying spatial variability of indigenous nitrogen supply for precision nitrogen management in small scale farming. Precis. Agric. 2012, 13, 45–61. [Google Scholar] [CrossRef]
- Xia, T.; Miao, Y.; Wu, D.; Shao, H.; Khosla, R.; Mi, G. Active optical sensing of spring maize for in-season diagnosis of nitrogen status based on nitrogen nutrition index. Remote Sens. 2016, 8, 605. [Google Scholar] [CrossRef]
- Lu, J.; Miao, Y.; Shi, W.; Li, J.; Yuan, F. Evaluating different approaches to non-destructive nitrogen status diagnosis of rice using portable rapidscan active canopy sensor. Sci. Rep. 2017, 7, 14073. [Google Scholar] [CrossRef] [PubMed]
- Chen, P. A comparison of two approaches for estimating the wheat nitrogen nutrition index using remote sensing. Remote Sens. 2015, 7, 4527–4548. [Google Scholar] [CrossRef]
- Huang, S.; Miao, Y.; Zhao, G.; Yuan, F.; Ma, X.; Tan, C.; Yu, W.; Gnyp, M.; Lenz-Wiedemann, V.; Rascher, U.; et al. Satellite remote sensing-based in-season diagnosis of rice nitrogen status in northeast china. Remote Sens. 2015, 7, 10646–10667. [Google Scholar] [CrossRef]
Figure 1.
Spectral characteristics of single wavelengths obtained from Crop Circle ACS-470 (CC-470) and Crop Circle ACS-430 (CC-430) sensors at different measurement heights at the Feekes 6–7 growth stages (before canopy closure). (a) CC-470_R550, (b) CC-470_R730, (c) CC-470_R760, (d) CC-430_R670, (e) CC-430_R730, (f) CC-430_R780. The solid and dashed lines in this figure indicate median and mean, respectively. The box boundaries indicate the upper and lower quartiles (75th and 25th percentiles), the whisker caps indicate the 90th and 10th percentiles, and the circles indicate the 95th and 5th percentiles. Different letters (a, b, and c) indicate significant differences at p ≤ 0.05.

Figure 2.
Spectral characteristics of a single wavelength obtained from Crop Circle ACS-470 (CC-470) and Crop Circle ACS-430 (CC-430) sensors at different measurement heights at the Feekes 9–10 growth stages (after canopy closure). (a) CC-470_R550, (b) CC-470_R730, (c) CC-470_R760, (d) CC-430_R670, (e) CC-430_R730, (f) CC-430_R780. The solid and dashed lines in this figure indicate median and mean, respectively. The box boundaries indicate the upper and lower quartiles (75th and 25th percentiles), the whisker caps indicate the 90th and 10th percentiles, and the circles indicate the 95th and 5th percentiles. Different letters show significant differences at p ≤ 0.05.

Figure 3.
Normalized difference red edge index (NDRE) and red edge chlorophyll index (CIRE) derived from Crop Circle ACS-470 (CC-470) and Crop Circle ACS-430 (CC-430) sensors at different measurement heights at the Feekes 6–7 growth stages (before canopy closure). (a) CC-470_NDRE, (b) CC-430_NDRE, (c) CC-470_CIRE, (d) CC-430_CIRE. Solid and dashed lines in this figure indicate median and mean, respectively. The box boundaries indicate the upper and lower quartiles (75th and 25th percentiles), the whisker caps indicate the 90th and 10th percentiles, and the circles indicate the 95th and 5th percentiles. Different letters show significant differences at p ≤ 0.05.

Figure 4.
Normalized difference red edge index (NDRE) and red edge chlorophyll index (CIRE) derived from Crop Circle ACS-470 (CC-470) and Crop Circle ACS-430 (CC-430) at different measurement heights at the Feekes 9–10 growth stages (after canopy closure). (a) CC-470_NDRE, (b) CC-430_NDRE, (c) CC-470_CIRE, (d) CC-430_CIRE. Solid and dashed lines in this figure indicate median and mean, respectively. The box boundaries indicate the upper and lower quartiles (75th and 25th percentiles), the whisker caps indicate the 90th and 10th percentiles, and the circles indicate the 95th and 5th percentiles. Different letters show significant differences at p ≤ 0.05.

Figure 5.
Relationships between plant N uptake and the normalized difference red edge index (NDRE) of Crop Circle ACS-470 (CC-470_NDRE) measured at 40 cm (a), 70 cm (b) and 100 cm (c) above the winter wheat canopy; and the relationships between plant N uptake and the NDRE of Crop Circle ACS-430 (CC-430_NDRE) measured at 40 cm (d), 70 cm (e) and 100 cm (f) above the canopy of the winter wheat, at the Feekes 6–7 growth stages (before canopy closure), Feekes 9–10 growth stages (after canopy closure), and across all stages. The red lines indicate the relationships between vegetation indices at different measurement heights and N status indicators across growth stages.

Figure 6.
Relationships between N nutrition index (NNI) and the NDRE of Crop Circle ACS-470 (CC-470_NDRE) measured at 40 cm (a), 70 cm (b) and 100 cm (c) above the canopy of the winter wheat; and the relationships between NNI and NDRE of Crop Circle ACS-430 (CC-430_NDRE) measured at 40 cm (d), 70 cm (e) and 100 cm (f) above the canopy of the winter wheat, at the Feekes 6–7 growth stages (before canopy closure), Feekes 9–10 growth stages (after canopy closure), and across all stages. The red lines indicate the relationships between vegetation indices at different measurement heights and N status indicators across growth stages.


Table 1.
Descriptive statistics of winter wheat aboveground plant N uptake (PNU) and N nutrition index (NNI) at the Feekes 6–7 growth stages (before canopy closure), Feekes 9–10 growth stages (after canopy closure) and across all stages and cultivars.
Table 1.
Descriptive statistics of winter wheat aboveground plant N uptake (PNU) and N nutrition index (NNI) at the Feekes 6–7 growth stages (before canopy closure), Feekes 9–10 growth stages (after canopy closure) and across all stages and cultivars.
| Feekes Growth Stages | Cultivars 1 | N 2 | PNU (kg N ha−1) | NNI | ||||||
|---|---|---|---|---|---|---|---|---|---|---|
| Range | Mean | SD 3 | CV 4 (%) | Range | Mean | SD | CV (%) | |||
| 6–7 | LX | 40 | 21.3–195.0 | 108.3 | 49.5 | 45.7 | 0.45–1.61 | 1.11 | 0.36 | 33.7 |
| TN | 40 | 22.4–204.8 | 114.4 | 56.3 | 49.2 | 0.42–1.69 | 1.16 | 0.42 | 36.6 | |
| All | 80 | 21.3–204.8 | 111.4 | 52.7 | 47.3 | 0.42–1.69 | 1.13 | 0.39 | 34.6 | |
| 9–10 | LX | 40 | 29.3–246.3 | 155.5 | 68.5 | 44.0 | 0.31–1.35 | 0.96 | 0.33 | 34.7 |
| TN | 40 | 23.9–268.4 | 160.5 | 71.7 | 44.6 | 0.32–1.51 | 0.99 | 0.36 | 36.0 | |
| All | 80 | 23.9–268.4 | 158.0 | 69.7 | 44.1 | 0.31–1.51 | 0.97 | 0.34 | 35.2 | |
| All | LX | 80 | 21.3–246.3 | 131.9 | 63.9 | 48.5 | 0.31–1.61 | 1.03 | 0.35 | 34.3 |
| TN | 80 | 22.4–268.4 | 137.5 | 68.1 | 49.5 | 0.32–1.69 | 1.07 | 0.40 | 37.0 | |
| All | 160 | 21.3–268.4 | 134.7 | 65.9 | 48.9 | 0.31–1.69 | 1.05 | 0.38 | 35.7 | |
1 Cultivars: LX, Liangxing 99; TN, Tainong 18; 2 N: number of observations; 3 SD: standard deviation; 4 CV: coefficient of variation.
Table 2.
Coefficients of determination (R2) of the linear relationships between single wavelengths derived from Crop Circle ACS-470 (CC-470) and Crop Circle ACS-430 (CC-430) and plant N uptake (PNU) and N nutrition index (NNI) at the Feekes 6–7 growth stages (before canopy closure), Feekes 9–10 growth stages (after canopy closure) and across all stages, respectively.
| Growth Stages | Cultivars 1 | Heights (cm) | PNU | NNI | ||||||||||
|---|---|---|---|---|---|---|---|---|---|---|---|---|---|---|
| CC-470 | CC-430 | CC-470 | CC-430 | |||||||||||
| R550 | R730 | R760 | R670 | R730 | R780 | R550 | R730 | R760 | R670 | R730 | R780 | |||
| Feekes 6–7 growth stages | LX | 40 | 0.62 | 0.44 | 0.00 | 0.73 | 0.77 | 0.79 | 0.62 | 0.38 | 0.03 | 0.75 | 0.83 | 0.84 |
| 70 | 0.54 | 0.29 | 0.49 | 0.77 | 0.80 | 0.84 | 0.54 | 0.29 | 0.49 | 0.81 | 0.85 | 0.87 | ||
| 100 | 0.48 | 0.16 | 0.72 | 0.76 | 0.80 | 0.83 | 0.63 | 0.28 | 0.68 | 0.74 | 0.83 | 0.83 | ||
| TN | 40 | 0.70 | 0.57 | 0.02 | 0.83 | 0.81 | 0.81 | 0.71 | 0.53 | 0.00 | 0.80 | 0.85 | 0.84 | |
| 70 | 0.68 | 0.52 | 0.23 | 0.84 | 0.82 | 0.82 | 0.64 | 0.46 | 0.30 | 0.85 | 0.86 | 0.84 | ||
| 100 | 0.53 | 0.38 | 0.65 | 0.84 | 0.85 | 0.86 | 0.67 | 0.55 | 0.55 | 0.79 | 0.86 | 0.83 | ||
| All | 40 | 0.66 | 0.51 | 0.00 | 0.76 | 0.78 | 0.79 | 0.66 | 0.46 | 0.01 | 0.75 | 0.83 | 0.83 | |
| 70 | 0.63 | 0.45 | 0.28 | 0.77 | 0.80 | 0.82 | 0.59 | 0.38 | 0.36 | 0.79 | 0.84 | 0.84 | ||
| 100 | 0.50 | 0.27 | 0.64 | 0.77 | 0.82 | 0.83 | 0.64 | 0.42 | 0.58 | 0.74 | 0.83 | 0.81 | ||
| Feekes 9–10 growth stages | LX | 40 | 0.16 | 0.00 | 0.24 | 0.76 | 0.87 | 0.87 | 0.27 | 0.02 | 0.15 | 0.85 | 0.91 | 0.93 |
| 70 | 0.23 | 0.01 | 0.75 | 0.84 | 0.92 | 0.93 | 0.32 | 0.00 | 0.69 | 0.84 | 0.92 | 0.93 | ||
| 100 | 0.37 | 0.05 | 0.73 | 0.74 | 0.87 | 0.87 | 0.44 | 0.08 | 0.72 | 0.83 | 0.91 | 0.93 | ||
| TN | 40 | 0.23 | 0.02 | 0.15 | 0.70 | 0.82 | 0.83 | 0.35 | 0.07 | 0.07 | 0.79 | 0.86 | 0.88 | |
| 70 | 0.31 | 0.03 | 0.61 | 0.71 | 0.83 | 0.82 | 0.38 | 0.05 | 0.56 | 0.79 | 0.86 | 0.87 | ||
| 100 | 0.35 | 0.13 | 0.47 | 0.69 | 0.81 | 0.81 | 0.40 | 0.15 | 0.49 | 0.77 | 0.85 | 0.86 | ||
| All | 40 | 0.19 | 0.00 | 0.19 | 0.73 | 0.84 | 0.85 | 0.29 | 0.04 | 0.11 | 0.81 | 0.88 | 0.90 | |
| 70 | 0.27 | 0.00 | 0.67 | 0.72 | 0.85 | 0.84 | 0.35 | 0.02 | 0.61 | 0.81 | 0.88 | 0.89 | ||
| 100 | 0.36 | 0.09 | 0.58 | 0.71 | 0.84 | 0.84 | 0.41 | 0.12 | 0.58 | 0.79 | 0.87 | 0.89 | ||
| All growth stages | LX | 40 | 0.28 | 0.15 | 0.00 | 0.51 | 0.57 | 0.49 | 0.42 | 0.09 | 0.12 | 0.80 | 0.87 | 0.88 |
| 70 | 0.06 | 0.00 | 0.45 | 0.45 | 0.61 | 0.55 | 0.43 | 0.14 | 0.58 | 0.83 | 0.87 | 0.90 | ||
| 100 | 0.19 | 0.05 | 0.46 | 0.54 | 0.64 | 0.60 | 0.53 | 0.17 | 0.71 | 0.78 | 0.85 | 0.87 | ||
| TN | 40 | 0.32 | 0.19 | 0.00 | 0.59 | 0.62 | 0.54 | 0.53 | 0.23 | 0.03 | 0.79 | 0.85 | 0.86 | |
| 70 | 0.13 | 0.04 | 0.38 | 0.55 | 0.65 | 0.59 | 0.50 | 0.29 | 0.40 | 0.81 | 0.85 | 0.86 | ||
| 100 | 0.25 | 0.17 | 0.25 | 0.62 | 0.69 | 0.65 | 0.50 | 0.27 | 0.53 | 0.76 | 0.83 | 0.83 | ||
| All | 40 | 0.30 | 0.17 | 0.00 | 0.54 | 0.59 | 0.51 | 0.47 | 0.15 | 0.07 | 0.78 | 0.85 | 0.86 | |
| 70 | 0.10 | 0.01 | 0.10 | 0.49 | 0.63 | 0.57 | 0.46 | 0.22 | 0.47 | 0.80 | 0.85 | 0.87 | ||
| 100 | 0.22 | 0.11 | 0.39 | 0.57 | 0.66 | 0.62 | 0.51 | 0.23 | 0.59 | 0.75 | 0.83 | 0.84 | ||
Table 3.
Coefficients of determination (R2) of the linear relationships between vegetation indices derived from Crop Circle ACS-470 (CC-470) and Crop Circle ACS-430 (CC-430) and plant N uptake (PNU) and N nutrition index (NNI) at the Feekes 6–7 growth stages (before canopy closure), Feekes 9–10 growth stages (after canopy closure) and across all stages, respectively.
| Cultivars 1 | Heights (cm) | PNU | NNI | |||||||
|---|---|---|---|---|---|---|---|---|---|---|
| CC-470 | CC-430 | CC-470 | CC-430 | |||||||
| NDRE | CIRE | NDRE | CIRE | NDRE | CIRE | NDRE | CIRE | |||
| Feekes 6–7 growth stages | ||||||||||
| LX | 40 | 0.51 | 0.47 | 0.78 | 0.79 | 0.67 | 0.64 | 0.84 | 0.84 | |
| 70 | 0.81 | 0.82 | 0.82 | 0.84 | 0.83 | 0.83 | 0.86 | 0.87 | ||
| 100 | 0.70 | 0.70 | 0.82 | 0.83 | 0.80 | 0.81 | 0.84 | 0.83 | ||
| TN | 40 | 0.52 | 0.47 | 0.81 | 0.81 | 0.66 | 0.62 | 0.85 | 0.84 | |
| 70 | 0.86 | 0.87 | 0.82 | 0.82 | 0.86 | 0.84 | 0.86 | 0.84 | ||
| 100 | 0.73 | 0.71 | 0.86 | 0.86 | 0.80 | 0.79 | 0.86 | 0.83 | ||
| All | 40 | 0.51 | 0.46 | 0.79 | 0.79 | 0.65 | 0.62 | 0.83 | 0.83 | |
| 70 | 0.83 | 0.83 | 0.81 | 0.82 | 0.83 | 0.82 | 0.85 | 0.84 | ||
| 100 | 0.70 | 0.69 | 0.83 | 0.83 | 0.78 | 0.78 | 0.84 | 0.81 | ||
| Feekes 9–10 growth stages | ||||||||||
| LX | 40 | 0.78 | 0.75 | 0.87 | 0.87 | 0.87 | 0.85 | 0.92 | 0.93 | |
| 70 | 0.88 | 0.88 | 0.88 | 0.87 | 0.93 | 0.93 | 0.93 | 0.93 | ||
| 100 | 0.86 | 0.85 | 0.87 | 0.87 | 0.92 | 0.92 | 0.92 | 0.93 | ||
| TN | 40 | 0.72 | 0.68 | 0.83 | 0.83 | 0.82 | 0.79 | 0.87 | 0.88 | |
| 70 | 0.84 | 0.83 | 0.83 | 0.82 | 0.88 | 0.87 | 0.87 | 0.87 | ||
| 100 | 0.80 | 0.79 | 0.82 | 0.81 | 0.85 | 0.84 | 0.86 | 0.86 | ||
| All | 40 | 0.75 | 0.71 | 0.85 | 0.85 | 0.83 | 0.81 | 0.89 | 0.90 | |
| 70 | 0.86 | 0.85 | 0.85 | 0.84 | 0.90 | 0.89 | 0.89 | 0.89 | ||
| 100 | 0.83 | 0.82 | 0.84 | 0.84 | 0.87 | 0.87 | 0.89 | 0.89 | ||
| All growth stages | ||||||||||
| LX | 40 | 0.25 | 0.18 | 0.54 | 0.49 | 0.73 | 0.68 | 0.88 | 0.88 | |
| 70 | 0.31 | 0.24 | 0.60 | 0.55 | 0.82 | 0.77 | 0.89 | 0.89 | ||
| 100 | 0.48 | 0.43 | 0.63 | 0.60 | 0.86 | 0.86 | 0.87 | 0.87 | ||
| TN | 40 | 0.27 | 0.20 | 0.60 | 0.54 | 0.71 | 0.65 | 0.86 | 0.86 | |
| 70 | 0.39 | 0.31 | 0.63 | 0.59 | 0.83 | 0.78 | 0.86 | 0.86 | ||
| 100 | 0.53 | 0.49 | 0.68 | 0.65 | 0.82 | 0.82 | 0.84 | 0.83 | ||
| All | 40 | 0.26 | 0.19 | 0.57 | 0.51 | 0.71 | 0.65 | 0.86 | 0.86 | |
| 70 | 0.35 | 0.27 | 0.61 | 0.57 | 0.82 | 0.77 | 0.86 | 0.87 | ||
| 100 | 0.50 | 0.45 | 0.66 | 0.62 | 0.83 | 0.83 | 0.84 | 0.84 | ||
1 LX: Liangxing 99, TN: Tainong 18.
Table 4.
Areal agreement and Kappa statistic for N status diagnostic at different measurement heights.
Table 4.
Areal agreement and Kappa statistic for N status diagnostic at different measurement heights.
| Sensors | Areal Agreement (%) | Kappa Statistic | ||||
|---|---|---|---|---|---|---|
| 40 cm | 70 cm | 100 cm | 40 cm | 70 cm | 100 cm | |
| CC-470_NDRE | 73 | 80 | 85 | 0.50 | 0.64 | 0.69 |
| CC-430_NDRE | 88 | 88 | 88 | 0.74 | 0.75 | 0.74 |
© 2018 by the authors. Licensee MDPI, Basel, Switzerland. This article is an open access article distributed under the terms and conditions of the Creative Commons Attribution (CC BY) license (http://creativecommons.org/licenses/by/4.0/).
Share and Cite
MDPI and ACS Style
Cao, Q.; Miao, Y.; Shen, J.; Yuan, F.; Cheng, S.; Cui, Z. Evaluating Two Crop Circle Active Canopy Sensors for In-Season Diagnosis of Winter Wheat Nitrogen Status. Agronomy 2018, 8, 201. https://doi.org/10.3390/agronomy8100201
AMA Style
Cao Q, Miao Y, Shen J, Yuan F, Cheng S, Cui Z. Evaluating Two Crop Circle Active Canopy Sensors for In-Season Diagnosis of Winter Wheat Nitrogen Status. Agronomy. 2018; 8(10):201. https://doi.org/10.3390/agronomy8100201
Chicago/Turabian StyleCao, Qiang, Yuxin Miao, Jianning Shen, Fei Yuan, Shanshan Cheng, and Zhenling Cui. 2018. "Evaluating Two Crop Circle Active Canopy Sensors for In-Season Diagnosis of Winter Wheat Nitrogen Status" Agronomy 8, no. 10: 201. https://doi.org/10.3390/agronomy8100201
Note that from the first issue of 2016, this journal uses article numbers instead of page numbers. See further details here.