Article

Effect of Unmanned Aerial Vehicle Flight Height on Droplet Distribution, Drift and Control of Cotton Aphids and Spider Mites

1
College of Mechanical and Electrical Engineering, Shihezi University, Shihezi 832003, China
2
College of Agricultural, Shihezi University, Shihezi 832003, China
3
National Centre for International Collaboration Research on Precision Agricultural Aviation Pesticides Spraying Technology (NPAAC), College of Engineering, South China Agricultural University, Guangzhou 510642, China
*
Author to whom correspondence should be addressed.
Agronomy 2018, 8(9), 187; https://doi.org/10.3390/agronomy8090187
Submission received: 24 June 2018 / Revised: 9 September 2018 / Accepted: 11 September 2018 / Published: 13 September 2018
(This article belongs to the Special Issue Sensing and Automated Systems for Improved Crop Management)

Abstract

:
Unmanned aerial vehicles (UAVs), as emerging plant protection machinery, have the advantages of high operational efficiency, high speed, and low drift. The current study aimed to elucidate the characteristics of droplet distribution and drift, control efficiency on cotton aphids and spider mites, and attachment and absorption of cotton leaves during UAV spraying. Kromekote card and filter paper are used as samplers to collect droplets, and the droplet density, coverage rate, deposition, and drift percentage are statistically analyzed. The pooled results showed that the droplet uniformity, the droplet coverage rate, the deposition, and the drifting ability are higher when the UAV flight height was 2 m. The control effects by UAV spraying on cotton aphids and spider mites were 63.7% and 61.3%, respectively. These values are slightly inferior to those obtained through boom spraying. Cotton leaf attachment and absorption of spirodiclofen after UAV spraying were slightly lower than those after boom spraying, therefore, the control efficiency of cotton pests is slightly different. According to the different flight height operations by the UAV sprayer, the drift capability of the droplets at 2 m flight height was large, and the droplet uniformity and deposition were satisfactory. The research results could provide the theoretical basis and technical support for UAV operation.

1. Introduction

Cotton (Gossypium spp.) is the main industry of Xinjiang Uygur Autonomous Region, China, and is of great significance to the economic and social development of Xinjiang [1,2]. Due to the geographical and climatic conditions in Xinjiang, continuous cropping of cotton has caused the frequent occurrence of cotton diseases and insect pests, which has led to losses in cotton yield and quality. Hence, strengthening phytochemical prevention and the control of cotton is significant in improving the yield and quality of cotton [3,4]. In recent years, the use of extensive pesticide spraying methods to prevent and treat pests and diseases due to the backward concept of pesticide application has not only had low utilization but also produced large amounts of pesticide residues in crops, thereby causing severe pesticide residue contamination and soil residual contamination [5]. The use of pesticides per unit area in China is 2.5 times than that of the world average, and the area of contaminated arable land is as much as 1 × 10⁷ hm2, accounting for approximately 1/10 of the arable land area [6]. Most cotton pesticide operations are carried out by using large-volume ground machinery in Xinjiang, which results in rolling the cotton plant, hitting the bolls, pulling the cotton branch, hitting the opened balls off, water and pesticide wastage, and reduces the yield and quality of cotton. Furthermore, these operations waste water and pesticides and reduce cotton quality and yield. Therefore, it is a bottleneck and technical issue that restricts the quality and efficiency of cotton production in Xinjiang. The accurate application of pesticide technology will become an inevitable demand for the development of modern agriculture.
The unmanned aerial vehicle (UAV) has emerged as a capable plant protector. It has the advantages of high operational efficiency, high speed, and low drift, but is affected by environmental factors; UAV spraying often produces droplet drift [7]. Droplet drift occurs when, during the application of pesticides, a fraction of the dosage does not reach the target area [8]. The proportion of this loss in the form of droplets moving with the wind across the field border is called spray drift. Droplet deposition and drift characteristics are fundamental aspects of characterizing spray effects [9]. Domestic and foreign scholars have carried out research on the application technology of UAVs. Zhu et al. [10] used a conventional sprayer to conduct field trials on nursery trees to study the effect of spray volume on spray deposition and coverage. Zhang et al. [11] used thermal infrared imaging to study the distribution characteristics of droplet deposition under different spray parameters of UAVs. Qiu et al. [12] adopted a CD-10 UAV to study the effects of flight height and flight velocity and the interaction of the two factors on droplet deposition concentration and deposition uniformity. Zhang et al. [13] proposed a new method of detecting droplet drift and used an N-3 drone to conduct field test verification. Qin et al. [14] studied the effect of the flight height and speed of UAVs on droplet deposition and the control effect on brown planthoppers. Wang et al. [15] applied the spatial pesticide spraying deposition quality balance test method to study the influence of UAV flight mode, flight height, and wind speed on the droplet and flow field distribution. Wang et al. [16] used four typical UAVs to conduct field tests on droplet deposition, coverage rate, droplet density, penetration, and work efficiency. Zheng et al. [17] performed field experiments by changing the flight parameters of multi-rotor UAVs to test the spray effects of different stages of corn growth and mathematical modeling. Chen et al. [18] adopted M234AT four-rotor electric plant protection UAVs for field experiments to study the influence of the wind field direction on droplet distribution. Xu et al. [19] studied the distribution characteristics of droplets in the vertical direction of rice under different flight parameters.
Fritz et al. [20] tested the droplet deposition effects of three types of nozzles and studied the effects of spray rate and droplet size on droplet deposition. Zhu et al. [21] performed field tests on newly developed nozzles to study the droplet penetration and deposition uniformity of the nozzles. Kirk [22] used a particle measurement systems (PMS) laser spectrometer to study the relationship between nozzle type, spray parameters and droplet drift, and established atomization parameter models. Derksen et al. [23] conducted spray tests on soybeans to study the effect of nozzle type and spray volume on droplet deposition and droplet penetration. Ferguson et al. [24] experimentally investigated the relationship between nozzle type, application volume, droplet size, droplet density, coverage, and canopy penetration.
In these preceding studies, almost all of the researchers focused on the effect of the UAV working parameters on the distribution of droplets. However, there is no report on the control of pests and the dynamic absorption of leaves. Herein, we report our results concerning the droplet distribution and drift in cotton canopy and other factors for the control of cotton aphids and spider mites through pesticide application with UAV sprayers.

2. Materials and Methods

2.1. Experimental Site

The experiment was carried out in Beiquan town of Xinjiang Production and Construction Crops, Shihezi, Xinjiang Uygur Autonomous Region, China, during July 2017. The experimental field had middle level fertilizer and planted cotton for many years. Cotton (Xinluzao 67) was planted on 21 April 2017, using a mechanical cotton-picking planting model, with wide film planting six lines (10 cm + 66 cm), 225,000 cotton/ha, and drip irrigation under plastic film (Figure 1).

2.2. Insecticide and Reagents

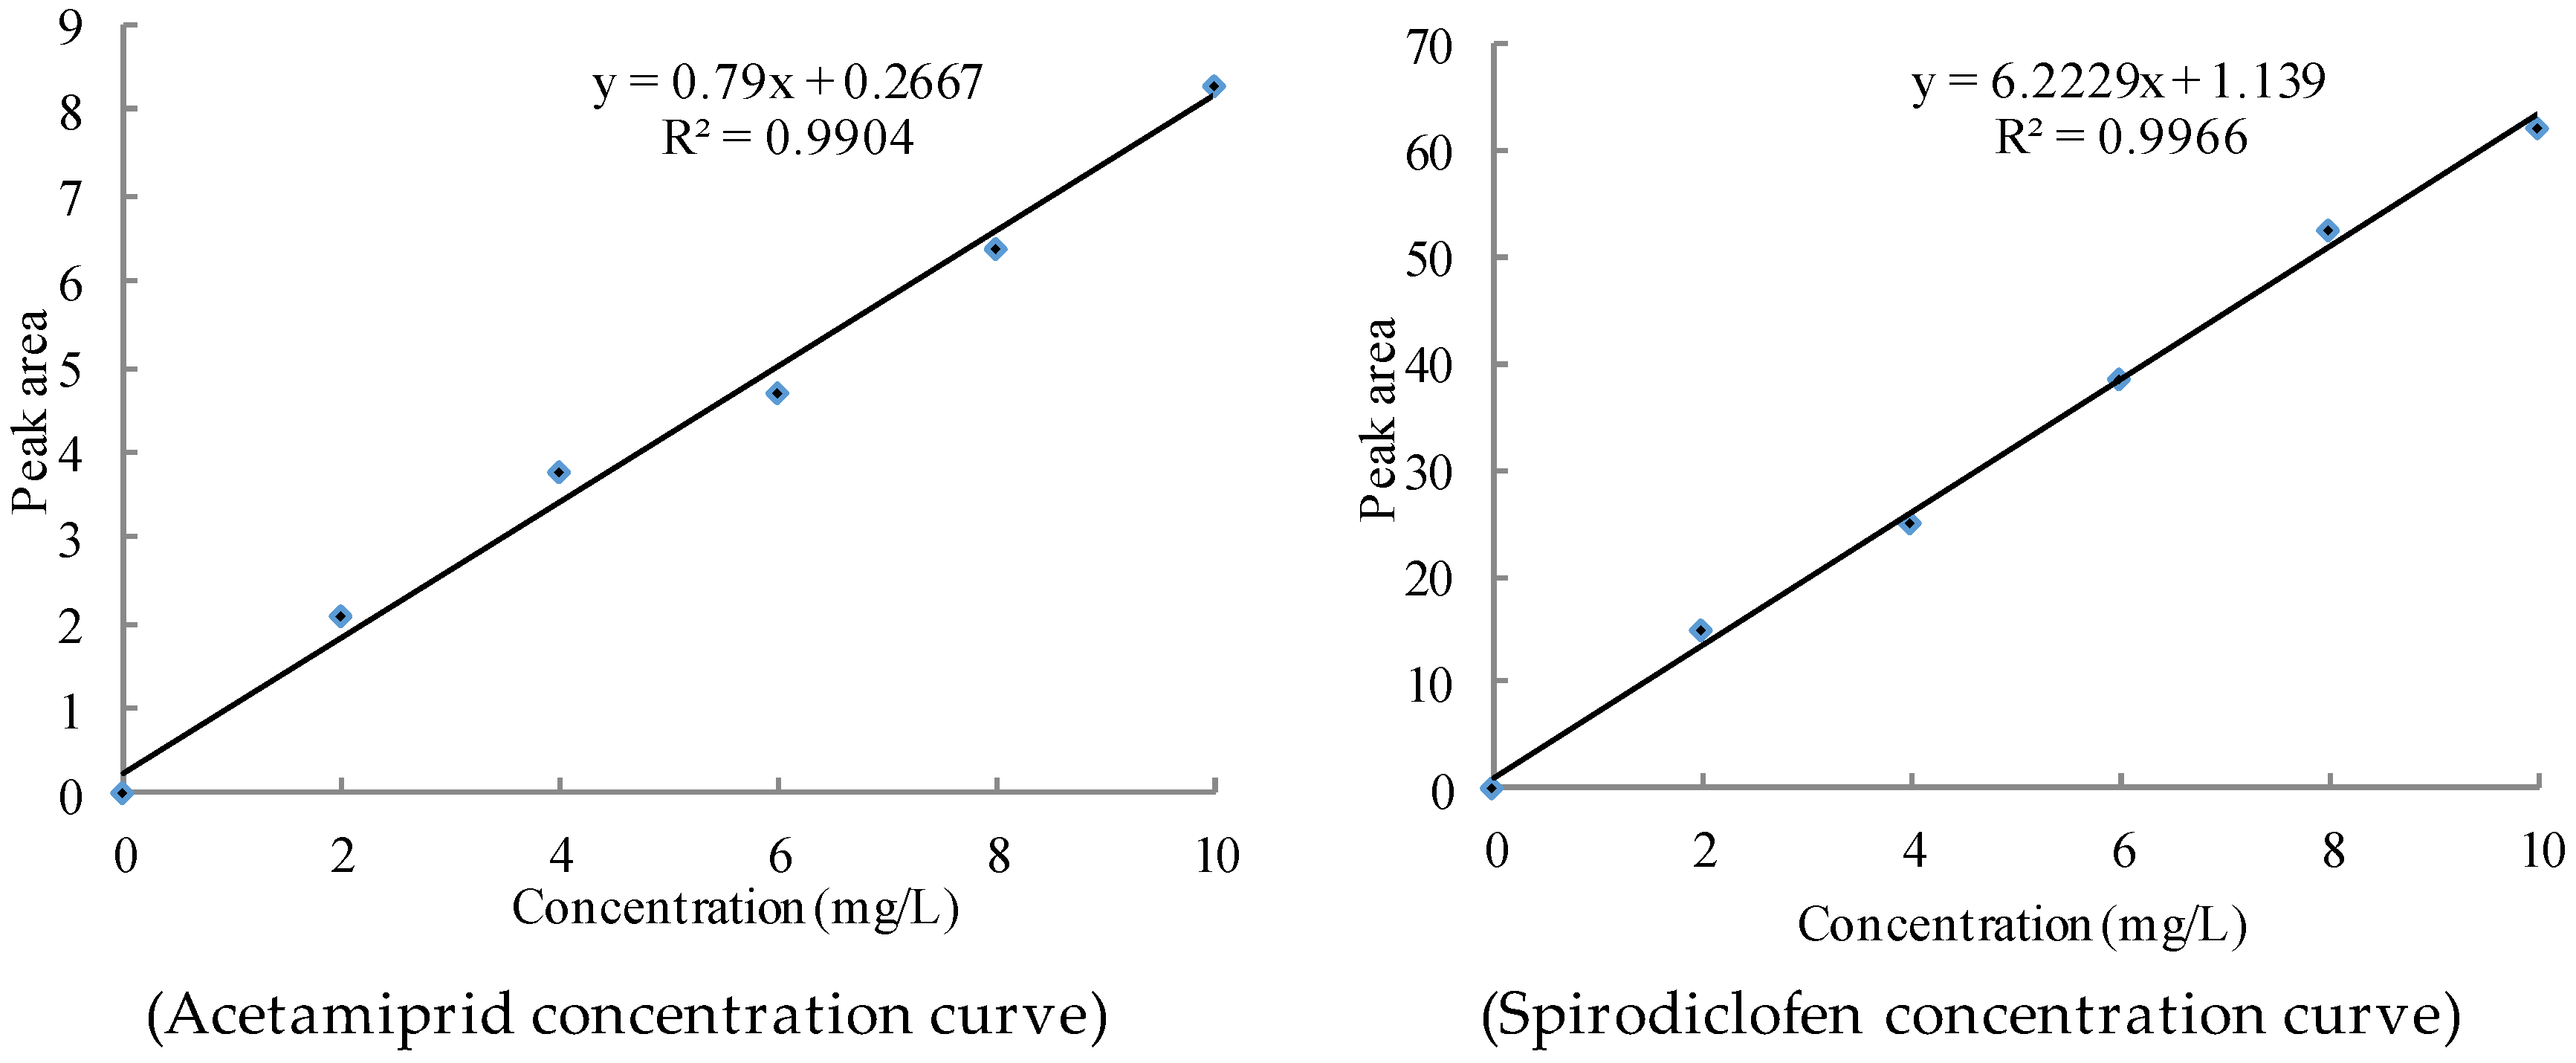
The experimental reagents were as follows: 20% acetamiprid wettable powder (Sino-Agri United Biotechnology Co., Ltd., Jinan, China), 240 g/L Spirodiclofen, suspension concentrate (Shandong Zouping Nongyao Co., Ltd., Binzhou, China), 5% avermectin emulsifiable concentrate (Hebei Beyong Bio-Chemical Co., Ltd., Shijiazhuang, China), allura red indicators (Zhejiang Gigagold Pigment Technology Co., Ltd., Wenzhou, China), 97% acetamiprid standard and 97% spirodiclofen standard (J&K Scientific Ltd., Beijing, China), and HPLC-grade methanol (Sigma-Aldrich, St. Louis, MO, USA) and primary secondary amine (PSA) sorbent (Welch Technology (Shanghai) Limited Co., Ltd., Shanghai, China).
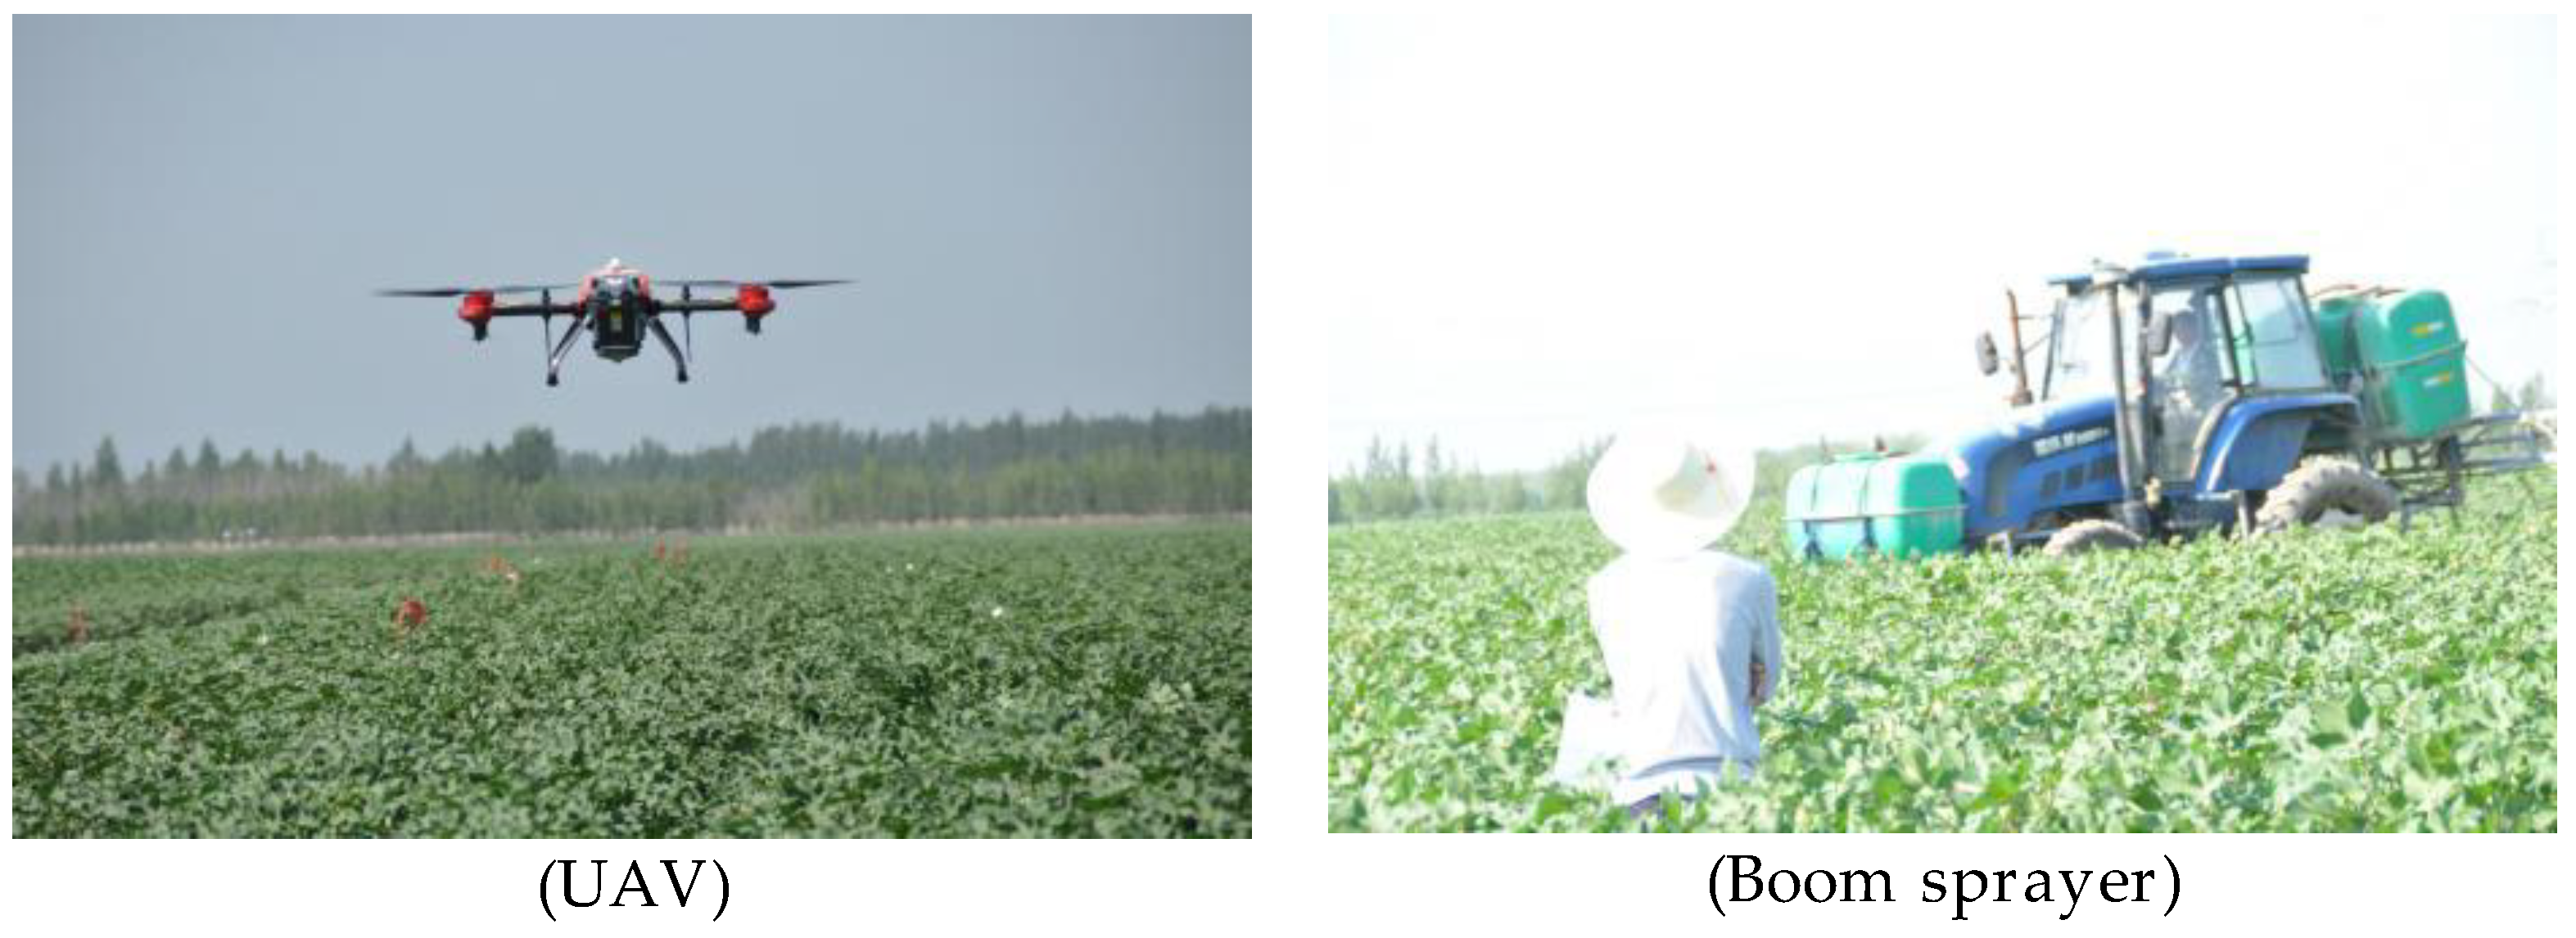
The experimental equipment was as follows: Jifei P20 UAV (Guangzhou Jifei Science and Technology Co., Ltd., Guangzhou, China) with a new generation of SUPERX2 RTK flight control system with more accurate GNSS RTK positioning module and spray system to make UAV plant protection more precise, smarter, and more efficient (Figure 1, Table 1). A 3W-1000Y boom sprayer (SINO-AGRI Fengmao Plant Protection Machinery Co., Ltd., Beijing, China), an anemometer (Beijing Zhongxi Great Technology Co., Ltd., China), a temperature and humidity instrument (Shenzhen Huatu Electric Co., Ltd., Shenzhen, China), an Tecan Infinite 200 PRO ELISA instrument (Switzerland), and agilent 7890B gas chromatograph with flame ionization detector (FID) (Agilent Technologies, Palo Alto, CA, USA).
Acetamiprid was analyzed with an Agilent 7890B GC equipped with an HP-5 30 m capillary column with a film thickness of 0.32 mm × 0.25 μm (Agilent Technologies, Palo Alto, CA, USA). The electronic balance, BSA224S-CW, was from Sartorius, Göttingen, Germany. The high-speed centrifuge, LDZS-2, was from Beijing Jingli centrifuge Co., Ltd., Beijing, China. The swirl meter, MS3 D S25, IKA, came from Staufen im Breisgau, Germany. The ultrasonic cleaner, KQ-500 DB, was from Kunshan Ultrasonic Instruments Co., Ltd., Kunshan, Jiangsu, China, and the rotary evaporators, RV10 D, were from IKA, Staufen im Breisgau, Germany.

2.3. Experimental Design

The experiment consisted of three treatments (Table 2). Cotton defoliant spraying was carried out on 12 July 2017. Each treatment was conducted on an area of 1.33 hm2. Treatment 1 was conducted with the boom sprayer. Treatments 2 and 3 were low-height and low-volume spraying by the UAV at working heights of 1.5 and 2 m above the canopy. The weather during the experimental period is described in Table S1.

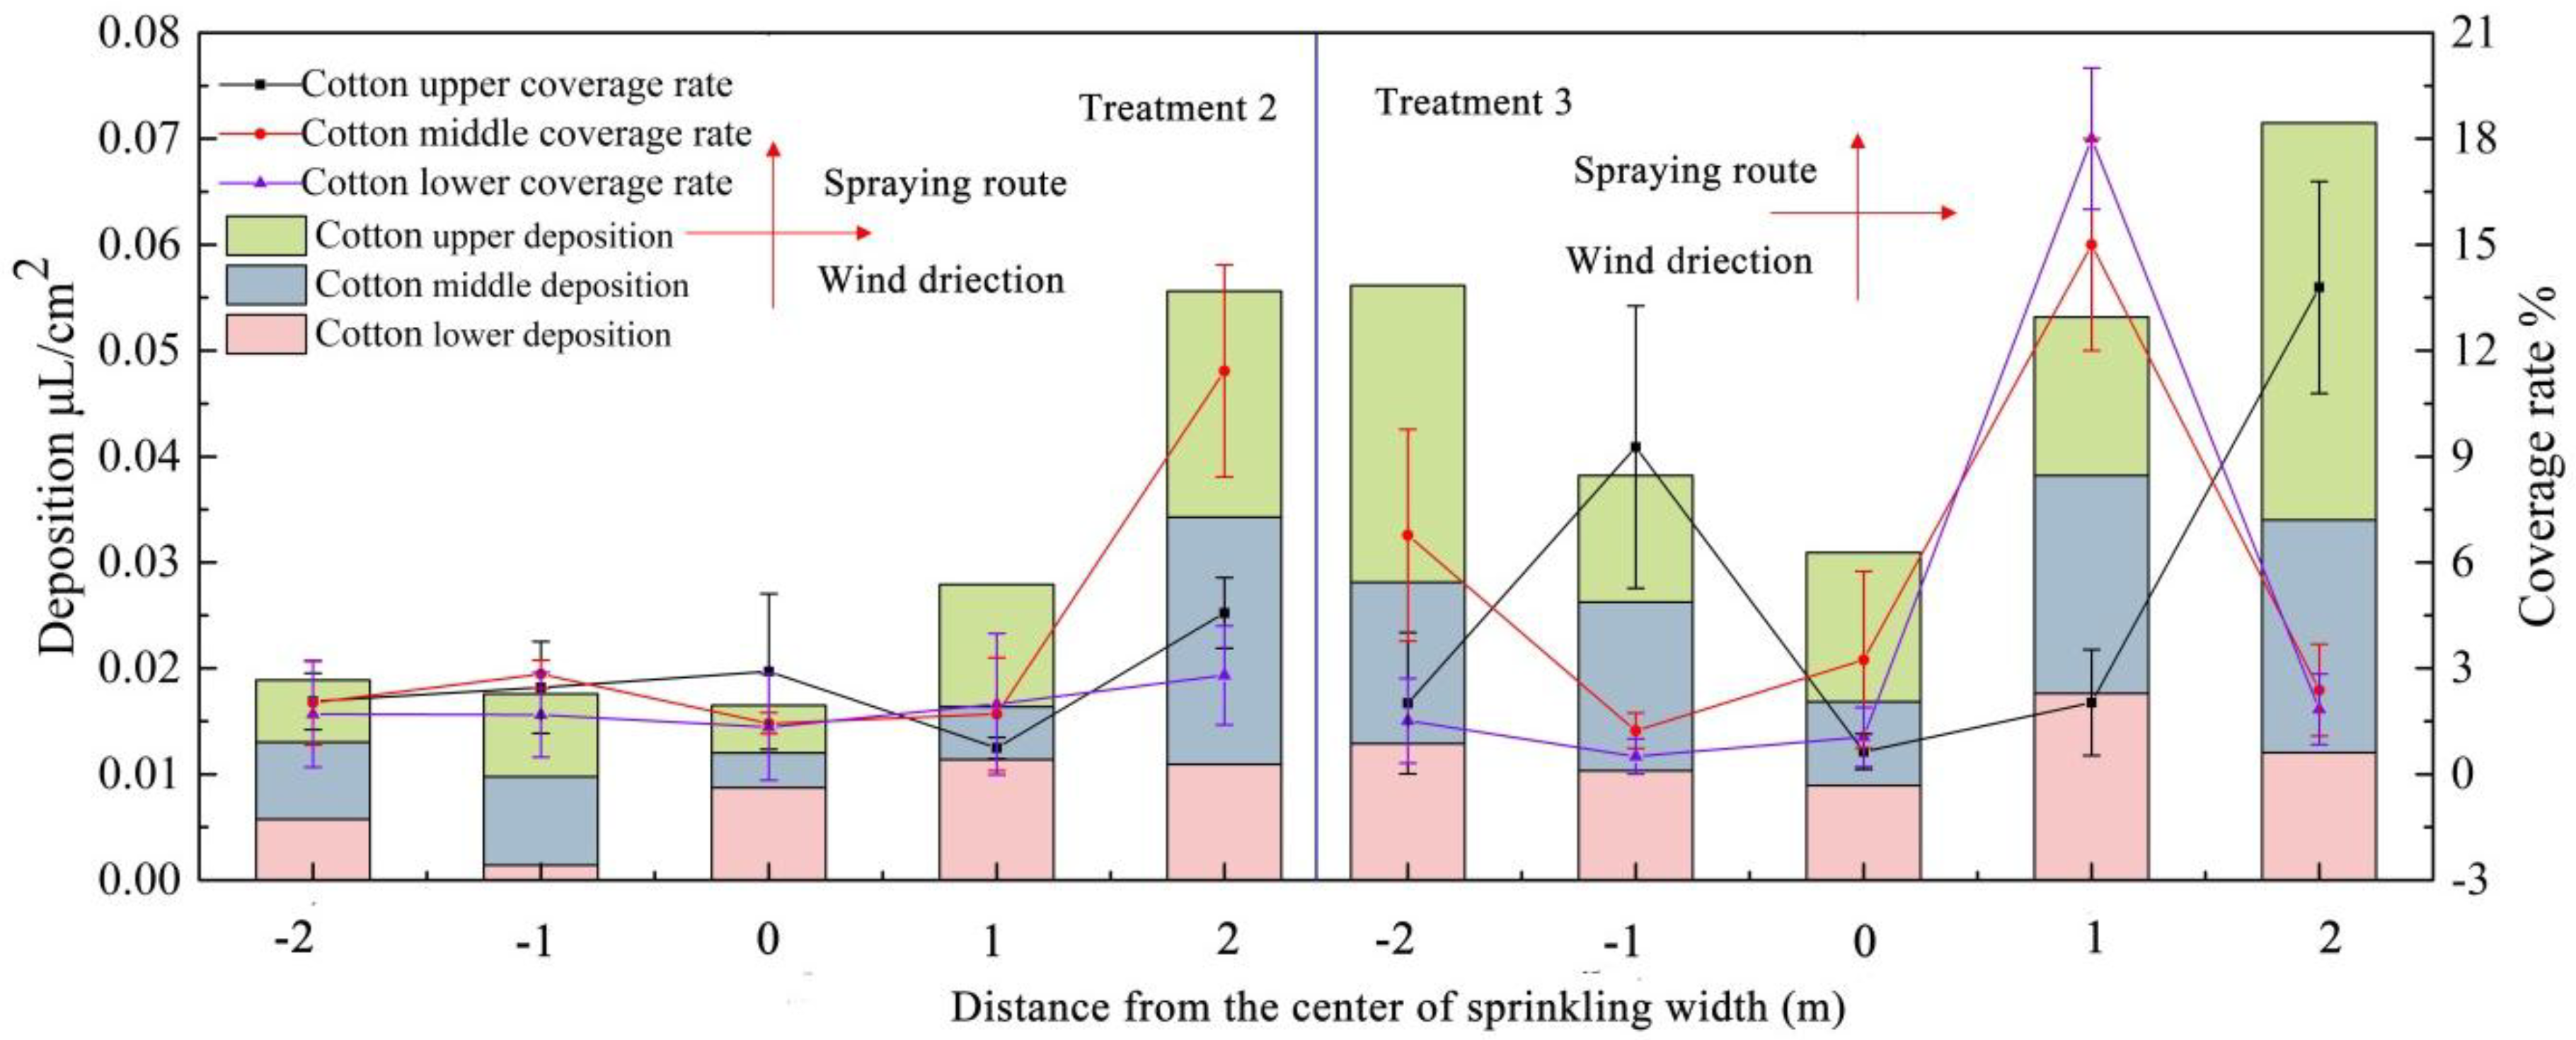
2.4. Evaluation of Droplet Deposition

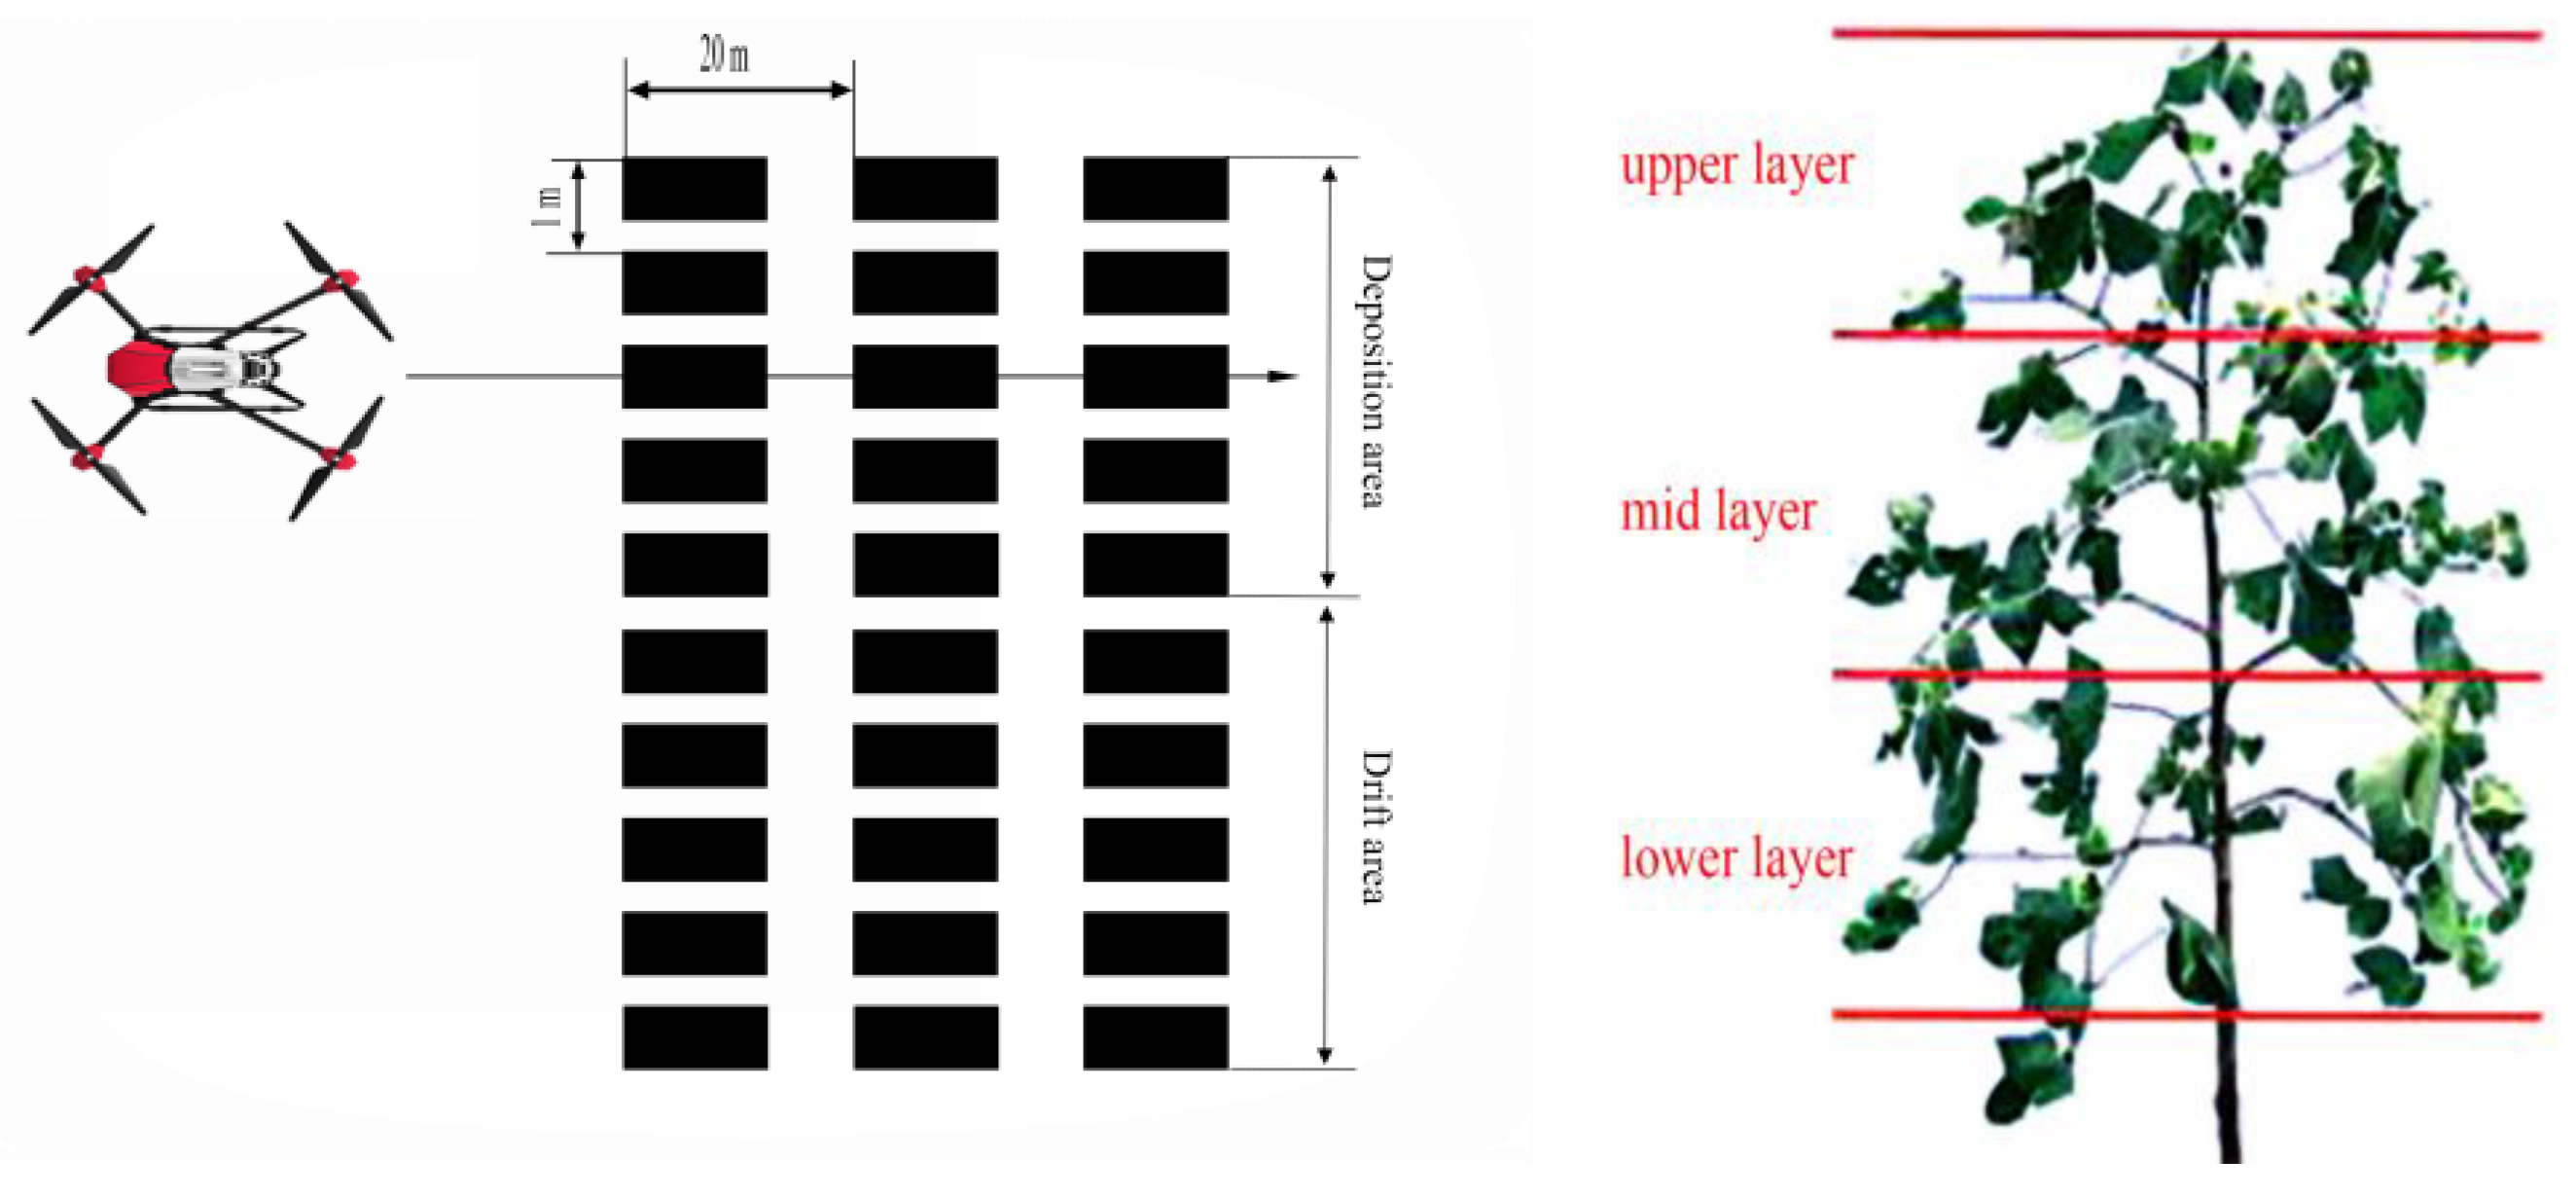
The UAV spraying test aimed to study the droplet deposition and drifting regularity of the cotton plants by UAV spraying. Before spraying, a handheld GPS locator was used to determine the coordinates of each spraying zone. Five points (deposition area) were arranged on the line perpendicular to the spray belt in the test area, and five points (drift area) were arranged from the edge of the spray width, with 1 m between each point (determined according to the spray width). The sample layout was repeated thrice. The UAV flew through the center of the deposition area as shown in Figure 2. Before spraying, a stapler was used to attach kromekote cards and filter paper to cotton leaves in the cotton canopy. The kromekote cards and filter paper were placed at a height that was equivalent to the lower, middle, and upper thirds of the cotton canopy (Figure 2) [25].
The kromekote cards and filter papers were collected after the field experiment and placed in self-sealing bags. Each card was separately photographed on a light table using a high resolution digital-single-lens-reflex (DSLR) camera positioned at a 10 cm height above the light table. Photographs of the sprayed cards were analyzed using Image J software (Image J 1.48, National Institutes of Health, Bethesda, MD, USA). Each card was cropped to remove the background area, changed into 8-bit format, and then individually threshold adjusted to ensure that only sprayed droplets were included in the sample analysis. Each image was analyzed for droplet number density and percent coverage. Coverage was determined as the percent coverage of the card from the blue dye of the deposited droplets [24].
In the laboratory, each filter paper was washed with 5 mL of distilled water and kept in separate bags. Each bag was shaken for 1 min, and the papers were allowed to soak for 1 h. Afterwards, the washing solution was removed from the bag, and the colorant concentration was measured at 514 nm with an ELISA instrument. The solution obtained from washing unsprayed strips of filter papers was used as the baseline solution. Droplet distribution was determined in accordance with the standard curve of allura red. Equation (1) was used to calculate the deposition of droplets on the cotton plants [15]:
β dep = ( ρ s m p l ρ b l k ) × F c a l × V d i i ρ s p r a y × A c o l
where βdep is the droplet deposition in μL/cm2; ρsmpl is the ELISA instrument reading of the sample; ρblk is the ELISA instrument reading of the blanks (collector + dilution water); Fcal is the relationship between the ELISA instrument reading and the allura red concentration in (μg/L)/unit number; Vdii is the volume of the dilution liquid used to dilute tracer from collector, L; ρspray is the concentration of the tracer in spray in g/L; and Acol is the area of the filter paper in cm2.
The experiment ended after the droplets on the Kromekote card were dried (deposition area), sealed in a self-sealing bag, and the data were collected and processed in the laboratory. To characterize the uniformity of droplet deposition between collection points in the test, the uniformity of droplet deposition was measured by the CV of droplet deposition densities at different locations of the cotton plants in the UAV effective spray width. The CV of droplet deposition density was calculated by Equations (2) and (3).
C V = S X ¯ × 100 %
S = i = 1 n ( X i X ¯ ) 2 / ( n 1 )
where S is the sample standard deviation, Xi is the number of droplets per unit area at each collection point, and X ¯ is the number of collection points per layer.
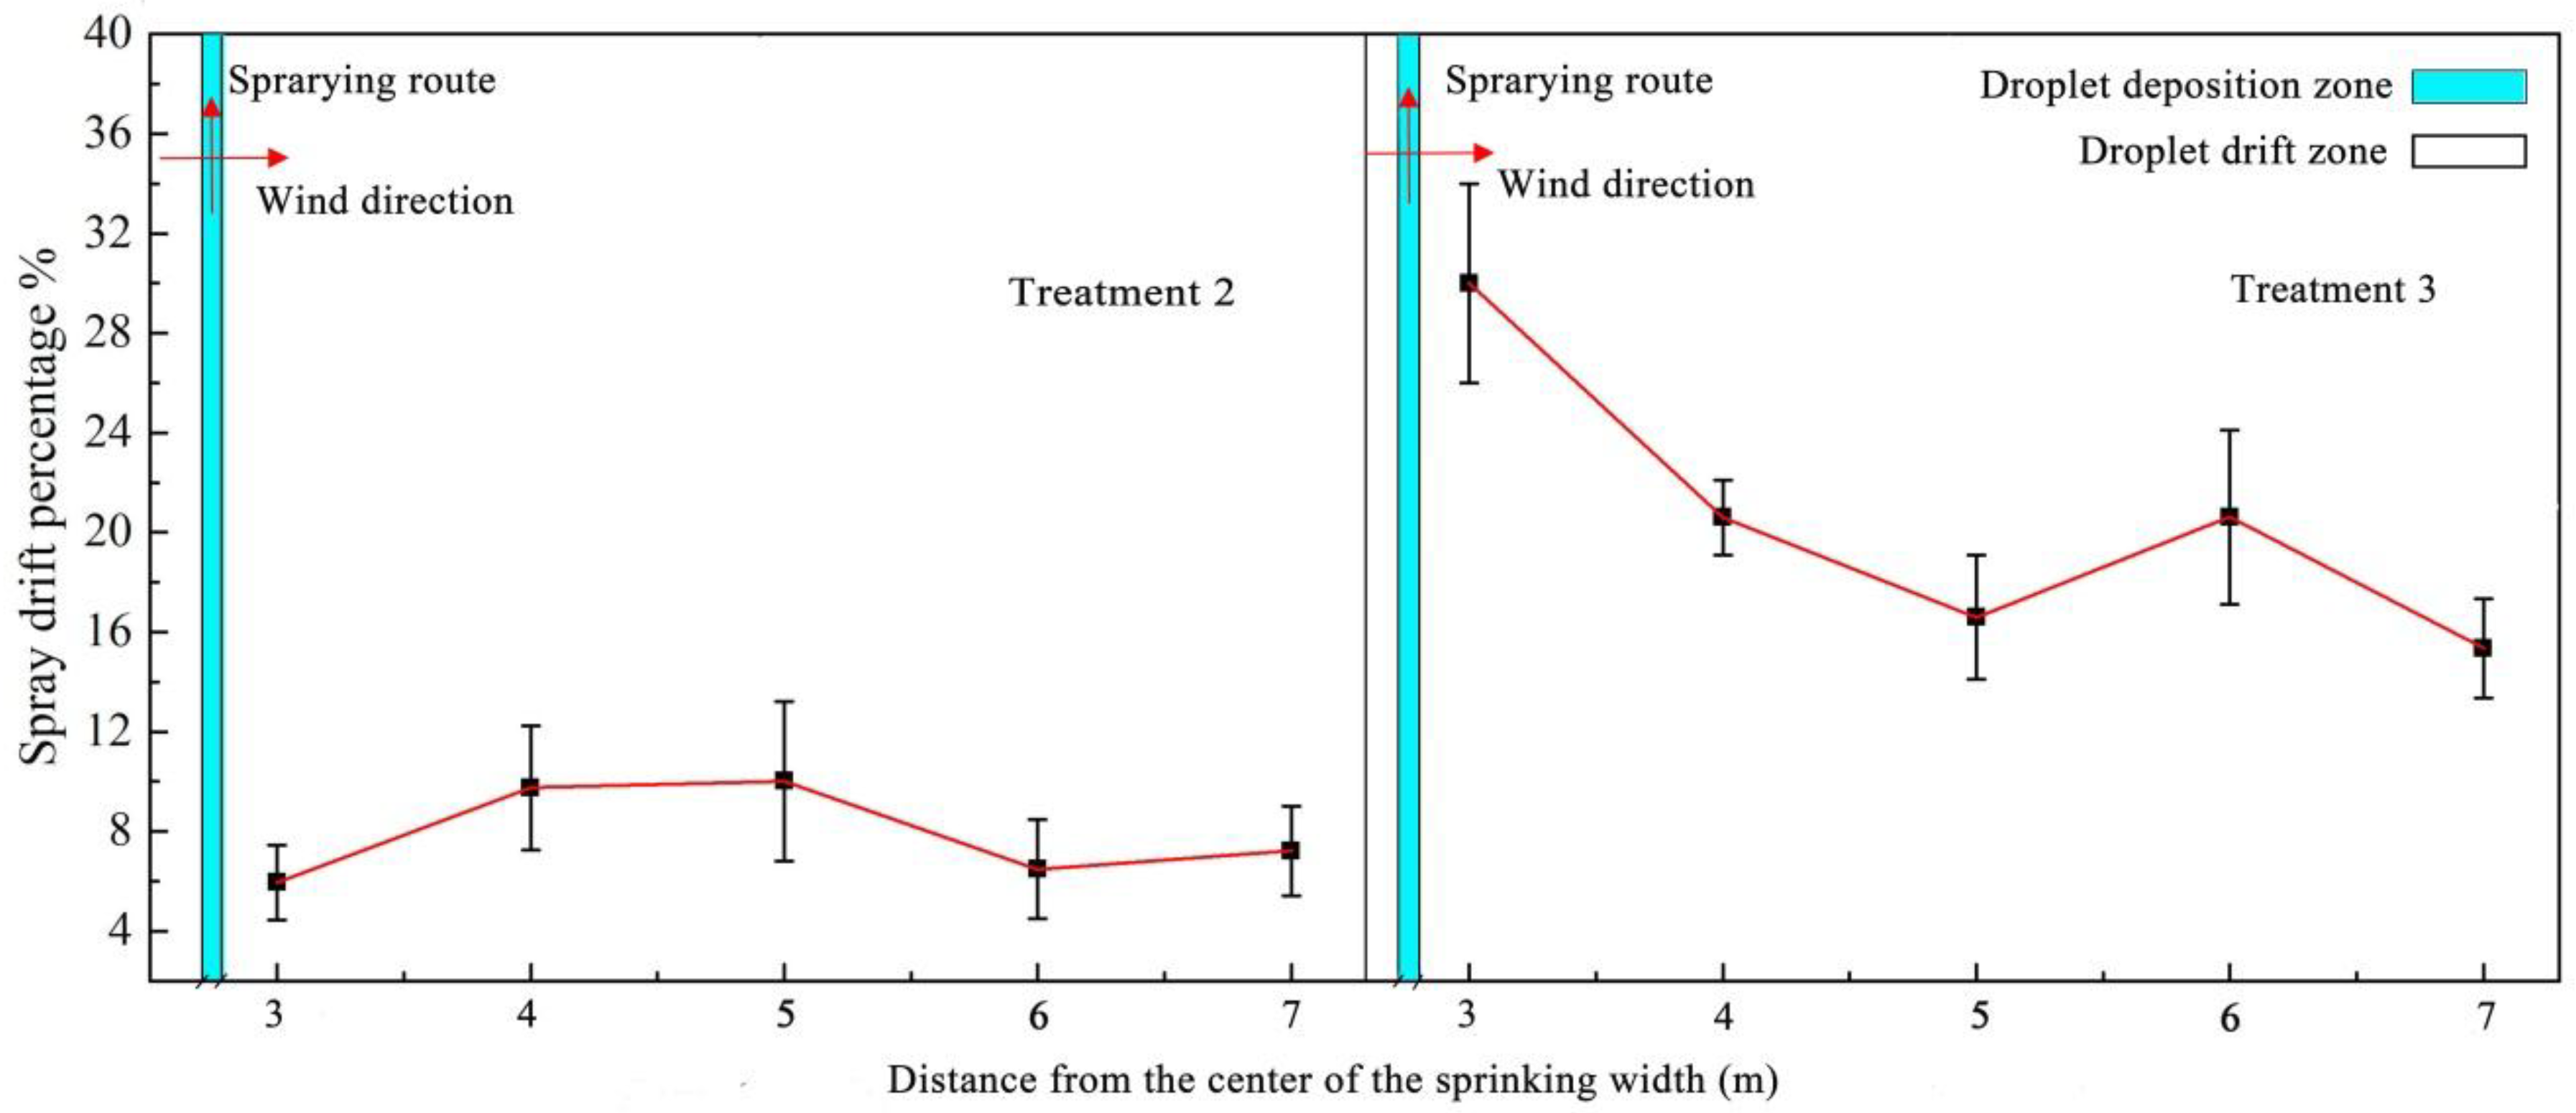
To characterize the distribution of the droplet drift between collection points in the test, the drift of droplets in the experiment was expressed by the spray drift percentage of the UAV [26]. The droplet drift percentage was calculated by Equation (4):
β dep % = β dep × 10000 β V
where βdep is the spray drift deposit in μL/cm2; βdep% is the spray drift percentage in %; and βV is the spray volume in L/ha2.

Allura Red Concentration: Absorbance Demarcation

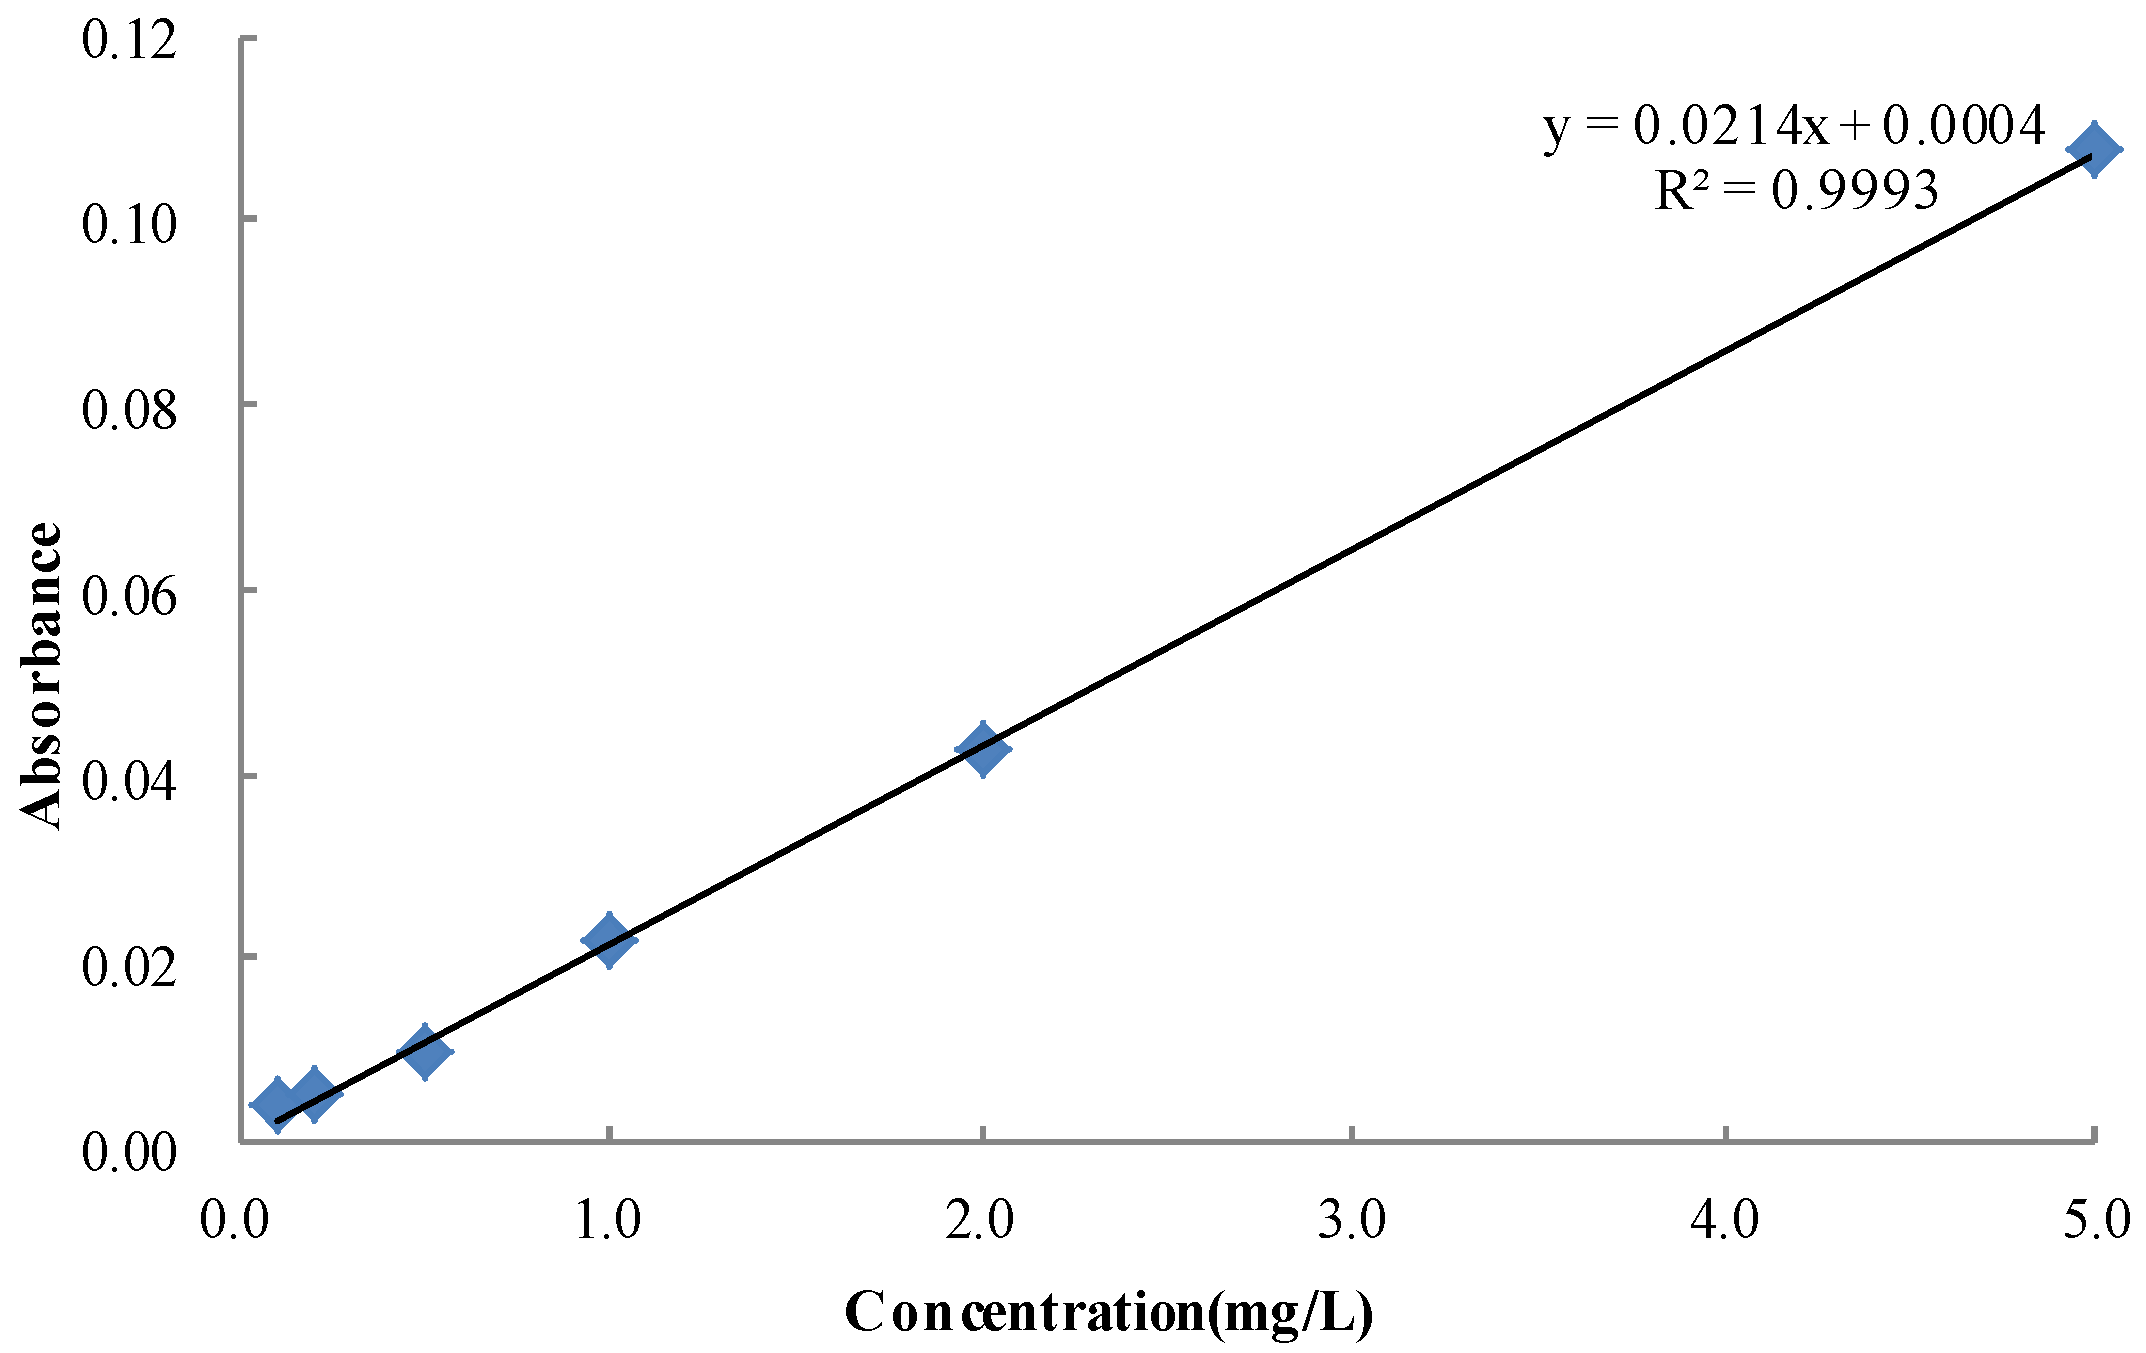
To ensure the accuracy of the measurement data, the allura red (20 mg) was dissolved in 100 mL of water and diluted to 1 L to a final concentration of 20 mg/L. The mother liquid was then diluted to 0.1, 0.2, 0.5, 1, 2, and 5 mg/L. The absorbance values were measured at 514 nm in triplicate per concentration by using the ELISA instrument. The standard curve of allura red was created on the basis of the absorbance values of the six solutions [12], as shown in Figure 3.
The linear fitting of the standard solution concentration and absorbance, correlation index R2 = 0.993, and concentration and absorbance for the relationship was as follows:
C = 0.0214A + 0.0004
where A is the absorbance of the allura red solution and C is the concentration of the allura red solution in mg/L.

2.5. Control of Cotton Aphids and Spider Mites

The survey and recording of aphid and spider mite populations were performed in accordance with criteria for pesticide field efficacy tests. To investigate the control effect of pesticide application on aphid and spider mites, the parallel-jump method was used to survey the population numbers of cotton aphids and spider mites in each zone prior to spraying and at five days after spraying. Each zone was subjected to a five-point survey using five cotton plants for each point. The total numbers of aphids and spider mites for a 10-point survey using one cotton leaf for each point were counted. The overall control effect against aphids and cotton spider mites was quantified without considering the types or growth stages of aphids and spider mites. The dropping rate and control effect were obtained on the basis of the population numbers of live insects in each zone before and after spraying in accordance with Equations (5) and (6).
D = ((NaNb)/N) × 100%,
CE = (DaDb)/(100 − Db) ×100%,
where D is the decline rate of insect mouth; Na is the number of live insects before spraying; Nb is the number of live insects after spraying; CE is the control efficiency; Da is the decline rate of insect mouth in the treatment area; Db is the decline rate of insect mouth in the control area.

2.6. Attachment and Absorption of Cotton Leaves

2.6.1. Sample Extraction and Purification

Cotton leaves were collected after spraying. Four grams of cotton leaves were accurately weighed, ground into powder (liquid nitrogen grinding), and placed into a 50 mL centrifuge tube. Five milliliters of ultrapure water and 10 mL of methanol (chromatographically pure) were added, shaken and extracted for 30 min. 3 g of NaCI was added, vortexed for 1 min, and centrifuged at 3800 r/min for 5 min. One milliliter of supernatant was obtained and placed in a 2 mL centrifuge tube containing 50 mL PSA, placed in the vortex mixer for 1 min, and centrifuged at 1000 r/min for 3 min. The supernatant was filtered through a 0.22 μm organic membrane filter and then tested [27].

2.6.2. Chromatographic Conditions

The sample was analyzed with an Agilent 7890B GC equipped with an HP-5 30 m capillary column with a film thickness of 0.32 mm × 0.25 μm (Agilent Technologies, Palo Alto, CA, USA). The initial temperature was set to 180 °C for 1 min; gradually increased to 230 °C at a rate of 30 °C/min and held at 230 °C for another 2 min; gradually increased to 260 °C at a rate of 25 °C/min and held at 260 °C for another 2 min and finally gradually increased to 280 °C at a rate of 15 °C/min and held at 280 °C for another 2 min. The injection, column and FID temperature was 270 °C, 260 °C, and 280 °C, respectively. The nitrogen carrier gas rate, hydrogen rate, air rate, and injection volume were 40.0 mL/min, 30 mL/min, 400 mL/min and 1.0 μL. Under the above chromatographic conditions, the retention time of acetamiprid was approximately 8.66 min, and the retention time of spirodiclofen was approximately 9.60 min.

2.6.3. Standard Curves of Spirodiclofen and Acetamiprid Concentration

A mother liquor of 1000 mg/L acetamiprid and spirodiclofen was prepared and diluted with methanol (chromatographically pure) to standard solutions of 2, 4, 6, 8, 10, and 12 mg/L, underwent gas chromatography FID injection, and was tested under 1.5.2 chromatographic conditions. A good linear relationship was observed between the peak areas and mass concentrations of acetamiprid and spirodiclofen. The standard curves were y = 0.79x + 0.2667 and y = 6.2229x + 1.139. The correlation coefficients were 0.9904 and 0.9966, as shown in Figure 4.

2.6.4. Determination of Recovery

Exactly 0.05, 0.5, and 5.0 mg/kg of acetamiprid standard solution were added to blank cotton leaves. Three parallel tests were performed for each solution. Extraction and purification were conducted according to the method of 1.5.1, with the determination of recovery and standard deviation (Table 3). The results showed that the average recovery of acetamiprid in the cotton leaves was 90.8–101.5%, and the relative standard deviation was 3.7–6.9%, which met the residue analysis requirements [28].

3. Results and Discussion

3.1. Statistics and Data Processing

Data were statistically analyzed using the software SPSS (SPSS Inc., an IBM Company, Chicago, IL, USA). Collector coverage and droplet density were analyzed in separate linear mixed models with seperationsmade at the p = 0.05 level. A one-way analysis of variance was conducted for droplet deposition and drift in treatment 2 and treatment 3 to verify the significance effect of flight height on the experimental results (Table 4). The denominator degrees of freedom (df) was the protection from bias, achieved through the inclusion of the adjustment for the generalized linear mixed model. The significant effect of flight height on the deposition and drift of droplets is shown in Table 4: the flight height has a significant impact on droplet deposition (p = 0.022 < 0.05), the flight height has a highly significant impact on droplet drift (p = 0.0013 < 0.01).

3.2. Droplet Deposition

The uniformity of the spray-droplet distribution on targets is commonly described by the CV of the droplet density. The smaller the CV, the better the uniformity of the droplet deposition [29]. The CV of droplet distribution at different flight heights of UAV is shown in Table 5. At the flight height of 1.5 m, the CVs of droplet density were 117.1%, 178.1%, and 85.8% on the upper, middle, and lower layer of the cotton canopy, respectively. At the flight height of 2 m, the CVs of droplet density were 79.4%, 50.3%, and 146.4%. The CV of upper and middle droplet density at the flight height of 1.5 m was significantly higher than 2 m. This may be a result of the reduced flight height, which generates a strong downward swirling airflow that causes the plants to sway substantially, and the droplet density causes a significant change of the cotton canopy [30].

3.3. Droplet Deposition Distribution

We studied the droplet deposition characteristics within the spray width sprayed by UAV (Figure 5). Flight height showed a significant effect on the droplet distribution sprayed by UAV. The distribution of droplets in the vertical direction in the test was represented by the droplet density. At the flight height of 1.5 m, the average coverage rates were 2.5%, 3.2%, and 1.9% for the upper, middle, and lower layers of the cotton canopy. At a flight height of 2 m, the average coverage rates were 4.9%, 5.5%, and 5.0%. The coverage rates at 2 m were higher than those at 1.5 m.
The droplet distribution in the horizontal direction in the test was represented using the deposition. At the flight height of 1.5 m, the deposition of each sampling point in the deposition area was 0.018, 0.017, 0.015, 0.027, and 0.055 μL/cm2. The deposition was least in the spray center. Downwind, deposition increases with distance from the center of the spray width. A distance from the spray width center of 2 m showed the maximum deposition. At a flight height of 2 m, the deposition of each sampling point was higher than those at 1.5 m, the maximum deposition is more than the flight height of 1.5 m. This may be due to the increase of flight height and the weakening of the downward pressure wind field below the rotor. Part droplets have a small range of drift in the downwind direction due to the lateral wind field effects. The research on the wind field below the UAV rotor, such as in Chen et al., used a wireless wind speed sensor network measurement system for an unmanned helicopter to study the wind field distribution below the rotor. The experimental results show that the horizontal wind field and the vertical wind field below the rotor affect the distribution of droplets. Current research on wind field is not comprehensive enough and still requires further study [18].

3.4. Droplet Drift

The data collected by the spray droplets at different flight heights of the UAVs were analyzed. The droplet drift in the test was expressed using the percentage of droplet drift in the horizontal direction of the drift zone, as shown in Figure 6. Flight height showed a significant effect on the droplet drift in the cotton canopy sprayed by UAV. When the flight height was 2 m, the drift percentage fluctuated from 15% to 30%, and the fluctuation range was large. When the flight height was 1.5 m, the drift percentage fluctuated from 5% to 12%. The average drift percentage (7.9%) at 1.5 m was much lower than that at 2 m (20%). This result could be attributed to the increased flight height, and the fact that the vertical wind field above the canopy of the cotton plant weakened, resulting in a large number of droplets drifting [26].

3.5. Control Efficiency of Cotton Aphid and Spider Mite

To validate the superior cotton-pest control of pesticide application through the UAV sprayers, the aphid control effect by UAV sprayers was compared with that by boom sprayer. The control effect in the test was expressed using the decline rate of insect mouth, as shown in Figure 7. The control effect by boom sprayer for cotton aphids on the fifth day after the test was 90.0%, while the UAV sprayer control effect was 64.0%. The control effect by the UAV sprayer for cotton aphids was 26.0% lower than that by the boom sprayer. The control effect by the boom sprayer for spider mites on the fifth day after the test was 68.0%, while the UAV sprayer control effect was 61.3%. The control effects by UAV sprayer for spider mites was 6.7% lower than that by the boom sprayer. Qin et al.’s research on wheat pest control shows that the control efficacy was 92%–74% from 3 to 10 days after UAV spraying, and the control effect is good and the persistence period is long. In contrast, the prevention and control of cotton pests requires further research.

3.6. Attachment and Absorption of Pesticide on Cotton Leaves

To clarify the effects of defoliant adsorption on the attachment of cotton leaves, acetamiprid and spirodiclofen adsorption was studied. The result is shown in Table 6. After pesticide application through the boom sprayer, the cotton leaf attachment and adsorption of acetamiprid were concentrated in the middle and lower cotton leaves. After pesticide application through the UAV sprayer, the cotton leaf attachment and adsorption were concentrated in the upper and middle cotton leaves. The droplet penetrability by the boom sprayer was better than that by the UAV sprayer. After pesticide application through the boom sprayer, the cotton leaf attachment and adsorption of spirodiclofen on the upper, middle, and lower cotton leaves were 2.92, 0.67, and 1.10 mg/kg, respectively. By comparison, the cotton leaf attachment and adsorption through UAV spraying were 0.85, 0.46, and 0.77 mg/kg, respectively, which were slightly lower than that by the boom sprayer. According to international oeko-tex standards, the residual amount of pesticides in cotton should not exceed 1.0 mg/kg. In this test, only the residual amount of spironolactone by UAV spraying complies with national standards, so the UAV application technology needs further research [31].

4. Conclusions

In summary, UAV was used for pesticide spraying to control aphids and spider mites in cotton in the flowering and boll-setting stages. The uniform and penetrative deposition and droplet drift law in cotton canopies at different flight heights are studied, analyzed, and compared with the control effect of cotton aphids and spider mite spray by a boom sprayer. Conclusions are drawn as follows. The flight height has a significant impact on droplet deposition and drift, the P-value representing droplet deposition and droplet drift are 0.022 and 0.0013, respectively. When the flight height is 2 m, the CV of the upper and middle droplet density is small and the droplet uniformity is good. At the flight height of 1.5 m, the deposition of each sampling point in the deposition area was 0.018, 0.017, 0.015, 0.027, and 0.055 μL/cm2; the average coverage rate was 2.5%, 3.2%, and 1.9% for the upper, middle, and lower layers of the cotton canopy. This indicates that the working height is too low, which will result in a strong downward swirling airflow, and the cotton will sway greatly, causing a large change in the droplet deposition. These values are slightly inferior to those achieved through the 2 m spraying. At the flight height of 1.5 m, the percentage of droplet drift fluctuates from 5% to 15%. At the flight height of 2 m, the vertical wind field above the canopy of the cotton plant is weakened due to the increased flight height, resulting in several droplets drifting. The control effect by boom sprayer for cotton aphids and spider mites was 90.0%, 68.0%; the UAV sprayer control effect was 64.0%, 61.3%. The control effect by the UAV sprayer is slightly worse than that by the boom sprayer. After pesticide application through the boom sprayer, the cotton leaf attachment and adsorption of acetamiprid were concentrated in the middle and lower cotton leaves. The droplet penetrability by the boom sprayer was greater. The cotton leaf attachment and adsorption of spirodiclofen by UAV spraying on the upper, middle, and lower are slightly lower than that by the boom sprayer.
In recent years, cotton pests and diseases have occurred frequently, resulting in a significant decline in cotton production, and the development of plant protection machinery is vital in Xinjiang. UAVs application techniques are widely used because of their unique advantages in terms of their water-saving and medicine-saving characteristics as well as their high-operating efficiency, non-rolling of cotton sticks, and not dragging bolls during operation. The UAVs application technology must continue to optimize the operating methods and the selection of aviation-specific reagents to improve the spraying effects, improve the pesticide utilization rate, and improve the quality and efficiency of the cotton industry in Xinjiang.

Supplementary Materials

The following are available online at https://www.mdpi.com/2073-4395/8/9/187/s1, Table S1: Weather conditions during the test period.

Author Contributions

W.F. and X.H. conceived and designed the experiments. Z.L., F.X., and T.D. performed the field experiments. X.H. and W.F. analyzed the data. Z.L. wrote the paper. Y.L. conceived the research and revised the manuscript.

Acknowledgments

The authors gratefully acknowledge the financial support provided by The National Key Research and Development Program of China (No. 2016YFD0200700) and The Xinjiang Corps International Cooperation Program (2017BC001).

Conflicts of Interest

The authors declare no conflict of interest.

References

  1. Ma, X.Y.; Wang, Z.G.; Jiang, W.L. Analysis of current status and application prospects of unmanned Aerial Vehicle Plant protection technology in cotton field in China. China Cotton 2016, 43, 7–11. [Google Scholar]
  2. Marco, G.; Emilio, G.; Paolo, B. Advances in developing a new test method to assess spray drift potential from air blast sprayers. Span. J. Agric. Res. 2017, 15, e0207. [Google Scholar]
  3. Sierra, J.G.; Canavate, J.O.; Sanhneza, J.R. Short communication Performance of pneumatic spraying with an over-the-row sprayer in high density apple tree orchards. Span. J. Agric. Res. 2006, 4, 26–30. [Google Scholar] [CrossRef]
  4. Ramon, S.; Cruz, G.; Rafael, G. Description of the airflow produced by an air-assisted sprayer during pesticide applications to citrus. Span. J. Agric. Res. 2015, 13, e208. [Google Scholar]
  5. Yuan, H.Z.; Yang, D.B.; Yan, X.J. Pesticide efficiency and the way to optimize the spray application. Plant Prot. 2011, 37, 14–20. [Google Scholar]
  6. Li, L.; He, X.K. Development and experiment of automatice detection device for infrared target. ASAE 2012, 28, 159–163. [Google Scholar]
  7. Hilz, E.; Vermeer, A.W.P. Spray drift review: The extent to which a formulation can contribute to spray drift reduction. Crop Prot. 2013, 44, 75–83. [Google Scholar] [CrossRef]
  8. Kirk, I.W. Aerial spray drift from different formulations of glyphosate. Trans. ASABE 2000, 43, 555–559. [Google Scholar] [CrossRef]
  9. Huang, Y.; Thomson, S.J. Characterization of spray deposition and drift from a low drift nozzle for aerial application at different application altitudes. Int. J. Agric. Biol. Eng. 2011, 4, 28–33. [Google Scholar]
  10. Zhu, H.; Zondag, R.H.; Derksen, R.C. Influence of Spray Volume on Spray Deposition and Coverage within Nursery Trees. J. Environ. Hortic. 2007, 26, 1–27. [Google Scholar]
  11. Zhang, J.; He, X.K.; Song, J.L. Influence of spraying parameters of unmanned aircraft on droplets deposition. Trans. CSAM 2012, 43, 94–96. (In Chinese) [Google Scholar]
  12. Qiu, B.J.; Wang, L.W.; Cai, D.L. Effect of flight height and speed of unmanned helicopter on spray deposition uniform. Trans. CSAE 2013, 29, 25–32. (In Chinese) [Google Scholar]
  13. Zhang, S.C.; Xue, X.Y.; Qin, W.C. Simulation and experimental verification of aerial spraying drift on N-3 unmanned spraying helicopter. Trans. CSAE 2015, 31, 87–93. (In Chinese) [Google Scholar]
  14. Qin, W.C.; Qiu, B.J.; Xue, X.Y. Droplet deposition and control effect of insecticides sprayed with an unmanned aerial vehicle against plant hoppers. Crop Prot. 2016, 85, 79–88. [Google Scholar] [CrossRef]
  15. Wang, C.L.; He, X.K.; Wang, X.N. Testing method of spatial pesticide spraying deposition quality balance for unmanned aerial vehicle. Trans. CSAE 2016, 32, 54–61. (In Chinese) [Google Scholar] [CrossRef]
  16. Wang, S.L.; Song, J.L.; He, X.K. Performances evaluation of four typical unmanned aerial vehicles used for pesticide application in China. Int. J. Agric. Biol. Eng. 2017, 10, 22–31. [Google Scholar]
  17. Zheng, Y.J.; Yang, S.H.; Zhao, C.J. Modelling operation parameters of UAV on spray effects at different growth stages of corns. Int. J. Agric. Biol. Eng. 2017, 10, 57–66. [Google Scholar]
  18. Chen, S.D.; Lan, Y.B.; Li, J.Y. Effect of wind field below rotor on distribution of aerial spraying droplet deposition by using multi-rotor UAV. Trans. CSAM 2017, 48, 105–113. (In Chinese) [Google Scholar]
  19. Xu, T.Y.; Yu, F.H.; Cao, Y.L. Veetical distribution of spray droplet deposition of plant protection multi rotor UAV for japonica rice. Trans. CSAM 2017, 48, 101–107. (In Chinese) [Google Scholar]
  20. Fritz, B.K.; Kirk, I.W.; Hoffmann, W.C. Aerial application methods for increasing spray deposition on wheat heads. ASAE 2006, 22, 357–364. [Google Scholar]
  21. Zhu, H.; Derksen, R.C.; Krause, C.R. Dynamic Air Velocity and Spray Deposition inside Dense Nursery Crops with a Multi-Jet Air-Assist Sprayer; ASAE Paper No. 061125; ASAE: St. Joseph, MI, USA, 2006. [Google Scholar]
  22. Kirk, I.W. Measurement and prediction of atomization parameters from fixed-wing aircraft spray nozzles. ASAE 2007, 50, 693–703. [Google Scholar]
  23. Derksen, R.C.; Zhu, H.; Ozkan, H.E. Determining the influence of spray quality, nozzle type, spray volume, and air-assisted application strategies on deposition of pesticides in soybean canopy. ASAE 2008, 51, 1529–1537. [Google Scholar] [CrossRef]
  24. Ferguson, J.C.; Chechetto, R.G.; Hewitt, A.J. Assessing the deposition and canopy penetration of nozzles with different spray qualities in an oat (Avena sativa L.) canopy. Crop Prot. 2016, 81, 14–19. [Google Scholar] [CrossRef]
  25. Berger-Neto, A.; Jaccoud-Filho, D.S.; Wutzki, C.R. Effect of spray droplet size, spray volume and fungicide on the control of white mold in soybeans. Corp Prot. 2017, 92, 190–197. [Google Scholar] [CrossRef]
  26. Xue, X.Y.; Tu, K.; Qin, W.C. Drift and deposition of ultra-low height and low volume application in paddy field. Int. J. Agric. Biol. Eng. 2014, 7, 23–28. [Google Scholar]
  27. Feng, Y.Z.; Jin, J.; Pan, J.J. Residues and degradation dynamics of thidiazuron and diuron in cotton. Mod. Agrochem. 2017, 4, 35–38. [Google Scholar]
  28. Wu, Y.J.; Ru Yi Chen, Z.L. The determination of acetamiprid residues in pear by GC. Agrochemicals 2009, 3, 211–212. [Google Scholar]
  29. Yao, W.X.; Lan, Y.B.; Wang, J. Droplet drift characteristics of aerial spraying of AS350B3e helicopter. Trans. CSAE 2017, 33, 75–83. (In Chinese) [Google Scholar]
  30. Qin, W.C.; Xue, X.Y.; Zhou, L.X. Effects of spraying parameters of unmanned aerial vehicle on droplets deposition distribution of maize canopies. Trans. CSAM 2014, 30, 50–56. (In Chinese) [Google Scholar]
  31. Oeko-Tex Associationa. Oeko-Tex Satandard 100; Oeko-Tex Associationa: Zurich, Switzerland, 2012. [Google Scholar]
Figure 1. Unmanned aerial vehicle (UAV) sprayer and boom sprayer.
Agronomy 08 00187 g001
Figure 2. Arrangement of kromekote cards and filter paper.
Agronomy 08 00187 g002
Figure 3. Standard curve of allura red solution.
Agronomy 08 00187 g003
Figure 4. Standard curve of Spirodiclofen and Acetamiprid Concentration.
Agronomy 08 00187 g004
Figure 5. Distributions of droplet deposition at different flight heights. Note: Treatments 2 and 3 were low-height and low-volume spraying by the UAV at working heights of 1.5 and 2 m above the canopy. The upper, middle, and lower layers of cotton are divided according to Figure 2.
Agronomy 08 00187 g005
Figure 6. Distribution of droplet drift at different flying heights. Note: Treatments 2 and 3 were low-height and low-volume spraying by the UAV at working heights of 1.5 and 2 m above the canopy.
Agronomy 08 00187 g006
Figure 7. Control effect of the boom sprayer and UAV sprayer on cotton aphids and spider mites.
Agronomy 08 00187 g007
Table 1. Characteristic parameters of UAV and boom sprayer.
ParameterUAVBoom Sprayer
Dimensions (m)1.18 × 1.18 × 0.411.28 × 2.5 × 1.765
Spraying width (m)1.5–318
Nozzle typeCentrifugal nozzleHollow conical nozzle
Nozzle numbers436
Flow rate (mL/min)200–8001580
Spraying height (m)1–101.75
Driving speed (m/s)1–80.5–1
Tank capacity (L)6, 8, 101000
Spraying patternLow volume and high concentrationHigh volume and high concentration
Table 2. Treatment for insecticide dosage.
TreatmentSpray Volume (L/hm2)Dosage (a.i. g/hm2)
AcetamipridSpirodiclofenAvermectinAllura Red
1450607222.5150
212607222.5150
312607222.5150
Table 3. Added recovery rate of acetamiprid.
Added Concentration mg/kgAcetamiprid
123Average Recovery %RSD %
0.05107.06102.9494.41101.54.8
0.587.1992.7393.3991.13.7
5.091.6589.7790.9090.86.9
Note: 1, 2, 3 means three parallel tests for each solution.
Table 4. Analysis of variance of droplet deposition and drift.
FactorIndicatorsSSdfpSignificanceF
Flight heightDroplet deposition0.002410.022*5.95
Spray drift percentage0.001310.0013**13.207
Note: p means the significance level of the factor affecting the result, p < 0.01 (** represent factors has highly significant on test result), p < 0.05( * represent factors has significant impact on test result).
Table 5. Distribution of droplet density.
Working Height (m)Sampling SiteDroplet Density (Deposition/cm2)MaxMinSCV (%)
1.5 mUpper2.01f6.200.702.35117.1
Middle7.23d30.200.7712.88178.1
Lower3.21e6.400.732.7685.8
2 mUpper11.35a26.132.239.0179.4
Middle9.35b16.373.404.7050.3
Lower9.17c32.970.5713.42146.4
Note: The droplet density in the table are mean. Data followed by different small letters are significantly different among different treatments at p < 0.05 level by Duncan’s new multiple range test.
Table 6. Effect of cotton leaf attachment and absorption.
Absorption (mg/kg)Boom SprayerUAV 1.5 mUAV 2 m
UpperMiddleLowerUpperMiddleLowerUpperMiddleLower
Acetamiprid absorption8.02b11.18c12.45a10.42c--10.55c11.18b6.88a
Spirodiclofen absorption2.92c0.67a1.10b1.78b--0.85b0.46a0.77a
Note: The data in the table are mean. Data followed by different small letters are significantly different among different treatments at p < 0.05 level by Duncan’s new multiple range test.

