Biochars Improve Nutrient Phyto-Availability of Hawai’i’s Highly Weathered Soils


Abstract
:1. Introduction
2. Materials and Methods
Statistical Analysis
3. Results
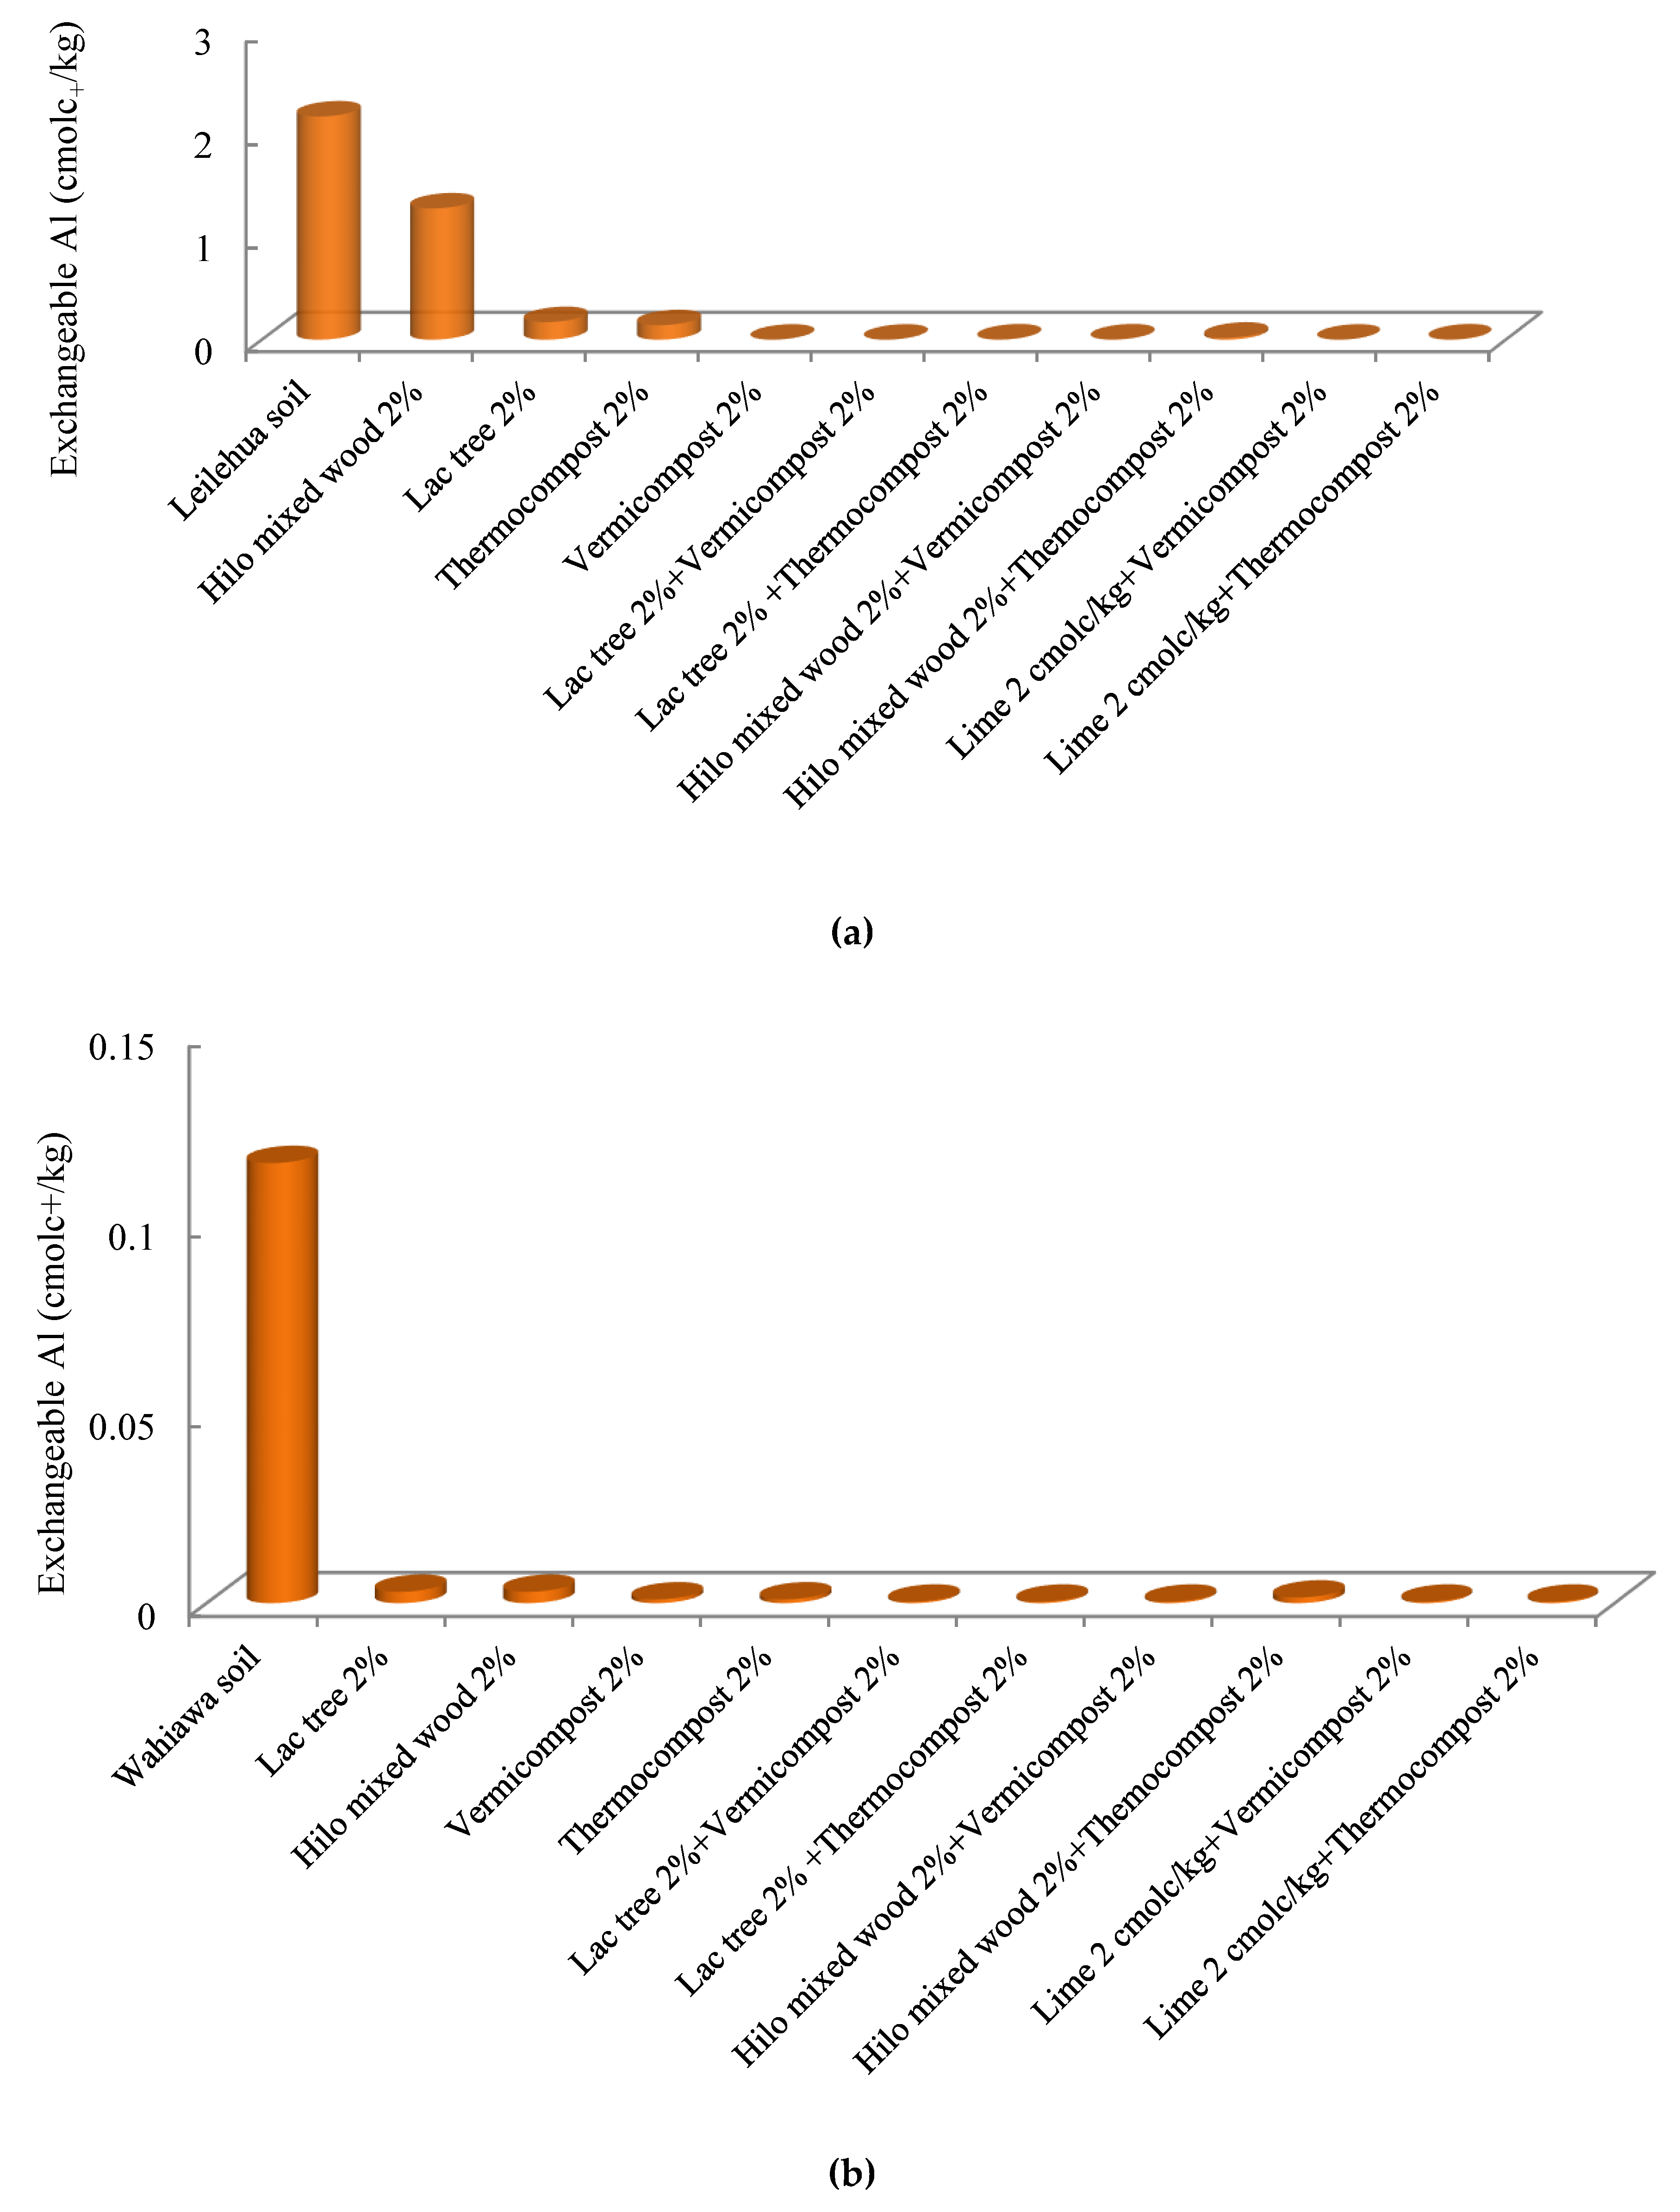
3.1. Soil pH, EC and Exchangeable Al
3.2. Plant Nutrient Content in Soils
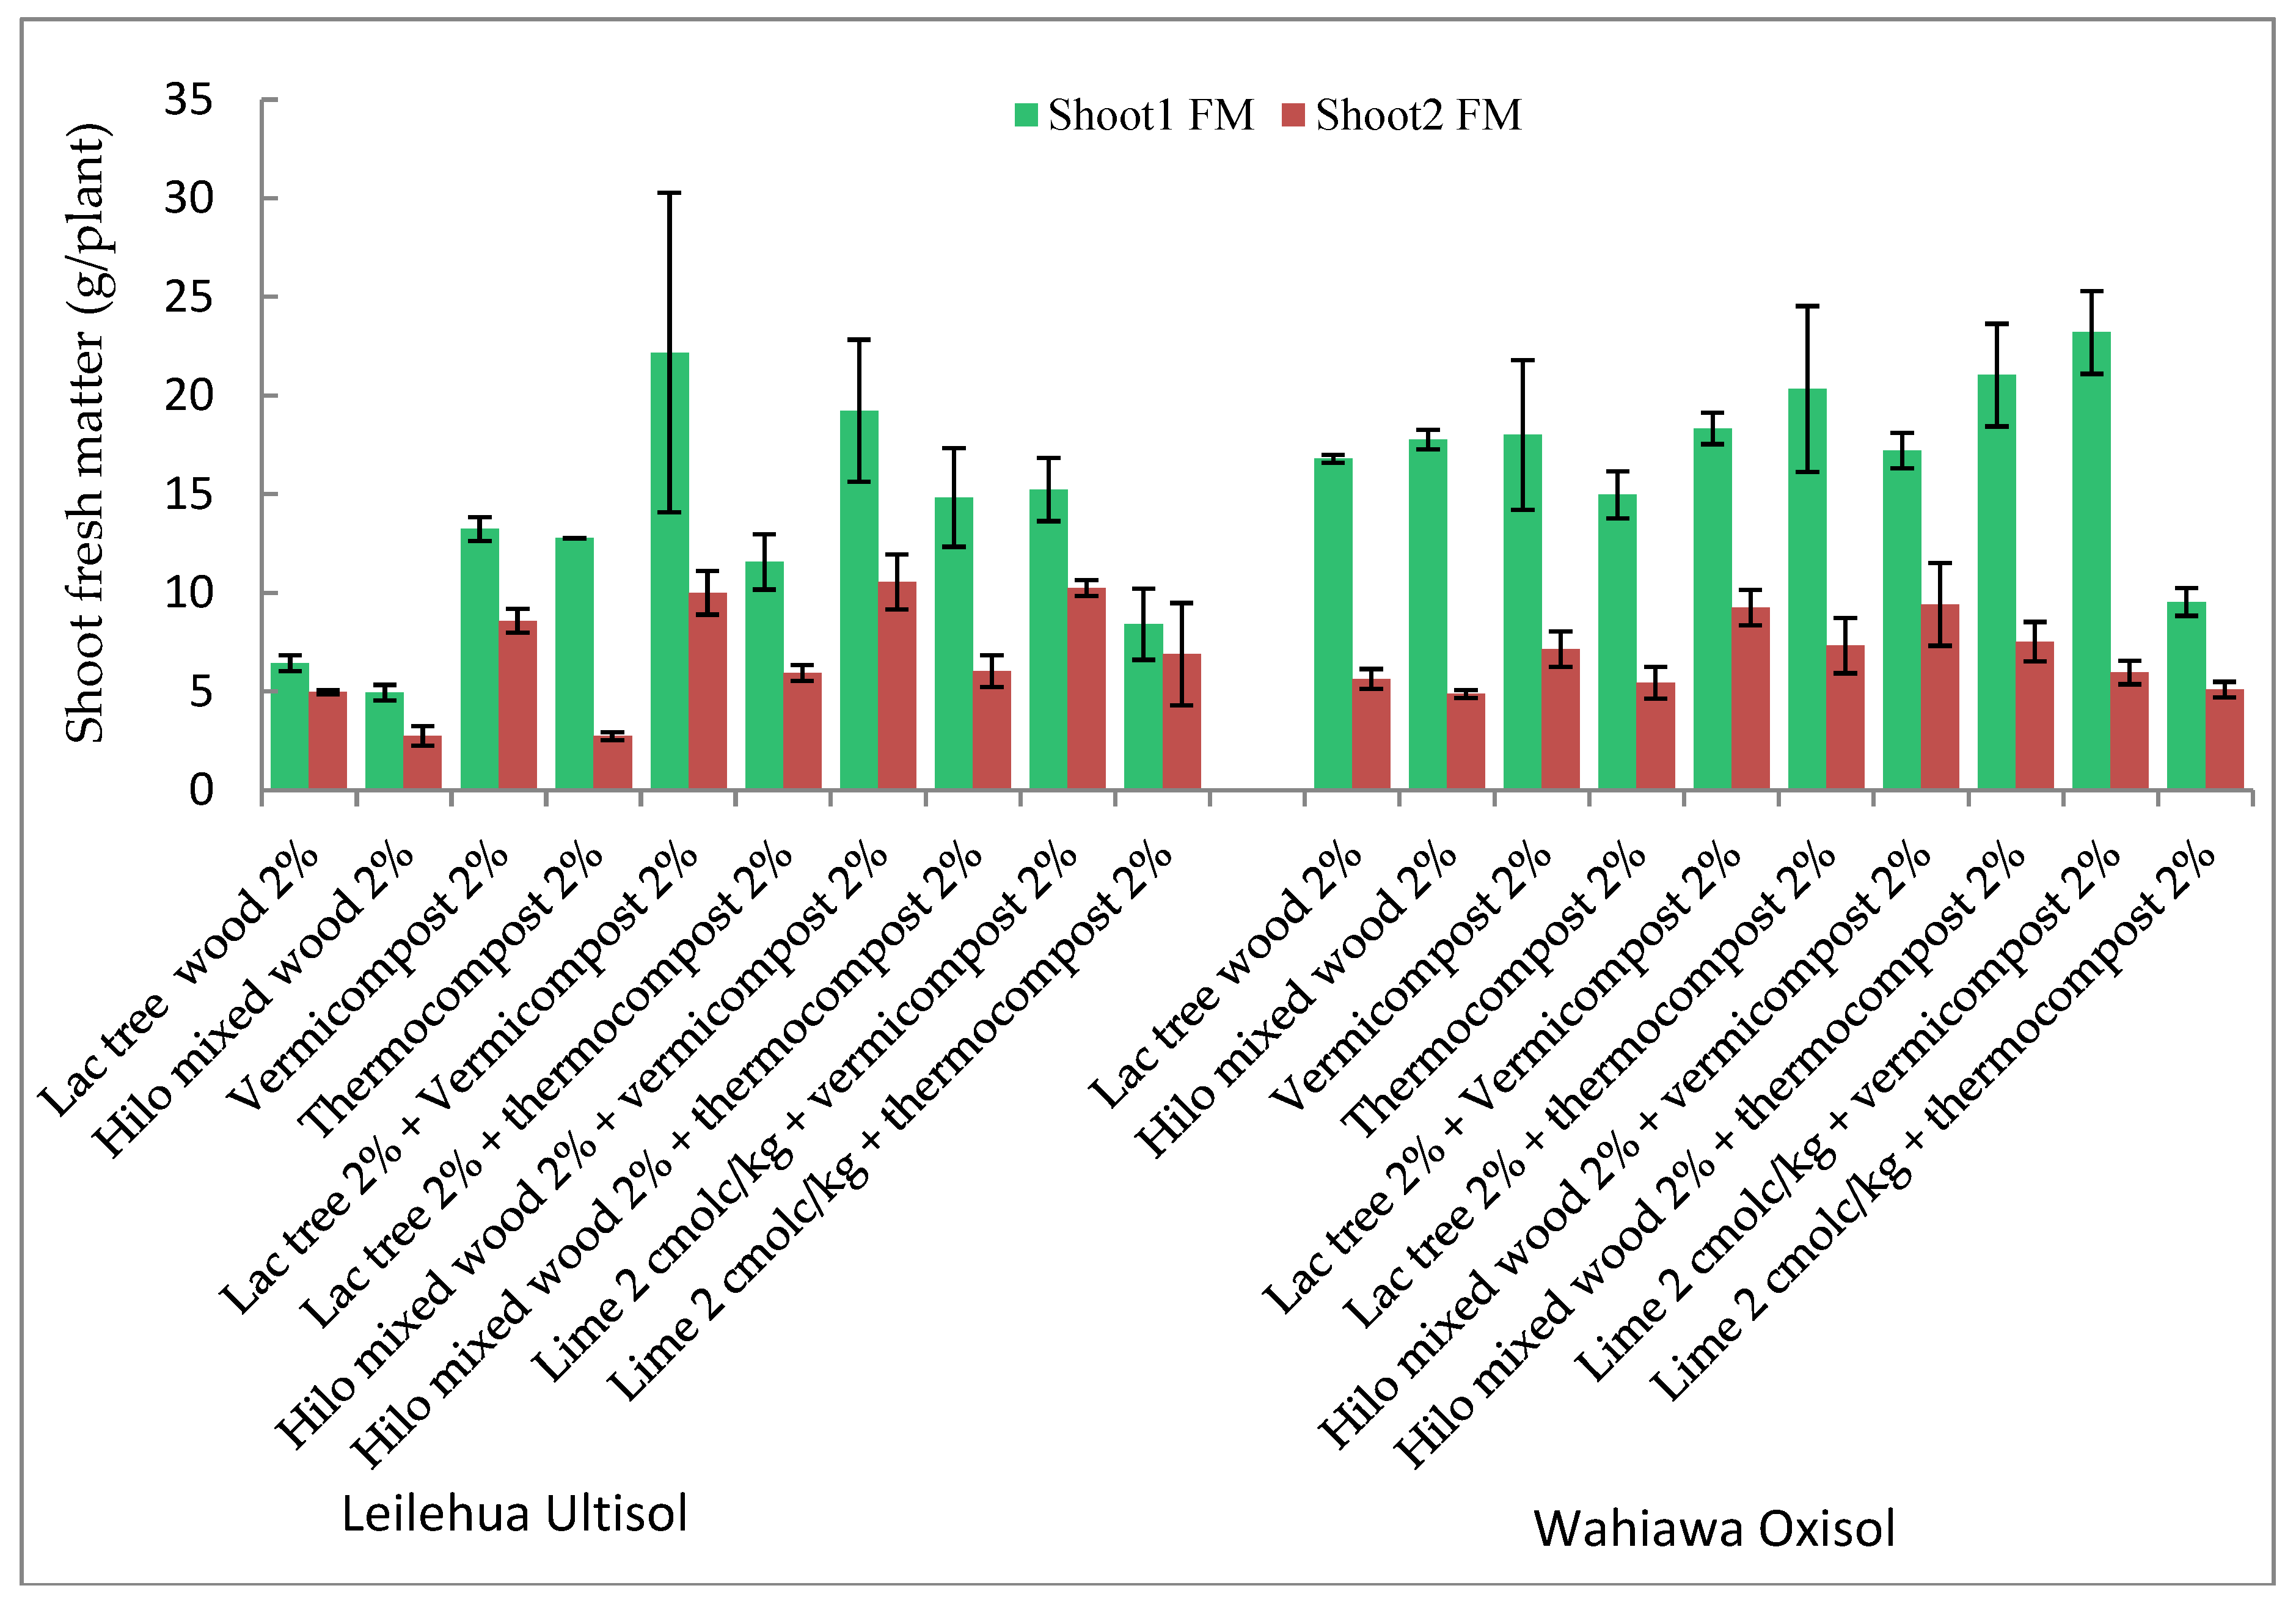
3.3. Plant Growth
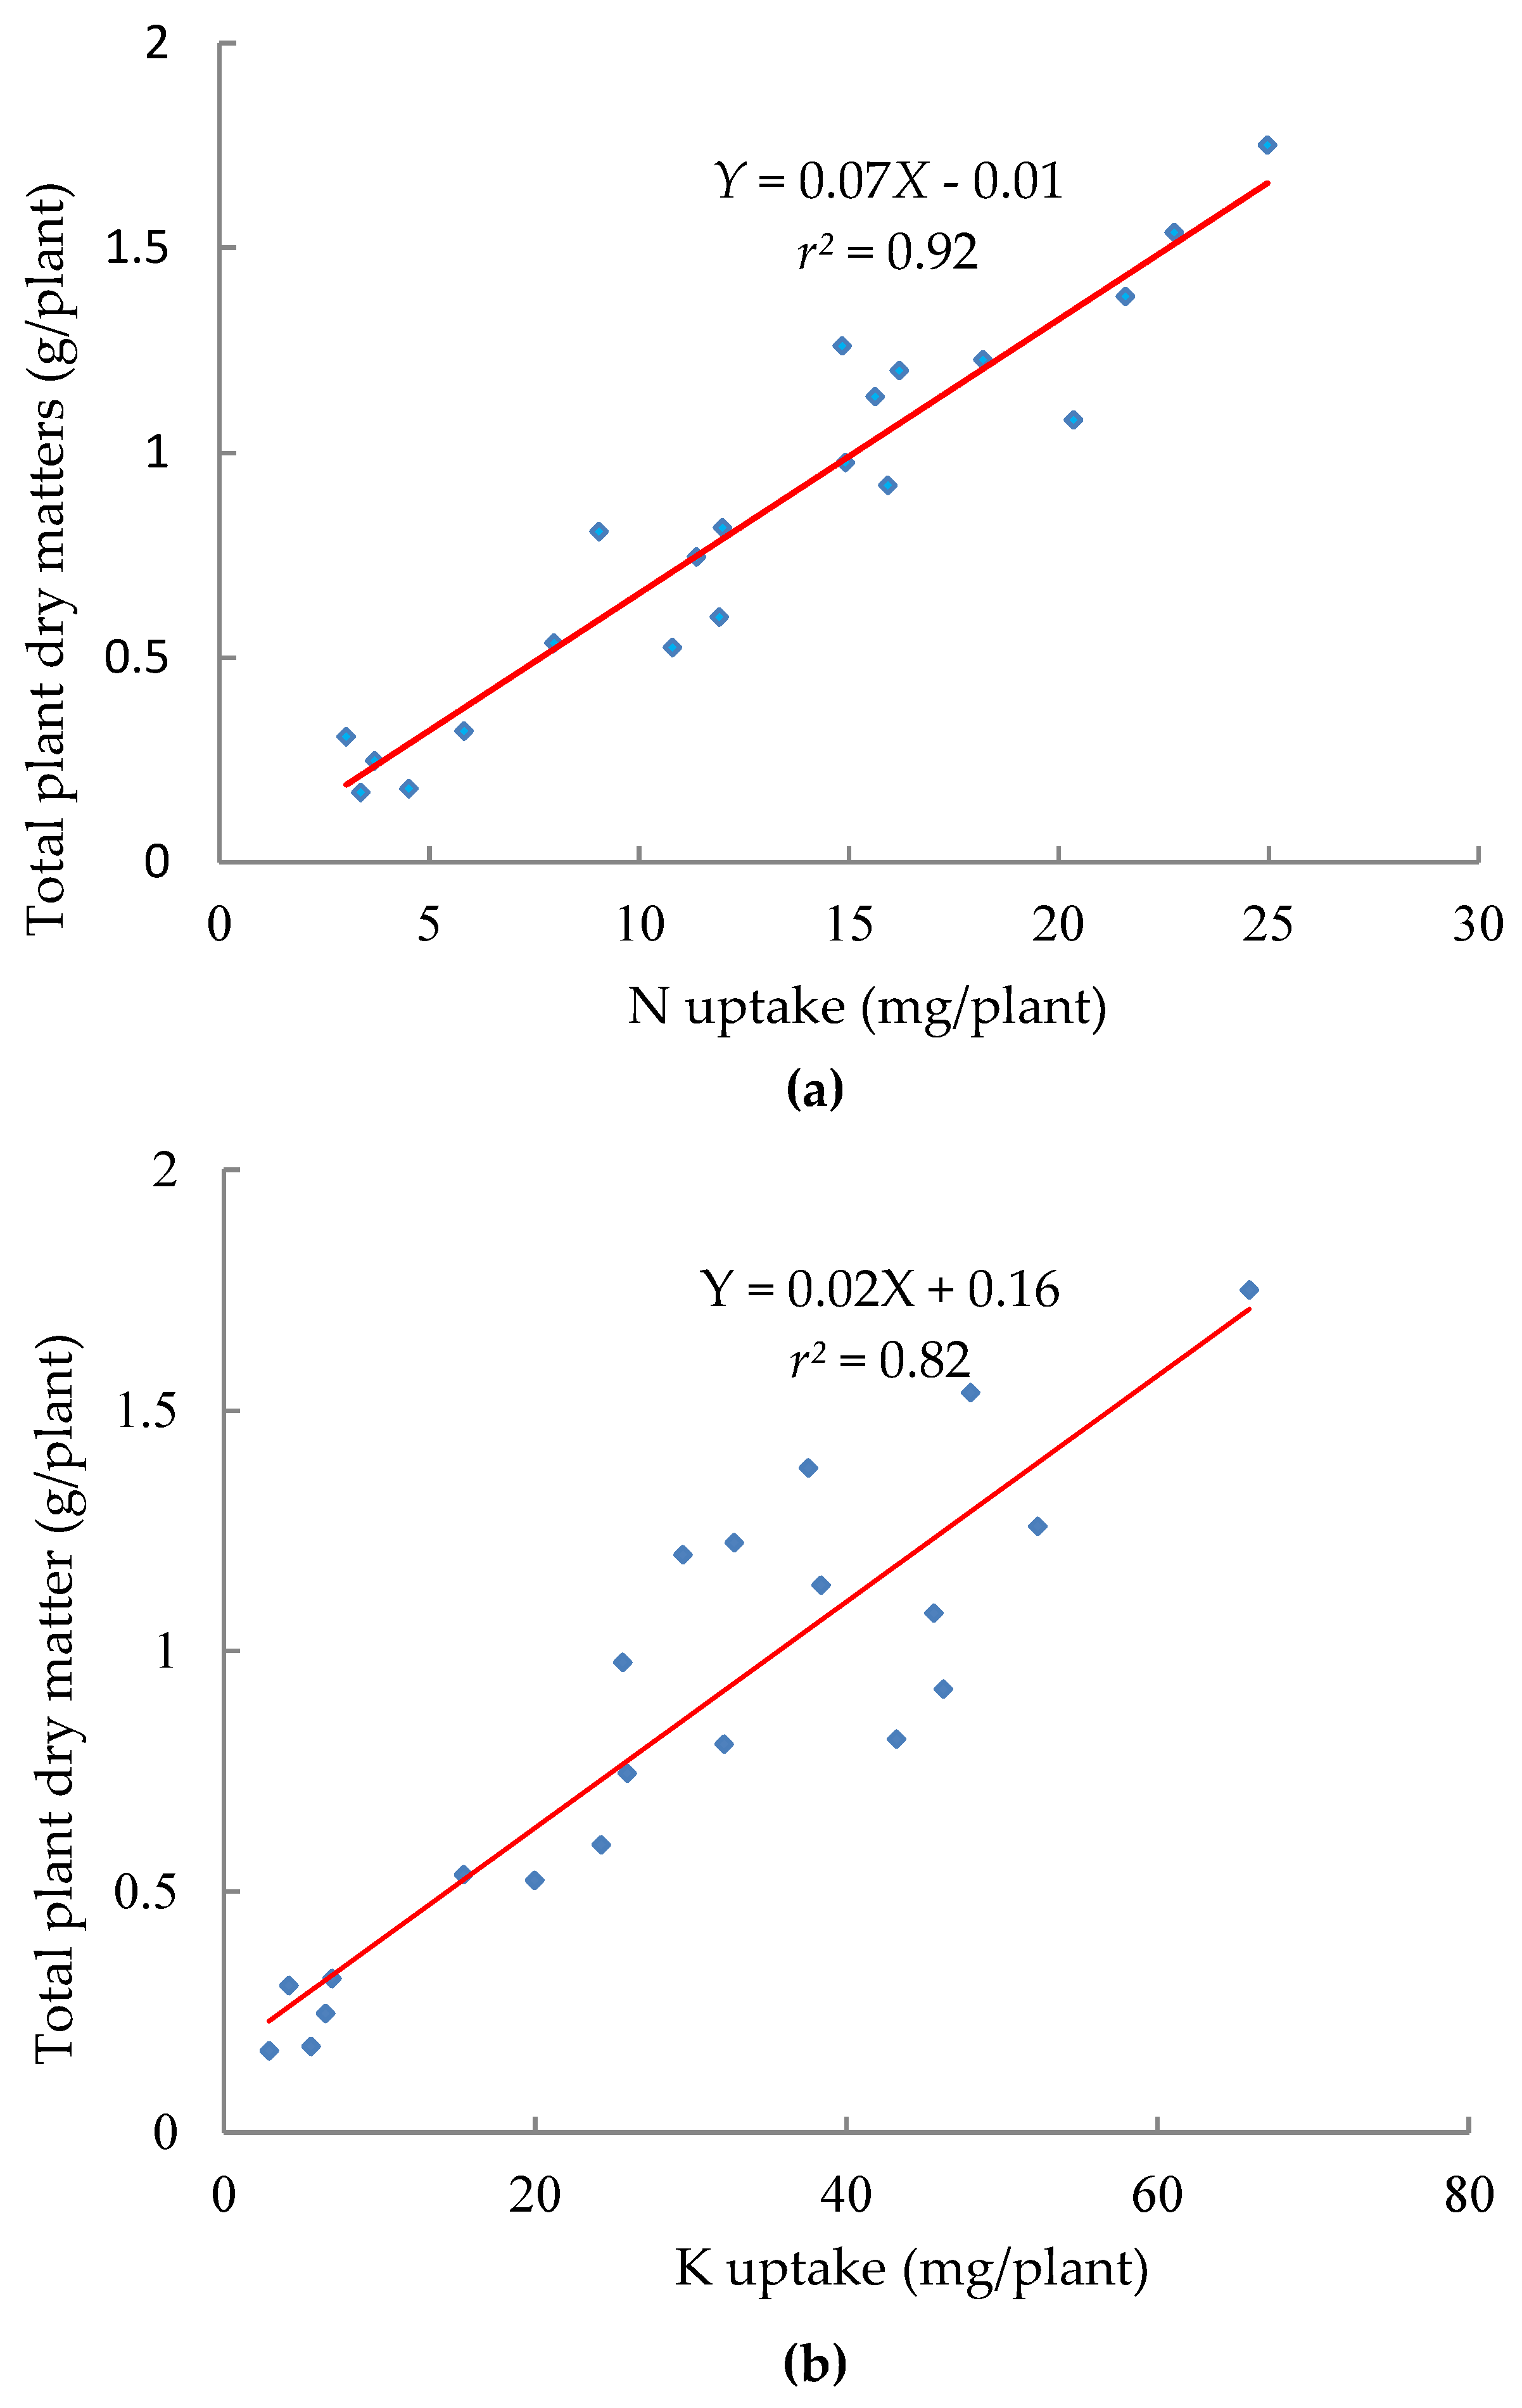
3.4. Plant Nutrients
4. Discussion
5. Conclusions
Author Contributions
Funding
Acknowledgments
Conflicts of Interest
References
- Van Meter, K.J.; Basu, N.B.; Veenstra, J.J.; Burras, C.L. The nitrogen legacy: Emerging evidence of nitrogen accumulation in anthropogenic landscapes. Environ. Res. Lett. 2016, 11, 1–12. [Google Scholar] [CrossRef]
- Zheng, H.; Wang, Z.; Deng, X.; Zhao, J.; Luo, Y.; Novak, J.; Herbert, S.; Xing, B. Characteristics and nutrient values of biochars produced from giant reed at different temperatures. Bioresour. Technol. 2013, 130, 463–471. [Google Scholar] [CrossRef] [PubMed]
- Liu, Z.; He, T.; Cao, T.; Yang, T.; Meng, J.; Chen, W. Effects of biochar application on nitrogen leaching, ammonia volatilization and nitrogen use efficiency in two distinct soils. J. Soil Sci. Plant Nutr. 2017, 17, 515–528. [Google Scholar] [CrossRef]
- Laird, D.A.; Fleming, P.; Wang, B.; Horton, R.; Karlen, D. Biochar impact on nutrient leaching from a Midwestern agricultural soil. Geoderma 2010, 158, 436–442. [Google Scholar] [CrossRef] [Green Version]
- Singh, B.P.; Hatton, B.J.; Singh, B.; Cowie, A.L.; Kathuria, A. Influence of biochars on nitrous oxide emission and nitrogen leaching from two contrasting soils. J. Environ. Qual. 2010, 39, 1224–1235. [Google Scholar] [CrossRef] [PubMed]
- Major, J.; Rondon, M.; Molina, D.; Riha, S.J.; Lehmann, J. Nutrient leaching in a Colombian savanna Oxisol amended with biochar. J. Environ. Qual. 2012, 41, 1076–1086. [Google Scholar] [CrossRef] [PubMed]
- Ventura, M.; Sorrenti, G.; Panzacchi, P.; George, E.; Tonon, G. Biochar reduces short-term nitrate leaching from A horizon in an Apple Orchard. J. Environ. Qual. 2013, 42, 76–82. [Google Scholar] [CrossRef] [PubMed]
- Liu, L.; Shen, G.; Sun, M.; Cao, X.; Shang, G.; Chen, P. Effect of biochar on nitrous oxide emission and its potential mechanisms. J. Air Waste Manage. 2014, 64, 894–902. [Google Scholar] [CrossRef] [Green Version]
- Bai, S.H.; Reverchon, F.; Xu, C.-Y.; Xu, Z.; Blumfield, T.J.; Zhao, H.; Van Zwieten, L.; Wallace, H.M. Wood biochar increases nitrogen retention in field settings mainly through abiotic processes. Soil Biol. Biochem. 2015, 90, 232–240. [Google Scholar] [CrossRef]
- Haider, G.; Steffens, D.; Moser, G.; Müller, C.; Kammann, C.I. Biochar reduced nitrate leaching and improved soil moisture content without yield improvements in a four-year field study. Agric. Ecosyst. Environ. 2017, 237, 80–94. [Google Scholar] [CrossRef]
- Novak, J.M.; Lima, I.; Xing, B.; Gaskin, J.M.; Steiner, C.; Das, K.C.; Ahmedna, A.M.; Rehrah, D.; Watts, D.W.; Busscher, W.J.; Schomberg, H. Characterization of designer biochar produced at different temperatures and their effects on a loamy sand. Ann. Environ. Sci. 2009, 3, 195–206. [Google Scholar]
- Laird, D.A.; Fleming, P.D.; Davis, D.D.; Horton, R.; Wang, B.; Karlen, D.L. Impact of biochar amendments on the quality of a typical Midwestern agricultural soil. Geoderma 2010, 158, 443–449. [Google Scholar] [CrossRef] [Green Version]
- Yuan, J.H.; Xu, R.K. The amelioration effects of low temperature biochar generated from nine crop residues on an acidic Ultisol. Soil Use Manage. 2011, 27, 110–115. [Google Scholar] [CrossRef]
- Hossain, M.K.; Strezov, V.; Chan, K.Y.; Nelson, P.F. Agronomic properties of wastewater sludge biochar and bioavailability of metals in production of cherry tomato (Lycopersicon esculentum). Chemosphere 2010, 78, 1167–1171. [Google Scholar] [CrossRef] [PubMed]
- Silber, A.; Levkovitch, I.; Graber, E.R. pH-dependent mineral release and surface properties of corn straw biochar: Agronomic implications. Environ. Sci. Technol. 2010, 44, 9318–9323. [Google Scholar] [CrossRef] [PubMed]
- Graber, E.R.; Meller-Harel, Y.; Kolton, M.; Cytryn, E.; Silber, A.; David, D.R.; Tsechansky, L.; Borenshtein, M.; Elad, Y. Biochar impact on development and productivity of pepper and tomato grown in fertigated soilless media. Plant Soil 2010, 337, 481–496. [Google Scholar] [CrossRef]
- Kolton, M.; Harel, Y.M.; Pasternak, Z.; Graber, E.R.; Elad, Y.; Cytryn, E. Impact of biochar application to soil on the root-associated bacterial community structure of fully developed greenhouse pepper plants. Appl. Environ. Microbiol. 2011, 77, 4924–4930. [Google Scholar] [CrossRef] [PubMed]
- Jeffery, S.; Abalos, D.; Prodana, M.; Bastos, A.; van Groenigen, J.W.; Hungate, B.; Verheijen, F. Biochar boosts tropical but not temperate crop yields. Environ. Res. Lett. 2017, 12, 5. [Google Scholar] [CrossRef]
- Pandit, N.R.; Mulder, J.; Hale, S.E.; Martinsen, V.; Schmidt, H.P.; Cornelissen, G. Biochar improves maize growth by alleviation of nutrient stress in a moderately acidic low-input Nepalese soil. Sci. Tot. Environ. 2018, 625, 1380–1389. [Google Scholar] [CrossRef] [PubMed]
- Sigua, G.C.; Stone, K.C.; Hunt, P.G.; Cantrell, K.B.; Novak, J.M. Increasing biomass of winter wheat using sorghum biochars. Agron. Sustain. Dev. 2014, 35, 739–748. [Google Scholar] [CrossRef] [Green Version]
- Conte, P.; Laudicina, V.A. Mechanisms of organic coating on the surface of a poplar biochar. Curr. Org. Chem. 2017, 21, 559–565. [Google Scholar] [CrossRef]
- Wang, Z.; Guo, H.; Shen, F.; Yang, G.; Zhang, Y.; Zeng, Y.; Wang, L.; Xiao, H.; Deng, S. Biochar produced from oak sawdust by Lanthanum (La)-involved pyrolysis for adsorption of ammonium (NH4+), nitrate (NO3-), and phosphate (PO43-). Chemosphere 2015, 119, 646–653. [Google Scholar] [CrossRef] [PubMed]
- Saleh, M.E.; Mahmoud, A.H.; Rashad, M. Peanut biochar as a stable adsorbent for removing NH4-N from wastewater: A preliminary study. Adv. Environ. Biol. 2012, 6, 2170–2176. [Google Scholar]
- Deenik, J.L.; McClellan, M.; Uehara, G.; Antal, M.J.; Campbell, S. Charcoal volatile matter content influences plant growth and soil nitrogen transformations. Soil Sci. Soc. Am. J. 2010, 74, 1259–1270. [Google Scholar] [CrossRef]
- Xu, G.; Sun, J.; Shao, H.B.; Chang, S.X. Biochar had effects on phosphorus sorption and desorption in three soils with differing acidity. Ecol. Eng. 2014, 62, 54–60. [Google Scholar] [CrossRef] [Green Version]
- Boehm, H.P. Some aspects of surface chemistry of carbon blacks and other carbons. Carbon 1994, 32, 759–769. [Google Scholar] [CrossRef]
- Rutherford, D.W.; Wershaw, R.L.; Reeves, J.B., III. Development of acid functional groups and lactones during the thermal degradation of wood and wood components. US Geol. Surv. Sci. Investig. Rep. 2008, 43. [Google Scholar] [CrossRef]
- Mehlich, A. Mehlich III soil test extractant: A modification of the Mehlich II extractant. Commun. Soil Sci. Plant Anal. 1984, 15, 1409–1416. [Google Scholar] [CrossRef]
- Smider, B.; Singh, B. Agronomic performance of a high ash biochar in two contrasting soils. Agric. Ecosyst. Environ. 2014, 191, 99–107. [Google Scholar] [CrossRef]
- Berek, A.K.; Hue, N.V. Characterization of biochars and their use as an amendment to acid soils. Soil Sci. 2016, 181, 412–426. [Google Scholar] [CrossRef]
- Hass, A.; Gonzalez, J.M.; Lima, I.M.; Godwin, H.W.; Halvorson, J.J.; Boyer, D.G. Chicken manure biochar as liming and nutrient spurce for acid Appalachian soil. J. Environ. Qual. 2012, 41, 1096–1106. [Google Scholar] [CrossRef] [PubMed]
- Mukome, F.N.D.; Zhang, X.; Silva, L.C.R.; Six, J.; Parikh, S.J. Use of chemical and physical characteristics to investigate trends in biochar feedstocks. J. Agric. Food Chem. 2013, 61, 2196–2204. [Google Scholar] [CrossRef] [PubMed]
- Yuan, J.H.; Xu, R.K.; Zhang, H. The forms of alkalis in the biochar produced from crop residues at different temperatures. Bioresour. Technol. 2011, 102, 3488–3497. [Google Scholar] [CrossRef] [PubMed]
- Fidel, R.B.; Laird, D.A.; Thompson, M.L.; Lawarinenko, M. Characterization and quantification of biochar alkalinity. Chemosphere 2017, 167, 367–373. [Google Scholar] [CrossRef] [PubMed]
- Chintala, R.; Mollinedo, J.; Schumacher, T.E.; Malo, D.D.; Julson, J.L. Effect of biochars on chemical properties of acidic soil. Arch. Agron. Soil Sci. 2013, 60, 1–12. [Google Scholar] [CrossRef]
- Ahmad, A.; Hue, N.; Radovich, T. Nitrogen release patterns of some locally made composts and their effects on the growth of Chinese cabbage (Brassica rapa, Chinensis group) when used as soil amendments. Compost Sci. Util. 2014, 22, 199–206. [Google Scholar] [CrossRef]
- Hue, N.V. Alleviating soil acidity with crop residues. Soil Sci. 2011, 176, 543–549. [Google Scholar] [CrossRef]
- Andrenelli, M.C.; Maienza, A.; Genesio, L.; Miglietta, F.; Pellegrini, S.; Vaccari, F.P.; Vignozzi, N. Field application of pelletized biochar: Short term effect on the hydrological properties of a silty clay loam soil. Agric. Water Manag. 2016, 163, 190–196. [Google Scholar] [CrossRef]
- Agegnehu, G.; Srivastava, A.K.; Bird, M.I. The role of biochar and biochar-compost in improving soil quality and crop performance: A review. Appl. Soil Ecol. 2017, 119, 156–170. [Google Scholar] [CrossRef]
- Hagemann, N.; Joseph, S.; Schmidt, H.-P.; Kammann, C.I.; Harter, J.; Borch, T.; Young, R.B.; Varga, K.; Taherymoosavi, S.; Elliot, K.W.; et al. Organic coating on biochar explains its nutrient retention and stimulation of soil fertility. Nat. Cummun. 2017, 8, 1–11. [Google Scholar] [CrossRef] [PubMed]
- Agegnehu, G.; Nelson, P.N.; Bird, M.I. The effects of biochar, compost and their mixture and nitrogen fertilizer on yield and nitrogen use efficiency of barley grown on a Nitisol in the highlands of Ethiopia. Sci. Total Environ. 2016, 569–570, 869–879. [Google Scholar] [CrossRef] [PubMed]
- Uchida, R. Recommended plant tissue nutrient levels for some vegetable, fruit, and ornamental foliage and flowering plants in Hawai’i. In Plant Nutrient Management in Hawai’i’s Soils, Approaches for Tropical and Subtropical Agriculture; Silva, J.A., Uchida, R., Eds.; CTAHR: Honolulu, HI, USA, 2010; pp. 57–65. [Google Scholar]


| Selected Properties | Leilehua Ultisol | Wahiawa Oxisol | Lac Tree Wood Biochar | Hilo Mixed Wood Biochar | Vermicompost | Thermocompost |
|---|---|---|---|---|---|---|
| pH (H2O) | 4.5 | 5.6 | 9.2 | 9.5 | 7.2 | 8.3 |
| EC (dS/m) | 0.08 ± 0.00 | 0.13 ± 0.00 | 1.93 ± 0.01 | 2.42 ± 0.01 | 2.28 ± 0.03 | 3.23 ± 0.02 |
| CEC (cmol+/kg) | 16.8 ± 0.45 | 12.1 ± 0.23 | 18.0 ± 1.75 | 14.7 ± 0.20 | 44.8 ± 3.50 | 44.5 ± 1.00 |
| Total N (%) | 0.21 ± 0.00 | 0.15 ± 0.00 | 0.40 ± 0.02 | 0.50 ± 0.09 | 1.42 ± 00.0 | 1.90 ± 0.00 |
| Mehlich-3 extractable P (mg/kg) | 1.95 ± 0.03 | 51.52 ± 0.08 | 0.06 ± 0.00 | 0.09 ± 0.00 | 1.48 ± 0.00 | 0.17 ± 0.01 |
| Mehlich-3 extractable K (mg/kg) | 49.15 ± 0.53 | 140.70 ± 1.08 | 0.33 ± 0.00 | 0.47 ± 0.00 | 0.04 ± 0.00 | 1.37 ± 0.01 |
| Mehlich-3 extractable Ca (mg/kg) | 111.84 ± 5.09 | 715.88 ± 5.68 | 3.13 ± 0.00 | 1.6 ± 0.01 | 2.11 ± 0.67 | 2.39 ± 0.05 |
| Mehlich-3 extractable Mg (mg/kg) | 53.93 ± 1.06 | 232.60 ± 0.07 | 0.13 ± 0.00 | 0.22 ± 0.00 | 0.36 ± 0.00 | 0.36 ± 0.00 |
| Mehlich-3 extractable Fe (mg/kg) | 98.14 ± 1.41 | 63.95 ± 0.59 | 684 ± 0.00 | 12,259.5 ± 233.65 | 2407.90 ± 30.94 | 8345.20 ± 103.11 |
| Mehlich-3 extractable Mn (mg/kg) | 11.41 ± 0.05 | 805.80 ± 5.35 | 55 ± 0.00 | 153.8 ± 2.32 | 606.00 ± 0.68 | 239.20 ± 1.23 |
| Exchangeable Al (cmolc+/kg) | 2.16 ± 0.02 | 0.17 ± 0.01 | - | - | - | - |
| Total functional groups (mmol/g) | - | - | 0.38 ± 0.02 | 0.58 ± 0.03 | - | - |
| Carboxylic functional group (mmol/g) | - | - | 0.12 ± 0.02 | 0.22 ± 0.02 | - | - |
| Phenolic functional groups (mmol/g) | - | - | 0.20 ± 0.04 | 0.27 ± 0.03 | - | - |
| Lactonic functional group (mmol/g) | - | - | 0.07 ± 0.02 | 0.10 ± 0.03 | - | - |
| Mean Comparisons | pH 2 | pH 7 | EC 2 | EC 7 | P 2 | P 7 | K 2 | K 7 | Ca 2 | Ca 7 | Mg 2 | Mg 7 | Fe 2 | Fe 7 | Mn 2 | Mn 7 |
|---|---|---|---|---|---|---|---|---|---|---|---|---|---|---|---|---|
| Leilehua Ultisol | ||||||||||||||||
| Control vs. Amended soil | ** | ** | ** | ** | * | * | ** | ** | ** | ** | * | * | ns | ns | * | * |
| B + C vs. L + C | ns | ns | ns | ns | ns | ns | * | * | ns | ns | * | * | ns | ns | ns | ns |
| B + C vs. B | * | * | * | ns | ** | ** | * | * | ** | ** | ** | ** | ns | ns | * | * |
| B + C vs. C | * | * | ns | ns | ns | ns | * | * | ns | ns | ns | ns | ns | ns | ns | ns |
| L + C vs. C | * | ns | ns | ns | ns | ns | ns | ns | * | * | ns | * | ns | ns | ns | ns |
| B vs. C | ns | ns | * | ns | ** | ** | ** | ** | ** | ** | ** | ** | ns | ns | ** | ** |
| S vs. H | * | * | ns | ns | ns | ns | * | * | ** | ** | ns | ns | ns | ns | ns | ns |
| V vs. T | * | * | * | * | ** | ** | ** | ** | ** | ** | * | * | ns | ns | ns | ns |
| Wahiawa Oxisol | ||||||||||||||||
| Control vs. Amended soil | ** | ** | ** | ** | * | * | ns | ns | ** | ** | * | * | ns | ns | * | * |
| B + C vs. L + C | ns | ns | ns | ns | ns | ns | * | * | ns | ns | ns | ns | ns | ns | * | * |
| B + C vs. B | * | * | * | * | ** | ** | ** | ** | ** | ** | ** | ** | ns | ns | ns | ns |
| B + C vs. C | * | * | ns | ns | ns | ns | * | * | ns | ns | ns | ns | ns | ns | ns | ns |
| L + C vs. C | ** | ** | ns | ns | ns | ns | * | * | * | * | ns | ns | ns | ns | ns | * |
| B vs. C | * | * | * | * | ** | ** | ** | ** | ** | ** | * | * | ns | ns | ns | ns |
| S vs. H | * | * | ns | ns | ns | ns | ** | ** | ** | ** | ns | ns | ns | ns | ns | ns |
| V vs. T | * | * | ns | ns | ** | ** | ** | ** | ** | ** | ns | ns | ns | ns | ns | ns |
| Treatment | pH 2 | pH 7 | EC 2 | EC 7 |
|---|---|---|---|---|
| dS/m | ||||
| Ultisol soil | ||||
| Control (un-amended soil) | 4.6 c | 4.6 c | 0.09 d | 0.09 c |
| Lac tree wood biochar 2% | 5.8 a | 5.8 a | 0.20 c | 0.26 b |
| Hilo mixed wood biochar 2% | 4.8 c | 4.8 c | 0.22 c | 0.25 b |
| Vermicompost 2% | 5.7 ab | 6.3 a | 0.51 a | 0.38 a |
| Thermocompost 2% | 5.1 b | 5.5 b | 0.39 b | 0.27 b |
| Lac tree wood biochar 2% + Vermicompost 2% | 5.9 a | 6.5 a | 0.51 a | 0.38 a |
| Lac tree wood biochar 2% + thermocompost 2% | 5.8 a | 6.1 ab | 0.43 b | 0.29 b |
| Hilo mixed wood biochar 2% + vermicompost 2% | 5.8 a | 6.5 a | 0.55 a | 0.36 a |
| Hilo mixed wood biochar 2% + thermocompost 2% | 5.4 b | 5.8 b | 0.46 b | 0.29 b |
| Lime 2 cmolc+/kg + Vermicompost 2% | 6.1 a | 6.6 a | 0.50 a | 0.38 a |
| Lime 2 cmolc+/kg + thermocompost 2% | 5.6 ab | 6.1 ab | 0.47 b | 0.25 b |
| Oxisol soil | ||||
| Control (un-amended soil) | 5.7 d | 5.8 d | 0.14 d | 0.14 c |
| Lac tree wood biochar 2% | 6.5 b | 6.6 b | 0.27 c | 0.34 b |
| Hilo mixed wood biochar 2% | 6.0 c | 6.0 c | 0.26 c | 0.35 b |
| Vermicompost 2% | 6.4 b | 6.9 a | 0.47 b | 0.42 a |
| Thermocompost 2% | 6.3 bc | 6.5 b | 0.47 b | 0.49 a |
| Lac tree wood biochar 2% + Vermicompost 2% | 6.8 a | 7.2 a | 0.43 b | 0.40 a |
| Lac tree wood biochar 2% + thermocompost 2% | 6.7 ab | 7.1 a | 0.46 b | 0.44 a |
| Hilo mixed wood biochar 2% + vermicompost 2% | 6.9 a | 7.2 a | 0.49 a | 0.44 a |
| Hilo mixed wood biochar 2% + thermocompost 2% | 6.3 b | 6.8 ab | 0.58 a | 0.44 a |
| Lime 2 cmolc+/kg + Vermicompost 2% | 7.1 a | 7.3 a | 0.45 b | 0.44 a |
| Lime 2 cmolc+/kg + thermocompost 2% | 6.8 a | 7.1 a | 0.52 a | 0.41 a |
| (a) | ||||||
| Treatments | P 2 | P 7 | K 2 | K 7 | Ca 2 | Ca 7 |
| mg/kg | ||||||
| Ultisol soil | ||||||
| Control (un-amended soil) | 1.9 b | 1.8 b | 5.2 b | 5.6 b | 151.3 b | 124.6 b |
| Lac tree wood biochar 2% | 0.8 b | 1.0 b | 25.5 a | 70.2 a | 816.9 a | 1112.7 a |
| Hilo mixed wood biochar 2% | 1.1 b | 0.9 b | 8.7 b | 48.2 b | 315.5 b | 411.3 b |
| Vermicompost 2% | 75.6 a | 133.4 a | 0.0 b | 0.0 b | 4038.5 a | 4408.9 a |
| Thermocompost 2% | 3.4 b | 4.1 b | 82.1 a | 204.2 a | 1044.9 b | 1076.5 b |
| Lac tree wood biochar 2% + Vermicompost 2% | 68.0 a | 146.2 a | 0.0 b | 63.2 b | 4166.5 a | 5021.0 a |
| Lac tree wood biochar 2% + thermocompost 2% | 3.1 b | 5.8 b | 140.7 a | 312.6 a | 1044.9 b | 2009.9 b |
| Hilo mixed wood biochar 2% + vermicompost 2% | 61.8 a | 125.4 a | 0.0 b | 50.0 b | 3548.6 a | 4615.8 a |
| Hilo mixed wood biochar 2% + thermocompost 2% | 3.7 b | 6.5 b | 114.8 a | 274.6 a | 1230.1 b | 1337.4 c |
| Lime 2 cmolc+/kg + Vermicompost 2% | 72.9 a | 128.5 a | 0.0 b | 0.0 c | 4171.2 a | 5004.5 a |
| Lime 2 cmolc+/kg + thermocompost 2% | 2.3 b | 5.5 b | 93.7 a | 209.4 a | 1529.1 b | 1899.6 bc |
| Oxisol soil | ||||||
| Control (un-amended soil) | 53.5 b | 50.4 b | 145.2 b | 130.4 b | 721.3 c | 652.1 d |
| Lac tree wood biochar 2% | 37.7 b | 40.2 b | 106.3 b | 136.5 b | 1514.4 b | 1695.1 a |
| Hilo mixed wood biochar 2% | 35.8 b | 36.7 b | 64.3 b | 119.9 b | 864.2 c | 939.3 d |
| Vermicompost 2% | 285.1 a | 365.4 a | 65.6 b | 117.4 b | 4367.9 a | 4609.8 a |
| Thermocompost 2% | 56.8 b | 68.8 b | 241.5 a | 356.2 a | 1556.4 b | 1962.2 c |
| Lac tree wood biochar 2% + Vermicompost 2% | 327.4 a | 341.6 a | 73.9 b | 162.5 b | 4869.6 a | 5504.8 a |
| Lac tree wood biochar 2% + thermocompost 2% | 60.5 b | 68.8 b | 313.9 a | 406.7 a | 2528.5 ab | 2770.6 c |
| Hilo mixed wood biochar 2% + vermicompost 2% | 270.9 a | 367.9 a | 93.6 b | 174.7 b | 4178.1 a | 4682.6 b |
| Hilo mixed wood biochar 2% + thermocompost 2% | 64.6 b | 70.2 b | 271.6 a | 419.3 a | 1708.2 b | 1896.0 c |
| Lime 2 cmolc+/kg + Vermicompost 2% | 295.6 a | 353.0 a | 52.9 b | 76.1 c | 4738.2 a | 5512.5 a |
| Lime 2 cmolc+/kg + thermocompost 2% | 57.5 b | 32.7 b | 186.5 ab | 304.7 ab | 2138.3 ab | 2608.4 c |
| (b) | ||||||
| Treatment | Mg 2 | Mg 7 | Fe 2 | Fe 7 | Mn 2 | Mn 7 |
| mg/kg | ||||||
| Ultisol soil | ||||||
| Control (un-amended soil) | 57.3 c | 42.7 c | 99.8 a | 96.5 a | 11.7 c | 11.4 c |
| Lac tree wood biochar 2% | 136.2 b | 92.5 c | 106.1 a | 109.2 a | 8.1 c | 8.1 c |
| Hilo mixed wood biochar 2% | 134.6 b | 70.9 c | 103.9 a | 103.9 a | 7.7 c | 8.8 c |
| Vermicompost 2% | 211.1 a | 185.8 b | 108.9 a | 97.4 a | 24.0 a | 19.6 a |
| Thermocompost 2% | 211.9 a | 156.1 bc | 115.7 a | 103.6 a | 18.8 b | 14.6 b |
| Lac tree wood biochar 2% + Vermicompost 2% | 183.1 ab | 209.5 ab | 113.0 a | 115.1 a | 23.1 a | 20.3 a |
| Lac tree wood biochar 2% + thermocompost 2% | 209.9 ab | 183.9 bc | 109.3 a | 118.6 a | 24.9 a | 14.7 b |
| Hilo mixed wood biochar 2% + vermicompost 2% | 195.6 ab | 192.4 ab | 105.9 a | 111.3 a | 26.9 a | 18.4 ab |
| Hilo mixed wood biochar 2% + thermocompost 2% | 198.4 ab | 168.9 b | 122.4 a | 117.2 a | 24.2 a | 14.4 b |
| Lime 2 cmolc+/kg + Vermicompost 2% | 240.0 a | 248.0 a | 99.0 a | 99.0 a | 23.0 a | 18.4 ab |
| Lime 2 cmolc+/kg + thermocompost 2% | 230.6 a | 232.0 a | 101.0 a | 103.5 a | 16.9 b | 14.4 b |
| Oxisol soil | ||||||
| Control (un-amended soil) | 214.1 c | 230.7 c | 63.5 a | 51.9 b | 815.4 a | 741.1 a |
| Lac tree wood biochar 2% | 284.6 c | 250.8 c | 47.3 b | 40.9 c | 517.2 c | 428.7 c |
| Hilo mixed wood biochar 2% | 266.2 c | 232.1 c | 47.0 b | 46.4 c | 526.3 c | 506.1 b |
| Vermicompost 2% | 351.6 b | 358.3 a | 43.4 b | 39.2 c | 422.7 c | 336.3 d |
| Thermocompost 2% | 343.9 b | 357.5 a | 54.6 a | 45.9 c | 526.3 c | 449.0 c |
| Lac tree wood biochar 2% + Vermicompost 2% | 369.1 b | 365.3 b | 44.8 b | 40.5 c | 419.3 c | 360.9 d |
| Lac tree wood biochar 2% + thermocompost 2% | 401.1 a | 353.8 b | 60.8 a | 47.3 c | 634.0 b | 481.6 bc |
| Hilo mixed wood biochar 2% + vermicompost 2% | 335.2 b | 361.5 b | 49.0 b | 41.6 c | 464.0 c | 425.9 c |
| Hilo mixed wood biochar 2% + thermocompost 2% | 350.0 b | 342.0 b | 58.5 a | 54.9 b | 593.4 b | 557.1 b |
| Lime 2 cmolc+/kg + Vermicompost 2% | 422.0 a | 406.8 a | 47.1 b | 48.1 b | 467.4 c | 415.2 c |
| Lime 2 cmolc+/kg + thermocompost 2% | 391.4 ab | 402.8 a | 59.9 a | 73.2 a | 611.4 b | 636.6 b |
| Mean Comparison | N 1st | N 2nd | P 1st | P 2nd | K 1st | K 2nd | Ca 1st | Ca 2nd | Mg 1st | Mg 2nd | Fe 1st | Fe 2nd | Mn 1st | Mn 2nd |
|---|---|---|---|---|---|---|---|---|---|---|---|---|---|---|
| Leilehua Ultisol | ||||||||||||||
| B + C vs. L + C | ns | ns | ns | ns | ns | ns | ns | ns | * | ns | ns | ns | ns | ns |
| B + C vs. B | ns | ns | ** | * | ns | ns | * | * | ns | ns | * | ns | * | ns |
| B + C vs. C | ns | ns | * | ns | ns | ns | ns | * | ns | ns | ns | ns | ns | ns |
| L + C vs. C | ns | ns | * | ns | ns | * | ns | ns | ns | ns | ns | ns | * | ns |
| B vs. C | ns | ns | * | * | ns | ns | ns | ns | ns | ns | ns | ns | * | ns |
| S vs. H | ns | ns | * | * | ns | * | ns | ns | ns | ns | ns | ns | * | ns |
| V vs. T | * | ns | * | * | ns | ns | ns | ns | ns | ns | ns | ns | ns | ns |
| Wahiawa Oxisol | ||||||||||||||
| B + C vs. L + C | ns | ns | ns | ns | ns | ns | ns | ns | ns | ns | ns | ns | ns | ns |
| B + C vs. B | ns | ns | * | ns | ns | ns | ns | ns | ns | * | ns | ns | ns | ns |
| B + C vs. C | ns | ns | * | * | ns | ns | ns | ns | ns | ns | ns | ns | ns | ns |
| L + C vs. C | ns | ns | * | * | * | * | * | ns | * | ns | ns | ns | ns | ns |
| B vs. C | ns | ns | ns | * | ns | ns | ns | ns | ns | ns | ns | ns | ns | ns |
| S vs. H | ns | ns | ns | * | ns | ns | ns | ns | ns | ns | * | ns | ns | ns |
| V vs. T | ns | ns | ns | ns | ns | ns | ns | ns | * | ns | ns | ** | ns | ns |
| (a) | |||||||||||||||
| Treatments | N | P | K | ||||||||||||
| 1st planting | 2nd planting | 1st planting | 2nd planting | 1st planting | 2nd planting | ||||||||||
| % | |||||||||||||||
| Leilehua Ultisol | |||||||||||||||
| Lac tree wood biochar 2% | 1.15 ab | 1.75 a | 0.25 e | 0.20 de | 3.65 abc | 3.50 abc | |||||||||
| Hilo mixed wood biochar 2% | 1.65 ab | 1.50 a | 0.30 de | 0.05 e | 2.50 bc | 1.55 d | |||||||||
| Vermicompost 2% | 1.00 b | 1.50 a | 0.35 cde | 0.60 ab | 3.05 bc | 2.65 cd | |||||||||
| Thermocompost 2% | 1.85 a | 1.65 a | 0.65 ab | 0.10 de | 2.65 bc | 2.40 cd | |||||||||
| Lac tree wood 2% + vermicompost 2% | 1.30 ab | 1.75 a | 0.55 abcd | 0.45 bc | 2.90 bc | 3.45 abc | |||||||||
| Lac tree wood 2% + thermocompost 2% | 1.15 ab | 1.60 a | 0.60 abc | 0.20 de | 3.60 abc | 4.25 ab | |||||||||
| Hilo mixed wood 2% + vermicompost 2% | 1.65 ab | 1.40 a | 0.80 a | 0.60 ab | 2.85 bc | 3.15 bc | |||||||||
| Hilo mixed wood 2% + thermocompost 2% | 1.05 b | 1.80 a | 0.50 bcde | 0.20 de | 3.85 ab | 3.45 abc | |||||||||
| Lime 2 cmol+/kg + vermicompost 2% | 1.30 ab | 1.95 a | 0.65 ab | 0.70 a | 2.10 c | 3.25 abc | |||||||||
| Lime 2 cmol+/kg + thermocompost 2% | 1.15 ab | 1.35 a | 0.50 bcde | 0.30 cd | 5.00 a | 4.75 a | |||||||||
| Wahiawa Oxisol | |||||||||||||||
| Lac tree wood biochar 2% | 1.60 ab | 1.10 ab | 0.65 abc | 0.60 ab | 4.85 a | 3.70 ab | |||||||||
| Hilo mixed wood biochar 2% | 1.25 ab | 1.30 ab | 0.40 c | 0.60 ab | 4.55 a | 4.05 ab | |||||||||
| Vermicompost 2% | 1.30 ab | 1.45 ab | 0.55 bc | 0.95 a | 2.70 b | 3.40 ab | |||||||||
| Thermocompost 2% | 1.35 ab | 2.35 a | 0.55 bc | 0.90 a | 3.10 ab | 4.90 a | |||||||||
| Lac tree wood 2% + vermicompost 2% | 1.30 ab | 1.35 a | 0.80 ab | 0.75 ab | 3.40 ab | 3.95 ab | |||||||||
| Lac tree wood 2% + thermocompost 2% | 1.35 ab | 1.60 ab | 0.70 abc | 0.60 ab | 2.95 ab | 4.05 ab | |||||||||
| Hilo mixed wood 2% + vermicompost 2% | 1.80 a | 1.85 ab | 0.60 abc | 0.75 ab | 4.25 ab | 4.90 a | |||||||||
| Hilo mixed wood 2% + thermocompost 2% | 1.15 b | 1.75 ab | 0.70 abc | 0.85 ab | 3.40 ab | 4.60 a | |||||||||
| Lime 2 cmol+/kg + vermicompost 2% | 1.40 ab | 1.45 ab | 0.90 a | 0.50 b | 3.75 ab | 2.55 b | |||||||||
| Lime 2 cmol+/kg + thermocompost 2% | 1.65 ab | 1.50 ab | 0.75 ab | 0.50 b | 3.50 ab | 3.00 ab | |||||||||
| Sufficiency level for Brassica rapa (%) | 3–4 | 0.4–0.7 | 4.5–7.5 | ||||||||||||
| (b) | |||||||||||||||
| Treatments | Ca | Mg | Fe | Mn | |||||||||||
| 1st planting | 2nd planting | 1st planting | 2nd planting | 1st planting | 2nd planting | 1st planting | 2nd planting | ||||||||
| % | % | mg/kg | mg/kg | ||||||||||||
| Leilehua Ultisol | |||||||||||||||
| Lac tree wood biochar 2% | 3.40 abc | 3.90 ab | 0.55 ab | 0.95 a | 120.00 ab | 81.60 a | 42.80 abc | 64.70 a | |||||||
| Hilo mixed wood biochar 2% | 2.30 c | 2.05 c | 0.60 ab | 0.95 a | 192.80 a | 77.70 a | 79.00 a | 72.00 a | |||||||
| Vermicompost 2% | 2.55 abc | 3.25 abc | 0.60 ab | 0.85 a | 104.10 ab | 71.20 a | 31.10 bc | 75.50 a | |||||||
| Thermocompost 2% | 3.60 abc | 2.20 c | 0.50 b | 0.55 a | 118.00 ab | 59.30 a | 25.80 c | 42.80 a | |||||||
| Lac tree wood 2% + vermicompost 2% | 3.90 a | 4.10 ab | 0.45 b | 0.65 a | 69.60 b | 50.90 a | 14.20 c | 61.70 a | |||||||
| Lac tree wood 2% + thermocompost 2% | 2.70 abc | 3.55 abc | 0.55 ab | 0.70 a | 119.60 ab | 83.00 a | 41.70 abc | 73.10 a | |||||||
| Hilo mixed wood 2% + vermicompost 2% | 3.50 abc | 4.20 ab | 0.40 b | 0.70 a | 88.50 b | 64.10 a | 16.30 c | 50.90 a | |||||||
| Hilo mixed wood 2% + thermocompost 2% | 2.45 bc | 2.60 bc | 0.50 b | 0.60 a | 92.60 b | 144.90 a | 36.00 abc | 61.40 a | |||||||
| Lime 2 cmol+/kg + vermicompost 2% | 3.50 abc | 2.55 bc | 0.50 b | 0.75 a | 126.40 ab | 69.60 a | 26.40 c | 82.80 a | |||||||
| Lime 2 cmol+/kg + thermocompost 2% | 3.85 ab | 4.40 a | 0.75 a | 0.95 a | 146.00 ab | 92.00 a | 74.30 ab | 78.60 a | |||||||
| Wahiawa Oxisol | |||||||||||||||
| Lac tree wood biochar 2% | 3.05 bc | 3.55 a | 0.55 abc | 0.80 ab | 197.40 a | 108.45 b | 113.65 a | 145.90 abc | |||||||
| Hilo mixed wood biochar 2% | 2.30 bc | 3.15 a | 0.65 a | 1.10 a | 81.20 b | 108.45 b | 103.70 a | 120.35 bc | |||||||
| Vermicompost 2% | 2.10 c | 3.80 a | 0.40 c | 0.70 ba | 106.55 a | 57.65 b | 73.30 a | 163.50 abc | |||||||
| Thermocompost 2% | 3.05 bc | 3.55 a | 0.65 a | 0.95 ab | 165.15 ab | 380.90 a | 75.75 a | 113.90 bc | |||||||
| Lac tree wood 2% + vermicompost 2% | 3.00 bc | 2.35 a | 0.50 abc | 0.90 ab | 133.35 ab | 74.10 b | 115.85 a | 196.65 a | |||||||
| Lac tree wood 2% + thermocompost 2% | 2.70 bc | 3.25 a | 0.45 bc | 0.80 ab | 67.40 c | 80.30 b | 122.50 a | 160.10 abc | |||||||
| Hilo mixed wood 2% + vermicompost 2% | 3.25 b | 3.90 a | 0.45 bc | 0.70 b | 120.15 ab | 83.40 b | 113.15 a | 181.25 ab | |||||||
| Hilo mixed wood 2% + thermocompost 2% | 2.20 bc | 3.75 a | 0.45 bc | 0.85 ab | 80.30 b | 100.90 b | 81.00 a | 108.25 c | |||||||
| Lime 2 cmol+/kg + vermicompost 2% | 4.35 a | 3.35 a | 0.60 ab | 0.60 b | 140.05 ab | 70.75 b | 125.95 a | 159.70 abc | |||||||
| Lime 2 cmol+/kg + thermocompost 2% | 2.75 bc | 3.05 a | 0.50 abc | 0.85 ab | 119.55 ab | 64.55 b | 125.20 a | 116.95 bc | |||||||
| Sufficiency level for Brassica rapa | 1.9–6.0 | 0.23–0.75 | 40–300 | 25–200 | |||||||||||
| Treatments | N | P | K | Ca | Mg | Fe | Mn | |||
|---|---|---|---|---|---|---|---|---|---|---|
| mg/plant | ||||||||||
| Leilehua Ultisol | ||||||||||
| Lac tree wood biochar 2% | 20.7 bc | 4.0 b | 54.4 bcd | 3.91 a | 11.1 dc | 0.17 a | 0.08 a | |||
| Hilo mixed wood biochar 2% | 11.4 c | 11.4 b | 17.6 d | 2.08 a | 5.7 d | 0.1 a | 0.06 a | |||
| Vermicompost 2% | 35.9 abc | 12.6 ab | 85.6 abcd | 3.29 a | 20.5 ab | 0.27 a | 0.14 a | |||
| Thermocompost 2% | 28.4 bc | 8.5 ab | 39.2 cd | 2.21 a | 7.2 d | 0.16 a | 0.05 a | |||
| Lac tree wood 2% + Vermicompost 2% | 66.5 a | 26.6 a | 139.7 a | 4.09 a | 22.9 a | 0.31 a | 0.12 a | |||
| Lac tree wood 2% + Thermocompost 2% | 28.1 bc | 9.2 ab | 82.4 abcd | 3.58 a | 13.2 bcd | 0.23 a | 0.12 a | |||
| Hilo mixed wood 2% + vermicompost 2% | 52.9 ab | 25.9 a | 110.9 abc | 4.16 a | 19.8 abc | 0.27 a | 0.11 a | |||
| Hilo mixed wood 2% + Thermocompost 2% | 39.7 abc | 13.1 ab | 122.2 ab | 2.57 a | 18.2 abc | 0.29 a | 0.14 a | |||
| Lime 2 cmol+/kg + vermicompost 2% | 30.8 bc | 14.5 ab | 55.7 bcd | 2.51 a | 12.7 bcd | 0.24 a | 0.09 a | |||
| Lime 2 cmol+/kg + thermocompost 2% | 25.6 bc | 9.0 ab | 104.2 abc | 4.38 a | 17.1 abc | 0.26 a | 0.15 a | |||
| Wahiawa Oxisol | ||||||||||
| Lac tree wood biochar 2% | 39.7 ab | 17.2 a | 124.7 a | 88.7 ab | 16.6 a | 0.47 a | 0.34 abc | |||
| Hilo mixed wood biochar 2% | 32.8 ab | 11.7 a | 117.1 a | 64.9 ab | 19.4 a | 0.22 a | 0.28 bc | |||
| Vermicompost 2% | 41.1 ab | 19.6 a | 88.0 a | 80.2 ab | 15.1 a | 0.27 a | 0.29abc | |||
| Thermocompost 2% | 32.9 ab | 15.0 a | 85.3 a | 71.6 ab | 16.4 a | 0.41 a | 0.20 c | |||
| Lac tree wood 2% + Vermicompost 2% | 43.9 ab | 25.9 a | 124.5 a | 91.9 ab | 20.9 a | 0.37 a | 0.47 a | |||
| Lac tree wood 2% + Thermocompost 2% | 41.1 ab | 20.9 a | 105.9 a | 88.2 ab | 16.7 a | 0.21 a | 0.42 ab | |||
| Hilo mixed wood 2% + vermicompost 2% | 58.2 a | 21.8 a | 148.5 a | 113.7 ab | 18.2 a | 0.34 a | 0.45 ab | |||
| Hilo mixed wood 2% + Thermocompost 2% | 46.4 ab | 25.5 a | 134.2 a | 93.7 ab | 19.7 a | 0.29 a | 0.32abc | |||
| Lime 2 cmol+/kg + vermicompost 2% | 48.5 ab | 27.7 a | 117.5 a | 144.5 a | 22.2 a | 0.41 a | 0.45 ab | |||
| Lime 2 cmol+/kg + thermocompost 2% | 26.3 b | 10.a | 55.6 a | 47.7 b | 10.2 a | 0.17 a | 0.20 c | |||
© 2018 by the authors. Licensee MDPI, Basel, Switzerland. This article is an open access article distributed under the terms and conditions of the Creative Commons Attribution (CC BY) license (http://creativecommons.org/licenses/by/4.0/).
Share and Cite
Berek, A.K.; Hue, N.V.; Radovich, T.J.K.; Ahmad, A.A. Biochars Improve Nutrient Phyto-Availability of Hawai’i’s Highly Weathered Soils. Agronomy 2018, 8, 203. https://doi.org/10.3390/agronomy8100203
Berek AK, Hue NV, Radovich TJK, Ahmad AA. Biochars Improve Nutrient Phyto-Availability of Hawai’i’s Highly Weathered Soils. Agronomy. 2018; 8(10):203. https://doi.org/10.3390/agronomy8100203
Chicago/Turabian StyleBerek, Arnoldus Klau, Nguyen V. Hue, Theodore J. K. Radovich, and Amjad A. Ahmad. 2018. "Biochars Improve Nutrient Phyto-Availability of Hawai’i’s Highly Weathered Soils" Agronomy 8, no. 10: 203. https://doi.org/10.3390/agronomy8100203