Management of Nitrapyrin and Pronitridine Nitrification Inhibitors with Urea Ammonium Nitrate for Winter Wheat Production


1
School of Natural Resources, University of Missouri, Columbia, MO 65211, USA
2
Division of Plant Sciences, University of Missouri, Novelty, MO 63460, USA
*
Author to whom correspondence should be addressed.
Agronomy 2018, 8(10), 204; https://doi.org/10.3390/agronomy8100204
Submission received: 7 August 2018
/
Revised: 10 September 2018
/
Accepted: 19 September 2018
/
Published: 24 September 2018
Abstract
:Synchrony between soil mineral nitrogen (N) supply and crop N demand is important for optimal plant growth. Excessively wet conditions expose poorly drained soils to an increased potential of N loss and reduced N use efficiency. A two-year experiment with wheat (Triticum aestivum L.) was initiated in 2014 and concluded in 2016 in northeastern Missouri in the United States (USA). The objective of this experiment was to evaluate the effects of nitrapyrin and pronitridine nitrification inhibitors (NI) applied as an early or late-split application timing (40:60%) of 79 kg N ha−1 or 112 kg N ha−1 on winter wheat soil and plant N status, as well as grain yield. Both NIs had no effect (p = 0.3917) on yield, while there was an interaction between year and the urea ammonium nitrate (UAN) rate on grain yield. Yields were similar (3550 kg ha−1 to 3686 kg ha−1) in 2015 between UAN application rates. UAN at 112 kg N ha−1 resulted in a 551 kg ha−1 greater yield than UAN at 79 kg N ha−1 in 2016. Nitrapyrin and pronitridine did not significantly affect soil ammonium or nitrate–N concentrations at depths of 0–15 cm and 16–30 cm compared to the absence of NI over the period of three months after application. Nitrapyrin with UAN at 112 kg N ha−1 had the highest grain test weight. Further testing of these NIs in combination with UAN for winter wheat production is needed under different climatic and environmental conditions to develop comprehensive management recommendations.
1. Introduction
Nitrogen (N) is essential to all forms of life. Its availability largely affects the productivity of many ecosystems [1]. Approximately one-third of the global population would have not lived had the amount of protein that has been attributed to the use of manufactured N fertilizers not been achieved [2]. Synthetic N fertilizers commonly used in row-crop agriculture include urea, anhydrous ammonia, ammonium nitrate, ammonium sulfate, and urea ammonium nitrate (UAN) [3]. Urea-based fertilizers are the most widely sold (43%) N fertilizers in the world [4,5].
Due to its highly soluble nature, the potential risk of N losses in subsurface drainage water flow [6] and denitrification [7] in poorly drained soils, and leaching in sandy soils [8] has been reported with urea-based N fertilizers. The loss of N from synthetic fertilizers decreases agricultural crop and livestock production, and the fulfillment of nutritional requirements of a rapidly increasing human population [9,10,11]. Harmful environmental effects due to N loss mechanisms include the loss of biodiversity in aquatic and terrestrial ecosystems and the invasion of N-consuming weeds, the acidification of soil and water resources, increased greenhouse gas levels due to emissions of N2O, and depletion of the stratospheric ozone ([12]. Factors such as a variation in management practices (e.g., selection of N source, soil tillage method, placement of fertilizer, timing and method of N application), climatic conditions, soil properties, and crop growth affect the relative magnitude of N loss processes [13].
North central and eastern Missouri, southeast Kansas, and southern Illinois are part of the central claypan major land resource area (MLRA) [14,15,16]. The claypan region includes four million hectares comprised predominantly of soils characterized by a subsoil layer of 100% more clay content at a depth of 20 cm to 40 cm compared to the surface layer, making it a poorly drained soil. Low-lying landscapes and poorly drained soil conditions cause soils to be saturated during prolonged wet conditions from frequent rainfall events. These saturated conditions increase the risk of N loss and adversely affect crop yields [7,17,18]. Factors, such as N sources, application timings, rates, and nitrification inhibitors (NI) interact differently based on soil and environmental conditions. Precise understanding of the effects of individual factors and their interactions on N losses as well as crop production may increase or maintain optimal crop grain yields. The simultaneous cumulative impact of multiple management factors have not been studied extensively [19] in winter wheat production in the midwestern U.S.
Urea ammonium nitrate is available in solution form, which allows it to be mixed easily with other chemicals such as NIs or other nutrients. Half of its N is in the urea form, and the other half is in NO3− (25%) and NH4+ (25%). The development and effects of nitrification inhibitors on reducing N loss and crop production have been reviewed [20,21,22,23] with a primary focus on corn. Nitrification inhibitors have been utilized to reduce the gaseous and leaching loss of N fertilizer by delaying the nitrification of N fertilizers in the soil [24,25,26,27,28,29,30,31,32,33] and increasing crop yields [34,35,36]. Anhydrous ammonia with nitrapyrin (2-chloro-6-(trichloromethyl) pyridine) has increased ammonium retention in claypan soils when applied in the fall for wheat [37]. However, research is limited on the use of nitrification inhibitors with UAN as an N fertilizer source for winter wheat on claypan soils.
Nitrapyrin was reformulated for improved utility with UAN, urea, and manure. Research has evaluated corn response to UAN rates and timings in the presence and absence of this new formulation of nitrapyrin (Instinct®) on yield, N2O emissions, and yield-scaled N2O emissions [19,30]. Nitrapyrin reduced both daily and cumulative N2O emissions when averaged across years. However, the UAN rate influenced corn yield, yield-scaled N2O emissions, N2O fluxes, and cumulative N2O emissions the most, followed by application timing and nitrapyrin. In Minnesota, over a three-year period under continuous corn and subsurface tile drainage on poorly drained glacial till soils, research evaluated the effects of two rates (9.4 L ha−1 and 18.7 L ha−1) of a newly developed nitrification inhibitor, pronitridine [38], and one rate of nitrapyrin (2.6 L ha−1, 0.57 kg active ingredient (a.i.) ha−1) on corn yield [39] with several rates of UAN. A relatively wet year resulted in the lowest yield in the absence of pronitridine at 18.7 L ha−1 compared to pronitridine at 9.4 L ha−1 or a nitrapyrin application. In Missouri, on poorly drained claypan soils planted to corn, Nelson [40] reported that UAN plus pronitridine (9.4 L ha−1) that was applied pre-emergence in a dribble band was comparable in corn grain yields to an application of UAN plus nitrapyrin (0.5 kg a.i. ha−1). In that same research, it was observed that in a high yielding year with optimum precipitation during the growing season, UAN application rates could be 8% to 19% lower when added with pronitridine or nitrapyrin than when UAN was applied without a nitrification inhibitor. No research has reported on the effects of pronitridine on wheat response with UAN in a poorly drained soil. Therefore, the objective of this research was to evaluate the effectiveness of nitrapyrin and pronitridine applied with an early or late split application timing (40% followed by 60% of the total applied N) of 79 kg N ha−1 or 112 kg N ha−1 on soil N status, winter wheat N content, and grain yield.
2. Materials and Methods
A two-year experiment on wheat was initiated in the fall of 2014 at the University of Missouri’s Greenley Memorial Research Center (40°1′17″ N, 92°11′24.9″ W) near Novelty, Missouri, United States (USA). A single year was assigned based on the harvest date, so the 2014–2015 season was reported as the 2015 experiment. The soil series was a Kilwinning silt loam (fine, smectitic, mesic Vertic Epiaqualfs). The experiment was a two-factor randomized complete block design (RCBD) with six and five replications in 2015 and 2016, respectively. Factors included two split-applied UAN rates (79 kg ha−1 and 112 kg ha−1) and six nitrification inhibitor timings (none, nitrapyrin, or pronitridine with the first application timing, and none, nitrapyrin, or pronitridine with the second application timing). The nitrification inhibitors were nitrapyrin (Instinct II, Dow AgroSciences, Indianapolis, IN, USA) at 0.513 kg a.i. ha−1 and pronitridine (CenturoTM, Koch Agronomic Services, Wichita, KS, USA) at 9.3 L ha−1. A single non-treated control was included in the experiment. Split applications of UAN were applied as 40% N at green up, and 60% N one month afterwards.
The field experimental site was different each year, and wheat was planted following soybean (Glycine max. L.) harvest. Wheat was drilled (Great Plains Solid Stand 10, Assaria, KS, USA) at 107 kg seeds ha−1 in 19.1-cm wide rows. The crop was no-till seeded in 2015, while vertical tillage (Case IH 330, Racine, WI, USA) occurred prior to planting in 2016 due to the presence of winter annual weeds and extensive residue. A burn down application of glyphosate (N-(phosphonomethyl) glycine) at 1.17 kg a.i. ha−1 plus 2,4-D (Isooctyl (2-ethylhexyl) ester of 2,4-Dicholorphenoxyacetic acid) at 0.35 kg a.i. ha−1 was utilized to control winter annual weeds on 21 October 2014. Plot size was 3 m by 15 m. Wheat cultivars were ‘MFA2525′, which was planted on 21 October 2014 for 2015, and ‘MFA2449′, which was planted on 17 September 2015 for 2016. Cultivars changed from 2015 to 2016 due to the unavailability of MFA2525.
Initial soil samples were collected from the non-treated control on 19 March 2015 (2015 study year) and 11 November 2015 (2016 study year) to determine selected soil properties (Table 1). Soil samples were collected from 0–15 cm and 16–30 cm depths using a stainless steel push probe. The soil samples were analyzed using standard soil test analytical methods at the University of Missouri Soil and Plant Testing Laboratory [41]. Additional analyses of soil NH4+-N and NO3−-N were determined using a 2-M KCl extraction and Lachat QuikChem automated ion analyzer (Hach Corp, Loveland, CO, USA).
Field management, field characteristics, soil maintenance, and crop protection chemicals are reported in Table 1. Azoxystrobin (methyl (E)-2-{2-[6-(2-cyanophenoxy) pyrimidin-4-yloxy] phenyl}-3-methoxyacrylate) at 0.15 kg a.i. ha−1 was applied on 15 May 2015 to the wheat to prevent disease. A maintenance fertilizer application of N–P–K–S–Zn at 16-52-0-13-2.6 kg ha−1 was made on 23 September 2015. Chlorophyll meter readings for 10 plants plot−1 were recorded to determine the chlorophyll content of the flag leaf using a SPAD meter (Minolta SPAD-502, Tokyo, Japan). At physiological maturity, whole plant samples were collected from each plot from two 30 cm x 76 cm quadrats to determine the aboveground dry biomass. The collected biomass samples were dried, weighed, ground to pass a 1-mm sieve (Wiley Mill, Swedesboro, NJ, USA), and analyzed for total Kjeldahl N [42], which was used to calculate tissue N uptake and crop N recovery efficiency (REN) [43,44]. Wheat grain yields were determined with a small plot combine (Wintersteiger Delta, Salt Lake City, UT, USA) and adjusted to 130 g kg−1 moisture content before analysis. Grain samples were collected from each plot to determine test weight and moisture using a grain analysis computer (GAC 2100, DICKEY-john Corporation, Auburn, IL, USA).
Precipitation data for the growing seasons were collected from a nearby automated weather station [45]. Data were reported for each study year from October to July for 2015 and September to July for 2016, which was based on the harvest date, such as the 2014–2015 season being reported as 2015. Daily and cumulative rainfall were reported in comparison with average cumulative rainfall for a 10-year period (2004 to 2014) in Figure 1.
Data were first subjected to single-factor analysis of variance (ANOVA) using the SAS statistical program [46] to determine the significant differences between N treatments and the non-treated control (NTC). This was followed by a two-factor ANOVA in the absence of the NTC, since only one non-treated control was included in the design. Results were presented when significant differences among treatments were observed at p ≤ 0.05. Means were then separated using Fisher’s Protected Least Significant Difference.
3. Results and Discussion
3.1. Precipitation and Temperature
Cumulative precipitation in 2015 (1006 mm) was 20% (204 mm) greater than the 10-year average precipitation (Figure 1). Nearly 80% (792 mm) of the precipitation occurred after the first N application. Most of the rainfall during this period was from May through July with two unusually high rainfall events in June (95 mm) and July (115 mm). The month of June received an even distribution of precipitation in the range of 20 mm to 39 mm. From planting (21 October) until just prior to the first N treatment application on 19 March 2015 daily cumulative rainfall was below the average cumulative rainfall. However, near the end of June, precipitation exceeded the 10-year average.
The precipitation distribution pattern in 2016 was different from 2015. The cumulative daily amount was 19% (154 mm) less than the 10-year average (795 mm). The highest individual daily rainfall events occurred during mid-November (43 mm) and mid-December (45 mm), which was lower than 2015. The overall precipitation over the season, except from January to the end of March, was low, but it was sufficient for high yields.
The average daily air temperature from September 1 of the planting-year to August 31 of the harvest-year for the years 2015 and 2016 is shown in Figure 2. In 2015, the temperature between late-November and early-March was below freezing point (0 °C). In 2016, freezing temperatures were only observed from early-January to mid-February. Generally, temperatures in 2015 during the months of November through March were colder compared to 2016. In addition, the temperature dropped below 10 °C earlier, and remained colder for a longer period of time compared to 2016.
3.2. Soil Nitrogen
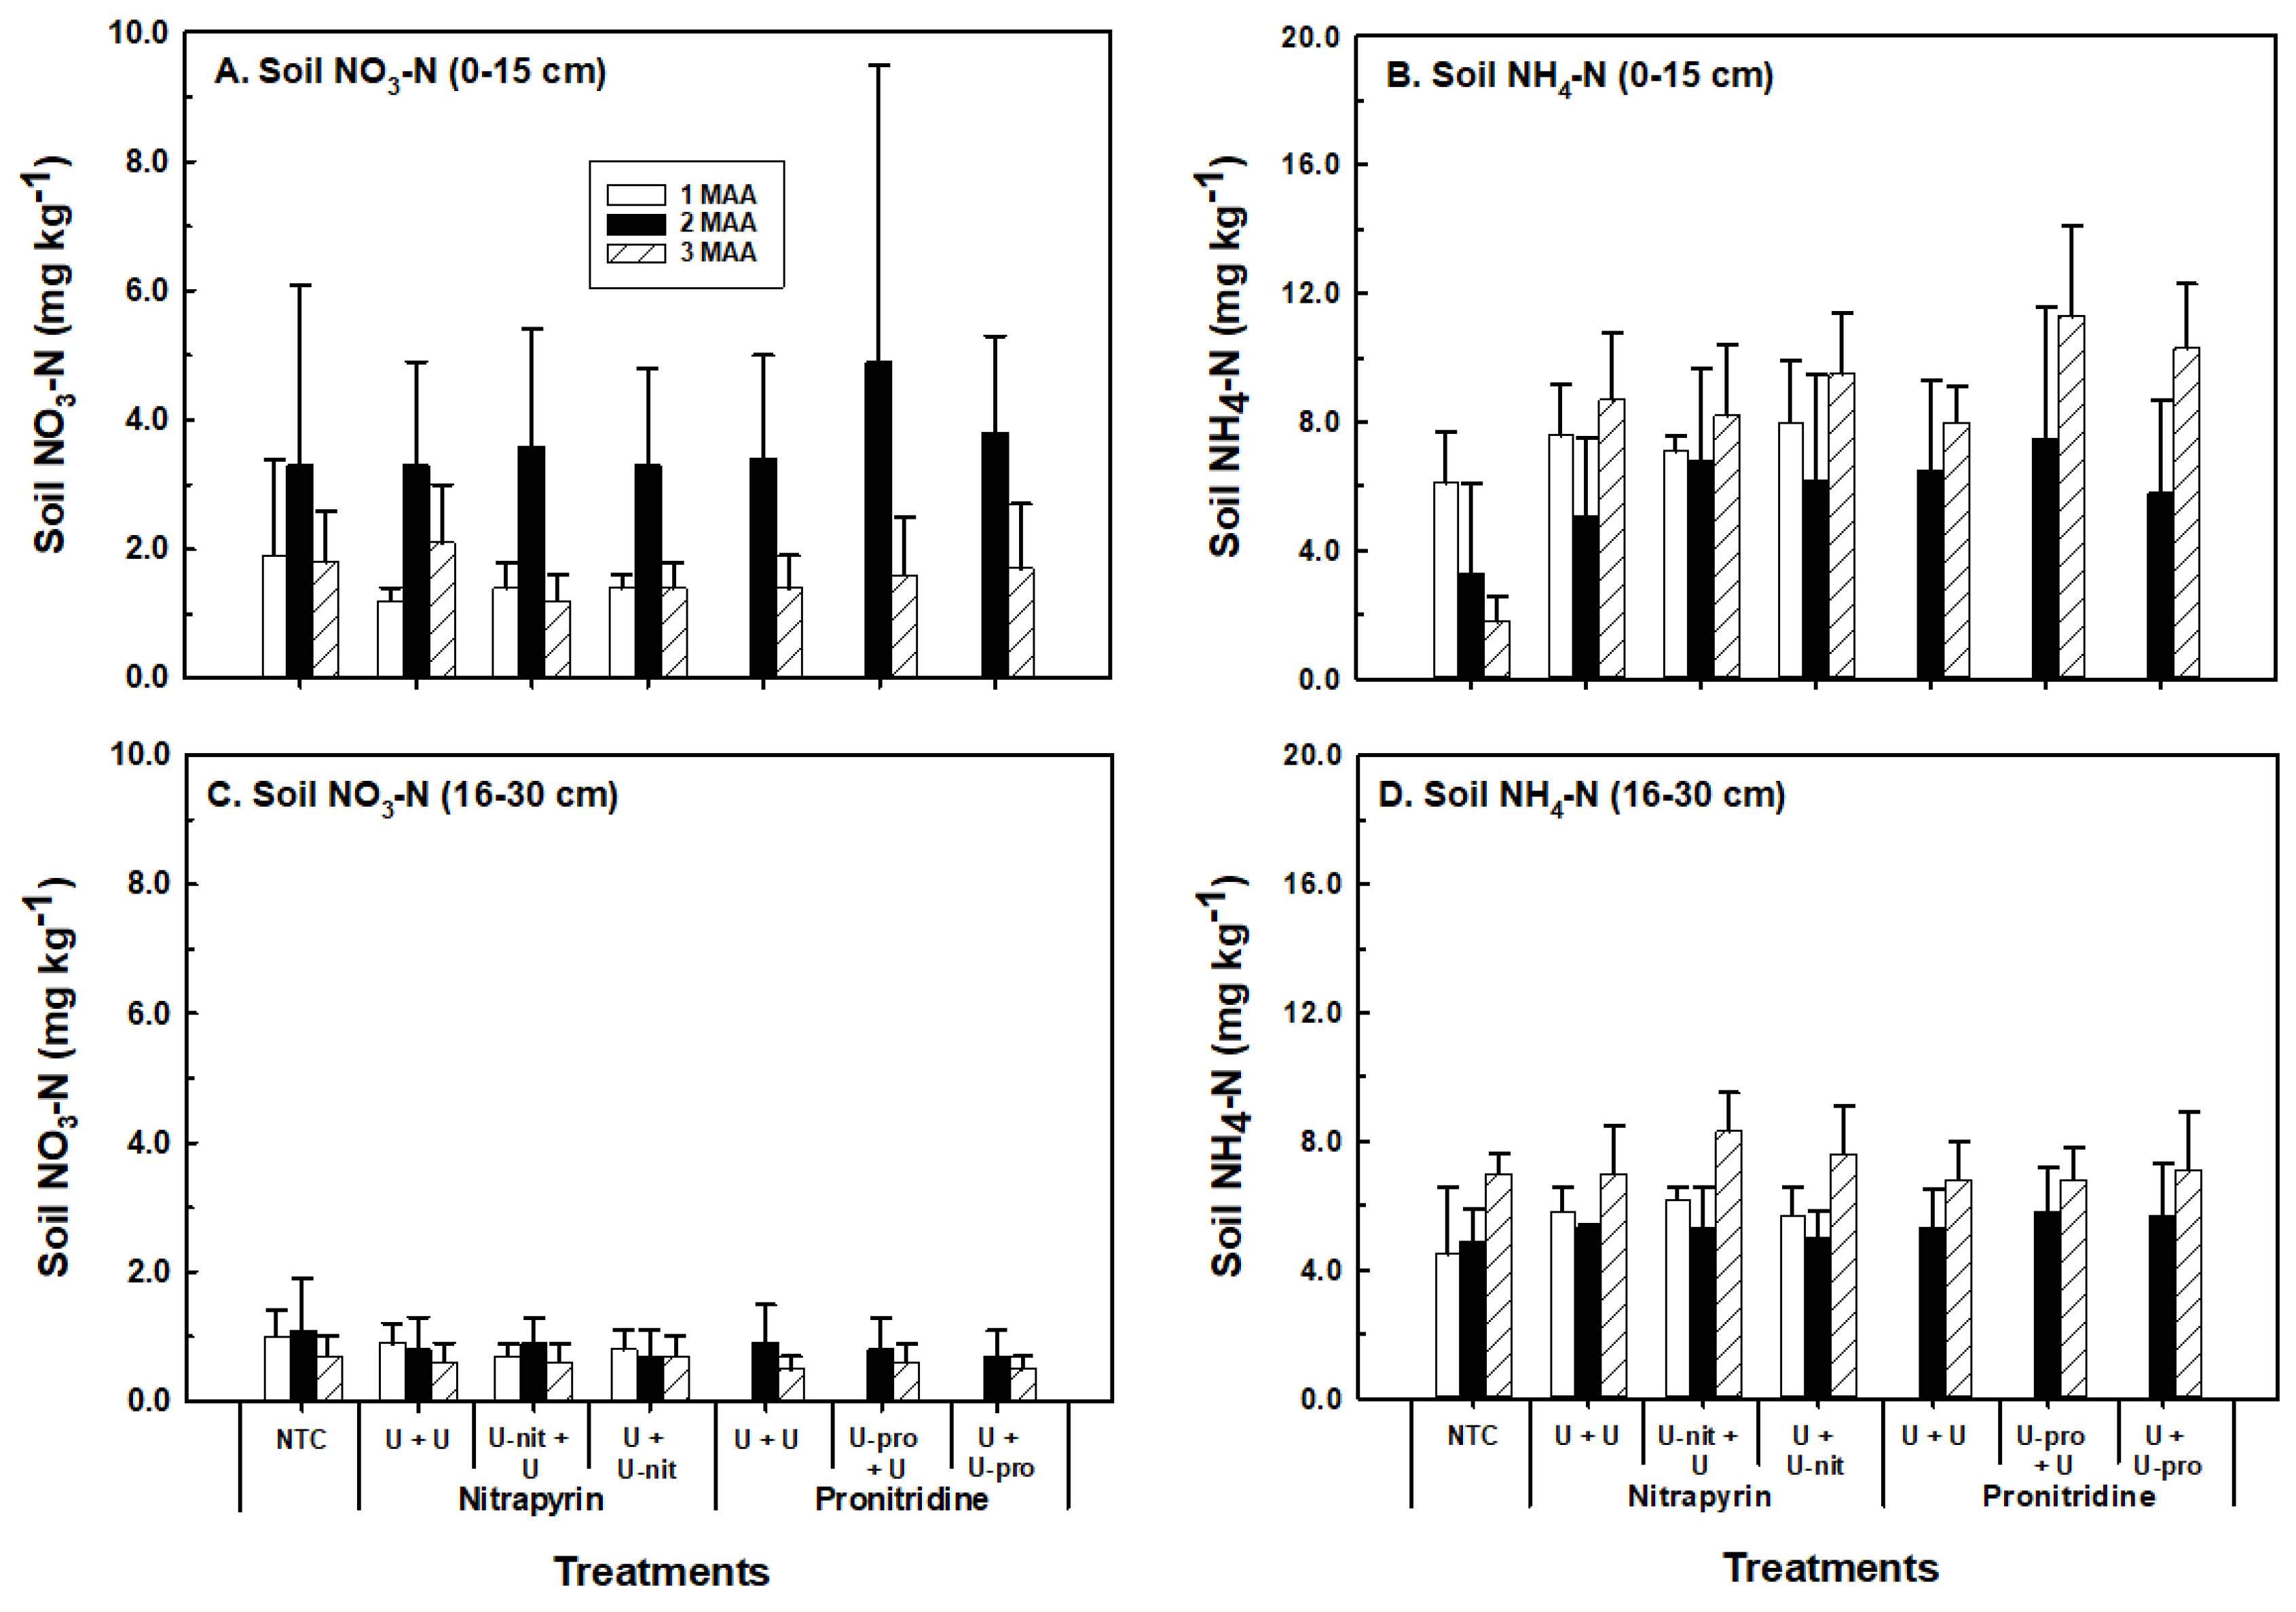
Soil NO3–N and NH4–N concentrations for the 0 cm to 15 cm and 16 cm to 30 cm depths of treatment applications of UAN at 79 kg N ha−1 (Figure 3) and 112 kg N ha−1 (Figure 4) one, two, and three months after the first treatment application (MAA) were similar among treatments. In general, soil NO3–N decreased, and soil NH4–N increased with greater MAA at both rates of UAN and with both depths (Figure 3 and Figure 4). Ammonium–N concentration at a 0–15 cm depth in the soil ranged from 5.8 mg kg−1 to 8.0 mg kg−1 1 MAA for the non-treated control and both rates of UAN treatments, while the concentration was similar among treatments of two MAA. There was 1.8 mg kg−1 to 11.3 mg kg−1 NH4–N in the soil profile (0–15 cm deep) for all treatments of three MAA.
Soil NO3–N and NH4–N concentrations for both UAN applications in the 16 cm to 30 cm depth were not affected by the NIs (Figure 3 and Figure 4). This result is in contrast with Kidwaro and Kephart [37], who observed greater retention of soil NH4–N of up to 8 cm around the injection zone where anhydrous ammonia and nitrapyrin were added for winter wheat production in a claypan soil in Missouri. Possible reasons for this are that only a portion of the N from the UAN fertilizer was in nitrate form, and the N from the UAN may not have reached the soil depth of 16 cm to 30 cm at this point in time. In addition, the NI may not have moved into soils as quickly as N to affect soil NH4–N and NO3–N concentrations at the lower depth, even if N had leached into the soil. Nitrification inhibitors may not leach as rapidly as nitrate–N, because sorption/adsorption of NI to soil colloids, in particular nitrapyrin and DMPP, have been reported to reduce their effectiveness [47,48,49]. Generally, soil NH4–N concentration three MAA at both soil depths remained highest, followed by two MAA. This result may be attributed to NO3− being relatively more soluble and moving quickly in soils, or there was greater plant uptake of NO3− compared to NH4+.
3.3. Plant Response
The overall analysis of variance (ANOVA) and p-values for crop response in 2015 and 2016 are shown in Table 2. Urea ammonium nitrate treatments significantly increased plant leaf SPAD meter readings, tissue N concentration, plant population, and grain yields compared to the non-treated control, but there was no observed effect on grain moisture among the UAN application rates (Table 3). There was no difference in flag leaf SPAD meter readings and REN between the 79 kg N ha−1 and 112 kg N ha−1 rates, but tissue N concentration of total aboveground plant biomass and grain yields in 2016 were significantly increased between the two rates (Table 3). However, no differences in grain yields between the two rates was observed in 2015 when overall grain yields were lower.
Improved plant growth, including increased tissue N, and grain yields with increasing application rates of UAN in crop production, have been extensively observed in the midwestern region of the United States (U.S.) especially for corn [19,40,50]. However, REN values tended to decrease with increasing N application rates [51], which was not observed in this research. This difference may have occurred due to the variability in climatic conditions between the two years, which resulted in lower overall yields in 2015 compared to 2016, and may have affected N utilization.
Grain yields (P = 0.6620) were similar among NI treatments, regardless of the timing of the NI application (Table 2 and Table 4). However, plant population and REN were affected differently by NI depending on the year (Table 2 and Table 4). Plant populations were greater in 2015 compared to 2016 (Table 4). Plant populations were 147 m−2 to 151 m−2 for all of the treatments except pronitridine, which was applied with the late timing of UAN, while there was no effect of NI on plant population in 2016. These differences did not affect overall grain yields.
Pronitridine increased REN when applied with UAN at the early N application timing compared to nitrapyrin in 2016, but REN during the same year with pronitridine was similar to the non-treated control (Table 4). Nitrogen recovery efficiency was greatest when nitrapyrin was applied with the late timing of UAN compared to no NI or pronitridine in 2015 (Table 4). However, nitrapyrin with UAN had the lowest REN in 2016.
The total wheat biomass yield, N uptake, and grain test weight responded differently each year to NI treatments and the amount of N applied (Table 5). In general, plant biomass yield responses in 2016 were greater than or equal to similar treatments in 2015. In 2015, all of the treatments had similar total biomass yields at 79 kg N ha−1 and 112 kg N ha−1 except for nitrapyrin, which was applied with the late UAN application. Total plant biomass was greatest (12.65 Mg ha−1) when nitrapyrin was applied with the late application of UAN at 112 kg N ha−1 compared to other treatments, except when nitrapyrin was applied with the early application of UAN at 112 kg N ha−1. In 2016, plant biomass with UAN at 79 kg N ha−1 was similar or greater than the NI treatments; however, plant biomass was 2.8 kg ha−1 to 4.79 kg ha−1 greater when pronitridine was applied with the early timing of UAN at 112 kg N ha−1 compared to all of the other treatments.
While no significant difference among treatments for plant N concentrations were detected, plant N responded with a similar three-way interaction (year × NI timing × N rate) as biomass yield (Table 5). In 2015, plant N uptake was highest (182 kg N ha−1) when nitrapyrin was applied late with UAN at 112 kg N ha−1. Total plant N uptake was greatest (174 kg ha−1) when pronitridine was applied with UAN at 112 kg N ha−1 in 2016. However, N uptake was similar to UAN in the absence of NI. Grain test weights were generally greater in 2016 than 2015, which could be due to a change in the cultivar or weather conditions. Urea ammonium nitrate at 112 kg N ha−1 at the early timing had the highest test weight, but it was similar to all of the treatments with a NI when applied at the same N amount in 2016.
Differences in the plant response observed between the two years of this research could be due to rainfall distribution. Although rainfall in 2015 was higher (20%) compared to the 10-year average, a lack of precipitation from planting to the first treatment application on 19 March may have affected plant growth and N utilization (Figure 1). During 2015, approximately 80% of the season’s precipitation occurred from May to July with two 100 mm and 110 mm rainfall events in June and July, respectively. In comparison, 2016 received 20% lower precipitation than the 10-year average, but the precipitation was evenly distributed over the season with relatively low daily rainfall events, which possibly contributed to the overall higher grain yields compared to those observed in 2015.
The major effect of climatic variation on the efficacy of NI sources and timing has been observed in other studies [37,49,51,52]. A lack of agronomic response to a NI has been attributed to situations where environmental conditions were not favorable for N loss, or when the use of a NI resulted in N loss through ammonia volatilization [22]. Despite the relatively wetter conditions of the poorly drained soils in this research, which would potentially cause greater N loss conditions, the addition of NI with UAN in this research did not result in consistent soil NH4–N stabilization over a three-month period after application or in a subsequent grain yield increase.
4. Conclusions
Nitrapyrin and pronitridine did not affect soil N status over a three-month period compared to non-treated UAN during the two years of this research. The results for total plant biomass and plant N uptake indicated that nitrapyrin had the greatest response when applied at a late timing at 112 kg N ha−1, while pronitridine had the greatest response when applied with the early application of UAN at a total rate of 112 kg N ha−1. The higher UAN application rate increased tissue N concentration in both years and grain yield by 0.47 Mg ha−1 in 2016, but there was no effect of NI or application timing on tissue N concentration or yield. Nitrapyrin combined with UAN had the highest crop REN in 2015, but the highest REN was observed with pronitridine in 2016. Plant population and grain moisture were not affected by UAN rate or NI timing. Nitrification inhibitors generally had similar grain test weights, although differences were observed between 2015–2016. The application of nitrapyrin or pronitridine with different application timings and the split-applied UAN rate (low or high) generally did not affect winter wheat yields in this research compared to when UAN was added alone. However, the use of different NIs in combination with UAN needs to be examined under additional field and climatic conditions in order to develop comprehensive management recommendations for winter wheat production in the region.
Author Contributions
H.H. was responsible for the initial analysis, interpretation of the data and writing of the manuscript. K.A.N. was responsible for planning, site selection, analysis, and interpretation of results. P.P.M. participated in the planning, design, interpretation of results, and manuscript preparation.
Funding
This research was partially funded by the U.S. Agency for International Development’s Agricultural Innovation Program and the Missouri Agricultural Experiment Station.
Acknowledgments
The authors would like to thank Gurpreet Kaur, Theodore Blumenschein, Rafid Al-Ubori and the Greenley Memorial Research Center staff for their technical support and Christy Copeland, Linda Journey and Judy Prevo for their administrative assistance.
Conflicts of Interest
The authors declare no conflict of interest. The funders had no role in the collection, analyses, or interpretation of data; in the writing of the manuscript, and in the decision to publish the results.
References
- Vitousek, P.M.; Hättenschwiler, S.; Olander, L.; Allison, S. Nitrogen and nature. AMBIO J. Hum. Environ. 2002, 31, 97–101. [Google Scholar] [CrossRef]
- Smil, V. Global population and the nitrogen cycle. Scientific Am. 1997, 277, 76–81. [Google Scholar] [CrossRef]
- Millar, N.; Robertson, G.P.; Grace, P.R.; Gehl, R.J.; Hoben, J.P. Nitrogen fertilizer management for nitrous oxide (N2O) mitigation in intensive corn (Maize) production: An emissions reduction protocol for US Midwest agriculture. Mitig. Adapt. Strateg. Glob. Chang. 2010, 15, 185–204. [Google Scholar] [CrossRef]
- Bouwman, A.F.; Boumans, L.J.M.; Batjes, N.H. Emissions of N2O and NO from fertilized fields: Summary of available measurement data. Glob. Biogeochem. Cycles 2002, 16. [Google Scholar] [CrossRef]
- Bouwman, A.F.; Boumans, L.J.M.; Batjes, N.H. Estimation of global NH3 volatilization loss from synthetic fertilizers and animal manure applied to arable lands and grasslands. Glob. Biogeochem. Cycles 2002, 16. [Google Scholar] [CrossRef]
- Drury, C.F.; Tan, C.S.; Reynolds, W.D.; Welacky, T.W.; Oloya, T.O.; Gaynor, J.D. Managing tile drainage, subirrigation, and nitrogen fertilization to enhance crop yields and reduce nitrate loss. J. Environ. Qual. 2009, 38, 1193–1204. [Google Scholar] [CrossRef] [PubMed]
- Nash, P.R.; Motavalli, P.P.; Nelson, K.A. Nitrous oxide emissions from claypan soils due to nitrogen fertilizer source and tillage/fertilizer placement practices. Soil Sci. Soc. Am. J. 2012, 76, 983–993. [Google Scholar] [CrossRef]
- Wilson, M.L.; Rosen, C.J.; Moncrief, J.F. Potato response to a polymer-coated urea on an irrigated, coarse-textured soil. Agron. J. 2009, 101, 897–905. [Google Scholar] [CrossRef]
- Vitousek, P.M.; Aber, J.D.; Howarth, R.W.; Likens, G.E.; Matson, P.A.; Schindler, D.W.; Schlesinger, W.H.; Tilman, D.G. Human alteration of the global nitrogen cycle: Sources and consequences. Ecol. Appl. 1997, 7, 737–750. [Google Scholar] [CrossRef]
- Howarth, R.W.; Sharpley, A.; Walker, D. Sources of nutrient pollution to coastal waters in the United States: Implications for achieving coastal water quality goals. Estuaries 2002, 25, 656–676. [Google Scholar] [CrossRef]
- Howarth, R.W. Human acceleration of the nitrogen cycle: Drivers, consequences, and steps toward solutions. Water Sci. Technol. 2004, 49, 7–13. [Google Scholar] [CrossRef] [PubMed]
- Galloway, J.N.; Cowling, E.B. Reactive nitrogen and the world: 200 years of change. AMBIO J. Hum. Environ. 2002, 31, 64–71. [Google Scholar] [CrossRef]
- Motavalli, P.P.; Goyne, K.W.; Udawatta, R.P. Environmental impacts of enhanced-efficiency nitrogen fertilizers. Crop Manag. 2008, 7. [Google Scholar] [CrossRef]
- Anderson, S.H.; Gantzer, C.J.; Brown, J.R. Soil physical properties after 100 years of continuous cultivation. J. Soil Water Conserv. 1990, 45, 117–121. [Google Scholar]
- Jung, W.K.; Kitchen, N.R.; Sudduth, K.A.; Anderson, S.H. Spatial characteristics of claypan soil properties in an agricultural field. Soil Sci. Soc. Am. J. 2006, 70, 1387–1397. [Google Scholar] [CrossRef]
- Myers, D.B.; Kitchen, N.R.; Sudduth, K.A.; Sharp, R.E.; Miles, R.J. Soybean root distribution related to claypan soil properties and apparent soil electrical conductivity. Crop Sci. 2007, 47, 1498–1509. [Google Scholar] [CrossRef]
- Nelson, K.A.; Paniagua, S.M.; Motavalli, P.P. Effect of polymer coated urea, irrigation, and drainage on nitrogen utilization and yield of corn in a claypan soil. Agron. J. 2009, 101, 681–687. [Google Scholar] [CrossRef]
- Nash, P.R.; Nelson, K.A.; Motavalli, P.P. Corn yield response to timing of strip-tillage and nitrogen source applications. Agron. J. 2013, 105, 623–630. [Google Scholar] [CrossRef]
- Burzaco, J.P.; Smith, D.R.; Vyn, T.J. Nitrous oxide emissions in Midwest US maize production vary widely with band-injected N fertilizer rates, timing and nitrapyrin presence. Environ. Res. Lett. 2013, 8, 1–11. [Google Scholar] [CrossRef]
- Stelly, M. Nitrification Inhibitors-Potentials and Limitations; ASA Special Publication 38; American Society of Agronomy and Soil Science Society of America: Madison, WI, USA, 1980. [Google Scholar]
- Prasad, R.; Power, J. Nitrification inhibitors for agriculture, health and the environment. Advances Agron. 1995, 54, 233–281. [Google Scholar]
- Wolt, J.D. A meta-evaluation of nitrapyrin agronomic and environmental effectiveness with emphasis on corn production in the Midwestern USA. Nutr. Cycl. Agroecosyst. 2004, 69, 23–41. [Google Scholar] [CrossRef]
- Cook, R.L.; Nail, A.; Vigardt, A.; Trlica, A.; Hagarty, B.; Williams, T.; Wolt, J. MEta-Analysis of Enhanced Efficiency Fertilizers in Corn Systems in the Midwest. International Plant Nutrition Institute Report. 2015. Available online: http://research.ipni.net/project/IPNI-2014-USA-4RM06 (accessed on 24 January 2017).
- Bremner, J.M.; Blackmer, A.M. Effects of acetylene and soil water content on emission of nitrous oxide from soils. Nature 1979, 280, 380–381. [Google Scholar] [CrossRef]
- Aulakh, M.S.; Rennie, A.; Paul, E.A. Acetylene and N-Serve effects upon N2O emissions from NH4+ and NO3− treated soils under aerobic and anaerobic conditions. Soil Biol. Biochem. 1984, 16, 351–356. [Google Scholar] [CrossRef]
- Bronson, K.F.; Mosier, A.R.; Bishnoi, S.R. Nitrous oxide emissions in irrigated corn as affected by nitrification inhibitors. Soil Sci. Soc. Am. J. 1992, 56, 161–165. [Google Scholar] [CrossRef]
- Delgado, J.A.; Mosier, A.R. Mitigation alternatives to decrease nitrous oxides emissions and urea-nitrogen loss and their effect on methane flux. J. Environ. Qual. 1996, 25, 1105–1111. [Google Scholar] [CrossRef]
- Weiske, A.; Benckiser, G.; Herbert, T.; Ottow, J.C.G. Influence of the nitrification inhibitor 3,4-dimethylpyrazole phosphate (DMPP) in comparison to dicyandiamide (DCD) on nitrous oxide emissions, carbon dioxide fluxes and methane oxidation during 3 years of repeated application in field experiments. Biol. Fertil. Soils 2001, 34, 109–117. [Google Scholar] [CrossRef]
- O’Callaghan, M.; Gerard, E.M.; Carter, P.E.; Lardner, R.; Sarathchandra, U.; Burch, G.; Ghani, A.; Bell, N. Effect of the nitrification inhibitor dicyandiamide (DCD) on microbial communities in a pasture soil amended with bovine urine. Soil Biol. Biochem. 2010, 42, 1425–1436. [Google Scholar] [CrossRef]
- Omonode, R.A.; Vyn, T.J. Nitrification kinetics and nitrous oxide emissions when nitrapyrin is coapplied with urea-ammonium nitrate. Agron. J. 2013, 105, 1475–1486. [Google Scholar] [CrossRef]
- Aita, C.; Gonzatto, R.; Miola, E.C.C.; dos Santos, D.B.; Rochette, P.; Angers, D.A.; Chantigny, M.H.; Pujol, S.B.; Giacomini, D.A.; Giacomini, S.J. Injection of dicyandiamide-treated pig slurry reduced ammonia volatilization without enhancing soil nitrous oxide emissions from no-till corn in southern Brazil. J. Environ. Qual. 2014, 43, 789–800. [Google Scholar] [CrossRef] [PubMed]
- Fisk, L.M.; Maccarone, L.D.; Barton, L.; Murphy, D.V. Nitrapyrin decreased nitrification of nitrogen released from soil organic matter but not amoA gene abundance at high soil temperature. Soil Biol. Biochem. 2015, 88, 214–223. [Google Scholar] [CrossRef]
- Frame, W. Ammonia volatilization from urea treated with NBPT and two nitrification inhibitors. Agron. J. 2017, 109, 378–387. [Google Scholar] [CrossRef]
- Randall, G.W.; Vetch, J.A. Corn production on a subsurface-drain Mollisol as affected by time of nitrogen application and nitrapyrin. Agron. J. 2003, 95, 1213–1219. [Google Scholar] [CrossRef]
- Ruser, R.; Schulz, R. The effect of nitrification inhibitors on the nitrous oxide (N2O) release from agricultural soils—A review. J. Plant Nutr. Soil Sci. 2015, 178, 171–188. [Google Scholar] [CrossRef]
- Ren, B.; Zhan, J.; Dong, S.; Liu, P.; Zhao, B.; Li, H. Nitrapyrin improves grain yield and nitrogen use efficiency of summer maize waterlogged in the field. Agron. J. 2017, 109, 185–192. [Google Scholar] [CrossRef]
- Kidwaro, F.M.; Kephart, K.D. Retention of nitrogen from stabilized anhydrous ammonia in the soil profile during winter wheat production in Missouri. Commun. Soil Sci. Plant Anal. 1998, 29, 481–499. [Google Scholar] [CrossRef]
- Gabrielson, K.D.; Epling, M.L. Reaction Products and Methods for Making and Using Same. US Patent No. 9,440,890, 13 September 2016. [Google Scholar]
- Vetsch, J.A.; Schwab, G.J. Corn grain yield as affected by the nitrification inhibitor KAS771G77. In Proceedings of the ASA, CSSA, & SSSA International Annual Meeting, Long Beach, CA, USA, 2–5 November 2014. [Google Scholar]
- Nelson, K.A. Pronitridine nitrification inhibitor with urea ammonium nitrate for corn. J. Agric. Sci. 2018, 10, 16–25. [Google Scholar] [CrossRef]
- Nathan, M.; Stecker, J.; Sun, Y. Soil Testing in Missouri. A Guide for Conducting Soil Testing in Missouri. Available online: http://soilplantlab.missouri.edu/soil/ec923.pdf (accessed on 6 June 2018).
- Lachat Instruments. Determination of Total Kjeldahl Nitrogen in Soil and Plants by Flow Injection Analysis; Food and Agriculture Organization of the United Nations: Loveland, CO, USA, 1996. [Google Scholar]
- Dobermann, A.R. Nitrogen Use Efficiency–State of the Art. 2005. Available online: http://digitalcommons.unl.edu/agronomyfacpub/316/ (accessed on 20 July 2016).
- MU Extension. Daily and Hourly Weather Query. Weather Database. 2017. Available online: http://agebb.missouri.edu/weather/history/report.asp?station_prefix=nov&start_month=1&end_month=1&start_day=1&end_day=1&start_year=2000&end_year=2017&period_type=1&convert=2&field_elements=70 (accessed on 4 January 2017).
- SAS Institute. SAS 9.4 Software. Available online: http://www.sas.com/en_us/software/sas9.html (accessed on 6 June 2018).
- Hoeft, R.G. Current status of nitrification inhibitor use in US agriculture. In Nitrogen in Crop Production; Hauck, R.D., Ed.; Food and Agriculture Organization of the United Nations: Madison, WI, USA, 1984; pp. 561–570. [Google Scholar]
- Liu, S.L.; Varsa, E.C.; Kapusta, G.; Mburu, D.N. Effect of etridiazol and nitrapyrin treated N fertilizers on soil mineral N status and wheat yields. Agron. J. 1984, 76, 265–270. [Google Scholar] [CrossRef]
- Barth, G.; von Tucher, S.; Schmidhalter, U. Influence of soil parameters on the effect of 3,4-dimethylpyrazole-phosphate as a nitrification inhibitor. Biol. Fertil. Soils 2001, 34, 98–102. [Google Scholar]
- Habibullah, H.; Nelson, K.A.; Motavalli, P.P. Assessing management of nitrapyrin with urea ammonium nitrate fertilizer on corn yield and soil nitrogen in a poorly-drained soil. J. Agric. Sci. 2017, 9, 17–29. [Google Scholar] [CrossRef]
- Hawkesford, M.J. Reducing the reliance on nitrogen fertilizer for wheat production. J. Cereal Sci. 2014, 59, 276–283. [Google Scholar] [CrossRef] [PubMed]
- Maharjan, B.; Ferguson, R.B.; Slater, G.P. Irrigated corn productivity as influenced by nitrogen source, rate, and climatic conditions. Agron. J. 2017, 109, 1–9. [Google Scholar] [CrossRef]
- Mohammed, Y.A.; Chen, C.; Jensen, T. Urease and nitrification inhibitors impact on winter wheat fertilizer timing, yield and protein content. Agron. J. 2016, 108, 905–912. [Google Scholar] [CrossRef]
Figure 1.
Precipitation history for the study years of 2015 and 2016. The bars represent daily precipitation during the study year, the solid line represents the cumulative precipitation during the study year, and the dotted line represents the average cumulative precipitation from 2004 to 2014. Oct, October; Dec, December; Feb, February; Apr, April; Jun, June; Aug, August; Sep, September; Nov, November; Jan, January; Mar, March; Jul, July.
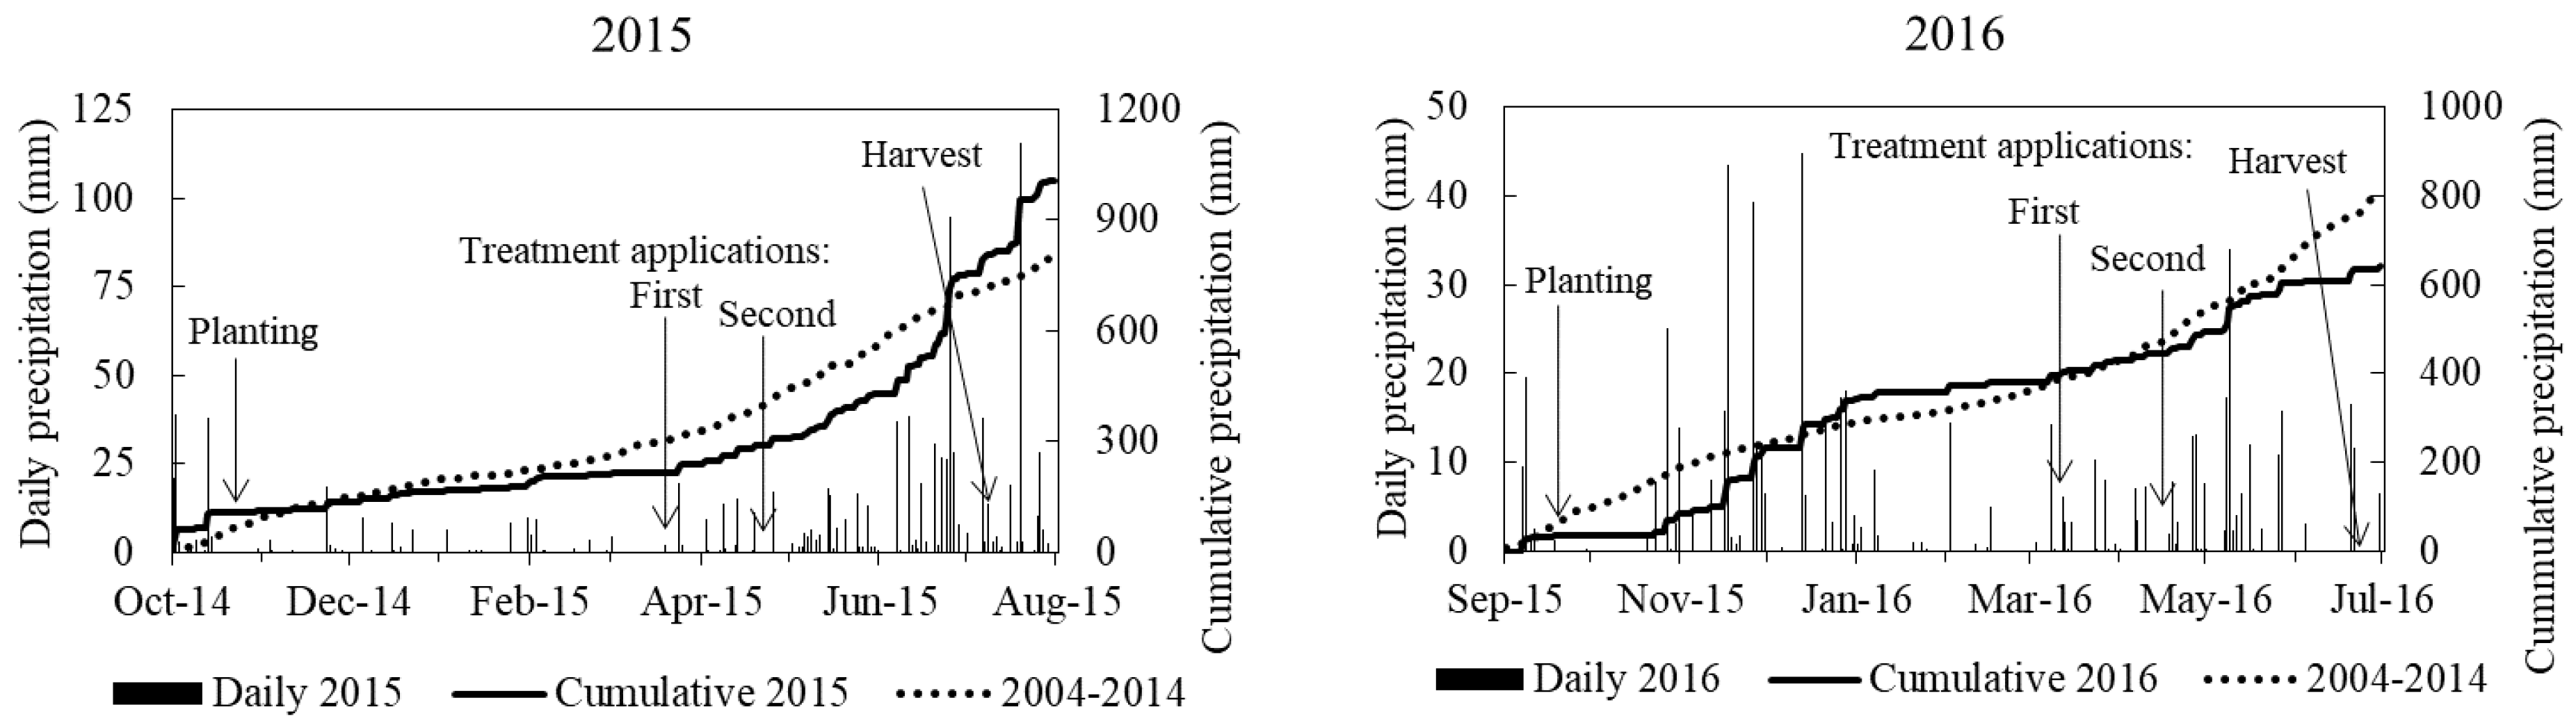
Figure 2.
Daily average air temperature (°C) for the years of 2015 and 2016. Sep, September; Dec, December; Mar, March; Jun, June.
Figure 2.
Daily average air temperature (°C) for the years of 2015 and 2016. Sep, September; Dec, December; Mar, March; Jun, June.

Figure 3.
Soil test nitrate–nitrogen (NO3–N) concentration at 0–15 (A) cm and 16–30 (C) cm depths, and soil test ammonium–nitrogen (NH4–N) at 0–15 (B) cm and 16–30 (D) cm depths one, two, and three months after application (MAA) of a 40:60 split application of urea ammonium nitrate (U) totaling 79 kg N ha−1. Vertical error bars represent plus one standard deviation. Abbreviations: pro, pronitridine; nitr, nitrapyrin; NTC, non-treated control; U, urea ammonium nitrate. Application samples after one month were only taken for the non-treated control and nitrapyrin treatments.

Figure 4.
Soil test nitrate–nitrogen (NO3–N) concentration at 0–15 (A) cm and 16–30 (C) cm depths, and soil test ammonium–nitrogen (NH4–N) at 0–15 (B) cm and 16–30 (D) cm depths one, two, and three months after application (MAA) of a 40:60 split application of urea ammonium nitrate (U) totaling 112 kg N ha−1. Vertical error bars represent plus one standard deviation. Abbreviations: pro, pronitridine; nitr, nitrapyrin; NTC, non-treated control; U, urea ammonium nitrate. Application samples after one month were not taken for UAN at 112 kg N ha−1.

Table 1.
Treatment, evaluation dates, and selected soil initial properties in 2015 and 2016.
| Treatment or Evaluations | 2015 | 2016 | ||
| Initial soil sampling | 19 March 2015 | 11 November 2015 | ||
| Planting | 21 October 2014 | 17 September 2015 | ||
| First N treatment application | 19 March 2015 | 10 March 2016 | ||
| First in-season soil sampling (1 MAA †) | 20 April 2015 | 15 April 2016 | ||
| Second N treatment application | 22 April 2015 | 15 April 2016 | ||
| Plant population | 20 April 2015 | 6 May 2016 | ||
| Second in-season soil sampling (2 MAA) | 18 May 2015 | 6 May 2016 | ||
| SPAD meter plant leaf readings | 27 May 2015 | 23 May 2016 | ||
| Dry aboveground biomass | 3 June 2015 | 31 May 2016 | ||
| Third in-season soil sampling (3 MAA) | 17 June 2015 | 9 June 2016 | ||
| Harvest | 7 July 2015 | 24 June 2016 | ||
| Selected Initial Soil Properties | ||||
| Study Year | 2015 | 2016 | 2015 | 2016 |
| Soil depth, cm | 0 to 15 | 0 to 15 | 16 to 30 | 16 to 30 |
| pH (0.01 M CaCl2) | 5.1 | 4.7 | 5.5 | 5.0 |
| Neutralizable acidity (NA), cmolc kg−1 | 4.5 | 9.4 | 4.1 | 7.0 |
| Cation exchange capacity (CEC), cmolc kg−1 | 16 | 22 | 17 | 23 |
| Bray 1 phosphorus (P), kg ha−1 | 22 | 8 | 73 | 14 |
| Exchangeable calcium (Ca), kg ha−1 | 3998 | 4048 | 4281 | 4679 |
| Exchangeable magnesium (Mg), kg ha−1 | 388 | 496 | 428 | 914 |
| Exchangeable potassium (K), kg ha−1 | 181 | 122 | 367 | 260 |
| Organic matter (OM), % | 2.8 | 2.2 | 3.2 | 2.6 |
| Nitrate–nitrogen (NO3–N), mg kg−1 | 4.1 | 1.5 | 19.4 | 3.0 |
| Ammonium-nitrogen (NH4–N), mg kg−1 | 4.4 | 4.1 | 9.7 | 6.2 |
† Abbreviations: One (1 MAA), two (2 MAA), and three (3 MAA) months after the first fertilizer application timing (19 March 2015 and 10 March 2016).
Table 2.
Analysis of variance table for plant response in 2015 and 2016 with determined probability values (Pr > F).
Table 2.
Analysis of variance table for plant response in 2015 and 2016 with determined probability values (Pr > F).
| Tissue | Plant | Grain | |||||||||
|---|---|---|---|---|---|---|---|---|---|---|---|
| SPAD | N Conc. | Biomass | N Uptake | REN † | Population | Moisture | Test Wt ‡ | Yield | |||
| Source | DF | Pr > F | Pr > F | Pr > F | Pr > F | Pr > F | DF | Pr > F | Pr > F | Pr > F | Pr > F |
| year | 1 | 0.0139 | <0.0001 | <0.0001 | 0.9865 | 0.9432 | 1 | <0.0001 | <0.0001 | <0.0001 | <0.0001 |
| year(rep) | 6 | 0.1934 | 0.1611 | 0.8803 | 0.3756 | 0.0500 | 8 | <0.0001 | <0.0001 | 0.0180 | <0.0001 |
| UAN rate | 1 | 0.1005 | 0.0002 | 0.0003 | <0.0001 | 0.2836 | 1 | 0.0659 | 0.0838 | 0.0641 | <0.0001 |
| Year × UAN rate | 1 | 0.5672 | 0.0707 | 0.0956 | 0.9889 | 0.9793 | 1 | 0.2068 | 0.2350 | 0.0181 | 0.0034 |
| NI and timing | 5 | 0.4857 | 0.1784 | 0.8763 | 0.5131 | 0.5325 | 5 | 0.2436 | 0.8221 | 0.5291 | 0.6620 |
| Year × NI and timing | 5 | 0.9357 | 0.3760 | 0.1139 | 0.0698 | 0.0005 | 5 | 0.0217 | 0.4280 | 0.4200 | 0.6478 |
| UAN rate × NI and timing | 5 | 0.3390 | 0.9643 | 0.0573 | 0.4743 | 0.5832 | 5 | 0.6408 | 0.8867 | 0.6318 | 0.8401 |
| Year x UAN rate × NI and timing | 5 | 0.8822 | 0.5412 | 0.0030 | 0.0367 | 0.1327 | 5 | 0.3593 | 0.7231 | 0.0236 | 0.7120 |
† Abbreviations: conc., concentration; DF, degrees of freedom; REN, recovery efficiency of nitrogen; ‡ Wt, weight; NI, nitrification inhibitor; UAN, urea ammonium nitrate.
Table 3.
Leaf SPAD meter readings, tissue N concentration, N recovery efficiency (REN), plant population, grain moisture, and yield response to urea ammonium nitrate (UAN) rates in 2015 and 2016. Data were combined over factors in the absence of significant interactions.
Table 3.
Leaf SPAD meter readings, tissue N concentration, N recovery efficiency (REN), plant population, grain moisture, and yield response to urea ammonium nitrate (UAN) rates in 2015 and 2016. Data were combined over factors in the absence of significant interactions.
| UAN rate | SPAD | Tissue N | REN † | Population | Moisture | Yield | |
|---|---|---|---|---|---|---|---|
| 2015 | 2016 | ||||||
| (kg N ha−1) | (g kg−1) | (%) | (No. m−2) | (g kg−1) | (Mg ha−1) | ||
| 0 | 31.6 | 8.0 | -- | 116 | 137 | 2.13 | 2.42 |
| 79 | 39.4 | 10.2 | 58.0 | 130 | 136 | 3.54 | 4.86 |
| 112 | 40.7 | 11.3 | 64.8 | 134 | 136 | 3.68 | 5.39 |
| LSD (p = 0.05) | 2.1 | 0.7 | NS | 7 | NS | 0.25 | |
† REN was calculated as: (Crop N uptake (+N source) − Crop N uptake (soil alone)) × 100/Total N applied [43]).
Table 4.
Plant population, nitrogen recovery efficiency (REN), and grain yield response to nitrification inhibitor treatments averaged over UAN rates in 2015 and 2016.
Table 4.
Plant population, nitrogen recovery efficiency (REN), and grain yield response to nitrification inhibitor treatments averaged over UAN rates in 2015 and 2016.
| Plant | Nitrogen Recovery | |||||
|---|---|---|---|---|---|---|
| Nitrification | NI | Population (No. m−2) | Efficiency (REN) † (%) | Grain Yield | ||
| Inhibitor (NI) | Timing | 2015 | 2016 | 2015 | 2016 | (Mg ha−1) |
| None | Early | 151 | 113 | 71 | 52 | 4.49 |
| Nitrapyrin | Early | 149 | 117 | 63 | 33 | 4.38 |
| Pronitridine | Early | 151 | 119 | 45 | 78 | 4.30 |
| None | Late | 147 | 113 | 53 | 78 | 4.35 |
| Nitrapyrin | Late | 151 | 117 | 89 | 44 | 4.33 |
| Pronitridine | Late | 133 | 120 | 46 | 85 | 4.37 |
| LSD (p = 0.05) | 6 | 31 | NS †† | |||
† REN was calculated as: (Crop N uptake (+N source) − Crop N uptake (soil alone)) × 100/Total N applied [43]. †† NS = not significant.
Table 5.
The effect of urea ammonium nitrate application rates, nitrification inhibitors, and timing of the nitrification inhibitor on tissue biomass yields, N uptake, and grain test weight. Data were combined over factors in the absence of significant interactions.
Table 5.
The effect of urea ammonium nitrate application rates, nitrification inhibitors, and timing of the nitrification inhibitor on tissue biomass yields, N uptake, and grain test weight. Data were combined over factors in the absence of significant interactions.
| Nitrification Inhibitor | NI Timing | Biomass Yield (Mg ha−1) | Plant N Uptake (kg N ha−1) | Test Weight (kg hL−1 ) | |||||||||
|---|---|---|---|---|---|---|---|---|---|---|---|---|---|
| 2015 | 2016 | 2015 | 2016 | 2015 | 2016 | ||||||||
| 79 † | 112 † | 79 † | 112 † | 79 † | 112 † | 79 † | 112 † | 79 † | 112 † | 79 † | 112 † | ||
| None | Early | 9.55 | 9.84 | 11.11 | 14.18 | 118 | 131 | 98 | 155 | 71.3 | 70.8 | 72.1 | 73.2 |
| Nitrapyrin | Early | 10.06 | 10.57 | 11.29 | 12.81 | 105 | 132 | 100 | 108 | 71.2 | 71.2 | 72.3 | 73.2 |
| Pronitridine | Early | 9.37 | 9.58 | 12.99 | 16.67 | 104 | 120 | 119 | 174 | 71.4 | 71.3 | 72.9 | 72.9 |
| None | Late | 10.19 | 10.19 | 13.29 | 13.20 | 111 | 127 | 121 | 132 | 71.2 | 71.7 | 72.5 | 72.5 |
| Nitrapyrin | Late | 9.59 | 12.65 | 12.71 | 11.89 | 112 | 182 | 115 | 113 | 71.3 | 71.0 | 72.4 | 72.8 |
| Pronitridine | Late | 9.34 | 9.75 | 10.02 | 13.87 | 102 | 123 | 101 | 133 | 71.1 | 71.2 | 72.5 | 72.4 |
| LSD (p = 0.05) | 2.28 | 40 | 0.8 | ||||||||||
† Nitrogen amount (kg N ha−1).
© 2018 by the authors. Licensee MDPI, Basel, Switzerland. This article is an open access article distributed under the terms and conditions of the Creative Commons Attribution (CC BY) license (http://creativecommons.org/licenses/by/4.0/).
Share and Cite
MDPI and ACS Style
Habibullah, H.; Nelson, K.A.; Motavalli, P.P. Management of Nitrapyrin and Pronitridine Nitrification Inhibitors with Urea Ammonium Nitrate for Winter Wheat Production. Agronomy 2018, 8, 204. https://doi.org/10.3390/agronomy8100204
AMA Style
Habibullah H, Nelson KA, Motavalli PP. Management of Nitrapyrin and Pronitridine Nitrification Inhibitors with Urea Ammonium Nitrate for Winter Wheat Production. Agronomy. 2018; 8(10):204. https://doi.org/10.3390/agronomy8100204
Chicago/Turabian StyleHabibullah, H., Kelly A. Nelson, and Peter P. Motavalli. 2018. "Management of Nitrapyrin and Pronitridine Nitrification Inhibitors with Urea Ammonium Nitrate for Winter Wheat Production" Agronomy 8, no. 10: 204. https://doi.org/10.3390/agronomy8100204
Note that from the first issue of 2016, this journal uses article numbers instead of page numbers. See further details here.