Article

Growth Performance and Antioxidant Enzyme Activities of Advanced Mutant Rice Genotypes under Drought Stress Condition

by
Zarifth Shafika Kamarudin
1,
Mohd Rafii Yusop
1,2,*,
Mahmud Tengku Muda Mohamed
1,
Mohd Razi Ismail
2 and
Abdul Rahim Harun
3
1
Department of Crop Sciences, Faculty of Agriculture, Universiti Putra Malaysia, 43400 UPM Serdang, Selangor, Malaysia
2
Institute of Tropical Agriculture and Food Security, Universiti Putra Malaysia, 43400 UPM Serdang, Selangor, Malaysia
3
Agrotechnology and Biosciences Division, Malaysian Nuclear Agency, 43600 Kajang, Selangor, Malaysia
*
Author to whom correspondence should be addressed.
Agronomy 2018, 8(12), 279; https://doi.org/10.3390/agronomy8120279
Submission received: 17 October 2018 / Revised: 2 November 2018 / Accepted: 3 November 2018 / Published: 26 November 2018

Abstract

:
Drought stress affects various physiological and metabolic processes in rice (Oryza sativa L.) plant. Non-availability of high-yielding varieties suitable for cultivation under drought condition lead towards a sharp decline in rice yield. Induce mutation is an essential auxiliary approach to counterpart conventional breeding to produce stress-tolerance rice variety. The current study was aimed to identify two advanced mutant rice genotypes as drought-tolerant using growth parameters and antioxidant enzyme activities. The advanced mutant rice genotypes, MR219-4 and MR219-9, showed a minimal reduction on all growth parameters, yield, and yield components measured for drought tolerance. MR219-4 had a slight reduction on total dry weight and chlorophyll content under drought stress condition. Proline content increased significantly in drought-tolerant rice genotypes and the highest proline content was obtained from MR219-4 followed by MR219-9 under drought stress. Catalase, ascorbate peroxidase, and guaiacol peroxidase activities were significantly increased in drought stress treatment in all the rice genotypes. MR219-4 and MR219-9 were identified as high-yielding drought-tolerant genotypes as they maintained good performance under drought stress condition for all the measured traits compared to the drought-tolerant check varieties, Aeron1 and MR219, thus, this might be underlying selection criteria for a drought tolerance rice breeding programme.

1. Introduction

The current status of climate change has led to a strong El Niño weather pattern that causes higher temperature, prolonged dry seasons, and severe drought, and thereby affects granary areas of Malaysia. Such environmental conditions are the major factors that limit the production of crop at a worldwide level. Approximately 40% of the world’s population is exaggerated by drought [1]. In Malaysia, about 114,324 hectares of land are affected by drought [2].
Rice (Oryza sativa L.) is widely cultivated mostly as a staple food crop. In Malaysia, the total area of growing rice is about 490,500 hectares, which is prominent to the production volume of rice, totalling approximately 1.77 million metric tons. However, rice yield, in contrast, is very low in the dry soil. It is essential to identify the changes in physiological and biochemical attributes in plants under drought stress to upsurge the yield of rice.
Drought effects are a high risk to rice production, especially in parts of Peninsular Malaysia. Drought inflicts osmotic stress to plants [3]. Drought stress disturbs water relations, causing a reduction in water-use efficiency [4]. Accumulation of proline that synthesized from l-glutamic acid with two enzymes of pyrroline-5-carboxylate (P5C) causes a mechanism that may store carbon and nitrogen and prevent dry mass production deficiency in plants. Several adaptive mechanisms have been developed within plants to counter the drought stress condition including the accumulation of compatible solutes such as proline [5]. There is evidence that higher levels of proline accumulation in plants are associated with greater tolerance in drought and stimulate oxidative stress tolerance by controlling antioxidant enzymes activities [6,7,8]. The accumulation of proline also shows a role in plant growth regulation under drought stress [9].
The antioxidant defence system in the plant cell comprises both enzymatic and non-enzymatic components. Drought has been shown to increase the activity of antioxidant enzymes such as catalase (CAT), ascorbate peroxidase (APX) and guaiacol peroxidase (GPX) [7,10,11]. These major reactive oxygen species (ROS)-scavenging antioxidant enzymes are crucial to remove the ROS in plant cells [12]. It was reported that antioxidant defence system components in plants were exaggerated differently depending on the degree of drought stress [7,13].
There is a cumulative sign that physiological and biochemical attributes had been significantly affected under drought stress. Therefore, it is crucial for better understanding the physiological and biochemical characteristics in plants to improve drought tolerance under drought stress. To identify drought-tolerant genotypes of advanced mutant rice lines, we examine the responses of drought-susceptible and drought-tolerant rice genotypes on physiological and biochemical parameters by determining the growth, contents of chlorophyll and proline, and activity of antioxidant enzymes in five rice genotypes subjected to drought stress, in which all these parameters can be used as selection criterion of secondary traits for drought tolerance in rice.

2. Materials and Methods

2.1. Plant Materials and Experimental Site

Five rice genotypes, including drought-susceptible variety (IR64), drought-tolerant variety (Aeron1), moderately drought-tolerant variety (MR219) and two advanced mutant rice genotypes (MR219-4 and MR219-9), were selected in this study. The experiment was conducted in a field located at Muda Agricultural Development Authority (MADA) Kota Sarang Semut, Kedah (latitude 6°13′10″ N, longitude 100°14′18″ E) in the northwest of Peninsular Malaysia. The experiment was conducted in two seasons, September 2012 (Season 1) and March 2013 (Season 2) (Figures S1 and S2). Soils at the experimental site were slightly acidic clay loam having organic matter (4%), sand (19%), silt (47%), and clay (37%) with pH 5 (1:1 water). Twenty-one-day-old rice seedlings of all genotypes were transplanted at one seedling per hill. Fertilizers were applied (120:70:80 N:P:K, kg ha−1) as per recommended rates by the International Rice Research Institute [14].

2.2. Experimental Layout

The experiment was conducted on the basis of split-plot randomized complete block design with four replications. The area of each main plot was 100 m2 in which, in one plot, plants were grown under favourable water condition with supplementary surface irrigation for the control treatment. For drought treatment, water was drained and irrigation was withheld to induce drought stress. All selected rice genotypes were randomly assigned to the 4 m2 subplots with spacing 20 cm planting distance within row.

2.3. Drought Stress Treatment

The plot for drought stress was drained at 25 days after transplanting (DAT) to expose plants to the drought stress (−30 kPa soil water tension). Five tensiometers were used in this experiment to determine the soil moisture tension. All tensiometers were inserted randomly at 30 cm depth in the soil of drought stress treatment. Re-irrigation was done periodically when soil water tension fell below −30 kPa. The plants were harvested during maturity.

2.4. Growth Measurement

2.4.1. Vegetative Growth

Plant height, number of tillers, and flag leaf area in four plants per genotypes for each treatment were recorded.

2.4.2. Dry Weight Production and Partitioning

Ten plants per treatment for each genotype were harvested at the end of the experiment and all plant parts were separated into culms, leaves, root, and panicles and dried into a constant weight. All dry weights of plant parts and total dry weight were determined.

2.5. Biochemical Analysis

Fresh leaf sample for each genotype per treatment was sampled at the peak of flowering stage (85 DAT) to determine the contents of chlorophyll, proline, and activity of antioxidant enzymes.

2.5.1. Chlorophyll Content Assay

Chlorophyll content was measured based on the method of [15]. Fresh leaf sample (0.2 g) was kept overnight in a 25 mL tube with 80% acetone at −10 °C. The mixture was centrifuged at 12,000× g for 10 min. The sample absorbance was recorded at 645 and 663 nm using a Shimadzu UV spectrophotometer.

2.5.2. Proline Content Assay

Proline content was determined based on [16]. Free proline was extracted from 0.2 g fresh leaf sample by keeping it in 3% (w/v) aqueous sulfosalicylic acid. The homogenate was centrifuged at 12,000× g for 15 min. The supernatant was collected and incubated with 2 mL ninhydrin reagent at 100 °C for 1 h, and then rapidly frozen in an ice bath. The red-coloured reaction mixture was discarded using toluene (4 mL), and the mixture was left for 10 min. The absorbance was recorded at 520 nm.

2.5.3. Enzyme Extract Preparation and Antioxidant Enzymes Assay

Enzyme extraction was measured based on [17]. Fresh leaf sample (0.5 g) was with 5 mL of 50 mM potassium phosphate buffer (Promega Corporation, Madison, WI, USA) (pH 7.8) containing 0.4 M ethylenediaminetetraacetic acid (EDTA), 1 M ascorbate and 2% (w/v) polyvinylpyrrolidone. The crude mixture was homogenized at 15,000 rpm for one minute and centrifuged at 15,000× g for 20 min. The supernatant was used for enzyme activity assays. CAT (EC: 1.11.1.6) activity was assayed according to [17]. APX (EC: 1.11.1.11) activity was assayed based on [18] methodology and GPX (EC: 1.11.1.7) activity was assayed according to [19].

2.6. Yield and Yield Components

Grain yield, 1000 grain weight, spikelets per panicle, and harvest index of each rice genotype in each treatment were analysed at the final harvest.

2.7. Statistical Analysis

The mean data for all observations were compiled in each season by taking average value over randomly selected plants from all the replications. The data were subjected to analysis of variance to determine the level of variation of all observed parameters using the Statistical Analysis System (SAS) programme (version 9.4, SAS Institute Inc. Cary, NC, USA). The mean differences were performed using Duncan’s New Multiple Range Test (DNMRT).

3. Results

3.1. Plant Height, Number of Tillers, and Flag Leaf Area

The combined analysis of variance (ANOVA) for vegetative growth data of rice genotypes over two seasons was presented in Table 1. The main effects due to the seasons (S), water treatments (W), genotypes (G), G × S interaction, G × W interaction, and G × S × W interaction were found to be highly significant for plant height, number of tillers and flag leaf area except for S and G × S × W interaction which were found to be significantly different for plant height and number of tillers, respectively. Drought stress caused significant reductions in plant height, number of tillers, and flag leaf area in all the genotypes. Plant height was significantly reduced under drought stress treatment for both seasons. At the control and drought stress treatments, the tallest plants (101.8 and 105.7 cm) were attained in Aeron1 and the shortest plants (84.1 and 82.0 cm) in IR64, for both seasons, respectively (Table 2). The drought-susceptible genotype showed the greatest reduction in number of tillers under drought stress treatment at both seasons. MR219-4 and Aeron1 had the lowest reduction in number of tillers under drought stress treatment at season 1, while at season 2, Aeron1 shown the lowest reduction in number of tillers under drought stress treatment compared to the control treatment. At the drought stress, flag leaf area had a significant reduction in all the genotypes as compared to the control for both seasons. The highest flag leaf area under drought stress treatment for season 1 (40.7 cm) and season 2 (39.9 cm) was obtained in MR219-4.

3.2. Culms and Leaves Dry Weight, Panicles Dry Weight, and Total Dry Weight

The combined analysis of variance over the seasons have shown a significant differences for S, W, S × W interaction, G, G × S interaction, G × W interaction, and G × S × W interaction for all the traits (Table 3). Drought stress also caused significant reductions in culms and leaves dry weight, panicles dry weight, and total dry weight of all the rice genotypes (Table 4). The drought stress treatment significantly decreased culms and leaves dry weight at both seasons compared to that of the control treatment. The drought-susceptible genotype, IR64, showed the greatest reduction in culms and leaves dry weight and panicles dry weight under drought stress treatment at both seasons. MR219-4 had the lowest reduction in culms and leaves dry weight and had the highest value of panicles dry weight at season 1 and season 2 under drought stress treatment compared to that of the control treatment. The total dry weight was significantly lower at season 1 (17%) and season 2 (11%) under drought stress treatment compared to the control treatment. MR219-4 had the lowest reduction in total dry weight at both seasons indicating that this advanced mutant line had the greatest total dry weight than the other rice genotypes in the drought stress treatment.

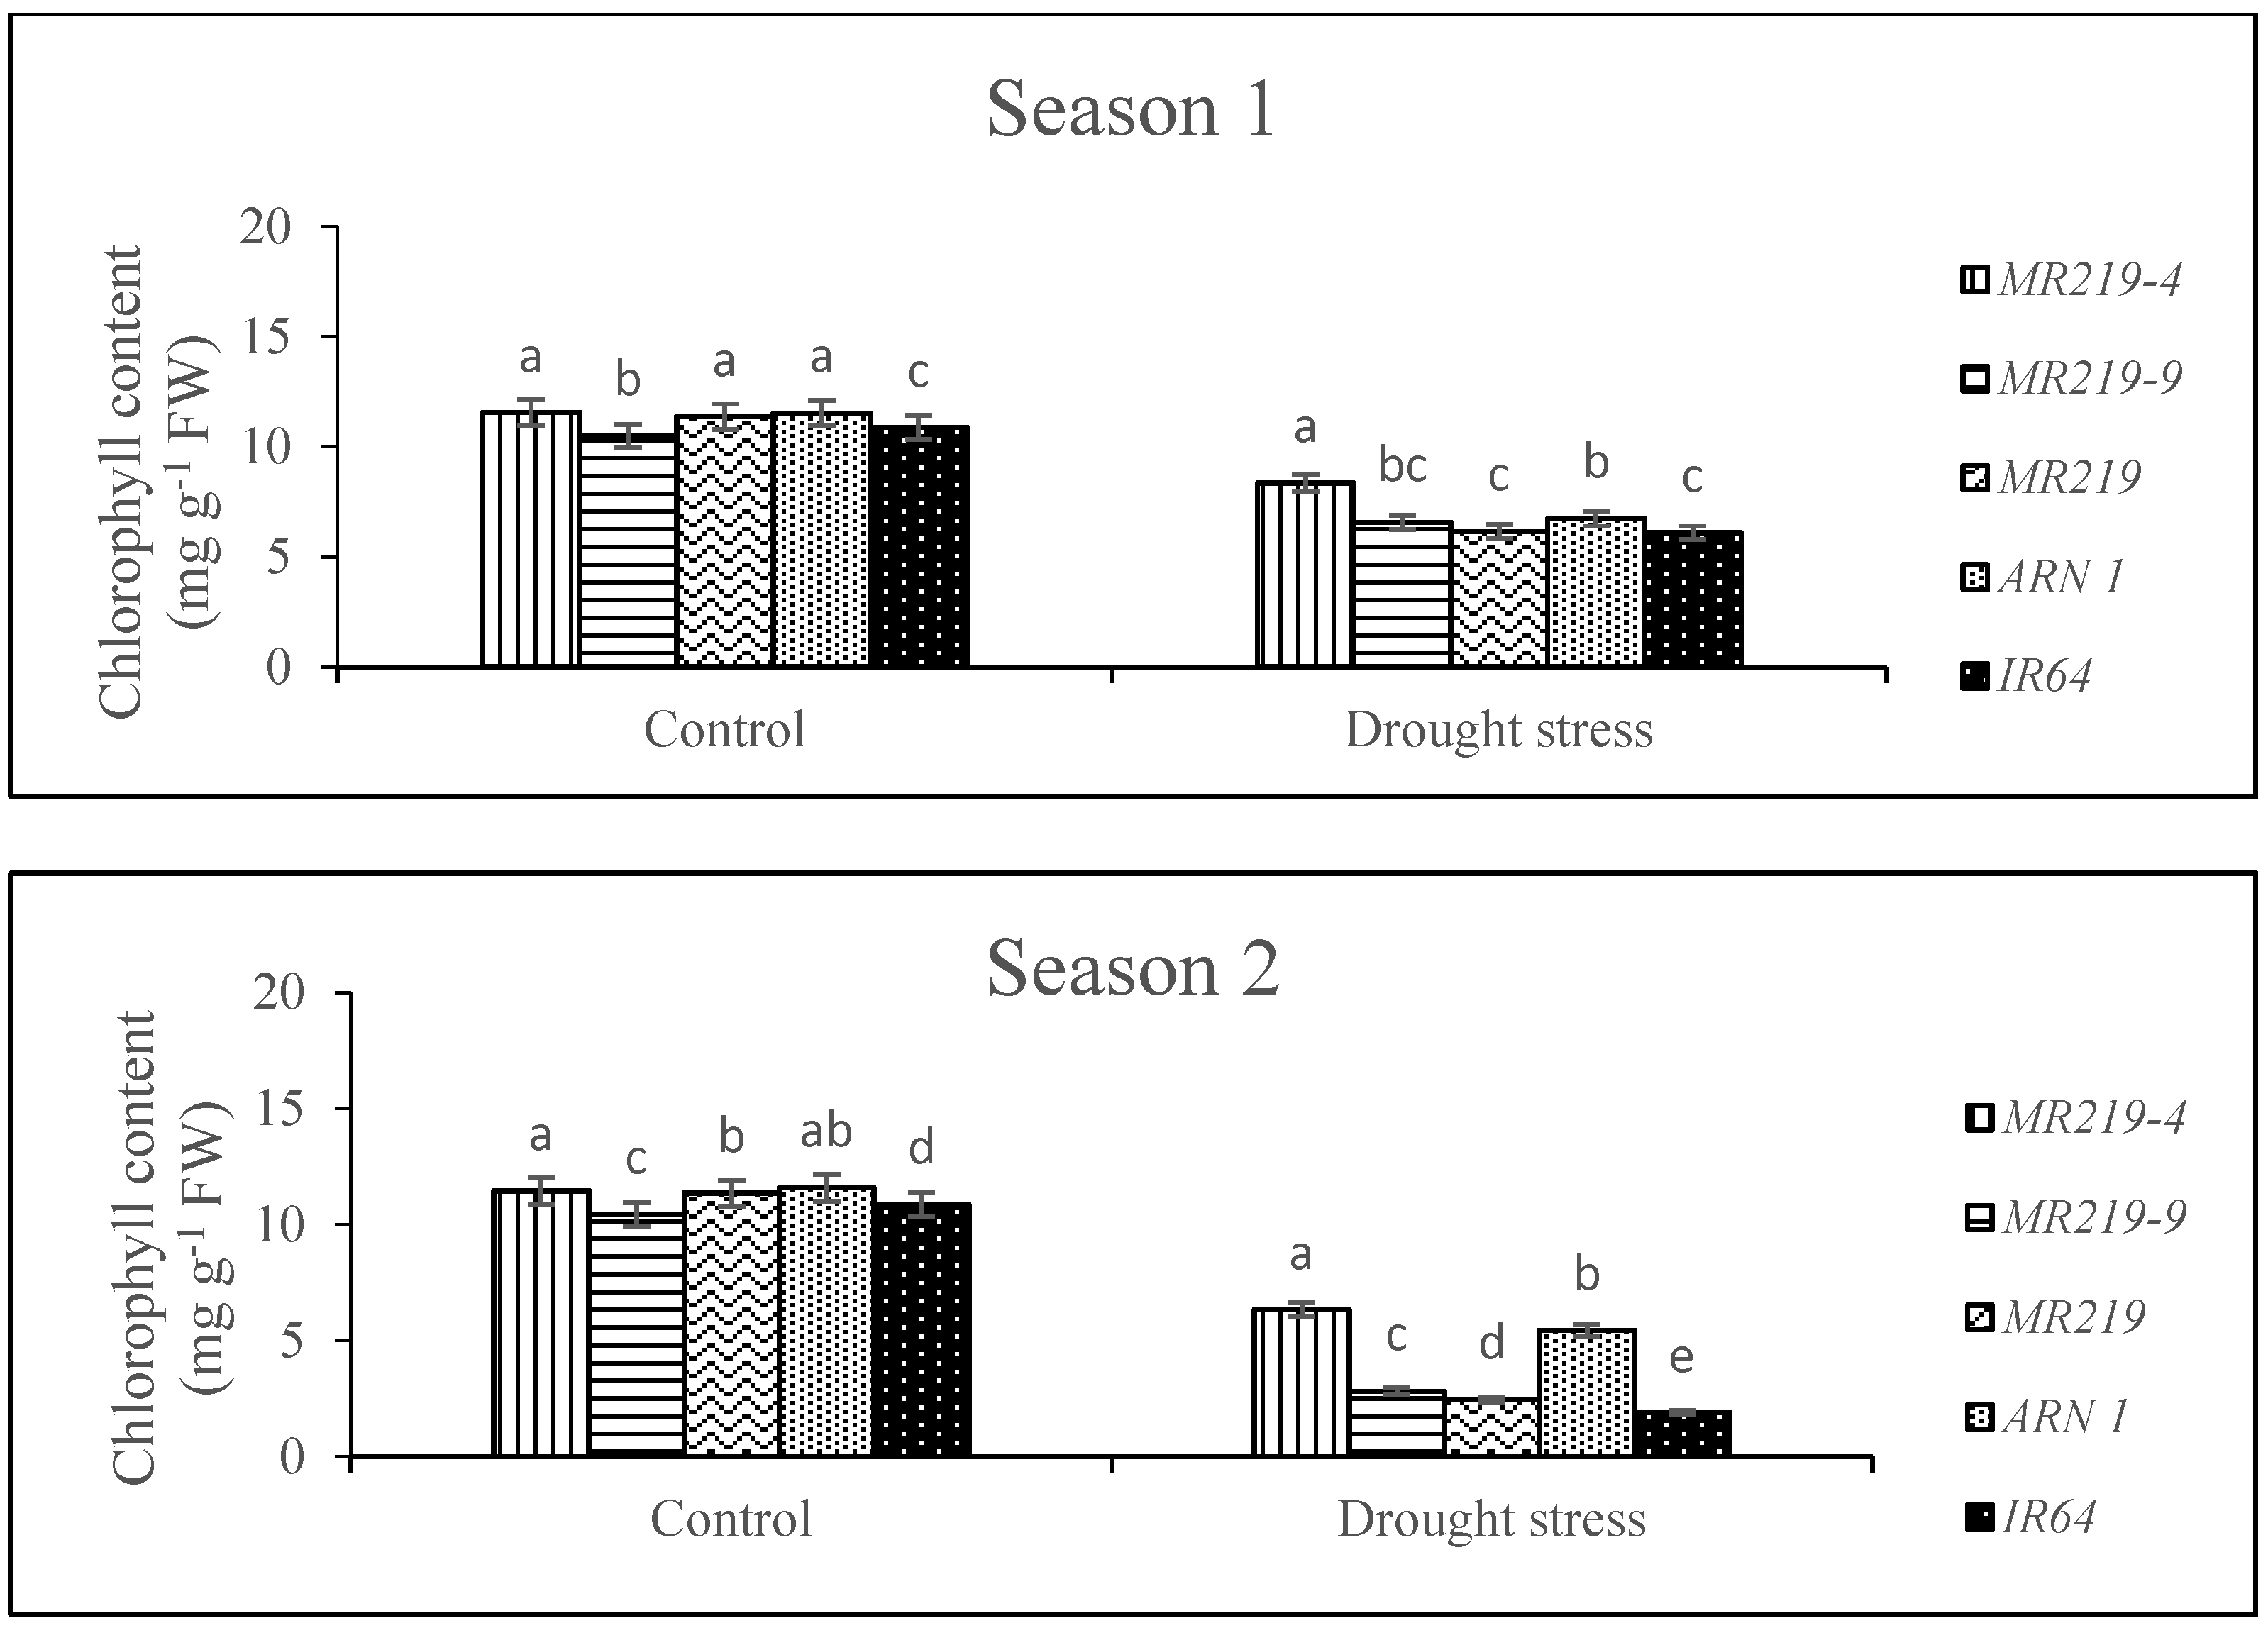
3.3. Chlorophyll Content

The pooled data of the two seasons indicates a highly significant difference for S, W, S × W interaction, G, G × S interaction, G × W interaction, and G × S × W interaction (Table 5). Relative chlorophyll content was significantly decreased in drought stress treatment compared to the control treatment at season 1 and season 2 (Figure 1). Relative chlorophyll content at season 2 showed a greater decrease in drought stress treatment (49%) followed by relative chlorophyll content at season 1 (24%) compared to that of the control treatment plants. The results showed that the drought-susceptible rice genotype, IR64, had the lowest relative chlorophyll content under drought stress treatment at both seasons, while MR219-4 had the highest value in relative chlorophyll content under drought stress and control treatments at season 1 and season 2 as compared to other rice genotypes.

3.4. Proline Content

The pooled analysis of variance over the two seasons for proline content was highly significantly different in S, W, S × W interaction, G, G × S interaction, G × W interaction, and G × S × W interaction (Table 5). Figure 2 shows that the proline content greatly increased 38% and 42% in drought stress treatment compared to the control treatment at season 1 and season 2, respectively. Plants subjected to the control treatment produced the lowest proline content than in drought stress treatment at both seasons. The results showed that MR219-4 had the highest proline content than the other rice genotypes in the drought stress and control treatments.

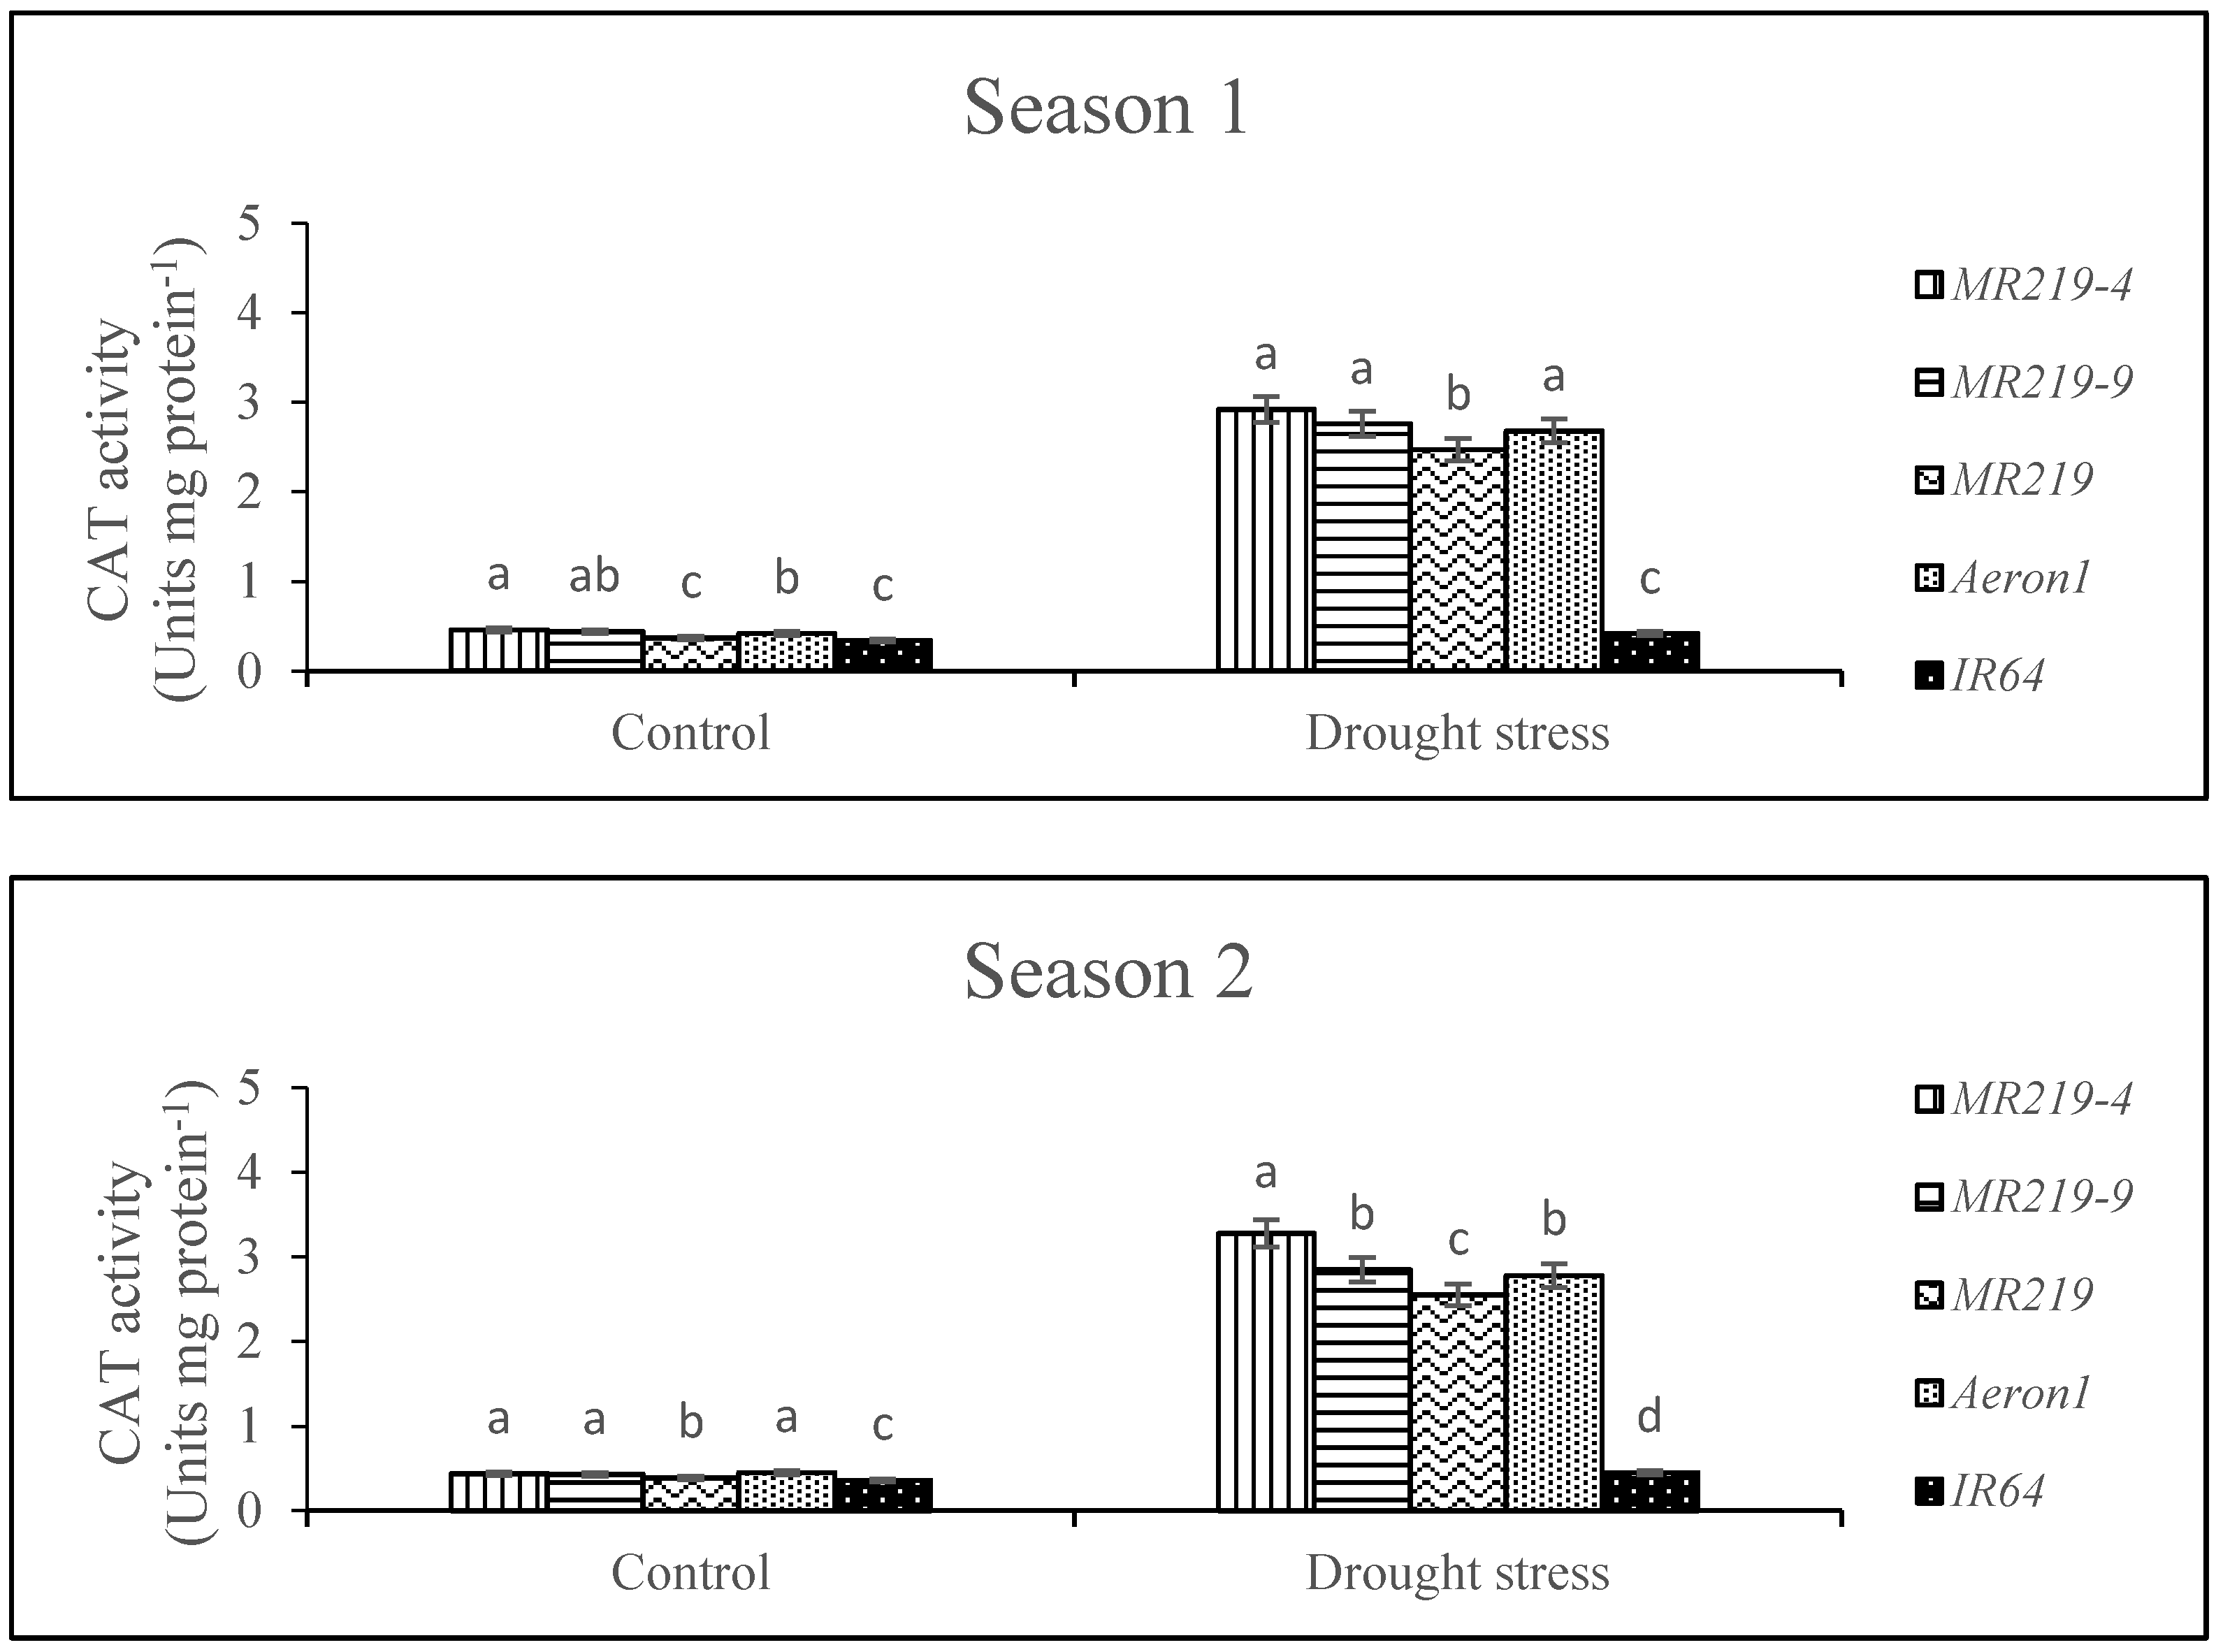
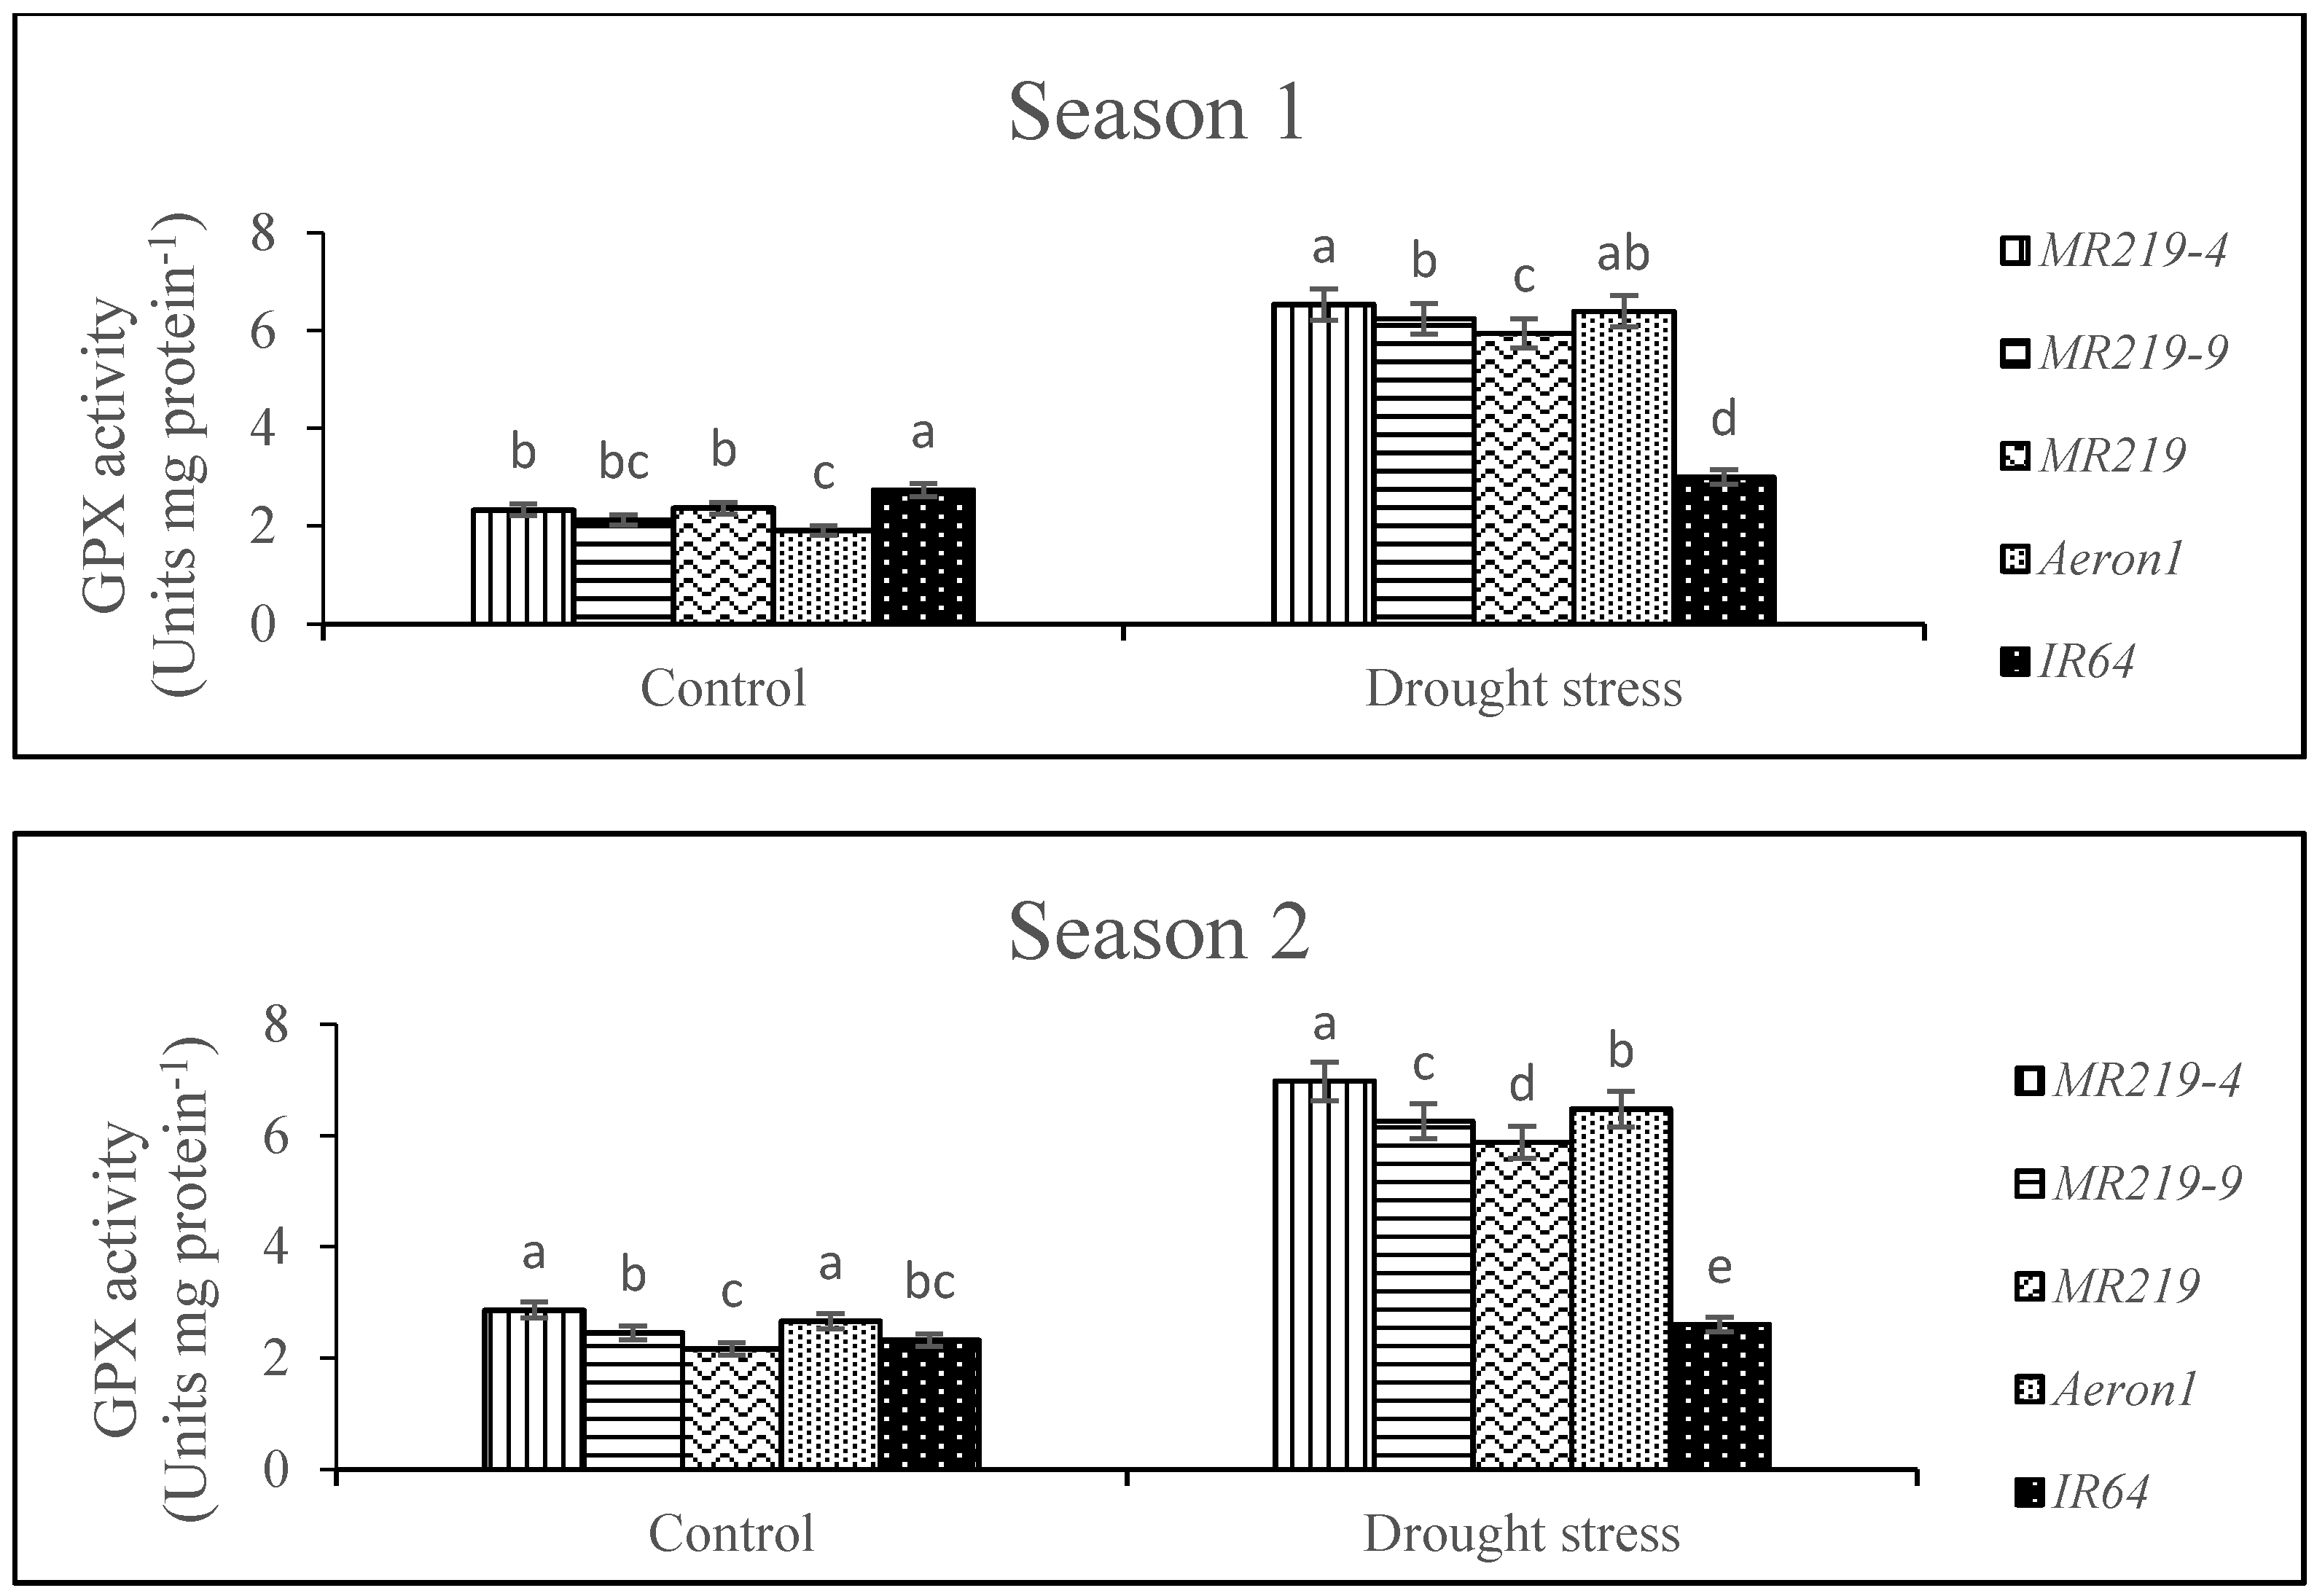
3.5. Activities of Antioxidant Enzymes

The antioxidant enzymes activities including CAT, APX, and GPX were measured to examine whether drought stress inclined the major ROS-scavenging mechanisms in advanced mutant rice genotypes. The pooled data over the two seasons showed that a significant difference was recorded as the result of S, W, S × W interaction, G, G × S interaction, G × W interaction, and G × S × W interaction (Table 5). At season 1, drought stress treatment increased (1.84 unit mg/protein) in CAT activity compared to control (Figure 3). Leaf CAT activity was also increased (1.97 unit mg/protein) in drought stress compared to the control treatment at season 2. From the results, it shows that APX activity increased in drought stress. Plants subjected to drought stress treatment at season 1 and season 2 increased by 1.6 unit mg/protein and 1.9 unit mg/protein, respectively, compared to the control treatment (Figure 4). Plants with drought stress treatment at season 2 recorded the highest GPX activity than in drought stress treatment at season 1. On the other hand, the control treatment at season 2 exhibited the lowest GPX activity than in the control treatment at season 1 (Figure 5). Overall, the drought-susceptible genotype, IR64, showed the lowest CAT, APX, and GPX activities under drought stress at both seasons. In contrast, MR219-4 had the highest CAT, APX, and GPX activities under drought stress at both seasons, which indicates the superiority in drought tolerance characteristics.

3.6. Yield and Yield Components

The pooled analysis of variance for the two seasons showed a significant difference on S, W, S × W interaction, G, G × S interaction, G × W interaction, and G × S × W interaction for grain yield, 1000 grain weight, spikelets/panicle, and harvest index were significantly different except S × W, G and G × S × W interaction for harvest index (Table 6).
The average grain yield/plant under control condition ranged from 30.52 g (Aeron1) to 59.81 g (MR219-9) and 46.22 g (IR64) to 92.17 g (MR219-9) at season 1 and season 2, respectively. The average grain yield/plant under drought stress condition varied from 24.73 (IR64) to 35.03 g (MR219) and 29.89 g (IR64) to 65.49 g (MR219-9) at season 1 and season 2, respectively (Table 7). The results indicated that MR219-9 was superior to the other genotypes under well-watered and drought stress conditions. The average for 1000 grain weight of all the genotypes was reduced from 27.70 g in control condition to 25.98 g in drought stress condition at season 1, while the 1000 grain weight at season 2 was reduced from 27.08 g in control condition to 24.99 g in drought stress condition. MR219-4 and MR219-9 showed the highest 1000 grain weight under drought stress condition compared to the other rice genotypes at both seasons.
From the results in Table 7, the spikelets/panicle decreased in drought stress condition. Plants subjected to drought stress treatment at season 1 and season 2 decreased 8 and 6, respectively, in spikelets/panicle compared to the control treatment. Plants under drought stress condition at season 2 recorded the highest harvest index than at season 1 (Table 7). On the other hand, rice genotypes of control condition at season 1 exhibited the lowest harvest index values than in control condition at season 2.

4. Discussion

4.1. Effects of Drought on Rice Vegetative Growth

The reduction in all growth parameters indicated that drought stress is one of the main factors which influence growth and development in rice plants. The detrimental effects in the growth parameters might be due to the limited soil moisture content [20]. Drought stress treatment had reduced plant height and number of tillers, which ascribed to the reduction in cell turgor thus inhibiting the process of division and expansion of cells. These observations are consistent with the findings by [21]. The decline in flag leaf area apparently ascribed to the small size of the leaf, senescence of leaf, and decrease in the leaf emergence rate [22]. The patterns of plant height and number of tillers differed among the five rice genotypes. The results showed that MR219-4 and MR219-9 had slightly significantly decreased in plant growth parameters compared to the other rice genotypes under drought stress condition for both seasons (Table 2). This could be the result of higher ability in water and nutrient uptake of these two advanced mutant rice lines and the higher stomatal conductance, and ultimately photosynthesis.

4.2. Effects of Drought Stress on Dry Weight Production and Partitioning

The plant’s productivity is determined in part by the photosynthates allocation between organs [23]. Drought stress can differently influence the growth of each plant organ and change the dry mass accumulation pattern within the plants [24]. In the present study, drought stress decreased the total dry weight. Table 4 indicates that a small proportion of photosynthates was allocated to upper ground parts under drought stress, which meant that plants tenderly decreased assimilates allocation to culms and leaves rather than roots [25]. The plants had invested small dry mass in culms and leaves growth under lower soil moisture content, thus reducing the loss of water from transpiration process and ensuring the competitiveness level in higher survival. The lower culms and leaves dry weight under drought stress could be ascribed to the lower osmotic adjustment in leaf than in root cells [26]. The results of the present study are in agreement with the findings by [27] on wheat and [28] on rice. The present study showed that drought stress decreased the culms and leaves dry weight (Table 4). This might be associated with the inhibition of leaf cell expansion. The reduction in culm and leaf growth under drought stress was reported by [28] where the leaf parameters such as leaf length, leaf surface, and number of tillers were lower in 60% drought index. It has been reported by [26] that the size of the culms was reduced and fewer leaf cells contributed to the elongation process in plants exposed to drought stress. However, MR219-4 and Aeron1 had the lowest reduction in culms and leaves dry weight under drought stress treatment, indicating that these genotypes did not have greater effects by drought for this trait. Similar results were also found in panicles dry weight and total dry weight traits, where MR219-4 showed tolerance to drought stress as it showed a small reduction in both trait values between control and drought stress treatments.

4.3. Effects of Drought Stress on Chlorophyll Content

The reduction in relative chlorophyll content was possibly associated with the oxidative damage development in the chloroplast and also caused the lipid membrane peroxidation of the thylakoids to induce and, thus, degradation of chlorophyll [29]. Drought stresses resulted in reduced chlorophyll content in leaves which might be associated with an increase in chlorophyll density [30]. Although no measurements of chlorophyll density were made directly in the present study, this factor could possibly lead to a reduction in chlorophyll content. The reduced chlorophyll is constantly correlated with the deficiency of photosynthesis [31]. This result is in agreement with the findings of [32], who reported that drought stress decreased chlorophyll content and affected the photosynthetic rate. In the present study, MR219-4 showed the highest chlorophyll content among the rice genotypes under drought stress condition (Figure 1), resulting in little-changed chlorophyll content between control and drought stress conditions, hence indicating that this genotype had higher photosynthetic efficiency than its parent, MR219I, and other genotypes studied.

4.4. Effects of Drought Stress on Proline Content

It was stated that drought stress leads to an increase in proline accumulation [5]. Increase in proline content helped to maintain tissue water status and avoid a reduction in cell damages induced by water deficit or drought stress. Accordingly, cell damage attributed to the reduction in active and reactive oxygen species [33]. The increase in proline under drought stress suggests that low water potential in plants had triggered proline accumulation. This result is similar to the findings by [32], who reported that low water potential induces cell membrane damage and enzyme inactivation resulted in electrolytes loss. Proline accumulation normally occurs in the cytosol and resulted in cytoplasmic osmotic adjustment. In the present study, increased proline content was found in the drought stress plants (Figure 2), especially in the advanced mutant rice genotypes, MR219-4 and MR219-9. These genotypes had a higher accumulation of proline under drought stress compared to the other rice genotypes and thus attributed to their high tolerance efficiency to drought stress. This result is consistent with that reported by [34], who found that several upland rice types exposed to water stress had increased proline content.

4.5. Effects of Drought Stress on Activity of Antioxidant Enzymes

CAT activity was increased in leaves during drought stress, suggested that they adapted for scavenging the production of photorespiratory H2O2. This result is supported by other reports on increased activities of antioxidant under drought stress, indicating that drought stress might result in increased antioxidant activities [32,34,35]. In this study, MR219-4 and MR219-9 showed higher CAT activity among rice genotypes under drought stress treatment (Figure 3), which might be attributed to the enzyme synthesize activated or the changing of enzyme subunits association under drought stress condition. The increases in APX activities might be associated with photosynthetic pigments, resulting in excess energy intercepted. However, this increment could create a significant protection mechanism in plants against oxidative damage [7]. The marked increase in APX activity in the leaves of drought stress treatment compared to control provides an indication of the significance of APX in the mechanism of antioxidative defense of rice plants against drought stress effects. In the plant cell, APX is known as the most widely distributed antioxidative enzymes which reduce H2O2 [36]. In the present study, both advanced mutant rice lines, MR219-4 and MR219-9, had higher APX activity under drought stress condition than other rice genotypes (Figure 4). This suggested that the higher APX activity in MR219-4 and MR219-9 leaves could be ascribed to the chloroplast-located enzyme of leaf tissues. It was reported that GPX was enabled to decrease H2O2 accumulation and remove malondialdehyde (MDA) [34]. Drought stress increased the activity of GPX gradually compared to the plants under the control treatment (Figure 5). The present study also suggested that GPX activity increment might be a key for H2O2 decomposition, especially under inactivation of CAT [35]. These responses were consistent with the findings of [37] in some traditional rice of India.

4.6. Effects of Drought Stress on Yield and Yield Components

Grain yield decreased proportionally to the drought stress treatment for both seasons (Table 7). Grain yield was reduced as a result of lower amount of water supplied. In the present study, the reduction in grain yield might be attributed to the reduction in 1000 grain weight and spikelets/panicle as a result of low soil moisture content during booting and flowering stages. [38] reported that water shortage just prior and during early flowering reduced the number of fertile spikelets and resulted in decreased final grain yield production. Furthermore, an increase in soil–water tension during the reproductive stage would increase abortion of spikelets and resulted in a reduction in spikelets number per panicle [39]. Hence, decrease grain yield might also be associated with the reduction in leaf area, lower photosynthetic rates, and high evaporation demand [23,28]. The harvest index is the fraction of total dry matter and grain weights; for cereals in general, when the grain fills only at the end of the crop’s life, it is expected that late stress will decrease the harvest index more than early stress. However, the effect of stress on grain filling has been suggested to be limited [38]. Moderate drought stress did not result in a change of the harvest index of crops but severe drought stress does, where it caused harvest index to decrease [39]. In this study, drought stress had no effect on harvest index for most of the evaluated genotypes studied, as the means between control and drought stress were not significantly different. Hence, it might be due to the level of stress that is moderate stress, which did not result in a change of the harvest index. According to [40], drought stress had reduced yield in rice. In this study, drought stress did not affect grain yield/plant for MR219-4, MR219 and Aeron1, except for MR219-9 and IR64 (Table 7). This result might be due to the fact that MR219-4 can be considered as drought-tolerant.

5. Conclusions

It is clear that drought stress greatly influences physiological functions and biochemical activities that affect plant growth. CAT, APX, and GPX increased under drought stress condition, indicating that these antioxidant enzymes were capable of protecting plant cells from the oxidative damage. Similarly, proline synthesis increased under drought stress condition, indicating that proline also was capable of acting as part of a survival mechanism under drought stress condition. It is marked that the combination of different traits could be responsible for the drought tolerance. These findings may provide useful knowledge on secondary traits as selection criteria for drought tolerance in rice. Based on the performance of growth, yield, and biochemical attributes, MR219-4 showed the highest tolerance to drought, followed by MR219-9, than the other check variety rice genotypes. Therefore, MR219-4 and MR219-9 were identified as drought-tolerant genotypes. This finding needs further research to improve advanced mutant rice lines, MR219-4 and MR219-9, for drought stress tolerance in Malaysian rice breeding programmes.

Supplementary Materials

The following are available online at https://www.mdpi.com/2073-4395/8/12/279/s1, Figure S1: Weekly maximum, mean, minimum temperature and weekly rainfall (Experimental period of season 1 conducted at MADA Practical Complex of Alor Serdang in 2012; Horizontal shaded bar indicates flowering time of all genotypes), Figure S2: Weekly maximum, mean, minimum temperature and weekly rainfall (Experimental period of season 2 conducted at MADA Practical Complex of Alor Serdang in 2013; Horizontal shaded bar indicates flowering time of all genotypes.

Author Contributions

Z.S.K., M.R.Y. and A.R.H. set up the research and designed the experiment; Z.S.K. analyzed and interpreted the data, and wrote the manuscript; M.R.Y., M.T.M.M. and M.R.I. supervised the experiment and interpreted the data; M.R.Y. was responsible for the manuscript revision.

Funding

The authors would like to acknowledge the Higher Institution Centre of Excellent (HICoE) Research Grant, Ministry of Education, Malaysia, for the financial support to conduct research activities on Improvement of rice varieties for adaptation to climate change.

Acknowledgments

The authors would like to thank Malaysian Nuclear Agency and Malaysian Agricultural Research and Development Institute for providing seed materials in this study.

Conflicts of Interest

The authors declare no conflict of interest.

References

  1. GIEWS—Global Information and Early Warning System. Available online: http://www.fao.org/giews/countrybrief/country.jsp?code=MYS (accessed on 15 December 2017).
  2. Tiara, H.; Erik, H.M.; Asgar, A.W. Rice production and climate change: A case study of Malaysian rice. Pertanika J. Trop. Agric. Sci. 2015, 38, 321–328. [Google Scholar]
  3. Dortje, G.; Chao, L.; Harikrishnan, M.; Nina, P. Tolerance to drought and salt stress in plants: Unraveling the signaling networks. Front. Plant Sci. 2014, 5, 1–10. [Google Scholar] [CrossRef]
  4. Farooq, M.; Hussain, M.; Abdul, W.; Siddique, K.H.M. Drought stress in plants: An overview. In Plant Responses to Drought Stress from Morphological to Molecular Features; Springer: Berlin/Heidelberg, Germany, 2012; pp. 1–33. ISBN 978-3-642-32653-0. [Google Scholar]
  5. Joseph, E.A.; Radhakrishnan, V.V.; Mohanan, K.V. A Study on the accumulation of proline-an osmoprotectant amino acid under salt stress in some native rice cultivars of North Kerala, India. Univers. J. Agric. Res. 2015, 3, 15–22. [Google Scholar] [CrossRef]
  6. Pallavi, S.; Rama, S.D. Drought induces oxidative stress and enhances the activities of antioxidant enzymes in growing rice seedlings. Plant Growth Reg. 2005, 46, 209–221. [Google Scholar] [CrossRef]
  7. Ahmed, C.B.; Rouina, B.B.; Sensoy, S.; Boukhris, M.; Abdallah, F.B. Changes in gas exchange, proline accumulation and antioxidative enzyme activities in three olive cultivars under contrasting water availability regimes. Environ. Exp. Bot. 2009, 67, 345–352. [Google Scholar] [CrossRef]
  8. Gregor, J.S.; Stefan, K.A. Osmotic adjustment under drougth conditions. In Plant Responses to Drought Stress; Springer: Berlin/Heidelberg, Germany, 2012; pp. 199–229. [Google Scholar]
  9. Sara, I.; Zandalinas, R.M.; Damián, B.; Vicent, A.; Gómez-Cadenas, A. Plant adaptations to the combination of drought and high temperatures. Physiol. Plant. 2017, 162, 2–12. [Google Scholar] [CrossRef]
  10. Sankar, B.; Jaleel, C.A.; Manivanna, P.; Kishorekumar, A.; Somasundaram, R.; Panneerselvam, R. Effect of paclobutrazol on water stress amelioration through antioxidants and free radical scavenging enzymes in Arachis hypogaea L. Colloids Surf. B 2007, 60, 229–235. [Google Scholar] [CrossRef] [PubMed]
  11. Hojati, M.; Modarres-Sanavy, S.A.M.; Karimi, M.; Ghanati, F. Responses of growth and antioxidant systems in Carthamus tinctorius L. under water deficit stress. Acta Physiol. Plant. 2011, 33, 105–112. [Google Scholar] [CrossRef]
  12. Farooq, M.; Wahid, A.; Kobayashi, N.; Fujita, D.; Basra, S.M.A. Plant drought stress: Effects, mechanisms and management. Agron. Sustain. Dev. 2009, 2, 185–212. [Google Scholar] [CrossRef]
  13. Clifford, S.C.; Kadzere, I.; Jones, H.G.; Jackson, J.E. Field comparisons of photosynthesis and leaf conductance in Ziziphus mauritiana and other fruit tree species in Zimbabwe. Trees 1997, 11, 449–455. [Google Scholar] [CrossRef]
  14. IRRI—International Rice Research Institute. Standard Evaluation System for Rice (SES). Available online: http://www.knowledgebank.irri.org/images/docs/rice-standard-evaluation-system.pdf (accessed on 28 August 2012).
  15. Ashraf, M.Y.; Akhtar, K.; Sarwar, G.; Ashraf, M. Role of rooting system in salt tolerance potential of different guar accessions. Agron. Sustain. Dev. 2005, 25, 243–249. [Google Scholar] [CrossRef]
  16. Bates, L.S.; Waldren, R.P.; Teare, I.K. Rapid determination of free proline for water stress studies. Plant Soil 1973, 39, 205–208. [Google Scholar] [CrossRef]
  17. Aebi, H. Catalase in vitro. Methods Enzymol. 1984, 105, 121–126. [Google Scholar] [CrossRef] [PubMed]
  18. Rao, M.V.; Paliyath, G.; Ormrod, D.P.; Murr, D.P.; Watkins, C.B. Influence of salicylic acid on H2O2 production, oxidative stress, and H2O2-metabolizing enzymes. Salicylic acid-mediated oxidative damage requires H2O2. Plant Physiol. 1997, 115, 137–149. [Google Scholar] [CrossRef] [PubMed]
  19. Nakano, Y.; Asada, K. Hydrogen peroxide is scavenged by ascorbate specific peroxidase in spinach chloroplasts. Plant Cell. Physiol. 1981, 22, 867–880. [Google Scholar] [CrossRef]
  20. Bhupinder, S.; Kambham, R.R.; Edilberto, D.R.; Timothy, W. Screening of rice cultivars for morpho-physiological responses to early-season soil moisture stress. Rice Sci. 2017, 24, 322–335. [Google Scholar] [CrossRef]
  21. Henry, A.; Wehler, R.; Grondin, A.; Franke, R.; Quintana, M. Environmental and physiological effects on grouping of drought-tolerant and susceptible rice varieties related to rice (Oryza sativa) root hydraulics under drought. Ann. Bot. 2016, 118, 711–724. [Google Scholar] [CrossRef] [PubMed]
  22. Solomon, Z.; Mats, O.; Masresha, F. Growth, gas exchange, chlorophyll a fluorescence, biomass accumulation and partitioning in droughted and irrigated plants of two enset (Ensete ventricosum Welw, Cheesman) clones. J. Agron. 2007, 6, 499–508. [Google Scholar] [CrossRef]
  23. Remi, L.; Sylvain, L.C.; Rossitza, A.; Fabienne, D.; Thierry, A.; Nathalie, P.; Jean-Louis, B.; Maryse, L.; Pierre, C.T.; Laurence, M.; et al. Source-to-sink transport of sugar and regulation by environmental factors. Front. Plant Sci. 2013, 4, 1–21. [Google Scholar] [CrossRef]
  24. Cox, J.A.; Conran, J.G. The effect of water stress on the life cycles of Erodium crinitum Carolin and Erodium cicutarium (L.) L’Hérit. ex Alton (Geraniaceae). Aust. J. Ecol. 1996, 21, 235–240. [Google Scholar] [CrossRef]
  25. Rodrigues, M.L.; Pacheco, C.M.A.; Chaves, M.M. Soil-plant water relations, root distribution and biomass partitioning in Lupinus albus L. under drought conditions. J. Exp. Bot. 1995, 46, 947–956. [Google Scholar] [CrossRef]
  26. Chartzoulakis, K.; Noitsakis, B.; Therios, I. Photosynthesis, plant growth and dry matter distribution in kiwifruit as influenced by water deficits. Irrigation Sci. 1993, 14, 1–5. [Google Scholar] [CrossRef]
  27. Hamblin, A.; Tennant, D.; Perry, M.W. The cost of stress: Dry matter partitioning changes with seasonal supply of water and nitrogen to dryland wheat. Plant Soil 1990, 122, 47–58. [Google Scholar] [CrossRef]
  28. Kumar, S.; Dey, P. Effects of different mulches and irrigation methods on root growth, nutrient uptake, water-use efficiency and yield of strawberry. Sci. Hort. 2011, 127, 318–324. [Google Scholar] [CrossRef]
  29. Samuel, D.S.P.; Anna, E.D.S.; Marco, A.O.; Eduardo, G.P. Oxidative damage and photosynthetic impairment in tropical rice cultivars upon exposure to excess iron. Sci. Agric. 2015, 73, 217–226. [Google Scholar] [CrossRef]
  30. Mohammad Reza, N.R.; Mihdzar, A.K.; Mohd Rafii, Y. Genetic behaviour for plant capacity to produce chlorophyll in wheat (Triticum aestivum) under drought stress. Aust. J. Crop. Sci. 2012, 6, 415–420. [Google Scholar]
  31. Nurul, H.; Triadiati; Iswandi, A. Photosynthesis and transpiration rates of rice cultivated under the system of rice intensification and the effects on growth and yield. HAYATI J. Biosci. 2016, 23, 67–72. [Google Scholar] [CrossRef]
  32. Huang, Z.A.; Jiang, D.A.; Yang, Y.; Sun, J.W.; Jin, S.H. Effects of nitrogen deficiency on gas exchange, chlorophyll fluorescence, and antioxidant enzymes in leaves of rice plants. Photosynthetica 2004, 42, 357–364. [Google Scholar] [CrossRef]
  33. Mahbod, S.; Mohamed, M.H.; Rafii, M.Y.; Mahmud, T.M.M.; Parisa, A.; Mohama, O.; Rambod, A.; Sima, T.; Nahid, K.; Shabanimofrad, M.; et al. Improvement of drought tolerance in rice (Oryza sativa L.): Genetics, genomic tools, and the WRKY gene family. BioMed Res. Intern. 2018, 2018, 1–20. [Google Scholar] [CrossRef]
  34. Lum, M.S.; Hanafi, M.M.; Rafii, M.Y.; Akmar, A.S.N. Effect of drought stress on growth, proline and antioxidant enzyme activities of upland rice. J. Anim. Plant Sci. 2014, 24, 1487–1493. [Google Scholar]
  35. Anjum, S.A.; Farooq, M.; Xie, X.Y.; Liu, X.J.; Ijaz, M.F. Antioxidant defense system and proline accumulation enables hot pepper to perform better under drought. Sci. Hortic. 2012, 140, 66–73. [Google Scholar] [CrossRef]
  36. Mehlhorn, H.; Lelandais, M.; Korth, H.G.; Foyer, C.H. Ascorbate is the natural substrate for plant peroxidases. FEBS J. 1996, 378, 203–206. [Google Scholar] [CrossRef] [Green Version]
  37. Shamsun, N.; Lakshminarayana, R.V.; Lingaraj, S.; Bhaben, T. Antioxidant protection mechanisms reveal significant response in drought-induced oxidative stress in some traditional rice of Assam, India. Rice Sci. 2018, 25, 185–196. [Google Scholar] [CrossRef]
  38. Nadzariah, K.Z.; Mohd, Y.A.; Sariam, O.; Nadzirah, K.Z. Growth and physiological performance of aerobic and lowland rice as affected by water stress at selected growth stages. Rice Sci. 2018, 25, 82–93. [Google Scholar] [CrossRef]
  39. Mayumi, K.; Daigo, M.; Naoya, A.; Akira, M.; Yoshinori, Y. Growth and yield responses of upland NERICAs to variable water management under field conditions. Plant Prot. Sci. 2017, 20, 36–46. [Google Scholar] [CrossRef]
  40. Lafitte, H.R.; Guan, Y.S.; Yan, S.; Li, Z.K. Whole plant responses, key processes, and adaptation to drought stress: The case of rice. J. Exp. Bot. 2007, 58, 169–175. [Google Scholar] [CrossRef] [PubMed]
Figure 1. Effect of drought stress treatment on chlorophyll content in rice genotypes. Vertical bars represent ± standard error. Values within drought stress treatment with the different letter are significantly different based on comparison using DNMRT (Duncan’s New Multiple Range Test) at p ≤ 0.05 (n = 20).
Agronomy 08 00279 g001
Figure 2. Effect of drought stress treatment on proline content in rice genotypes. Vertical bars represent ± standard error. Values within drought stress treatment with the different letter are significantly different based on comparison using DNMRT at p ≤ 0.05 (n = 20).
Agronomy 08 00279 g002
Figure 3. Effect of drought stress treatment on CAT activities in rice genotypes. Vertical bars represent ± standard error. Values within drought stress treatment with the different letter are significantly different based on comparison using DNMRT at p ≤ 0.01 (n = 20).
Agronomy 08 00279 g003
Figure 4. Effect of drought stress treatment on APX activities in rice genotypes. Vertical bars represent ± standard error. Values within drought stress treatment with the different letter are significantly different based on comparison using DNMRT at p ≤ 0.01 (n = 20).
Agronomy 08 00279 g004
Figure 5. Effect of drought stress treatment on GPX activities in rice genotypes. Vertical bars represent ± standard error. Values within drought stress treatment with the different letter are significantly different based on comparison using DNMRT at p ≤ 0.01 (n = 20).
Agronomy 08 00279 g005
Table 1. Combined analysis of variance (ANOVA) over seasons for plant growth traits.
Source of VariationdfMean Squares
Plant HeightNumber of TillersFlag Leaf Area
Seasons (S)135.25 *316.01 **622.11 **
Replications within season (R/S)63.390.8091.81
Water treatments (W)1338.25 **132.61 **371.13 **
S × W130.639.11300.66
W × (R/S)65.480.6328.21
Genotypes (G)4599.94 **147.89 **120.04 **
G × S471.86 **49.73 **71.05 **
G × W4231.60 **8.21 **108.30 **
G × S × W432.22 **2.77 *49.97 **
Error483.070.987.38
**, * indicate significant at p ≤ 0.01 or p ≤ 0.05, respectively; df indicates degree of freedom.
Table 2. Plant growth traits in rice genotypes as affected by drought stress treatment at different seasons.
Treatment/
Genotype
Vegetative Growth
Plant Height
(cm)
Number of TillersFlag Leaf Area
(cm)
ControlDrought StressControlDrought StressControlDrought Stress
Season 1
MR219-498.4b94.1b15a13a41.3a40.7a
MR219-999.3b90.5b16a10a43.0a34.0ab
MR21998.7b92.2b14b7b39.4a36.6ab
Aeron1112.1a101.8a11c9b44.1a38.9ab
IR6494.5c84.1c14b5c30.7a12.2b
Mean100.692.514939.732.5
CV (%)3.1010.5325.6628.8621.1624.98
Season 2
MR219-497.1b91.6b18a13a38.8a29.9a
MR219-999.9b93.3bc15b9a37.3a24.7a
MR21994.0c88.8c11b7ab39.7a19.3b
Aeron1111.7a105.7a13b11a32.3a27.8a
IR6496.5b82.0d17ab4b32.9a10.1c
Mean99.892.315936.222.4
CV (%)5.338.7437.4540.4318.9221.37
Note: Means followed by the different letters within a column are significantly different from each other according to the DNMRT (Duncan’s New Multiple Range Test) at p ≤ 0.05; CV indicates coefficient of variation.
Table 3. Combined ANOVA over seasons for dry weight.
Source of VariationdfMean Squares
Culms and Leaves Dry WeightPanicles Dry WeightTotal Dry Weight
Seasons (S)1177.34 **897.80 **705.97 **
Replications within season (R/S)60.403.375.19
Water treatment (W)12193.57 **361.25 **11,336.18 **
S × W10.11 *101.25 **465.08 **
W × (R/S)60.186.724.28
Genotypes (G)4153.04 **1472.39 **3492.92 **
G × S416.54 **176.18 **86.40 **
G × W410.27 **294.75 **1360.41 **
G × S× W43.49 **55.06 **153.91 **
Error480.195.144.52
**, * indicate significant at p ≤ 0.01 or p ≤ 0.05, respectively; df indicates degree of freedom.
Table 4. Dry weight production and partitioning in rice genotypes as affected by drought stress treatment at different seasons.
Treatment/
Genotype
Dry Weight Production and Partitioning
Culms and Leaves Dry Weight
(g Plant−1)
Panicles Dry Weight
(g Plant−1)
Total Dry Weight
(g Plant−1)
ControlDrought StressControlDrought StressControlDrought Stress
Season 1
MR219-418.46c13.22a79.00b76.00a68.86b58.56a
MR219-925.54a8.74b81.50a72.50a81.47a51.28b
MR21924.41b8.28b72.75c51.25c69.65b42.30c
Aeron117.86c12.49a57.75d68.50b59.86c54.29b
IR6414.52d5.33c73.50c51.75d69.99b40.25c
Mean20.169.6171.7065.2069.9749.34
CV (%)21.3031.4415.1214.8929.0915.26
Season 2
MR219-413.72d8.50a86.50a81.25a89.71b77.89a
MR219-920.62a6.76b88.75a75.00b97.61a63.80b
MR21920.51a4.99c79.00b72.48b70.77b57.51c
Aeron114.80c8.36a78.00b60.25c73.27b65.71b
IR6415.88b4.92c73.50c55.75d71.64b47.30d
Mean17.116.7176.1574.1579.0964.09
CV (%)17.5424.4813.1215.0925.2617.96
Note: Means followed by the different letters within a column are significantly different from each other according to the DNMRT at p ≤ 0.05; CV indicates coefficient of variation.
Table 5. Combined ANOVA over seasons for relative chlorophyll content, proline content, catalase (CAT), ascorbate peroxidase (APX), and guaiacol peroxidase (GPX) activities.
Source of VariationdfMean Squares
Relative Chlorophyll ContentProline ContentCAT ActivityAPX ActivityGPX Activity
Seasons (S)145.52 **0.08 **0.09 **0.25 **0.09 *
Replications within season (R/S)60.080.010.030.040.01
Water treatments (W)1689.68 **6.78 **90.19 **64.87 **261.44 **
S × W144.21 **0.14 **0.07 **0.62 **0.34 *
WT × (R/S)60.050.040.040.070.01
Genotypes (G)43.04 **0.21 **1.64 **4.24 **2.47 **
G × S45.44 **0.24 **0.01 *0.10 **0.83 **
G × W46.58 **0.14 **1.25 **2.91 **2.83 **
G × S × W45.60 **0.22 **0.02 **0.13 **0.01 *
Error480.040.070.030.090.02
**, * indicate significant at p ≤ 0.01 or p ≤ 0.05, respectively; df indicates degree of freedom.
Table 6. Combined ANOVA over seasons for yield and yield components.
Source of VariationdfMean Squares
Grain Yield1000 Grain WeightSpikelets/PanicleHarvest Index
Seasons (S)15134.89 **12.91 **1209.01 **0.551 **
Replications within season (R/S)610.790.3325.830.002
Water treatments (W)1266.49 **72.41 **308.11 **0.105 **
S × W1665.34 **0.69262.81 **0.002
W × (R/S)65.810.7213.930.002
Genotypes (G)41878.03 **81.39 **1625.18 **0.010
G × S4495.85 **4.43 *264.95 **0.036 **
G × W4323.75 **1.87 *951.30 **0.024 **
G × S × W4539.71 **2.23 *50.00 *0.008
Error488.000.617.600.001
**, * indicate significant at p ≤ 0.01 or p ≤ 0.05, respectively; df indicates degree of freedom.
Table 7. Grain yield and 1000 grain weight in rice genotypes as affected by drought stress treatment at different seasons.
Treatment/
Genotype
Yield and Yield Attributes
Grain Yield
(g Plant−1)
1000 Grain Weight
(g)
Spikelets/PanicleHarvest Index
ControlDrought StressControlDrought StressControlDrought StressControlDrought Stress
Season 1
MR219-434.00bc32.58b29.02b28.06a60b59a0.50b0.60ab
MR219-959.81a34.38ab30.32a28.44a68a62a0.49b0.67a
MR21936.62bc35.03a27.94c26.25b51c46b0.53b0.60ab
Aeron130.52c25.36c27.53c26.17b44d43b0.51b0.63ab
IR6447.72b24.73c23.69d21.00c68a33c0.68a0.58b
Mean37.1435.0227.7025.9857490.540.62
CV (%)21.3134.318.5410.9716.1022.0414.2534.31
Season 2
MR219-453.15b50.88b28.11a27.10a69b63b0.76a0.80a
MR219-992.17a65.49a29.02a26.67a81a76a0.79a0.84a
MR21947.69c45.87bc26.15b24.84b62c56c0.65c0.80a
Aeron146.82c44.83c28.00a23.81c64bc50d0.71b0.83a
IR6446.22c29.89d24.13c22.56d61bc28d0.65c0.63b
Mean56.8147.3927.0824.9961550.710.78
CV (%)32.5425.617.097.3915.3130.888.7812.05
Note: Means followed by the different letters within a column are significantly different from each other according to the DNMRT at p ≤ 0.05; CV indicates coefficient of variation.

