Molecular Markers Improve Breeding Efficiency in Apomictic Poa Pratensis L.


1
Forage and Range Research Laboratory, USDA-ARS, Logan, UT 84322-6300, USA
2
Department of Plants, Soils, and Climate, Utah State University, Logan, UT 84322-4820, USA
*
Author to whom correspondence should be addressed.
Agronomy 2018, 8(2), 17; https://doi.org/10.3390/agronomy8020017
Submission received: 6 December 2017
/
Revised: 25 January 2018
/
Accepted: 5 February 2018
/
Published: 10 February 2018
(This article belongs to the Special Issue Turfgrass Biology, Genetics, and Breeding)
Abstract
:Kentucky bluegrass (Poa pratensis L.) is a highly adapted and important turfgrass species in cool-season climates. It has high and variable polyploidy, small and metacentric chromosomes, and a facultative apomictic breeding system. As a result of the polyploidy and apomixis, identifying hybrids for Mendelian selection, identifying fixed apomictic progeny of desirable hybridizations for cultivar development, or differentiating among cultivars with subtle phenotypic differences is challenging without the assistance of molecular markers. Herein, we show data and review previous research showing the uses and limitations of using molecular markers for hybrid detection, apomixis assessment, and cultivar discrimination. In order to differentiate among different apomictic offtypes, both molecular markers and flow cytometry are necessary. For assessing similarity among progeny of hybridizations, as well as discriminating among cultivars, sets of markers are necessary and cryptic molecular variation must be considered. High throughput genotyping platforms are critical for increased genotyping efficiency.
1. Introduction
The Poa genus comprises approximately 500 species, depending on taxonomic sources [1]. It is a highly adaptable genus, spanning all continents and diverse habitats. There are caespitose species used for rangeland restoration, such as P. secunda [2] and P. densa [3]. There are weedy species like P. annua, whose presence is so pervasive that it is begrudgingly used in lawns and golf courses [4]. Other species have limited or strategic value as turfgrasses, such as P. trivialis [5] and P. arachnifera [6]. The most important agronomic species in the genus is P. pratensis, commonly called Kentucky bluegrass in the USA and smooth-stalked meadowgrass in Europe.
Kentucky bluegrass is an interesting organism from a genetic perspective. It has high and variable polyploidy, ranging generally from 8× to 14× with a base number of seven. Although abundant, the Kentucky bluegrass chromosomes are mostly metacentric and relatively small, obfuscating attempts to karyotype or count the exact chromosome numbers under a microscope (Figure 1) and leading to high frequencies of aneuploids during meiosis or mitosis [7,8]. Thus, based on results from both chromosome counts and flow cytometry, Kentucky bluegrass progenies and cultivars have been presented as mean or approximate chromosome numbers rather than exact numbers [7,8,9,10,11]. The epigenetic consequences of high and variable ploidy crosses and progeny are unknown, as are the identity and putative activity of transposable elements.
Additionally, Kentucky bluegrass is a facultative apomict, exhibiting sporophytic gametogenesis to produce unreduced gametes, pseudogamous use of pollen for viable endosperm development, and parthenogenesis to skip fertilization [12]. Apomixis can come through the female and/or male lines, is almost never 100% efficient, and results in highly-polyploid, fixed heterozygotes. Although apomixis is predominant in most crosses, five types of apomicitic offtypes have been postulated and reported [9]: polyhaploids, BII hybrids (‘B’ standing for ‘bastard’), BIII hybrids through the male or female line, and BIV hybrids (Table 1). Combined with aneuploidy, these apomictic offtypes result in several sources of genetic and genomic variation, only one of which corresponds to a ‘normal’ hybrid in the classical sense of reduction, segregation, and independent assortment. Different genetic backgrounds show respective predominances for certain offtypes, and in each generation or under environmental stresses the frequency of those offtypes can change (Table 2). For Kentucky bluegrass breeders, an understanding of the nature and frequency of apomixis offtypes is critical to understand the uniformity and stability of nascent breeding lines.
Because of the low frequency of hybrids and otherwise unpredictable nature of offtypes, breeding of Kentucky bluegrass has mainly relied on ecotype selection rather than Mendelian selection [13]. In ecotype selection, an interesting plant is selected from a cross or within a population, perhaps a hybrid or offtype or aneuploid, and that plant is further evaluated and becomes a new cultivar if its progeny is apomictically stable. With the advent of the dark colored cultivar ‘Midnight’ [14] and other similar cultivars, progeny from obviously different colored parents can be discernable—with a somewhat higher likelihood of being BII or BIII hybrids than aneuploids. Alternatively, crossing Kentucky bluegrass as a pollen source onto dioecious female P. arachnifera plants provides initial hybrids for breeding [15], which require further selection with or without hybridization. Thus, to conduct recurrent Mendelian selection within Kentucky bluegrass and predictably increase the gain for traits of interest (e.g., salt tolerance or drought tolerance), accurate and efficient assurance of hybridization is necessary.
Upon release of an elite Kentucky bluegrass cultivar, further use of that cultivar must be done appropriately to protect breeder’s rights. The ability to discriminate among cultivars can provide a basis of assurance for appropriate use. Kentucky bluegrass cultivars are also usually planted as blends; a combination of several similar cultivars [16]. The reasons for blending are based on population genetic principles, and a choice of similar behaving cultivars is essential for a uniform looking lawn. Some cultivars are marketed as carrying value-added traits (e.g., drought tolerance), such that their composition in a blend is highly desirable. However, these highly desired cultivars may (or may not) be a small portion of a blend while a less desired but abundant seed producing cultivar may (or may not) comprise the vast majority of a blend. Thus, the ability to discriminate between cultivars can protect breeder’s rights of elite cultivars as well as determine the most persistent cultivar in a blend. For efficiency, interest has developed in discriminating cultivars with molecular markers to avoid the length and uncertainty of field characterization.
Below we will show data, concepts, and reviews of previous literature showing the needs and uses of molecular markers for Kentucky bluegrass breeding and management. We will first discuss how molecular markers are used to identify hybrids and stable apomictic progeny breeding lines, and then discuss how molecular markers are used for cultivar identification per se or in blends. Finally, current and future prospects will be presented.
2. Materials and Methods
Chromosome staining and counting were done as per Joshi et al. [17]: briefly, healthy root tips were collected 2–3 h after sunrise and fixed in cold 2 mM 8-hydroxyquinoline for 4 h. Samples were then transferred to an aceto-orcein solution for 48 h, squashed on a glass slide containing 1 drop of 45% acetic acid, and examined under a light microscope at 1000× resolution.
To determine relative chromosome content, flow cytometry was used. Young leaves were quickly chopped in a cold chopping buffer comprised of 10 mM MgSO4, 50 mM KCl, 5 mM HEPES, g/mL DTT, 0.15 mg/mL RNAse A, and 0.2% (v/v) Triton X-100; and pH of 8.0. After sitting in chopping buffer for 60 s, the sample solution was poured through a CellTrics® 30 µm nylon mesh filter (Sysmex-Partec GmbH, Gorlitz, Germany), and 1 mL Propidium Iodide staining buffer was added (BioSure, Grass Valley, CA, USA). Five microliters of Chicken Erythrocyte Nuclei (CEN; BioSure) were spiked in as an internal standard, and samples were incubated at room temperature in the dark for 10 min. Average peak values were determined using an Accuri C6-Plus flow cytometer (BD Biosciences, San Jose, CA, USA). Relative 2C nuclear content was determined by dividing the average peak size of the sample by the average peak size of CEN, and multiplying that relative value by 2.3 pg (nuclear content of CEN).
The molecular markers shown in Figure 1 are an example subset of SSR markers reported in Bushman et al. [18]. Parental plants were vernalized in a growth chamber and paired-crossed in isolation in a greenhouse. Ninety-six progeny from each cross were genotyped with three SSR markers as per Bushman et al. [18], and relative ploidy levels determined using flow cytometry. Hybrid and progeny DNA was amplified using GoTaq polymerase (Promega, Madison, WI, USA), 0.2 mM dNTP, 1.5 mM MgCl2, 20 ng genomic DNA, and 5 pmol primers; amplified on an ABI9600 thermal cycler. Following an initial two minute denaturation, the PCR program was 95 °C for 20 s, 58 °C for 30 s, and 72 °C for 60 s; for 35 cycles. Amplification products were resolved on an ABI3730 instrument (Life Technologies, Foster City, CA, USA), and base calling used Genographer software 1.6 [19].
3. Results and Discussion
3.1. Hybrid Detection
The four different types of Kentucky bluegrass hybrids and other offtypes were discussed previously, and are listed in Table 1. Typical genotyping banding patterns are shown in Figure 1. When both parents are genotyped together with progeny, plants with molecular markers from both parents were products of fertilization (Figure 1). More than one or two markers are necessary, and not all markers from both parents are expected due to meiotic segregation and assortment of parental heterozygosity [9,10]. Molecular markers alone cannot discriminate between BII, BIII, or BIV hybrids because of the inability of current marker methods to count dosage of each marker. Flow cytometry can discriminate between those three types of hybrid offtypes (Figure 2), but as molecular genotyping is faster, conducting flow cytometry on the subset of plants targeted as hybrids would be most efficient. Band absences in the maternal parent, without any paternal markers, are indicative of self-pollinations, polyhaploids, or aneuploids (Figure 1). Molecular markers alone cannot discriminate among those possibilities either, but together with flow cytometry (or chromosome staining) polyhaploids can at least be separated from aneuploid and self-pollination progeny (Figure 2). Only in cases of large chromosome losses or gains can flow cytometry detect aneuploids.
The types of markers ideal for detecting hybrids are inconsequential from the standpoint of accuracy, but can be prioritized based on cost and efficiency. Older technologies like Random Amplified Polymorphism (RAPD) or Amplified Fragment Length Polymorphism (AFLP) were robust because of the high numbers of bands genotyped, despite being ‘dominant’ and closed-platform marker systems. Simple Sequence Repeat (SSR) markers are also robust, but base calling instruments are becoming more difficult to access and the time to resolve and base-call for multiple SSR-amplification reactions is inefficient. Using real-time detection instruments is enticing because secondary gel (polymer or agarose) resolution for band calling are not necessary. Single nucleotide polymorphism markers such as KASP™ or Taqman™ can be read as end-point assays on real-time instruments, as can melting curve SSR primers [20]. Multiplexing as much as possible is critical to save time and money, as several markers will be necessary to confirm hybridization (Figure 1). More recent genotyping-by-sequencing (GBS) methods, with or without genome reduction steps, are extremely robust and provide thousands of SNPs per plant [21], but their throughput and cost are currently more amenable to research and development than high-throughput genotyping. A high-throughput SNP or other polymorphism array will be necessary for future efficient genotyping.
3.2. Apomictic Progeny Detection
Once a hybridization has occurred and a desirable plant identified, sexual fertilization and variation is no longer desired. Kentucky bluegrass breeders therefore spend much time and effort determining if any desirable progeny from a hybridization are apomictically stable. Common tests to determine if a plant is apomictic are microscopic ovule dissection [10,22], a flow cytometry test of embryo/endosperm ratios in bulk seed [23,24,25], or phenotyping of multiple progeny at anthesis. The replacement of phenotyping with surrogate molecular marker genotyping (Figure 1) can save time and field space, and has the potential to save on costs if done efficiently. In the case of molecular genotyping of progeny, if progeny from a cross carry identical genotypes, then it can be assumed that the mother plant produced seed predominantly by apomixis and that the progeny will be phenotypically uniform and stable.
Interestingly, even in highly uniform and stable progeny groups, genotype variation can be found. Some of the variation is a result of genotyping errors, usually at a small level (less than 3%) if done appropriately. But other variation is cryptic in nature, corresponding to no phenotypic differences and no genotyping errors [18]. Although usually unknown, possibilities of cryptic variation could include aneuploids or genomic changes due to transposable element activity. With a highly polyploid and potentially partial redundant (partial autopolyploid) genome, these changes, if silenced with internal epigenetic compensation machinery, could give genotypic changes without coincident phenotypic changes. It is currently unknown whether or not hybridizing between two Kentucky bluegrass lines with differing ploidy levels would exacerbate or ameliorate the potential of aneuploids or altered epigenetic footprints.
3.3. Cultivar Differentiation
Differentiation of cultivars can be used as support to protect plant breeder’s rights for cultivars that have been protected by utility patents or Plant Variety Protections (PVP). Accurate cultivar identification by molecular markers, especially where readily apparent phenotypes cannot be used to discriminate, can provide additional assurance and identity among cultivars [26]. Additionally, when blends are planted, it is unknown whether or not the percentages of cultivars in the seed bag carryover to the percentage of each cultivar established in the lawn [16]. If not, then managers have the ability to determine which cultivars were most successful and adjust future blends to optimize seed purchases.
As most cultivars have been selected to be highly apomictic, high numbers of plants within each cultivar are not necessary to test. However, due to the varying frequency of apomictic offtypes or aneuploids, or the cryptic variation discussed above, testing more than one or two plants is necessary [18]. Molecular genotyping has been used to differentiate cultivars in a number of previous studies. Initially, RAPD markers were used to evaluate differences among cultivars and breeding lines [27,28]. SSR markers were more recently developed [18,29,30], and used to genotype a large number of cultivars in order to correlate Kentucky bluegrass blending types with cheaper molecular diagnostic assays [31]. Some cultivars and types were easily separated with molecular markers while others, e.g., Midnight and Compact America types, were not always distinguishable. Marker methods used in these various efforts have evolved from RAPDs to SSRs and sequence tagged site markers. The expansion of GBS has provided a more robust and efficient method to assess cultivars, and has potential to identify high frequency polymorphisms necessary to develop a high-throughput genotyping platform.
3.4. Emerging Efforts
The expansion of next generation sequencing into non-model crops has brought options to turfgrass research previously not considered. As of this report, genomic sequencing efforts are underway for several turfgrass species, including Kentucky bluegrass. These genomic sequences can act as references to distinguish among homologous gene families or map DNA or RNA sequence reads to their accurate position. Polyploidy and repeat regions within these grasses is currently inhibiting pseudomolecule assembly and deep sequencing, but long genomic scaffolds, EST sequences, splice variant identification, and homolog differentiated are already emerging as viable tools and increasing the ability to conduct functional genetic experiments in turfgrasses. Eventually, these sequence libraries will provide sufficient information to allow development of validated molecular markers for high-quality genotyping in Kentucky bluegrass breeding. Additionally, sequencing within related Poa species has provided an ability to re-examine lower ploidy Poa genomes similar to Kentucky bluegrass [17], possibly pinpointing ancestral diploid Poa genomes present in P. pratensis and allowing breeders to determine which genome(s) provide value added characteristics.
4. Conclusions
Molecular marker genotyping in Kentucky bluegrass is being used to identify desirable hybrids, identify likely apomictic plants for cultivar development, differentiate among cultivars, and sort out cultivars within blends. The main challenge remaining is to fine tune the markers and methods to reduce cost, reduce time, and increase predictive strength. Its polyploidy and high levels or repeat elements in its genome prevent Kentucky bluegrass from benefitting from current sequencing and genotyping services, but next generation sequencing is still providing great opportunities for future development of more robust markers. With an end goal of more rapid and effective Mendelian selection, cultivar development, and cultivar assurance, these markers are transforming Kentucky bluegrass breeding and management from a gamble to a process.
Acknowledgments
We would like to acknowledge Lisa Michaels, Katherine Coombs, and Lijun Wang for assisting in flow cytometry and genotyping.
Author Contributions
B.S.B. and A.J. conceived and conducted the experiments and wrote the manuscript; P.G.J. contributed reagents/materials/analysis tools and assisted in writing the manuscript.
Conflicts of Interest
The authors declare no conflict of interest.
References
- Gillespie, L.J.; Soreng, R.J. A phylogenetic analysis of the bluegrass genus Poa based on cpDNA restriction site data. Syst. Bot. 2005, 30, 84–105. [Google Scholar] [CrossRef]
- Evans, R.A.; Young, J.A.; Roundy, B.A. Seedbed Requirements for Germination of Sandberg Bluegrass. Agron. J. 1977, 69, 817–820. [Google Scholar] [CrossRef]
- Cabi, E.; Soreng, R.J.; Gillespie, L.; Amiri, N. Poa densa (Poaceae), an overlooked Turkish steppe grass, and the evolution of bulbs in Poa. Willdenowia 2016, 46, 201–211. [Google Scholar] [CrossRef]
- Huff, D.R. Annual Bluegrass. In Turfgrass Biology, Genetics, and Breeding; Casler, M.D., Duncan, R.R., Eds.; John Wiley and Sons, Inc.: Hoboken, NJ, USA, 2003; pp. 39–52. [Google Scholar]
- Hurley, R. Rough Bluegrass. In Turfgrass Biology, Genetics, and Breeding; Casler, M.D., Duncan, R.R., Eds.; John Wiley and Sons, Inc.: Hoboken, NJ, USA, 2003; pp. 67–74. [Google Scholar]
- Read, J.C.; Anderson, S.J. Texas Bluegrass. In Turfgrass Biology, Genetics, and Breeding; Casler, M.D., Duncan, R.R., Eds.; John Wiley and Sons, Inc.: Hoboken, NJ, USA, 2003; pp. 61–66. [Google Scholar]
- Speckmann, G.J.; Van Dijk, G.E. Chromosome number and plant morphology in some ecotypes of Poa pratensis L. Euphytica 1972, 21, 171–180. [Google Scholar] [CrossRef]
- Eaton, T.; Curley, J.C.; Williamson, R.; Jung, G. Determination of the Level of Variation in Polyploidy among Kentucky Bluegrass Cultivars by Means of Flow Cytometry. Crop Sci. 2004, 44, 2168–2174. [Google Scholar] [CrossRef]
- Huff, D.R.; Bara, J.M. Determining Genetic Origins of Aberrant Progeny from Facultative Apomictic Kentucky Bluegrass Using a Combination of Flow-Cytometry and Silver-Stained Rapd Markers. Theor. Appl. Genet. 1993, 87, 201–208. [Google Scholar] [CrossRef] [PubMed]
- Barcaccia, G.; Mazzucato, A.; Belardinelli, A.; Pezzotti, M.; Lucretti, S.; Falcinelli, M. Inheritance of parental genomes in progenies of Poa pratensis L. from sexual and apomictic genotypes as assessed by RAPD markers and flow cytometry. Theor. Appl. Genet. 1997, 95, 516–524. [Google Scholar] [CrossRef]
- Murovec, J.; Kastelec, D.; Vilhar, B.; Cop, J.; Bohanec, B. High variability of nuclear DNA content in cultivars and natural populations of Poa pratensis L. in relation to morphological characters. Acta Biol. Crac. 2009, 5, 45–52. [Google Scholar]
- Barcaccia, G.; Albertini, E. Apomixis in plant reproduction: A novel perspective on an old dilemma. Plant Reprod. 2013, 26, 159–179. [Google Scholar] [CrossRef] [PubMed]
- Huff, D.R. Kentucky bluegrass. In Turfgrass Biology, Genetics, and Breeding; Casler, M.D., Duncan, R.R., Eds.; John Wiley and Sons, Inc.: Hoboken, NJ, USA, 2003; pp. 27–38. [Google Scholar]
- Meyer, W.A.; Rose, B.L.; Johnson-Cicalese, J.M.; Funk, C.R. Registration of Midnight Kentucky Bluegrass. Crop Sci. 1984, 24, 822–823. [Google Scholar] [CrossRef]
- Kindiger, B. Frequency of androgenesis in Poa arachnifera × P. ligularis and P. poiformis hybridizations. Grassl. Sci. 2015, 61, 177–180. [Google Scholar] [CrossRef]
- Lickfeldt, D.W.; Voigt, T.B.; Hamblin, A.M. Composition and characteristics of blended Kentucky bluegrass stands. Hortscience 2002, 37, 1124–1126. [Google Scholar]
- Joshi, A.; Bushman, B.S.; Pickett, B.; Robbins, M.D.; Staub, J.E.; Johnson, P.G. Phylogenetic relationships among low-ploidy species of Poa using chloroplast sequences. Genome 2016, 60, 384–392. [Google Scholar] [CrossRef] [PubMed]
- Bushman, B.S.; Warnke, S.E.; Amundsen, K.L.; Combs, K.M.; Johnson, P.G. Molecular Markers Highlight Variation within and among Kentucky Bluegrass Varieties and Accessions. Crop Sci. 2013, 53, 2245–2254. [Google Scholar]
- Benham, J.J. Genographer Version 1.6.0; Montana State University: Bozeman, MT, USA, 2001. [Google Scholar]
- Warnke, S.E.; Thammina, C.S.; Amundsen, K.; Miljanic, P.; Hershman, H. High-Resolution Melt Analysis of Simple Sequence Repeats for Bentgrass Species Differentiation. Int. Turfgrass Soc. Res. J. 2017, 13, 466–470. [Google Scholar] [CrossRef]
- Griffin, P.C.; Robin, C.; Hoffmann, A.A. A next-generation sequencing method for overcoming the multiple gene copy problem in polyploid phylogenetics, applied to Poa grasses. BMC Biol. 2011, 9, 19. [Google Scholar] [CrossRef] [PubMed]
- Niemann, J.; Wojciechowski, A.; Janowicz, J. Identification of apomixis in the Kentucky bluegrass (Poa pratensis L.) using auxin test. Acta Soc. Bot. Pol. 2012, 81, 217–221. [Google Scholar] [CrossRef]
- Wieners, R.R.; Fei, S.-Z.; Johnson, R.C. Characterization of a USDA Kentucky Bluegrass (Poa pratensis L.) Core Collection for Reproductive Mode and DNA Content by Flow Cytometry. Genet. Resour. Crop Evol. 2006, 53, 1531–1541. [Google Scholar] [CrossRef]
- Matzk, F.; Meister, A.; Schubert, I. An efficient screen for reproductive pathways using mature seeds of monocots and dicots. Plant J. 2000, 21, 97–108. [Google Scholar] [CrossRef] [PubMed]
- Kelley, A.M.; Johnson, P.G.; Waldron, B.S.; Peel, M.D. A survey of apomixis and ploidy levels among Poa L. (Poaceae) using flow cytometry. Crop Sci. 2009, 45, 1395–1402. [Google Scholar] [CrossRef]
- Lickfeldt, D.W.; Voigt, T.B.; Hamblin, A.M. Cultivar composition and spatial patterns in Kentucky bluegrass blends. Crop Sci. 2002, 42, 842–847. [Google Scholar] [CrossRef]
- Huff, D.R. Characterization of Kentucky bluegrass cultivars using RAPD makers. Int. Turfgrass Soc. Res. J. 2001, 9, 169–175. [Google Scholar]
- Curley, J.; Jung, G. RAPD-based genetic relationships in Kentucky bluegrass: Comparison of cultivars, interspecific hybrids, and plant introductions. Crop Sci. 2004, 44, 1299–1306. [Google Scholar] [CrossRef]
- Honig, J.A.; Bonos, S.A.; Meyer, W.A. Isolation and Characterization of 88 Polymorphic Microsatellite Markers in Kentucky Bluegrass (Poa pratensis L.). HortScience 2010, 45, 1759–1763. [Google Scholar]
- Raggi, L.; Bitocchi, E.; Russi, L.; Marconi, G.; Sharbel, T.F.; Veronesi, F.; Albertini, E. Understanding Genetic Diversity and Population Structure of a Poa pratensis Worldwide Collection through Morphological, Nuclear and Chloroplast Diversity Analysis. PLoS ONE 2015, 10, e0124709. [Google Scholar] [CrossRef] [PubMed]
- Honig, J.A.; Averello, V.; Bonos, S.A.; Meyer, W.A. Classification of Kentucky Bluegrass (Poa pratensis L.) Cultivars and Accessions Based on Microsatellite (Simple Sequence Repeat) Markers. HortScience 2012, 47, 1356–1366. [Google Scholar]
Figure 1.
Example of two Simple Sequence Repeat (SSR) markers amplified on two Kentucky bluegrass parents and 12 of their progeny: (a) maternal parent, (b) paternal parent, (c–g) putative apomictic progeny showing maternal genotypes for both SSR markers, (h–j) hybrid progeny carrying at least one paternal allele for at least one of the SSR markers, (k) polyhaploid progeny validated through flow cytometry that may show band loss, and (l–n) progeny with non-maternal genotypes but maternal cytotypes (small-scale aneuploid or self-pollination progeny).
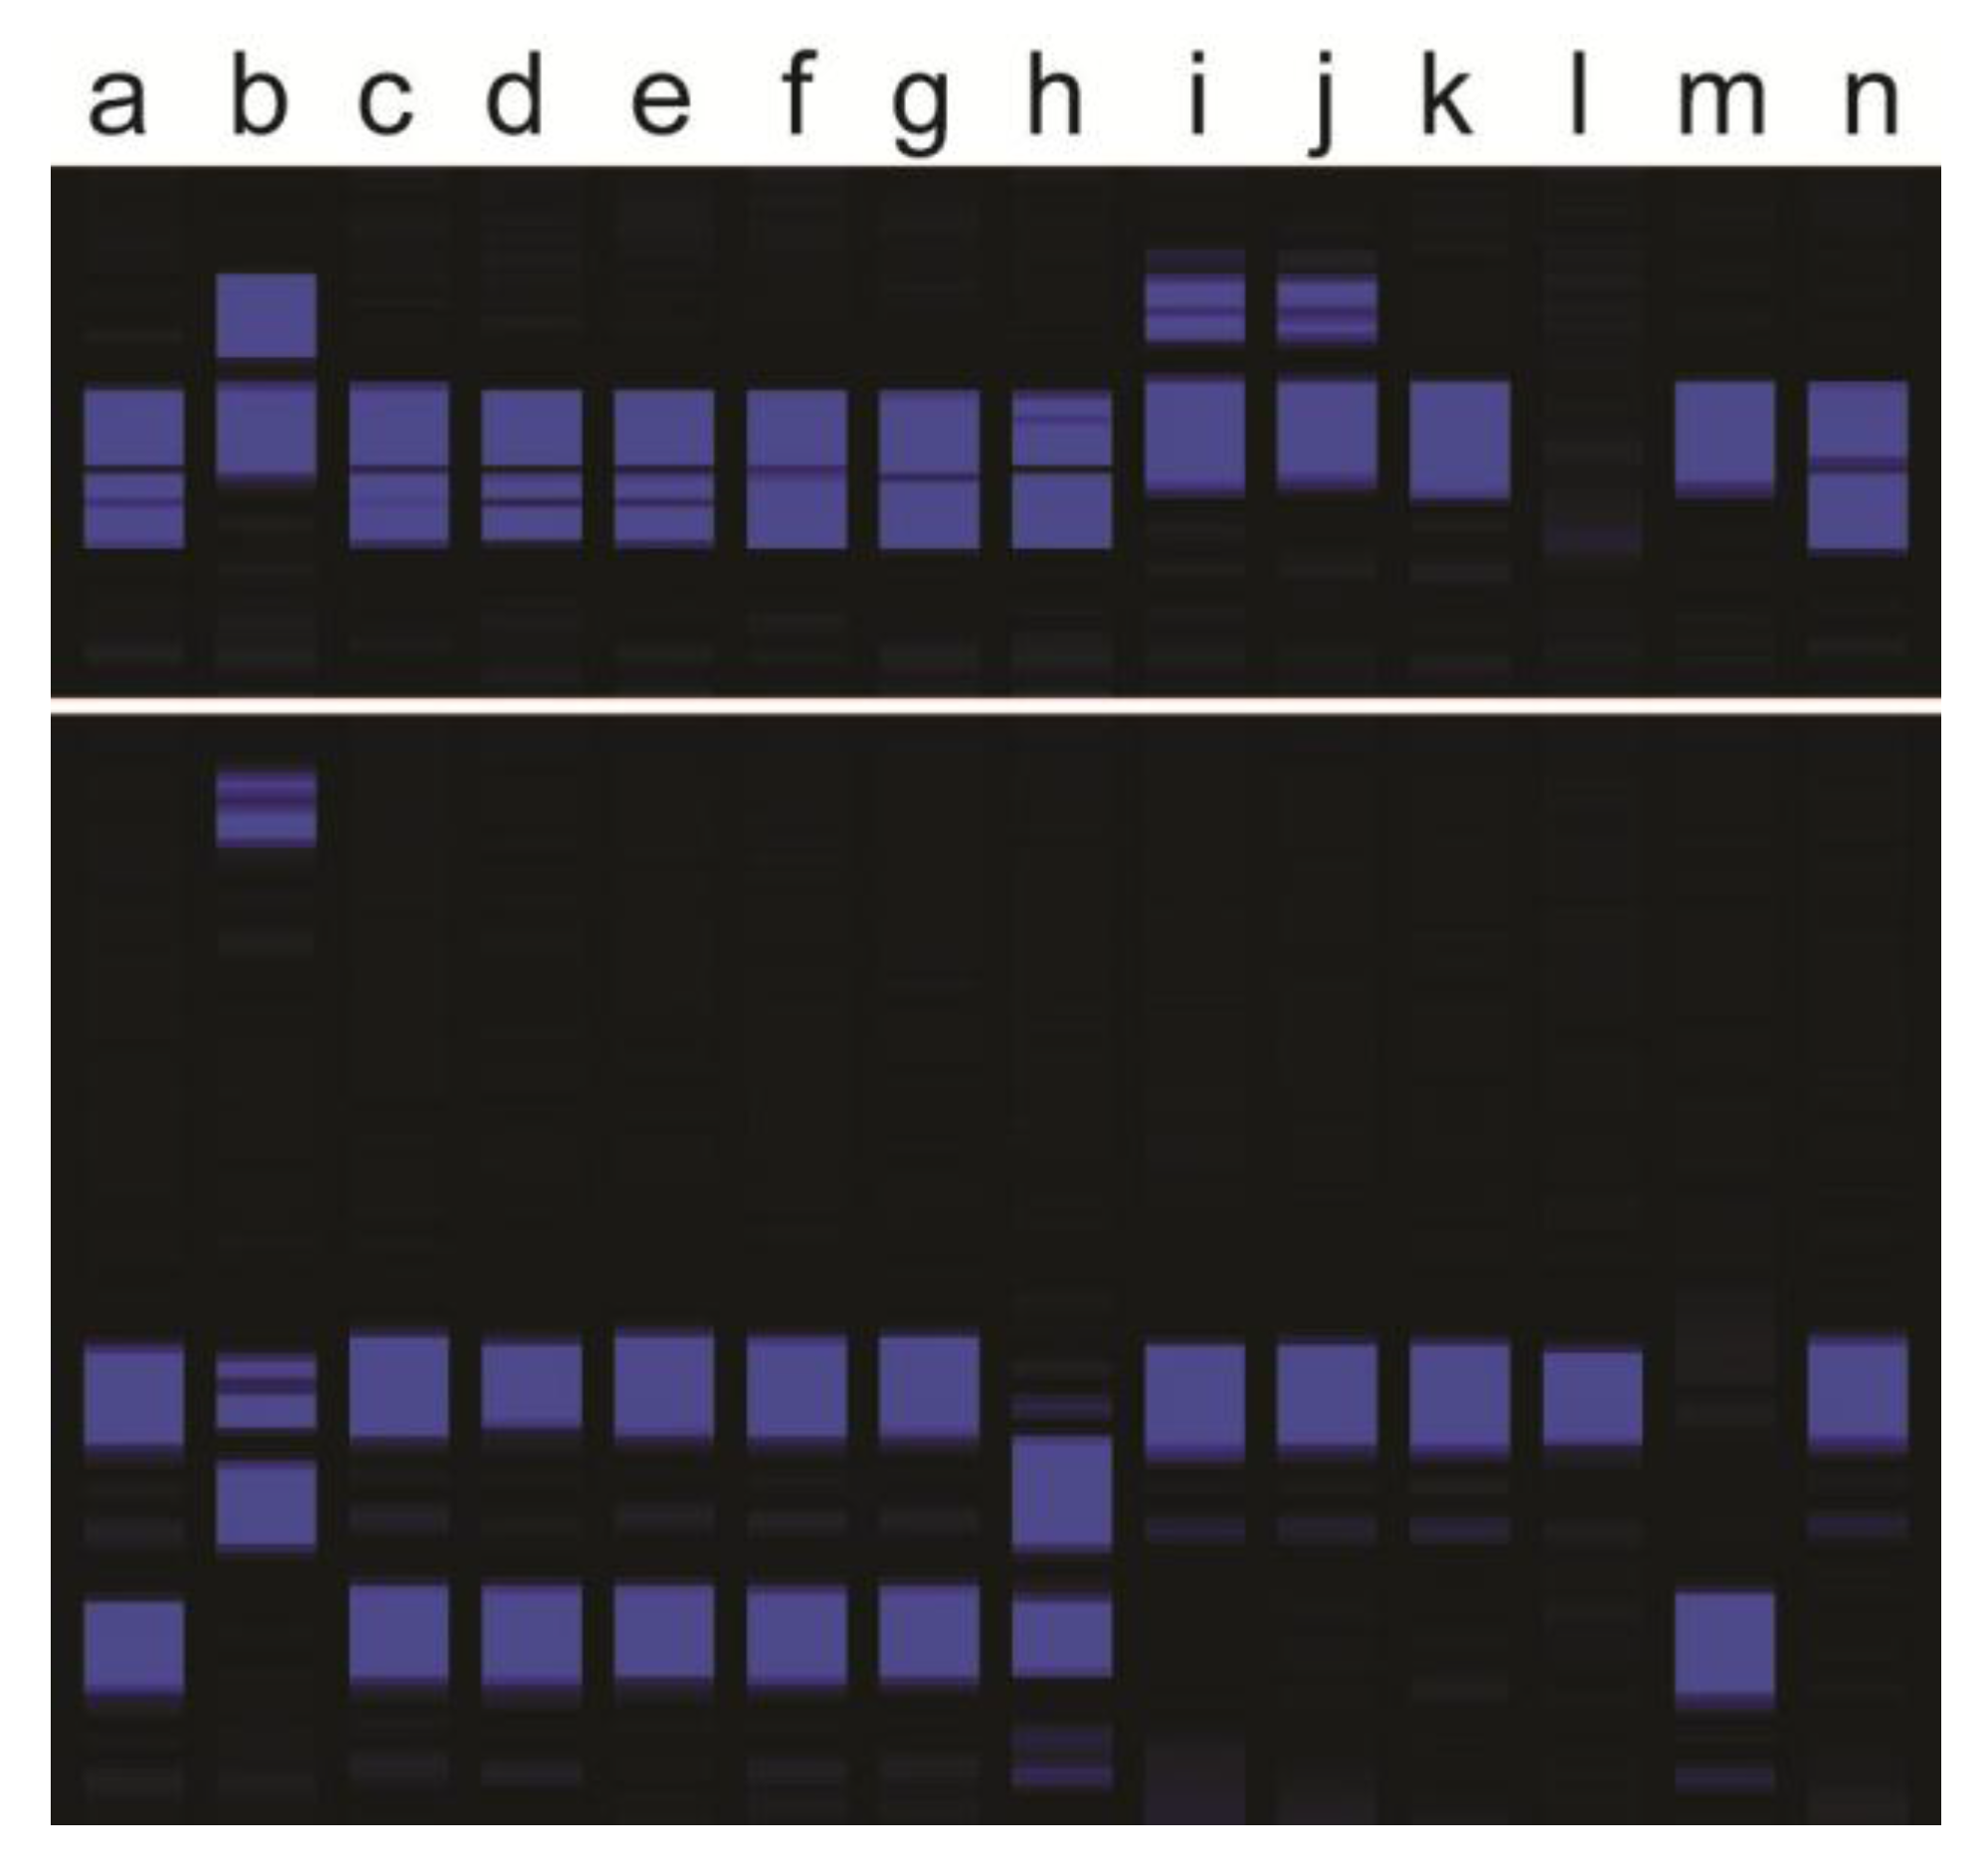
Figure 2.
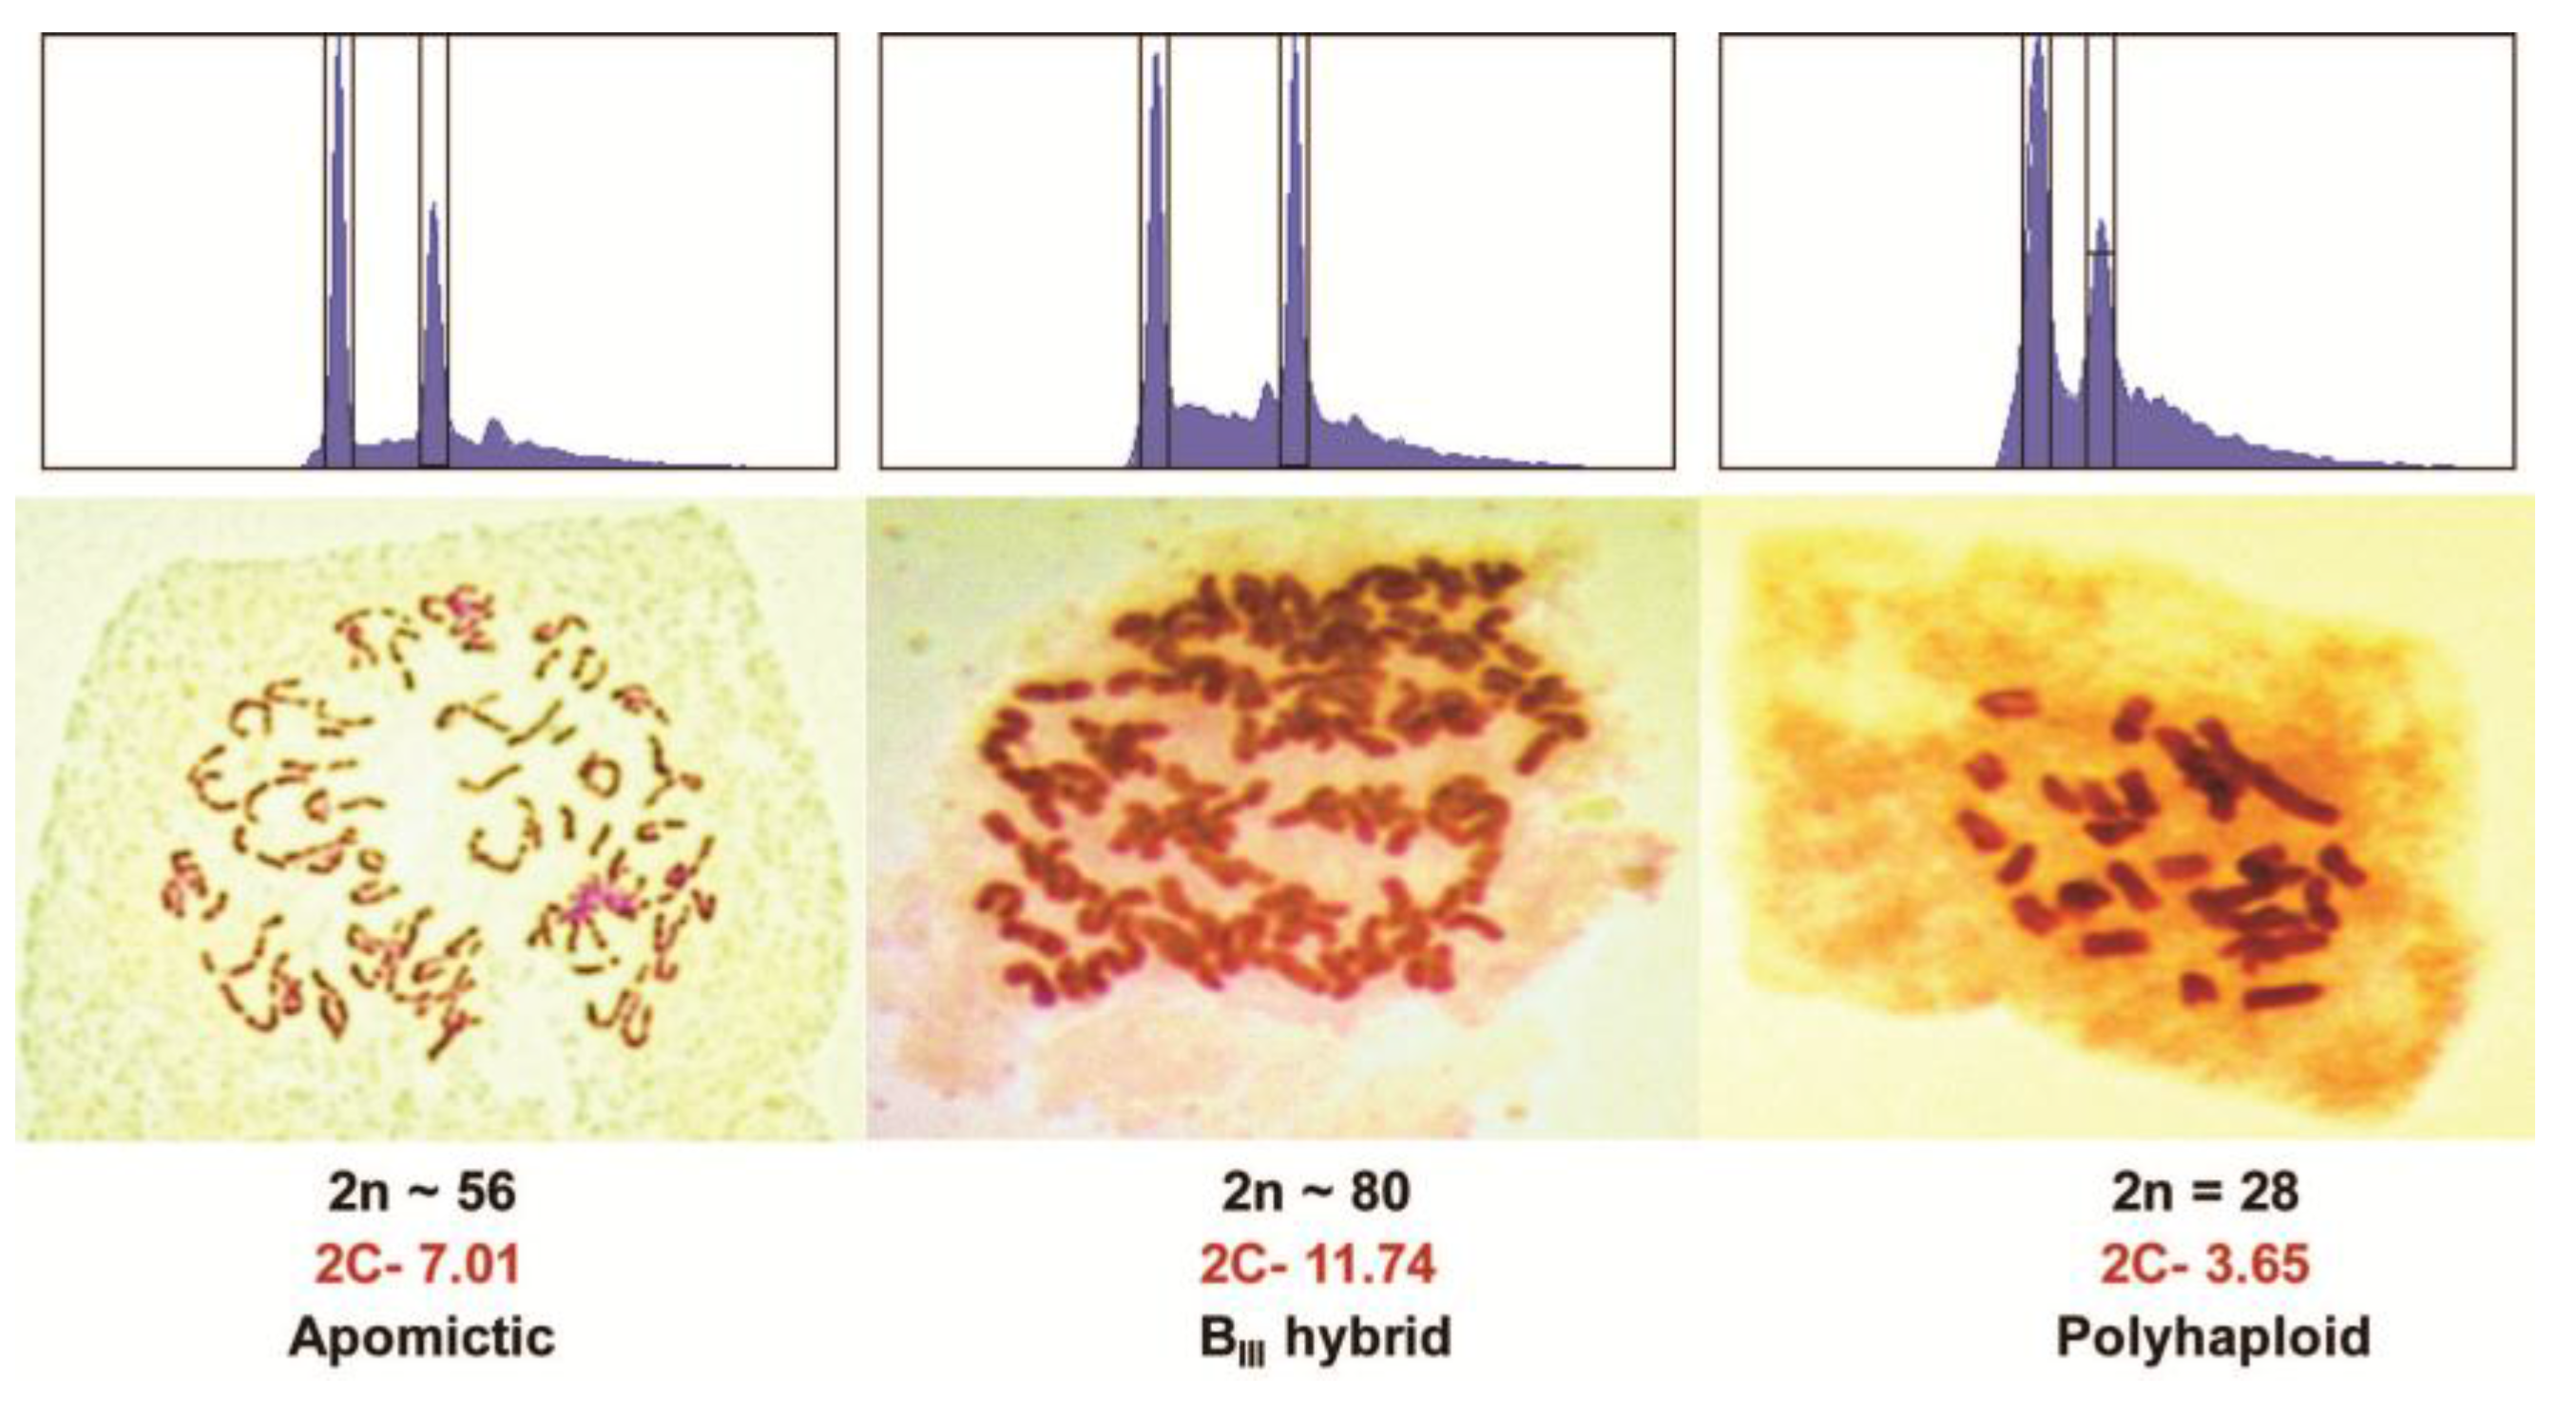
Flow cytometry traces and chromosome stains of an apomict, a BIII hybrid, and a polyhaploid from a cross of PI440603 × PI499557 Kentucky bluegrass. The left peak of the flow cytometry graph is a spiked CEN standard while the right peak is the main 2C peak of the sample.
Figure 2.
Flow cytometry traces and chromosome stains of an apomict, a BIII hybrid, and a polyhaploid from a cross of PI440603 × PI499557 Kentucky bluegrass. The left peak of the flow cytometry graph is a spiked CEN standard while the right peak is the main 2C peak of the sample.


Table 1.
Apomict and ‘offtype’ progeny possibilities from Kentucky bluegrass hybridization events.
| Progeny Type | Maternal Gamete 1 | Paternal Gamete | Fusion Method | Embryo Ploidy 2 | Endosperm Ploidy 3 |
|---|---|---|---|---|---|
| Apomict | unreduced | -- | Parthenogenesis | 2C | 5C (6C) |
| Polyhaploid | reduced | -- | Parthenogenesis | C | 3C (4C) |
| BII hybrid | reduced | reduced | Fertilization | 2C | 3C |
| BIII hybrid (M) 4 | unreduced | reduced | Fertilization | 3C | 5C |
| BIII hybrid (P) | reduced | unreduced | Fertilization | 3C | 4C |
| BIV hybrid | unreduced | unreduced | Fertilization | 4C | 6C |
1 reduced gametes occur through meiosis while unreduced occur through apospory; 2 embryo C-value is based on parental ploidy numbers of 2n (not 2× in polyploids). Additionally, in Kentucky bluegrass, the numbers will not be exact due to aneuploidy; 3 endosperm can develop through pseudogamy or double fertilization, resulting in endosperm C-values from reduced or (unreduced) paternal gametes; 4 (M) corresponds to maternal source while (P) corresponds to paternal.
Table 2.
Apomict and offtype frequencies from three reciprocal Kentucky bluegrass crosses determined through SSR marker genotyping and flow cytometry. Ninety-six seeds were germinated from each cross, and numbers tested that are less than 96 represent seedling mortality.
Table 2.
Apomict and offtype frequencies from three reciprocal Kentucky bluegrass crosses determined through SSR marker genotyping and flow cytometry. Ninety-six seeds were germinated from each cross, and numbers tested that are less than 96 represent seedling mortality.
| Progeny Type | NorthStar × PI371768 | PI371768 × NorthStar | Washington × PI440603 | PI440603 × Washington | PI499557 × PI440603 | PI440603 × PI499557 |
|---|---|---|---|---|---|---|
| Apomict | 78 | 91 | 67 | 88 | 83 | 86 |
| Polyhaploid | 3 | 0 | 10 | 3 | 1 | 2 |
| BII Hybrid | 1 | 0 | 0 | 1 | 0 | 0 |
| BIII Hybrid | 1 | 0 | 0 | 3 | 3 | 0 |
| Total Tested | 83 | 91 | 77 | 95 | 87 | 88 |
© 2018 by the authors. Licensee MDPI, Basel, Switzerland. This article is an open access article distributed under the terms and conditions of the Creative Commons Attribution (CC BY) license (http://creativecommons.org/licenses/by/4.0/).
Share and Cite
MDPI and ACS Style
Bushman, B.S.; Joshi, A.; Johnson, P.G. Molecular Markers Improve Breeding Efficiency in Apomictic Poa Pratensis L. Agronomy 2018, 8, 17. https://doi.org/10.3390/agronomy8020017
AMA Style
Bushman BS, Joshi A, Johnson PG. Molecular Markers Improve Breeding Efficiency in Apomictic Poa Pratensis L. Agronomy. 2018; 8(2):17. https://doi.org/10.3390/agronomy8020017
Chicago/Turabian StyleBushman, B. Shaun, Alpana Joshi, and Paul G. Johnson. 2018. "Molecular Markers Improve Breeding Efficiency in Apomictic Poa Pratensis L." Agronomy 8, no. 2: 17. https://doi.org/10.3390/agronomy8020017
Note that from the first issue of 2016, this journal uses article numbers instead of page numbers. See further details here.