Article

Linkage Map of a Gene Controlling Zero Tannins (zt-1) in Faba Bean (Vicia faba L.) with SSR and ISSR Markers

1
Qinghai Academy of Agricultural and Forestry Sciences, State Key Laboratory of Plateau Ecology and Agriculture and Qinghai Research Station of Crop Gene Resource & Germplasm Enhancement, Qinghai University, Xining 810016, Qinghai, China
2
State Key Laboratory of Plateau Ecology and Agriculture and College of Eco-Environmental Engineering, Qinghai University, Xining 810016, Qinghai, China
*
Author to whom correspondence should be addressed.
These authors contributed equally to this work.
Agronomy 2018, 8(6), 80; https://doi.org/10.3390/agronomy8060080
Submission received: 4 April 2018 / Revised: 18 May 2018 / Accepted: 18 May 2018 / Published: 23 May 2018

Abstract

:
Faba bean (Vicia faba L.), a partially allogamous species, is rich in protein. Condensed tannins limit the use of faba beans as food and feed. Two recessive genes, zt-1 and zt-2, control the zero tannin content in faba bean and promote a white flower phenotype. To determine the inheritance and develop a linkage map for the zt-1 gene in the faba bean germplasm M3290, F2 and F3 progenies were derived from the purple flower and high tannin content genotypes Qinghai12 and zt-1 line M3290, respectively. Genetic analysis verified a single recessive gene for zero tannin content and flower colour. In total, 596 SSR markers and 100 ISSR markers were used to test the polymorphisms between the parents and bulks for the contrasting flower colour via Bulked Segregant Analysis (BSA). Subsequently, six SSR markers and seven ISSR markers were used to genotype the entire 413 F2 population. Linkage analysis showed that the zt-1 gene was closely linked to the SSR markers SSR84 and M78, with genetic distances of 2.9 and 5.8 cM, respectively. The two flanked SSR markers were used to test 34 faba bean genotypes with different flower colours. The closely linked SSR marker SSR84 predicted the zt-1 genotypes with absolute accuracy. The results from the marker-assisted selection (MAS) from this study could provide a solid foundation for further faba bean breeding programmes.

1. Introduction

Faba bean (Vicia faba L.), one of the most important temperate food crops, is widely grown for human consumption in China, Ethiopia, Egypt and the Andean States of South America and for livestock feed in Europe and Australia [1]. To date, the average faba bean cultivation area is close to 2.5 million hectares annually, which ranks fourth among cool-season crops [2]. It has been demonstrated that growing faba bean is the most effective strategy for managing soil fertility through crop rotation, which contributes to sustainable agriculture [3].
Faba bean seeds together with other relative beans, have high nutritional values as they are excellent sources of protein, carbohydrates, minerals and fibre [4]. Nevertheless, faba bean also suffer from both biotic and abiotic factors that constrain their productivity and digestibility. Previous studies have demonstrated that condensed tannins are responsible for low-protein seeds and may decrease feed consumption due to their astringent taste [5]. Condensed tannins from faba bean may also decrease the efficiency of food utilization [6,7]. Although several methods, such as cooking and autoclaving, have been used to remove condensed tannins, these processes may also promote other changes in the seed compounds. Meanwhile, a significant problem in tannin removal is the high cost [8]. Compared to traditional methods, growing cultivars with low-tannin and zero-tannin content are the most effective, economic and environment-friendly strategy.
A previous study first reported the absence of tannins in the white flowers of faba bean varieties; this served an important role in the in vitro digestibility of nutrients in monogastric animals [9]. According to Picard [9], there are two inherited recessive genes, zt-1 and zt-2, that control the zero-tannin characteristic in faba bean and promote a white flower characteristic in the plant. Genetic studies also discovered that the genes in faba bean that control white-flowered plants actually block anthocyanin synthesis [10,11]. Breeders usually use crosses between intergeneric and interspecific plants to improve their characteristics. However, faba bean genotype hybrids carrying different zero tannin genes generally give rise to segregating progenies. Therefore, identifying varieties with zero tannins will be helpful for both choosing appropriate crosses for breeders [12] and representing a reservoir of genes for tannin-free plants. To date, great progress has been made in developing faba beans with zero tannins. Several markers have been mapped to the zt-1 region. The number of markers is still limited, and more markers are needed to fill the gaps for more efficient marker-assisted selection, further fine mapping and map-based cloning of the gene.
Faba bean, a partially allogamous and genetically isolated plant, tolerates no exchange of genes with any other species, including its close relative Vicia narbonensis [13]. The perception is that genetic mapping and marker-assisted selection (MAS) in faba bean faces enormous challenges because of its huge genome size (13,000 Mb) [14,15], even though faba bean is diploid and has fewer chromosomes (2n = 2x = 12) than other species in the genus Vicia L. [16].
Various molecular markers have been widely used in faba bean, especially in genetic diversity and relationships among germplasm collections. For example, amplified fragment length polymorphism (AFLP) markers were used to assess the genetic diversity in 22 recent faba bean elite cultivars [17]. Zong et al. [18] subsequently analysed winter and spring [19] faba bean accessions worldwide using AFLP markers. Linkage maps of the gene controlling zero tannin in faba bean with SCAR markers developed from linked RAPD markers has been published [20]. Compared with other molecular markers, simple sequence repeats (SSR) markers are based on the amplification of sequence repetitions. It is a simple and repeatable method that can produce abundant polymorphic fragments. Therefore, SSR markers have the advantage of being a valuable tool for constructing genetic linkage maps and marker-assisted trait selection in faba bean breeding efforts.
As mentioned above, Picard [9] and Bond [10] first reported that the seed coat of all white flowered varieties of faba bean was free of tannins. The faba bean germplasm M3290, which is originally from the Mediterranean region, is a tannin-free cultivar with white flowers and the zt-1 gene [9]. The variety was collected from the International Center for Agricultural Research in the Dry Areas (ICARDA) Syria [1]. It was then developed by the Qinghai Academy of Agricultural Science and has been widely used in faba bean breeding programmes in China in the past few years (unpublished data).
The objective of this study was to (1) construct a linkage map of the temporary named gene zt-1 the controls the zero-tannin trait in the M3290 variety and (2) identify closely linked markers that could be useful for marker-assisted selection (MAS) in faba bean and further cloning of the gene.

2. Materials and Methods

2.1. Plant Materials

The Qinghai12 variety has coloured flowers (purple) and high tannin content, while the genotype zt-1 M3290 [1] produces white flowers and has a tannin-free seed coat. M3290 was used as the male parent and Qinghai12 was used as the female parent to develop the population lines. An F2 population with 413 plants and the derived F2:3 families with 8–10 plants each that were derived from the cross between the tannin-free cultivar, M3290, and a condensed tannin line, Qinghai12, were used for mapping the tannin-free gene zt-1. The parents and populations used in this study were grown in the fields of the Qinghai Agriculture and Forestry Academy. A total of 413 F2 progenies were grown during the 2015 growing season on the experimental farm and all F3 lines with ten or twenty plants each were grown in the next spring in 2016. All the parents and progenies were carefully characterized for their phenotypes by their colour in the field and tested for tannin content in the laboratory during the flowering period. The colours of the offspring were classified as two types, e.g., “white” and “purple”, those with the same flower colour as M3290 were scored as “white” and the remainder with the same flower colour as Qinghai12 were scored as “purple”.
A representative collection of 34 elite faba bean accessions from the major faba bean production regions in China, including ten main spring varieties from Qinghai province, four spring varieties from Gansu province, four Yunnan germplasms, six winter varieties from Sichuan province, seven Jiangsu winter cultivars and three Zhejiang winter cultivars, were used to validate the molecular markers identified to be linked to the zt-1 gene. Two main types in China, the spring and winter faba bean, were both selected in this study to compare different ecotypes of faba bean germplasm. All the representative faba bean samples from different areas were grown on the experimental farm at the Qinghai Agriculture and Forestry Academy.

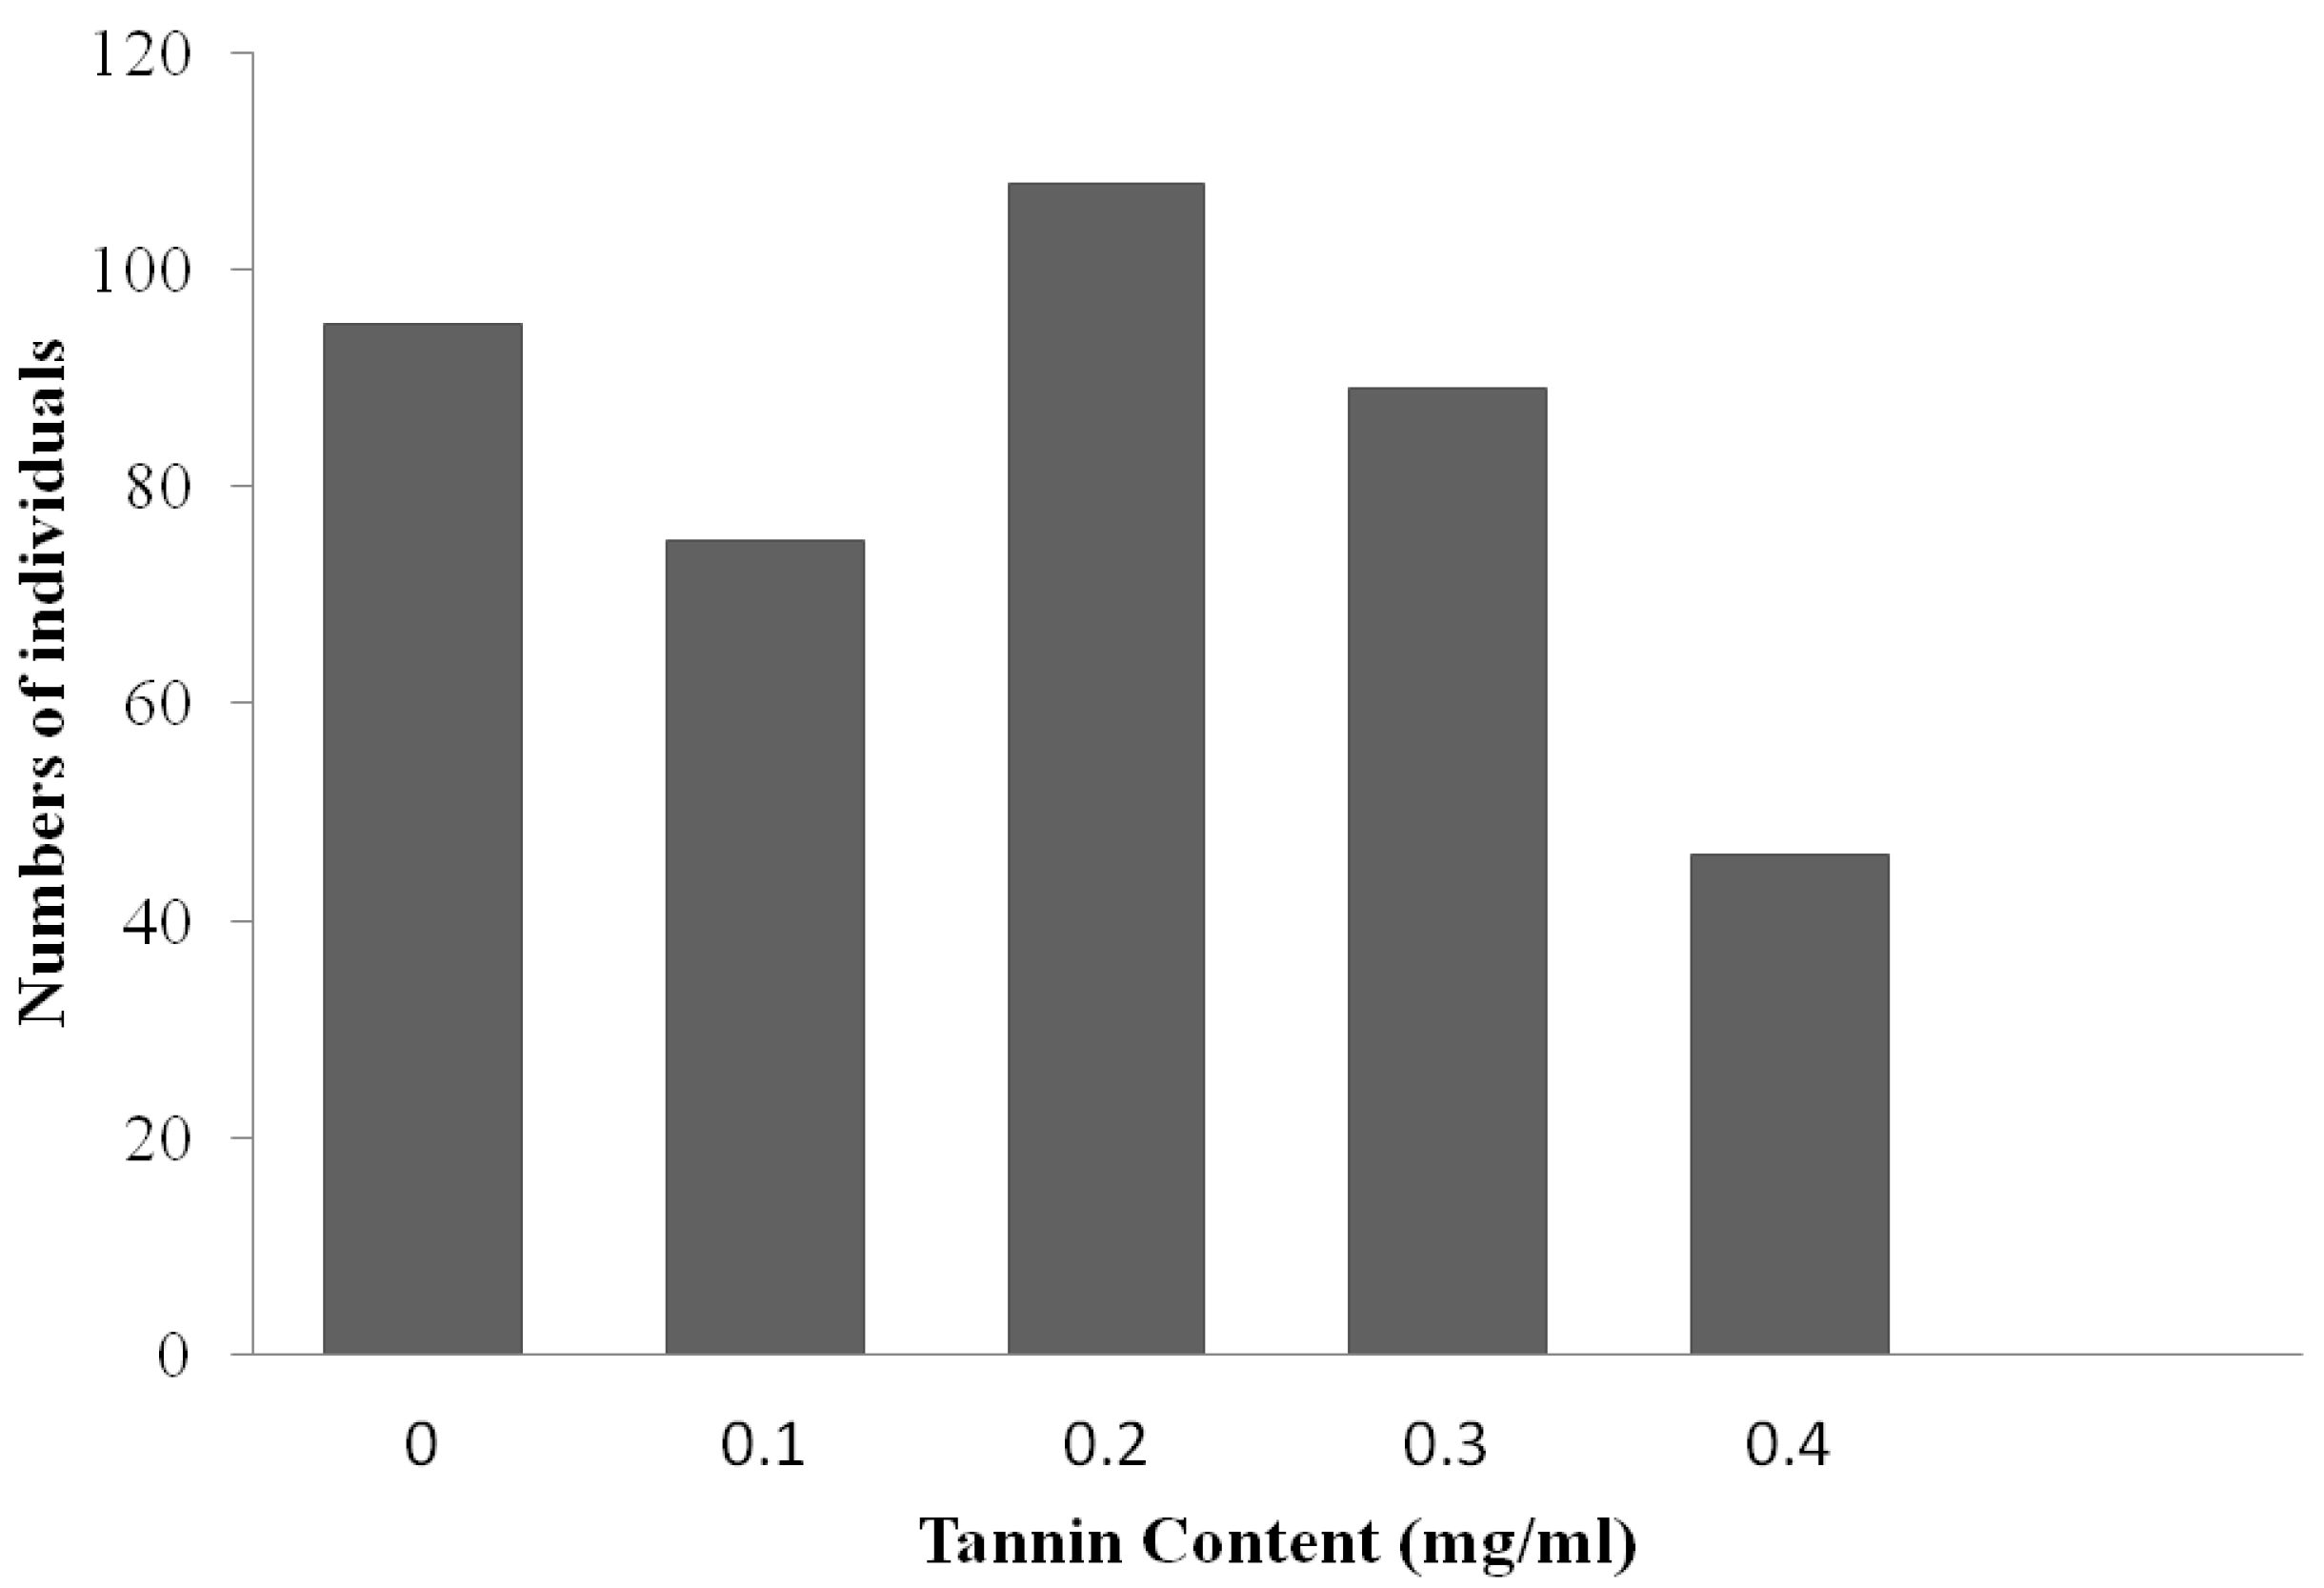
2.2. Tannin Measurement

To enhance the phenotype accuracy and to confirm the tannin content in the genotypes with different colours, the tannin content was determined in the parents and F2 individuals with different flower colours. The Folin-Donis (F-D) method was used to measure the tannin content with a few modifications [21].

2.3. DNA Extraction

After measuring the condensed tannin content, the newly expanded faba bean leaves were used to extract genomic DNA. Genomic DNA was extracted using the DS (Sodium Lauroylsarcosine) protocol [22,23]. Tannin-free and condensed tannin bulks were established from 20 free (white flower) and 20 condensed (purple flower) tannin content F2 plants, respectively. Bulked segregant analysis (BSA) [24] was used to identify whether the markers were linked to the gene controlling the zero-tannin characteristic.

2.4. Marker Analysis

A total of 596 pairs of SSR primers were screened between the two parents and bulks. Among them, 128 SSR markers were referred to in Ma et al. [25], 236 SSR markers were selected from a linkage map developed by El-Rodeny et al. [26], and the remaining SSR markers (unpublished data) were kindly provided by the Institute of Crop Science, Chinese Academy of Agricultural Sciences (ICP, CAAS). The ISSR markers used in this study were according to Zietkiewicz et al. [27]. All the primers used in this study were synthesized by Shanghai Sangon Biological Engineering Technology and Services Company Ltd., Shanghai, China.
SSR reactions were performed in a 20 μL reaction volume containing 1 unit of Taq DNA polymerase (TaKaRa), 2 μL of 10× buffer (50 mmol KCl (TaKaRa), 10 mmol Tris-HCl (TaKaRa, pH 8.3), and 1.5 mmol MgCl2 (TaKaRa), 200 μmol of each dNTP (Roche, Basel, Switzerland), 6 pmol of each primer and 50–100 ng of template DNA. The PCR conditions were as follows: denaturation at 94 °C for 4 min; 35 cycles of 94 °C for 1 min, 50–61 °C (depending on primers) for 1 min, and 72 °C for 1 min; and a final extension at 72 °C for 10 min. ISSR-PCR amplifications were performed in 25 μL reaction volumes with 80 ng of genomic template DNA, 2 μL of 10 mM Tris–HCl, 50 mM KCl, 15 mM MgCl2, 0.2 mM of each dNTP, 120 nM of each primer, and 1 U of Taq DNA polymerase. ISSR-PCR reactions were performed with the following conditions: denaturation at 95 °C for 5 min; 35 cycles of 95 °C for 30 s, annealing at optimal temperature for 1 min, and 72 °C for 1 min; and a final elongation step at 72 °C for 10 min.
PCR reactions were performed in a PTC200 Peltier Thermal Cycler. PCR products were then mixed with 4 μL of the formamide loading buffer (98% formamide, 10 mM EDTA, 0.25% bromophenol blue, and 0.25% xylene cyanol, pH 8.0, Shanghai Sangon) and heated at 94 °C for 5 min. The PCR products were separated on 6% denaturing polyacrylamide gels, 8% non-denaturing polyacrylamide gels or 1.5% agarose gels. Each 5–7 μL sample was loaded and then resolved using the silver staining method as described by Bassam et al. [28] or ethidium bromide and then photographed.

2.5. Statistical Analysis and Genetic Mapping

The Chi-square tests (χ2) were used to determine the theoretical expectation based on the assumption of a single Mendelian gene controlling zt-1. Recombination fractions were converted to centiMorgans (cM) and the genetic distances of closely linked markers were calculated with software JOINMAP version 4.0 using the Kosambi mapping function [29]. A LOD score of 3.0 was used as a threshold for grouping and a maximum recombination fraction of 0.5 were employed as linkage criteria to establish the linkage group [30].

3. Results

3.1. Phenotypic and Genetic Analyses

In the flower testing in the field, M3290 had white flowers, whereas Qinghai12 had purple flowers. In the F2 population, there were 95 white flowers and 318 purple flowers in the flower test, which fits a 1:3 ratio (χ21:3 = 0.879, p = 0.348), consistent with the zt-1 gene behaving as a single recessive gene in this population. Simultaneously, the tannin content also segregated in a 1:3 ratio after measuring the F2 population, as the 95 plants with white flowers were all tannin-free (0 mg/mL), and the 318 plants with purple flowers presented tannin content ranging from 0.1 to 0.4 mg/mL. The histogram for tannin content was drawn to see the distribution of the trait (Figure 1). When the flower colours of F3 families were tested during the same period in the next year, the segregation of these families conformed to a 1:2:1 ratio (χ21:2:1 = 1.59, p = 0.451) as expected for a single gene (Table 1).

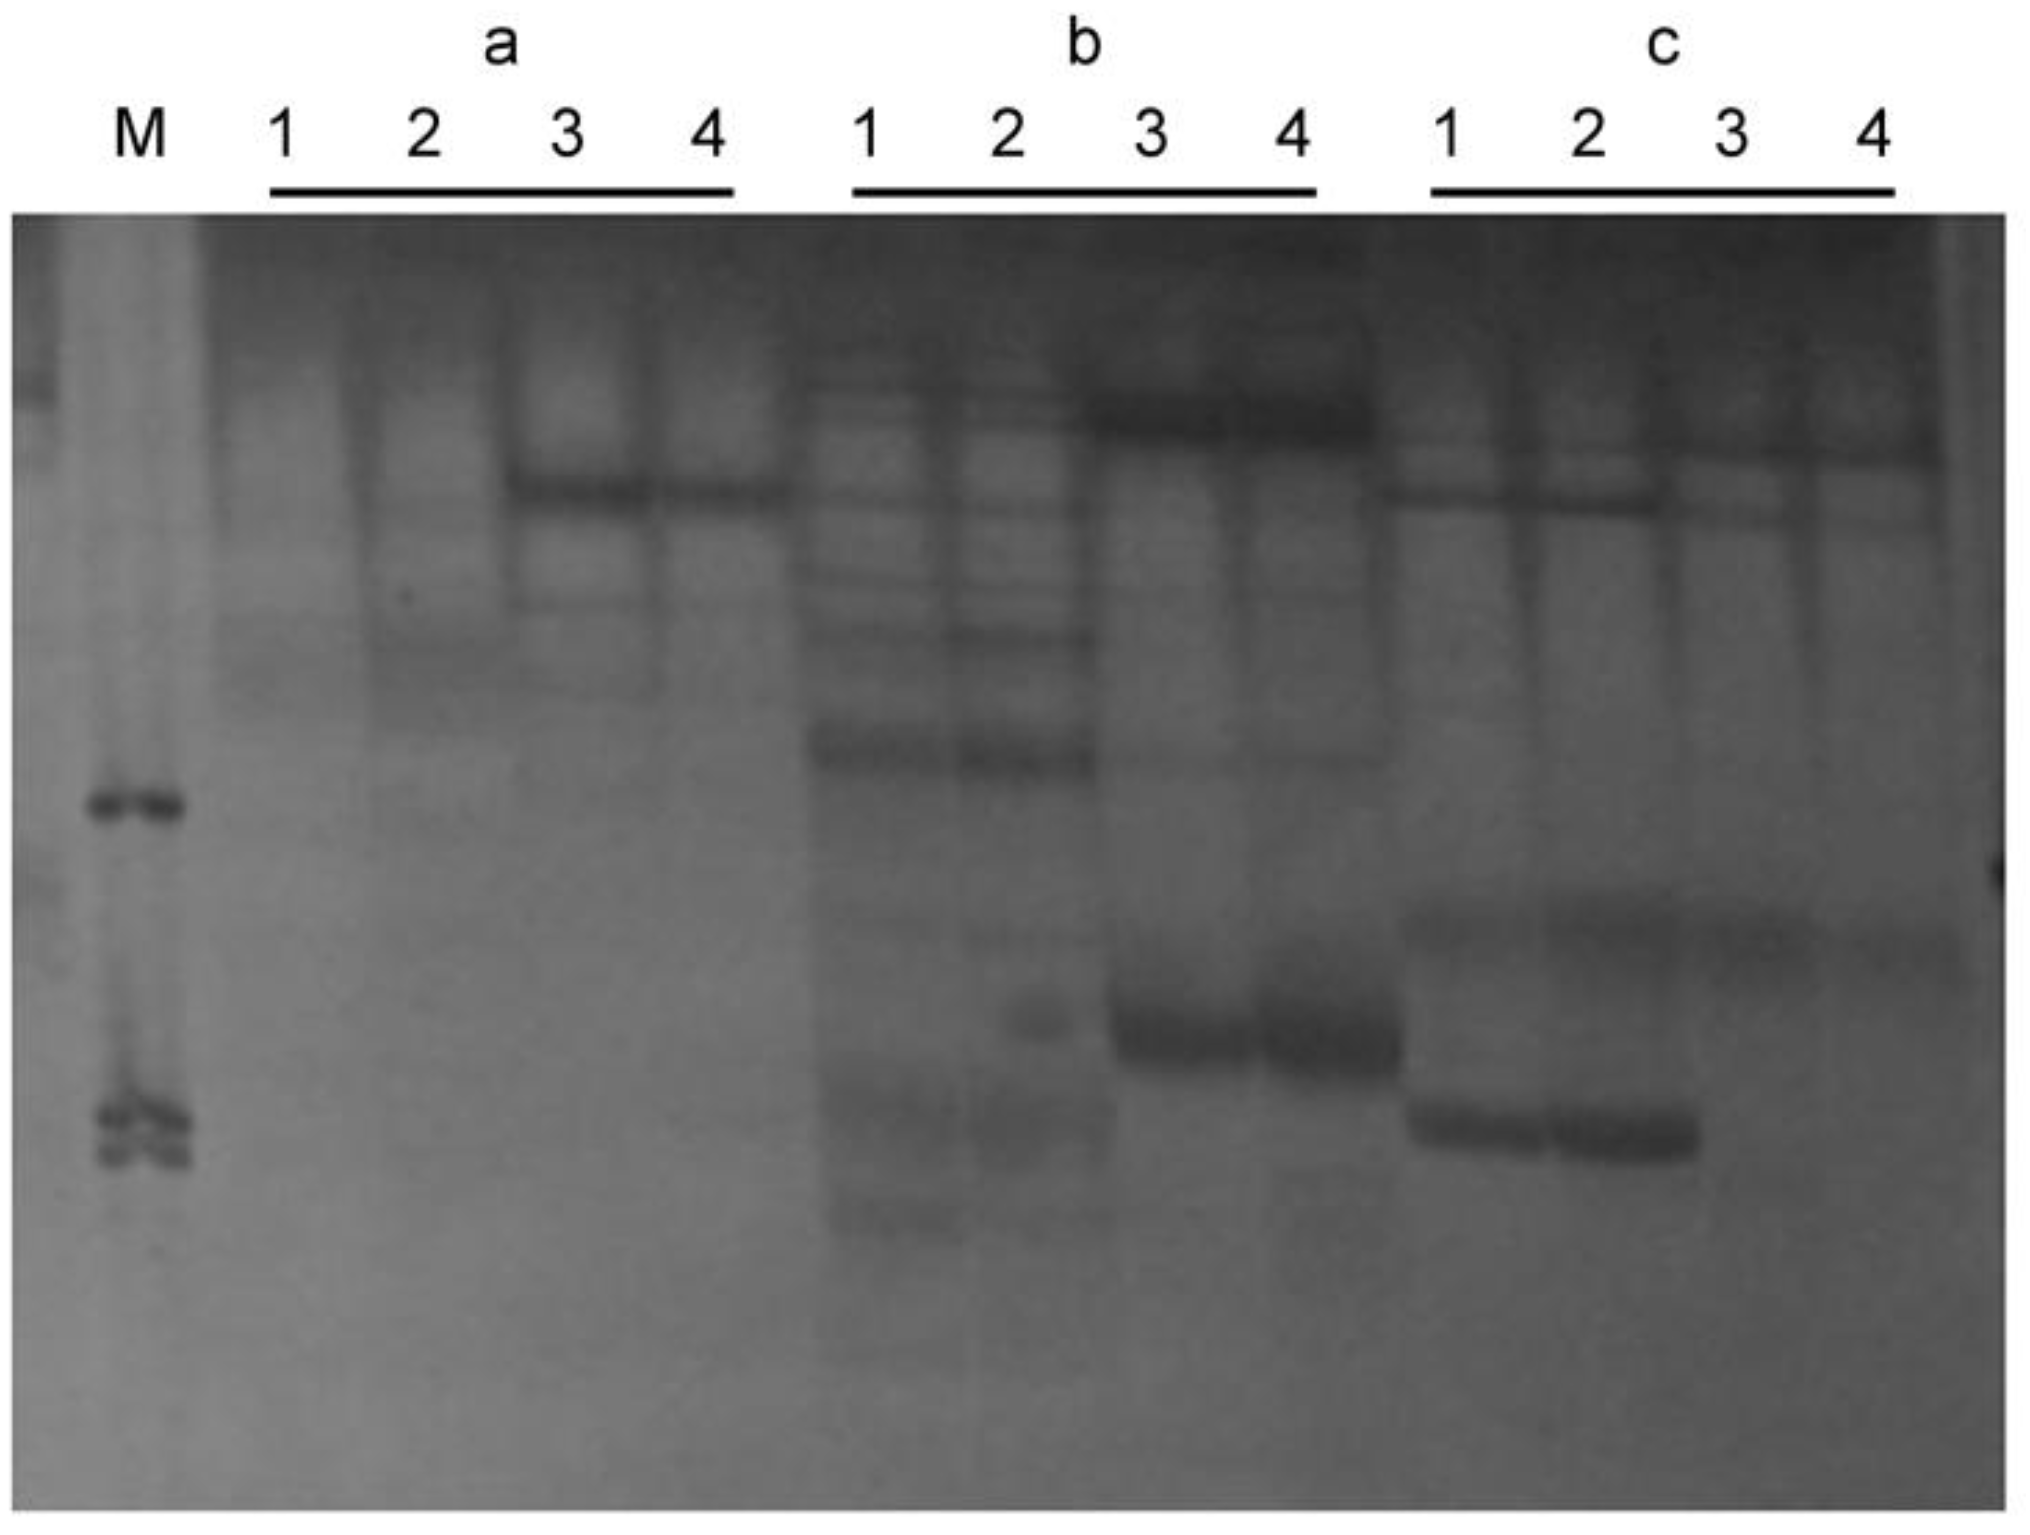
3.2. Identification of the SSR and ISSR Markers

Of the tested SSR primers, fifteen SSR markers, were polymorphic and contrasted between the purple and white flower bulks as well as the two parents (Figure 2). The selected polymorphic SSR markers were all co-dominant and could only be tested by 6% denaturing polyacrylamide gels. For example, the association between the SSR marker SSR84 in part of the F2 population segregating for the zt-1 gene is shown in Figure 2. The results shown in Figure 2 indicated that there were five genotypes with white flowers which showed the 900 bp bands with M3290, five genotypes with purple flowers which showed the same bands as Qinghai12 (1100 bp) and the other ten genotypes which showed heterozygous bands. For the tested 100 ISSR markers, seven markers, namely ISSR7, ISSR9, ISSR10, ISSR12, ISSR25, ISSR36 and ISSR48, were identified as polymorphic between the parents and bulks in this study (Figure S1). Among the seven ISSR markers, ISSR12 and ISSR25 were co-dominant and the other five were dominant (Figure 3).

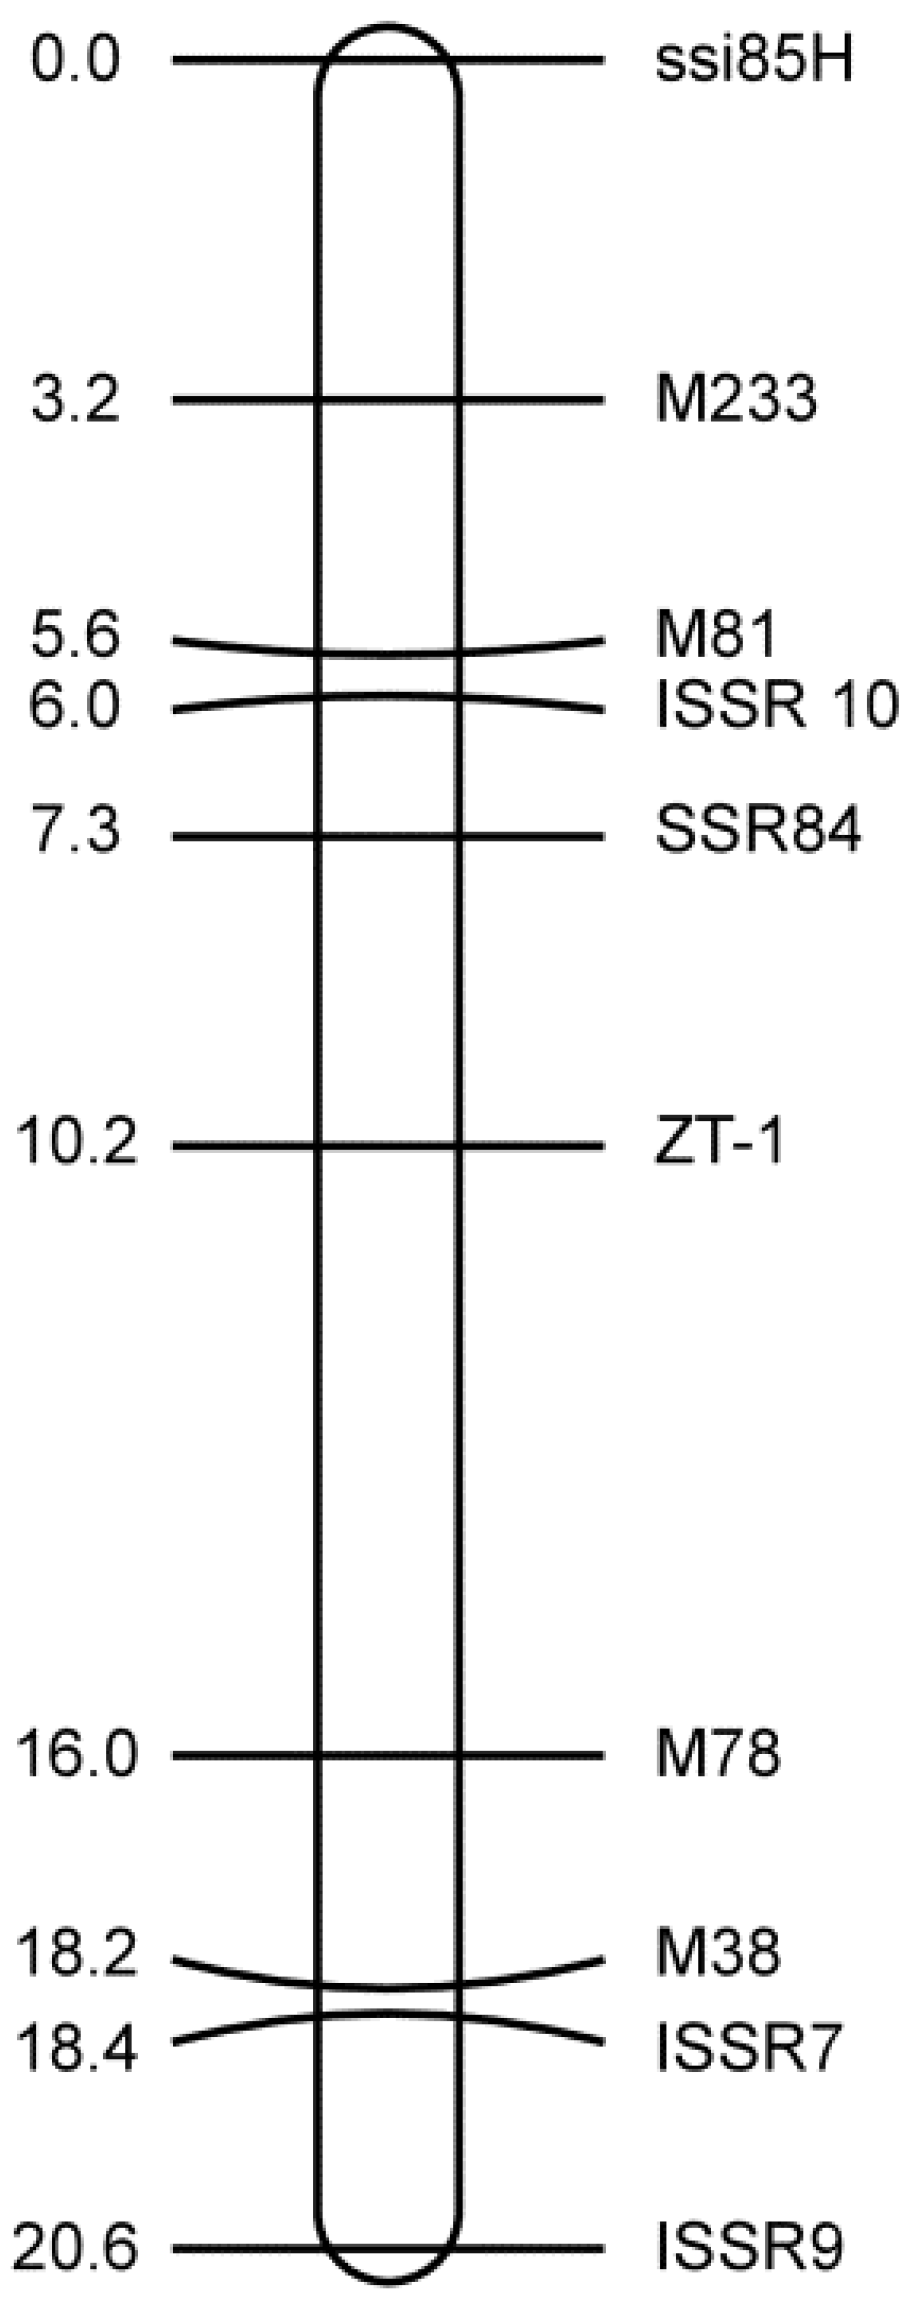
3.3. Mapping the SSR and ISSR Markers

The selected fifteen SSR markers and seven ISSR markers were then used to genotype the 413 F2 plants to construct the linkage map. After testing the 413 plants in the F2 population, it was evident that six SSR markers, M78, ssi85H, M233, SSR84, M81 and M38 (Table 2) and three ISSR markers were linked to zt-1 (Table 2). The results of the zt-1 linkage estimates with the nine polymorphic markers based on the phenotype and genotype data are shown in Figure 4.
The selected nine markers were mapped within a genetic interval of 20.6 cM flanking zt-1 (Figure 4). The flanking markers, SSR84 and M78, were closely linked with the zt-1 gene with genetic distances of 2.9 cM and 6.2 cM, respectively (Figure 4).

3.4. Closely Linked Markers for the Marker-Assisted Selection of zt-1

The two flanked markers (Figure 4), SSR84 and M78, with genetic distances of 2.9 cM and 6.2 cM, respectively, were first used to identify representative varieties from different areas of China to assess their potential use in the MAS. The results showed that when SSR84 was used for MAS, only M3290 and zt-1-carrying genotypes (white flowers) produced the expected band of 900 bp and the genotypes with purple flowers (without the zt-1 gene) produced 1100 bp bands. Nevertheless, the results of molecular detection with M78 was not helpful in the selection of the zt-1 gene in faba bean breeding programs (Table 3).
The other different PCR fragments amplified with other linked markers also could not distinguish lines with white flowers from coloured varieties. Therefore, it was verified that only SSR84 is helpful for selecting the zt-1 gene in faba bean programmes for tannin content in this study.

4. Discussion

4.1. Zt-1 Gene in Faba Bean Variety M3290

In this study, we identified markers to the single recessive gene zt-1 in the faba bean variety M3290 and mapped it with six SSR markers and three ISSR markers. We also tested the elite faba bean germplasms with the closely linked markers and the results provided a sound basis for further MAS in faba bean.
The absence of tannin content in faba bean is determined by two recessive genes, zt-1 and zt-2. In this study, zt-1 was inherited as a single recessive gene in the M3290/Qinghai12 population. This result is in accordance with that of Gutierrez et al. [20], who used a segregated F2 population derived from Vf6 and a zt-1 line. The segregation for both the flower colour and tannin content fit the expected 1:3 and 1:2:1 ratios, respectively, which is consistent with a single recessive gene that controls zero tannin content in faba bean. The linkage map of Vf6 × zt-1 F2 populations showed that the zt-1 gene was flanked with two SCAR markers with genetic distances of 3.6 cM (OPAF20776) and 9.7 cM (SCC5551).

4.2. SSR and ISSR Markers

A total of 596 SSR markers and 100 ISSR markers were used to screen the polymorphisms between parents as well as bulks in this study. The SSR markers were firstly randomly selected from each linkage group (LG) according to Ma et al. [25] and El-Rodeny et al. [26]. Also subsequently, unpublished SSR markers (including EST sequences) were kindly provided by the Institute of Crop Science, Chinese Academy of Agricultural Sciences (ICP, CAAS). Finally, ISSR markers were downloaded according to Zietkiewicz et al. [27] and used to test the polymorphisms between parents and bulks. The polymorphism selection results indicated that six SSR markers and seven ISSR markers showed clear and repeatable bands between parents and bulks. The linkage analysis showed that the six SSR markers were all linked with the zt-1 gene after genotyping the 413 F2 plants, but only three ISSR markers indicated linkage correlation with the zt-1 gene. The polymorphism tests verified the application of SSR markers in faba bean, and also provided us with a sound basis for further fine mapping of the zt-1 gene. Nine markers, including six SSR markers and three ISSR markers were mapped at zt-1 locus in this study. The flanking markers, SSR84 and M78, were closely linked with the zt-1 gene with genetic distances of 2.9 cM and 6.2 cM, respectively. Although several markers have been mapped to the zt-1 region, the number of the markers is still limited, and more are needed for more efficient marker-assisted selection, fine mapping and map-based cloning of the zt-1 gene.
Compared to previous studies, a linkage map of the zt-1 region with nine markers, including six SSR markers and three ISSR markers were constructed with a F2 population.

4.3. Closely Linked Markers and Their Application in MAS

Molecular markers closely linked to the target gene are considered important tools for MAS in plant breeding programmes [31]. However, faba bean possess a large genome size and limited molecular markers. Therefore, MAS progress in faba bean breeding faces enormous challenges [1,32]. In this regard, it is urgent to develop more valuable and closely linked markers for faba bean breeding.
Previous studies allowed the prediction of the zt-1 genotypes with a 95% accuracy [20]. In this study, two flanking markers were used to test their suitability in MAS, and the closely linked marker SSR84 was verified to be a powerful tool (100% accuracy of the selection of the zt-1 gene) for further faba bean breeding. Owing to the recessive nature of the faba bean flower and tannin content traits, crops are often segregated by crosses that cause devaluation a few years after being grown for commercial production [33]. We present a convenient marker in this study that is closely linked with the zt-1 gene and might resolve this problem.

4.4. Faba Bean Breeding Program of Variety M3290

White flowers and zero tannin content are controlled by a single recessive gene. These and many other good agronomic traits make M3290 a desirable donor for faba bean breeding programmes. In fact, M3290 was used in breeding programmes a few years ago in China. The faba bean variety ‘TF26’ and some other lines were developed with M3290 by the Qinghai Academy of Agriculture and Forestry Sciences; these varieties showed pure white flowers in fields and zero tannin contents. However, the limited genetic background and linked molecular markers for the zt-1 gene still hampers the use of the gene in breeding programs. The demonstration of the zt-1 gene in the germplasm M3290 and the closely linked markers identified in this study should accelerate its application in breeding programmes and SSR84 closely linked with the zt-1 gene could exactly distinguish flowers with different genotypes.

5. Conclusions

F2 and F3 progenies derived from M3290 and Qinghai12 were used for phenotypic and genetic analyses, and the results indicated that the zt-1 gene in this population behaved as a single recessive gene. Selected SSR markers and ISSR markers were used to genotype the entire 413 F2 population, and linkage analysis showed that the zt-1 gene was closely linked to the SSR markers SSR84 and M78, with genetic distances of 2.9 and 5.8 cM, respectively. SSR marker SSR84 could predict the zt-1 genotypes in faba bean breeding.

Supplementary Materials

The following are available online at https://www.mdpi.com/2073-4395/8/6/80/s1, Figure S1: PCR amplification results of the ISSR marker ISSR10 in part of the F2 population segregating for zt-1.

Author Contributions

X.Z., W.H., Y.L. conceived and designed the experiments; Q.Y. and W.S. performed the experiments; P.L. and Y.T. analyzed the data; W.H. contributed reagents/materials/analysis tools; X.Z. and W.H. wrote the paper.

Acknowledgments

This research was supported by the National Natural Science Foundation of China (NSFC-31360363) and the China Agriculture Research System (CARS-08). We are also grateful to Zong at CAAS in Beijing, China for the valuable advice and for providing SSR markers for our study.

Conflicts of Interest

The authors declare no conflicts of interest.

References

  1. Duc, G.; Bao, S.; Baumc, M.; Redden, B.; Sadiki, M. Diversity maintenance and use of Vicia faba L. genetic resources. Field Crop. Res. 2010, 115, 270–278. [Google Scholar] [CrossRef]
  2. FAO. United Nations. 2016. Available online: http://faostat3.fao.org/download/Q/QC/E (accessed on 10 October 2016).
  3. Stoddard, F.L.; Hovinen, S.; Kontturi, M.; Lindström, K.; Nykänen, A. Legumes in Finnish agriculture: history, present status and future prospects. Agric. Food Sci. 2009, 18, 191–205. [Google Scholar] [CrossRef]
  4. Friedman, M. Nutritional value of proteins from different food sources. A review. J. Agric. Food Chem. 1996, 44, 6–29. [Google Scholar] [CrossRef]
  5. Wiseman, J.; Cole, D.J.A. European legumes in diets for non-ruminants. In Recent Advances in Animal Nutrition; Haresign, W., Cole, D.J.A., Eds.; Butterworths: London, UK, 1988; pp. 13–37. [Google Scholar]
  6. Martin-Tanguy, H.; Guillaume, J.; Kossa, A. Condensed tannins in horse bean seeds: Chemical structure and apparent effects on poultry. J. Sci. Food Agric. 1977, 28, 757–765. [Google Scholar] [CrossRef]
  7. Cansfield, P.E.; Marquardt, R.R.; Campbell, L.D. Condensed proanthocyanidins of faba beans. J. Sci. Food Agric. 1980, 31, 802–812. [Google Scholar] [CrossRef] [PubMed]
  8. Vander Poel, A.F.B.; Dellaert, L.M.W.; Van Norel, A.; Helsper, J.P.F.G. The digestibility in piglets of faba bean (Vicia faba L.) as affected by breeding towards the absence of condensed tannins. Br. J. Nutr. 1992, 68, 793–800. [Google Scholar] [CrossRef]
  9. Picard, J. Apercu sur l’héreditédu caractére absence de tannins dans les graines de féverole (Vicia faba L.). Ann. Amelior. Plant. 1976, 26, 101–106. [Google Scholar]
  10. Bond, D.A. In vitro digestibility of the testa in tannin-free field beans (Vicia faba L.). J. Agric. Sci. Camb. 1976, 86, 561–566. [Google Scholar] [CrossRef]
  11. Cabrera, A.; Martin, A. Genetics of tannin content and its relationship with flower and testa colours in Vicia faba L. J. Agric. Sci. Camb. 1989, 113, 93–98. [Google Scholar] [CrossRef]
  12. Crofton, G.R.A.; Bond, D.A.; Duc, G. Potential seed multiplication problems arising from the existence of two genes for the absence of tannin in Vicia faba L. Plant Var. Seeds 2000, 13, 131–139. [Google Scholar]
  13. Alghamdi, S.S.; Migdadi, H.M.; Ammar, M.H.; Paull, J.G.; Siddique, K.H.M. Faba bean genomics: Current status and future prospects. Euphytica 2012, 186, 609–624. [Google Scholar] [CrossRef]
  14. Bennett, M.D.; Smith, J.B. Nuclear DNA amounts in angiosperms. Proc. R. Soc. Lond. B Biol. Sci. 1982, 216, 179–199. [Google Scholar] [CrossRef]
  15. Johnston, J.S.; Bennett, M.D.; Rayburn, A.L.; Galbraith, D.W.; Price, H.J. Reference standards for determination of DNA content of plant nuclei. Am. J. Bot. 1999, 86, 609–613. [Google Scholar] [CrossRef] [PubMed]
  16. Raina, S.N.; Ogihara, Y. Ribosomal DNA repeat unit polymorphism in 49 Vicia species. Theor. Appl. Genet. 1995, 90, 477–486. [Google Scholar] [CrossRef] [PubMed]
  17. Zeid, M.; Schon, C.C.; Lin, W. Genetic diversity in recent elite faba bean lines using AFLP markers. Theor. Appl. Genet. 2003, 107, 1304–1314. [Google Scholar] [CrossRef] [PubMed]
  18. Zong, X.; Liu, X.; Guan, J.; Wang, S.; Liu, Q.; Paull, J.G.; Redden, R. Molecular variation among Chinese and global winter faba bean germplasm. Theor. Appl. Genet. 2009, 118, 971–978. [Google Scholar] [CrossRef] [PubMed]
  19. Zong, X.; Ren, J.; Guan, J.; Wang, S.; Liu, Q.; Paull, J.G.; Redden, R. Molecular variation among Chinese and global germplasm in spring faba bean areas. Plant Breed. 2010, 129, 508–513. [Google Scholar] [CrossRef]
  20. Gutierrez, N.; Avila, C.; Rodriguez-Suarez, C.; Moreno, M.; Torres, A. Development of SCAR markers linked to a gene controlling absence of tannins in faba bean. Mol. Breed. 2007, 19, 305–314. [Google Scholar] [CrossRef]
  21. Hagerman, A.E.; Butler, L.G. Protein precipitation method for the quantitative determination of tannins. J. Agric. Food Chem. 1978, 26, 809–812. [Google Scholar] [CrossRef]
  22. Song, W.N.; Langridge, P. Identification and mapping polymorphism in cereals based on polymerase chain reaction. Theor. Appl. Genet. 1991, 82, 209–213. [Google Scholar]
  23. Song, W.N.; Henry, R. Polymorphisms in the a-amy1 gene of wild and cultivated barley revealed by the polymerase chain reaction. Theor. Appl. Genet. 1994, 89, 509–512. [Google Scholar]
  24. Michelmore, R.W.; Paran, I.; Kesseli, R.V. Identification of markers linked to disease-resistance genes by bulked segregant analysis: A rapid method to detect markers in specific genomic regions by using segregating populations. Proc. Natl. Acad. Sci. USA 1991, 88, 9828–9832. [Google Scholar] [CrossRef] [PubMed]
  25. Ma, Y.; Yang, T.; Guan, S.; Wang, H.; Wang, X.; Zong, X. Development and characterization of 21 EST-derived microsatellite markers in Vicia faba (faba bean). Am. J. Bot. 2011, 98, 22–24. [Google Scholar] [CrossRef] [PubMed]
  26. El-Rodeny, W.; Kimura, M.; Hirakawa, H.; Sabah, A.; Shirasawa, K.; Sato, S. Development of EST-SSR markers and construction of a linkage map in faba bean (Vicia faba). Breed. Sci. 2014, 64, 252–263. [Google Scholar] [CrossRef] [PubMed]
  27. Zietkiewicz, E.; Rafalski, A.; Labuda, D. Genome fingerprinting by simple sequence repeat (SSR)-anchored polymerase chain reaction amplification. Genomics 1994, 20, 176–183. [Google Scholar] [CrossRef] [PubMed]
  28. Bassam, B.J.; Anolles, G.C.; Gresshoff, P.M. Fast and sensitive silver staining of DNA in polyacrylamide gels. Anal. Biochem. 1991, 196, 80–83. [Google Scholar] [CrossRef]
  29. Van Ooijen, J.W. JoinMap4, Software for the Calculation of Genetic Linkage Maps in Experimental Populations; Kyazma BV: Wageningen, The Netherlands, 2006. [Google Scholar]
  30. Kosambi, D.D. The estimation of map distances from recombination values. Ann. Eugen. 1944, 12, 172–175. [Google Scholar] [CrossRef]
  31. Kelly, J.D. Use of random amplified polymorphic DNA markers in breeding for major gene resistance to plant pathogens. HortScience 1995, 30, 461–465. [Google Scholar]
  32. Terzopoulos, P.J.; Bebeli, P.J. Genetic diversity analysis of Mediterranean faba bean (Vicia faba L.) with ISSR markers. Field Crop. Res. 2008, 108, 39–44. [Google Scholar] [CrossRef]
  33. Link, W.; Ederer, W.; Metz, P.; Buiel, H.; Melchinger, A.E. Genotypic and environmental variation for degree of cross-fertilization in faba bean. Crop Sci. 1994, 34, 960–964. [Google Scholar] [CrossRef]
Figure 1. Frequency distributions of tannin content in 413 plants of F2 population.
Agronomy 08 00080 g001
Figure 2. PCR amplification results of the SSR marker SSR 84 in part of the F2 population segregating for zt-1. 1, M3290 (900 bp); 2, Qinghai12 (1100 bp); 3, white flower bulk (900 bp); 4, purple flower bulk (1100 bp); M, Marker (100 bp). The F2 population includes 5 white flower genotypes (zz, 900 bp), 5 purple flower genotypes (ZZ, 1100 bp) and 10 heterozygous genotypes (Zz, 1100 bp); This is a composite picture of several different gel picture.
Agronomy 08 00080 g002
Figure 3. Polymorphism analysis of the partial ISSR markers in the parents and bulks. 1, M3290; 2, white flower bulk; 3, Qinghai12; 4, colored flower bulk. M, Marker (100 bp). a, ISSR7; b, ISSR12; c, ISSR36.
Agronomy 08 00080 g003
Figure 4. Linkage map of the zero tannins zt-1 gene flanked by six SSR and three ISSR markers. The locus name and corresponding locations are indicated on the right side and the genetic distances between them are indicated on the left side.
Agronomy 08 00080 g004
Table 1. Segregation for flower colours in the M3290/Qinghai12 F1, F2 and F2:3 progenies.
CrossProgenyObserved Number of Plants or LinesExpected Ratioχ2P
WSegP
M32901500
Qinghai120015
F115--1:0
F295-3181:30.8790.348
F3952051131:2:11.590.451
W, white flowers; P, purple flowers; Seg, segregation.
Table 2. Molecular markers mapped at or close to the zt-1 locus.
NameMarker TypeForward Primer (5′-3′)Reverse Primer (5′-3′)Annealing Temperature (°C)
SSR84SSRTCTGAAAACGAGTTCAGTGGACTGGTGCCGAACTAACCAGT52
M38SSRGCTACTGGAGGAGGCTTTCAGCCTTCTACACAACGGCTTC53
M78SSRGTCAAATCGAGTGGCGAAAGTTGGGATATGGAAGTAGCTTCAG52
M81SSRCCTCATGCCATTCCTCTGATTTCCGCGTGGTAAATTCTATG55
M233SSRCATCCCAACAATATACCGGCCTGGGGTACCACCGTAACTC51
ssi85HSSRAACAACTACGTAATGCCAGACACATGAGGGGCCAAGTAT52
ISSR7ISSRAGA GAG AGA GAG AGA GT 53
ISSR9ISSRAGA GAG AGA GAG AGA GG 50
ISSR10ISSRGAG AGA GAG AGA GAG AT 51
Table 3. The 34 Chinese faba bean genotypes used for validation of the closely linked markers.
No.VarietyProvinceFlower aSSR84 bM78 b
900 bp1100 bp400 bp420 bp
1Qinghai11QinghaiPurple- c+ c-+
2Qinghai12QinghaiPurple-+-+
3Qinghai13QinghaiPurple-+-+
4Qingcan14QinghaiPurple-+-+
5Qingcan15QinghaiPurple-+-+
6M3290QinghaiWhite+-+-
7TF26QinghaiWhite+-+-
8TF29QinghaiWhite+--+
9TF34QinghaiWhite+--+
102005-00QinghaiWhite+--+
11Lincan6GansuPurple-+-+
12Lincan7GansuPurple-+-+
13Lincan8GansuPurple-+-+
14YangyandouGansuPurple-+-+
15Yundou7YunnanPurple-+-+
16Yundou8YunnanPurple-+-+
17Yundou9YunnanPurple-+-+
18TouxinlvYunnanPurple-+-+
19DahudouSichuanPurple-+-+
20XiaohudouSichuanPurple-+-+
21HonghudouSichuanPurple-+-+
22Chenghu9SichuanPurple-+-+
23Chenghu10SichuanPurple-+-+
24Chenghu11SichuanPurple-+-+
25Tongcanxian7JiangsuPurple-+-+
26Tongcanxian8JiangsuPurple-+-+
27QidongbaipiJiangsuPurple-+-+
28HaimendabaipiJiangsuPurple-+-+
29Tongcan5JiangsuPurple-+-+
30NantongsanbaiJiangsuPurple-+-+
31DAqingpiJiangsuPurple-+-+
32LvpidouZhejiangPurple-+-+
33LuohandouZhejiangPurple-+-+
34XiaoqingdouZhejiangPurple-+-+
a Flower colour. Purple: genotype with tannin content and without the zt-1 gene.; white: genotype with zero tannin content carrying the zt-1 gene. b Closely linked markers. c ‘+’ and ‘-’ indicate the presence and absence of the specific alleles of the SSR markers, respectively.

