1. Introduction
Drought is one of the most serious natural disasters in the world. With changes in global climate and the intensification of human activity, the frequent and long-term nature of drought has led to enormous losses to the national economy of China, particularly in agricultural production. It has been reported that the annual average drought-stricken area of China has reached 203 million hm
2 [
1]; meanwhile, the average decrease in crop yield caused by drought could reach 110–200 million tons [
2].
Research on crop to water stress can be used to promote water-saving irrigation practices, reducing the risk of food insecurity caused by drought. Studies have indicated that the sensitivity of crops to drought varies according to the growth stage [
3,
4], and the effects of drought stress have been studied on several crops including maize, wheat, tomato, cotton, etc. [
5,
6,
7,
8]. Cakir [
9] examined the effects of a water deficit during four growth stages of corn and found that all vegetative and yield parameters were significantly impacted by drought during the tasseling and cob formation stages. Yao [
10] reported that normal growth and development of winter wheat could be influenced by continuous drought stress at different vegetative stages. The yields were lowest (42%, compared to the control treatment) when water stress occurred during the wintering and greening stages.
Soybean is the primary source of vegetable protein for human consumption. It is native to China and is an important oil and economic crop [
11]. As soybean is sensitive to soil moisture, it is easily affected by drought [
12,
13,
14]. Soybean is a typical annual crop, and drought stress during different stages may lead to different effects on growth and yield [
15,
16,
17,
18,
19]. Mian [
20] showed that water requirements of soybean are low during the early vegetative growth stage, reach a maximum during the reproductive stage, and then decline as the plants mature. Cox [
21] found that evapotranspiration of soybean with deficit irrigation was 17% less than for the well-irrigated plants, and the no-irrigated plants showed a 68% loss. Soybean response to water deficit has been reported, water shortage during certain soybean stages may not cause a reduction in yields, or that plenty of water early enough in the growing season of soybean may result in higher yields [
22,
23]. Korte et al. [
24], Momen et al. [
25], and Yan et al. [
26] showed that water deficit during flowering had little effect on seed yield, while, during the pod-filling stage, the effects were significant. However, prior field studies simulated the degree of drought stress by establishing an irrigation quota, and described the drought stress by evapotranspiration. The measuring and estimating of evapotranspiration is complicated. In contrast, pot experiments can simulate the drought by controlling the daily soil water content and use soil water deficit to describe the stress level. However, due to the limitation of crop root growth in pots, the soil water deficit in pots would develop more quickly than in the field.
To quantify the relationship between crop yield loss and drought stress, the Food and Agriculture Organization (FAO) has developed a yield response factor (
ky) to relate decreases in yield to the evapotranspiration deficit [
3]. The value of
ky varies across crops and growth stages: for example, the empirical
ky value of corn based on previous research data is 1.25 while for soybean it is 0.85. For corn, the value of
ky is different across all growth stages. This method has been broadly applied around the world; however, the empirical function lacks the accuracy to evaluate the complex relationship between crop yield and drought stress.
Huaibei Plain is located in Eastern China and is the main soybean producing region, with a stable planting area of 700–800 thousand hm
2 [
27]. The soybean grown in this region is predominantly planted in the summer. The climate of Huaibei Plain is semi-humid and semi-arid [
28] and summer drought may severely affect soybean production. Improved irrigation management is crucial for maintaining high and stable soybean yields and requires adequate information of the responses of all growth stages to water stress.
By conducting soybean water deficit experiments, this study attempts to further examine the response of soybean growth and yield to water deficits during the seedling, branching, flowering and pod-setting and pod-filling stages. Moreover, this study aims to investigate the quantitative response of soybean to drought stress by fitting the relationships between leaf area per plant, aboveground dry matter, total seed yield reduction and soil water deficit (SWD), with the goal of providing a theoretical basis for establishing responsible irrigation schemes in the Huaibei Plain.
2. Materials and Methods
2.1. Experimental Site and Procedures
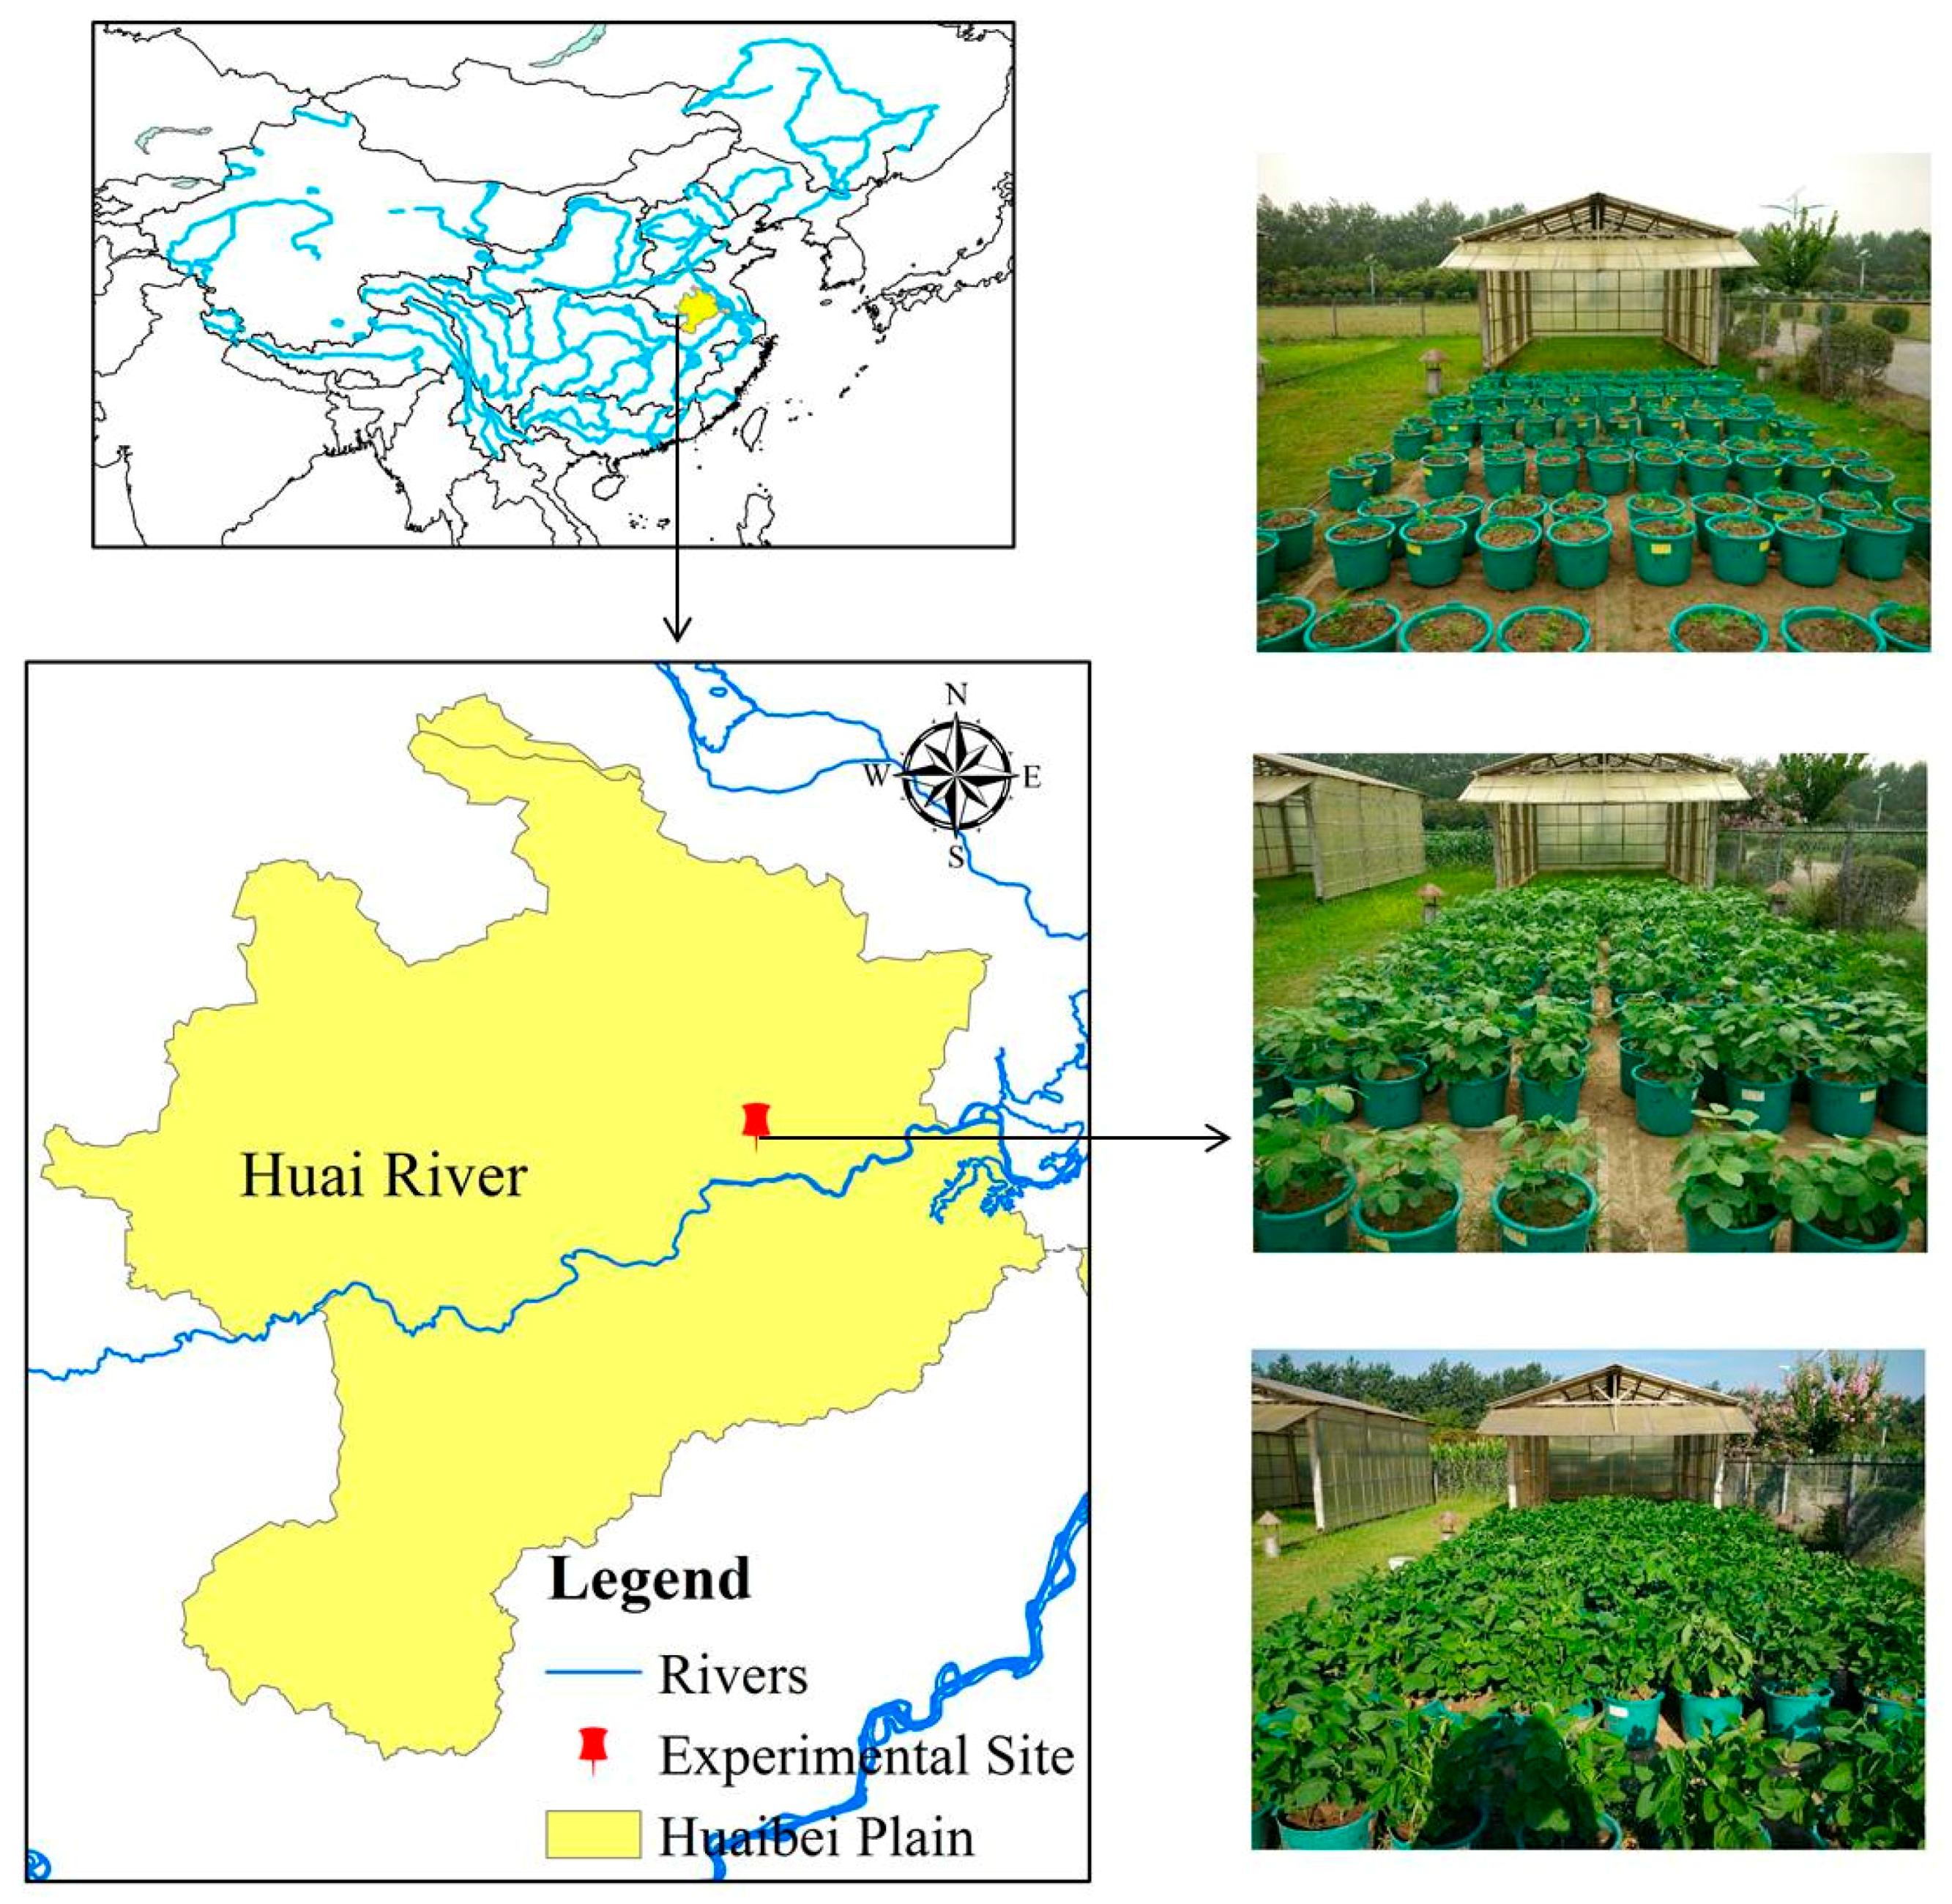
Pot experiments were conducted at the Xinmaqiao Farmland Irrigation and Drainage Experiment Station, part of the Anhui and Huaihe River Institute of Hydraulic Research in Bengbu City, Anhui Province (33°09′ N and 117°22′ E,
Figure 1). The soil of the study area is lime concretion black soil (mild clay), which is heavy in texture. Some of the soil characteristics are reported in
Table 1.
The cultivar “Zhonghuang No. 13” was used for experimentation and is the major soybean variety in the research area. Soybean was sown during the last week of June of 2015 and 2016 and planted in pots with dimensions 28 cm (inner caliber) × 27 cm (height). The soil water content of each pot was controlled by the weighing method to the field capacity (FC), and 4 g/pot of compound fertilizer was applied before sowing each year. According to the field soybean planting density, plants were selected for uniformity and thinned out to a density of three plants per pot after seedling emergence. The pots were then placed under an outdoor movable canopy.
2.2. Irrigation Treatments and Measurements
Four known soybean growth stages, seedling (S), branching (B), flowering and pod-setting (FPS), and pod-filling (PF), were identified according to the relevant research [
29] and prior records of soybean growth from this experiment. The phonological period of each growth stage, the average temperature, and solar radiation are shown in
Table 2.
To investigate the effects of drought stress during each stage on soybean plants, this experiment only set up water deficits for individual growth stages. Irrigation was used to mimic different drought stress conditions through the control of the lower limit of soil water content. A total of nine irrigation treatments, including a long-term irrigated treatment (CK), were applied as shown in
Table 3.
All treatments except the control were set to have two drought levels (mild and severe) during each growth stage. Based on previous study results [
30,
31] and experimental results at the research station over many years, soil water content limits (Percentage of FC) were set to 55% and 35%. When samples were free from water stress, the soil water content limit was set to 75%. Meanwhile, soybean was irrigated to 90% of the FC if the soil water content met the corresponding limit.
The soil water content was measured for each pot by weighing. All samples were weighed at the end of the day (after 18:00), and then the daily soil water content was calculated based the measurements. The formula for calculation is described as follows:
where
Mj is the weight of sample (kg) on day
j;
MS is the weight of soil in every pot (kg);
MP is the weight of pot;
Ij is the irrigation on day
j (kg);
Wj,AM is the soil water content before irrigation on day
j (kg/kg);
Wj,PM is the soil water content after irrigation in the end of day
j (kg/kg); and
Wj is the average soil water content on day
j (kg/kg). To reduce calculation errors caused by the weight of the plants, the weight of every sample during a given period was subtracted by the average weight of the plant in the last growth period.
Ij is determined based on the lower limit of soil water content corresponding to different treatments in
Table 3. The calculation formula is as follows:
where
FC is the soil water content at field capacity (kg/kg);
Wj−1,PM is the soil water content after irrigation at the end of day
j−1 (kg/kg); and
Wmin is the lower limit of soil water content corresponding to each treatment (kg/kg). Irrigation was applied the following morning when the soil water content reached the limit, and the upper limit of irrigation was 90% of the value of
FC (kg/kg).
Aside from water management, all of the other study procedures were the same. Soybean growth was normal and there was no disease or insect damage.
2.3. Determination of Plant Parameters
Twenty pots were prepared for each treatment and five pots were selected for measuring after each growth stage.
- (1)
Plant height
At the end of each growth stage, the plants were cut to ground level and plant height was determined by taking the measured average of the three plants from each pot.
- (2)
Leaf area per plant (LAP)
Leaves were separated from the stem after each stage and their area was measured using a scanner and planimeter. The value of leaf area per plant was the total leaf area divided by the amount of the plant per pot.
- (3)
Aboveground dry matter accumulation (ADM)
After each sample was cut, leaves and the rest of the plant (stem, branches, and pods) were dried at 75 °C to a constant weight, and the sum of the dry leaf weight and other aboveground plant components was taken as the aboveground dry matter accumulation.
- (4)
Yield and its components
After harvesting, all remaining samples were destructed. Yield was analyzed based on the seed yield per plant, 100-seed weight, and nonviable pod rate. The nonviable pod rate was calculated by dividing the number of empty pods by total pods. To get the seed yield per plant and the 100-seed weight, seeds were manually removed from the pods and counted, and then dried at 75 °C and weighed.
Data on growth and harvest were statistically analyzed using Analysis of Variance (ANOVA) in PASW version 18.0. Differences between treatments were evaluated for significance using the Least Significant Difference (LSD) test [
32].
2.4. Quantitative Analysis
2.4.1. SWD
To assess the available soil water deficit during the four growth stages, the soil water deficit (SWD) was expressed as the percentage of maximum available water according to the following formula [
33]:
where
Wj is the soil water content on day
j (kg/kg);
FC is the soil water content at field capacity (kg/kg); and
WP is the soil water content at wilting point (kg/kg).
SWD ranged between 0% (
Wj =
FC) and 100% (
Wj =
WP).
2.4.2. Reduction in LAP, ADM Accumulation, and Total Seed Weight
The losses of these characteristics were calculated as follows:
where
D is the loss of growth and yield parameters (LAP, ADM, and seed weight);
M is the maximum value of each index (obtained from the full irrigation treatment); and
A is the actual value of these characteristics (obtained from all the treatments).
2.4.3. Logarithmic Fitting Curve
To depict how these growth and yield parameters were dependent on SWD during different stages, a logarithmic matching curve was used, and the form of the curve was as follows:
where
y is the loss of growth and yield;
x is the value of SWD during different growth periods (ranged from 0 to 100%); and
k and
b are the parameters.
3. Results and Discussion
3.1. The Effect of Drought Stress on Plant height, LAI, and ADM Accumulation of Soybean
3.1.1. Plant Height
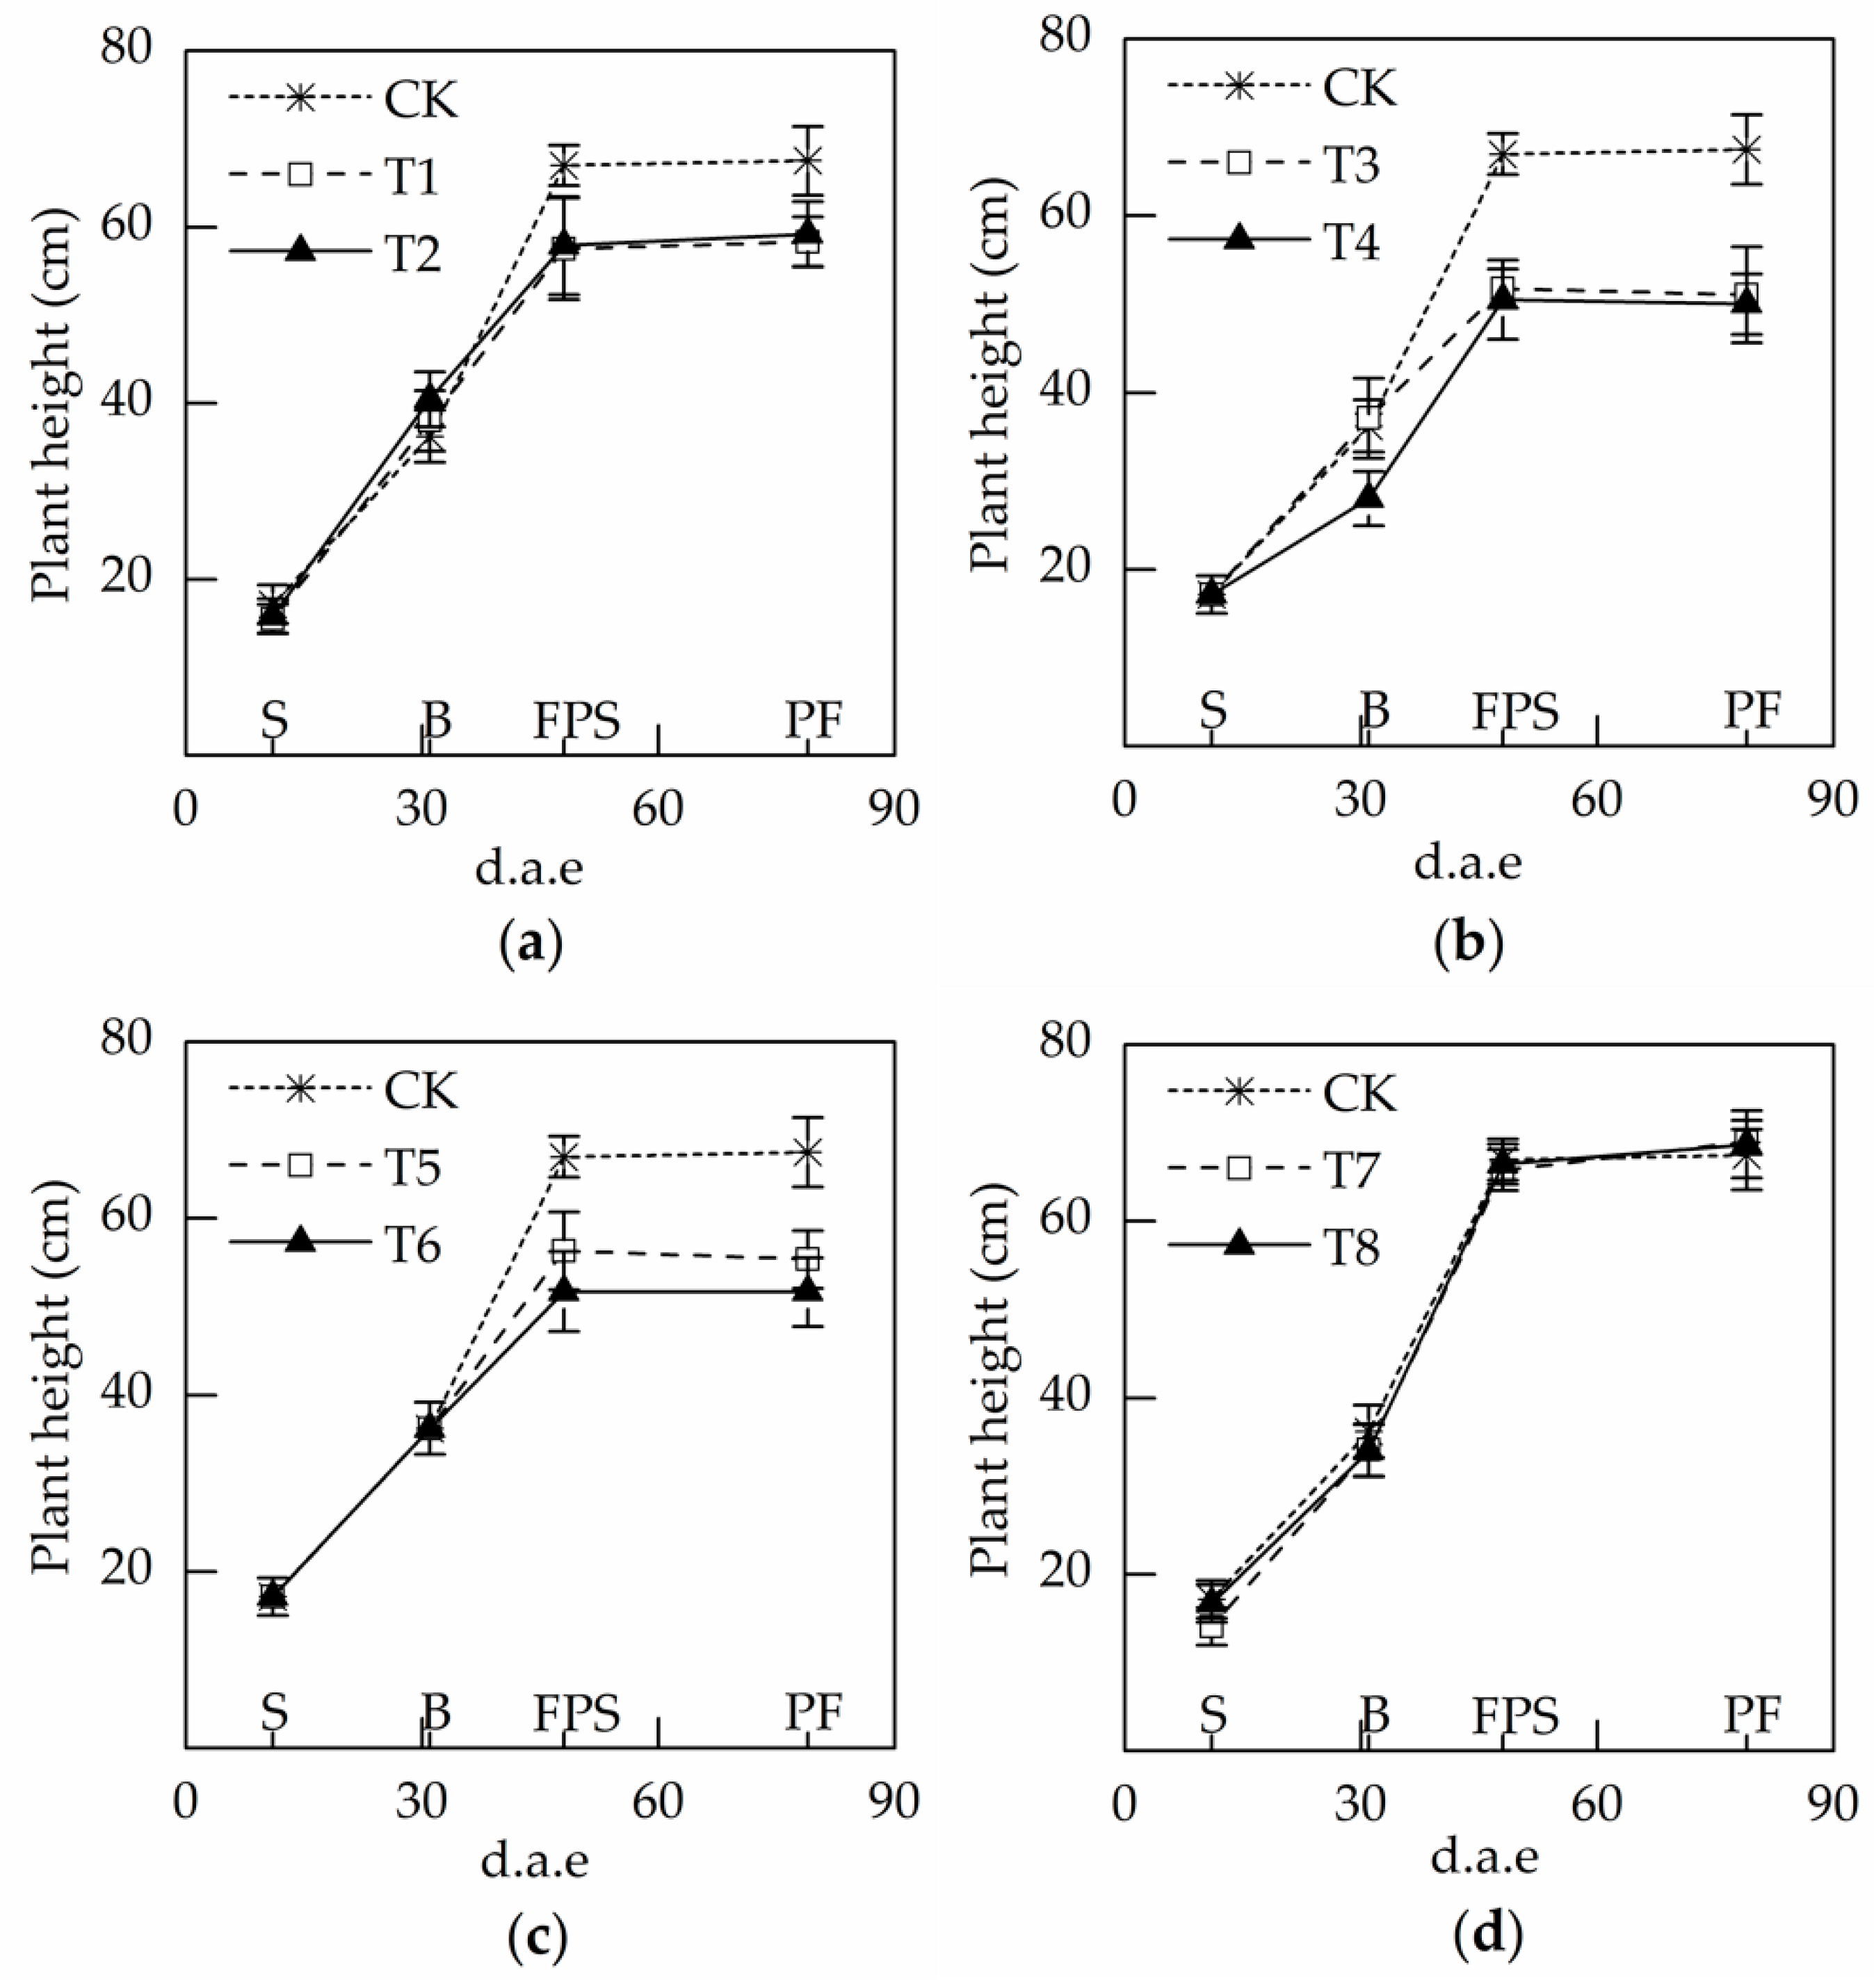
The effects of water stress during different soybean growth stages in 2015 are plotted in
Figure 2. In all treatments, there was rapid height development in the early stage of the growth cycle that reached the maximum at the end of the pod-setting stage (FPS), and then stopped.
For the current period effect at each growth stage, water deficit during B (T3 and T4) and FPS (T5 and T6) had a significant impact on current plant height. At the end of B and FPS, the plant heights for CK reached 36 and 67 cm, while heights for T4 and T6 were 27 and 52 cm, respectively, with about 22% loss. However, plants that were exposed to drought stress during S (T1 and T2) and PF (T7 and T8) had a 9% loss of plant height after drought stress ended.
For final plant height, the long-term irrigation treatment (CK) reached up to 67 cm. Plants that were exposed to water deficit during B (T3 and T4) had the shortest final height of 50 cm, while T7 and T8 (drought stress during PF) had a final height of 68 cm. This phenomenon, where early drought has a greater influence than later drought on final height, has also been observed in wheat and corn (Cakir et al. 2004). Yao et al. (2015) reported that during the growth cycle of winter wheat, the height of plants with no irrigation in the greening stage was the shortest, while the treatment with drought in the heading stage resulted in the tallest plants.
However, the results for drought stress during S (T1 and T2) were different. The final heights at T1 and T2 were 58 and 59 cm, respectively, higher than those of treatment with B (T3 and T4) and FPS drought (T5 and T6). This can be explained by the compensation effect [
34]. Acevedo et al. [
35] found that crops had a short but rapid growth rate after the water stress was relieved, which partly compensated for the losses caused by the stress. In the 2015 experiment, the plant height growth rates for T1 and T2 (drought stress during S) after re-watering (during B) were 1.13 and 1.23 cm/day, while the CK was 0.95 cm/day during this period. These results were in agreement with the view of Xu et al. [
36] and Hao et al. [
37] that plant height and stem growth showed obvious compensation effects following water stress relief.
3.1.2. Leaf Area per Plant
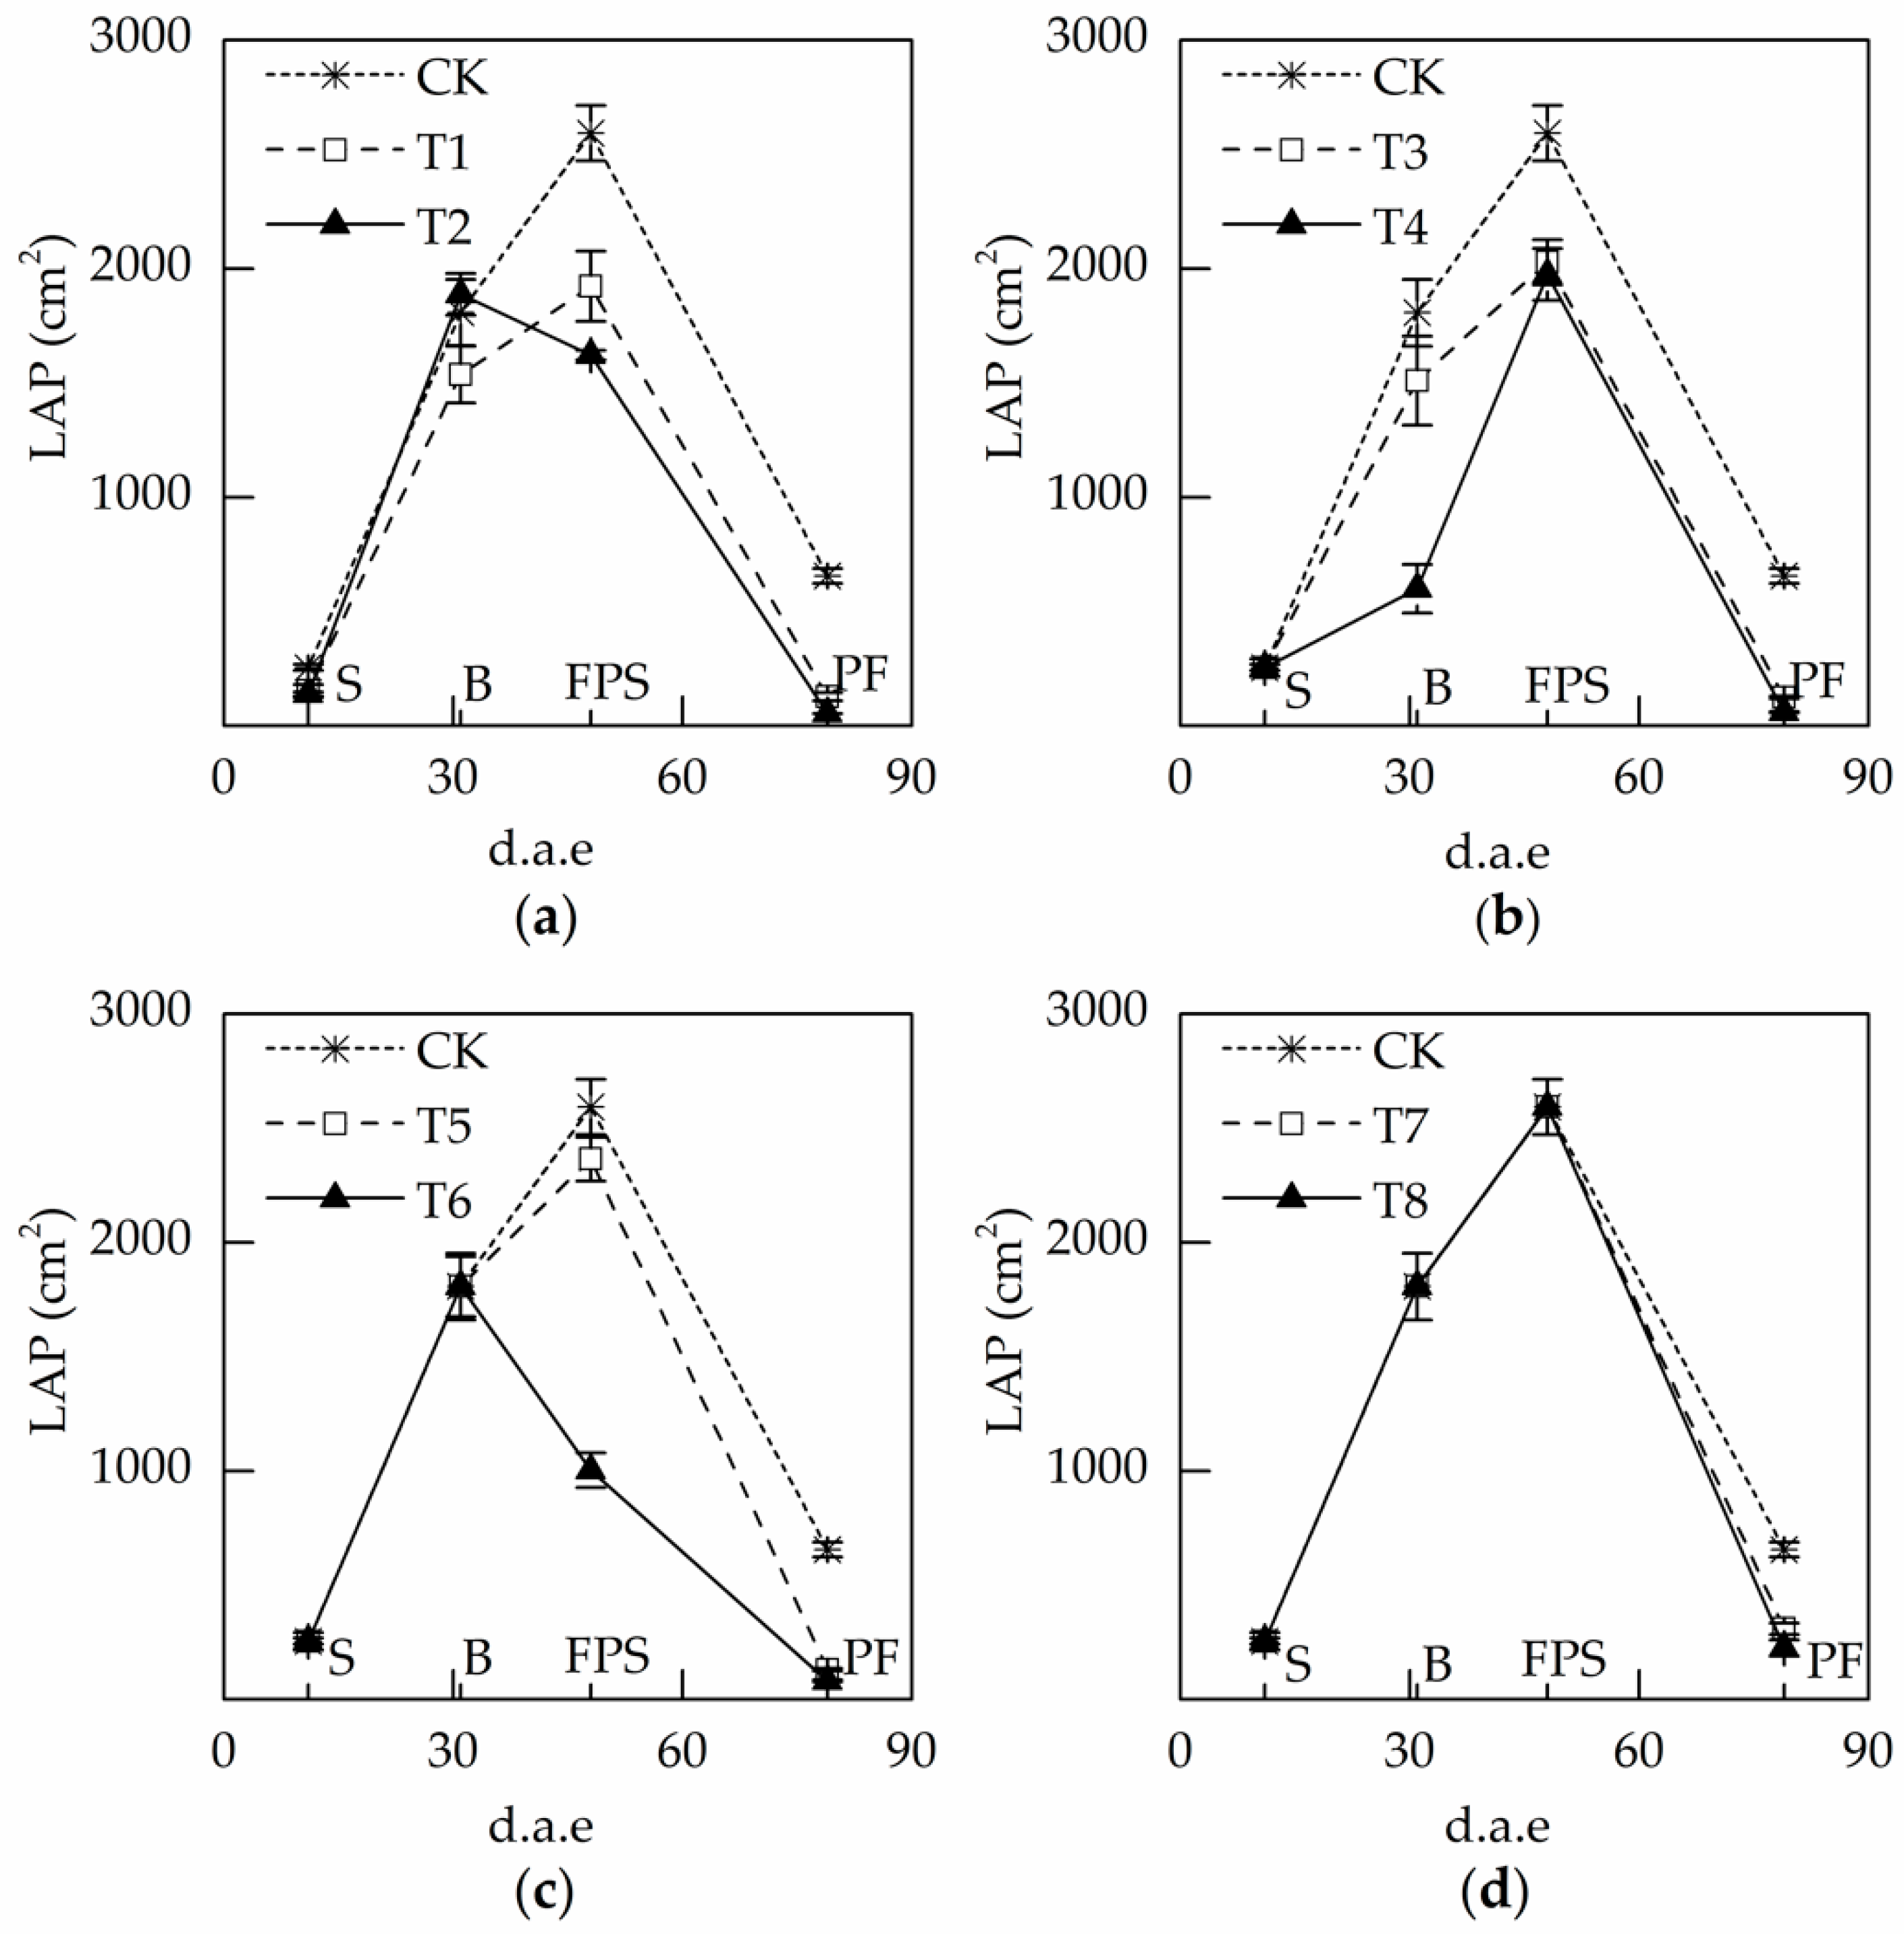
The effects of water stress on LAP were determined (
Figure 3). Results from the 2015 study showed that LAP development was very slow in the seedling stage, followed by an intensive increase until the end of the flowering and pod-setting stages, and then declined rapidly. This was in agreement with the fact that soybean is an annual crop that turns yellow and dies quickly after entering the pod-filling stage [
14,
38].
Among the different treatment stages, drought stress during B and FPS caused the differences between irrigation and drought to be much more evident. Long-term irrigation treatment (CK) had maximum values of 1807 and 2593 cm
2 at the end of B and FPS, respectively, while treatments exposed to severe water stress during the two stages (T4 and T6) were 599 and 1002 cm
2/plant, respectively, and the loss was more than 60% in the CK treatments. Similar observations have also been made for corn. Cakir [
9] examined the response of corn to a brief drought and found that the leaf area index under well irrigated treatments had a prolonged increase with a maximum value of 5.44, while the value for plants exposed to water stress during the tasseling period was 4.16.
Similar to plant height, LAP development was also affected by drought stress. During B and FPS, the respective LAP loss in T2 and T4 were 45% and 66% of the full irrigated treatment, which was comparable to a study by Karam et al. [
39]. They found that water deficit during the R2 (full bloom) stage reduced leaf area index by 52% when compared to the control. Moreover, a short period of rapid growth after the relief of water stress was observed after the restoration of irrigation. LAP growth rates for T2 and T4 after re-watering were 87 and 81 cm
2/day, respectively, while in the control group they were 77 and 46 cm
2/day.
3.1.3. Aboveground Dry Matter Accumulation
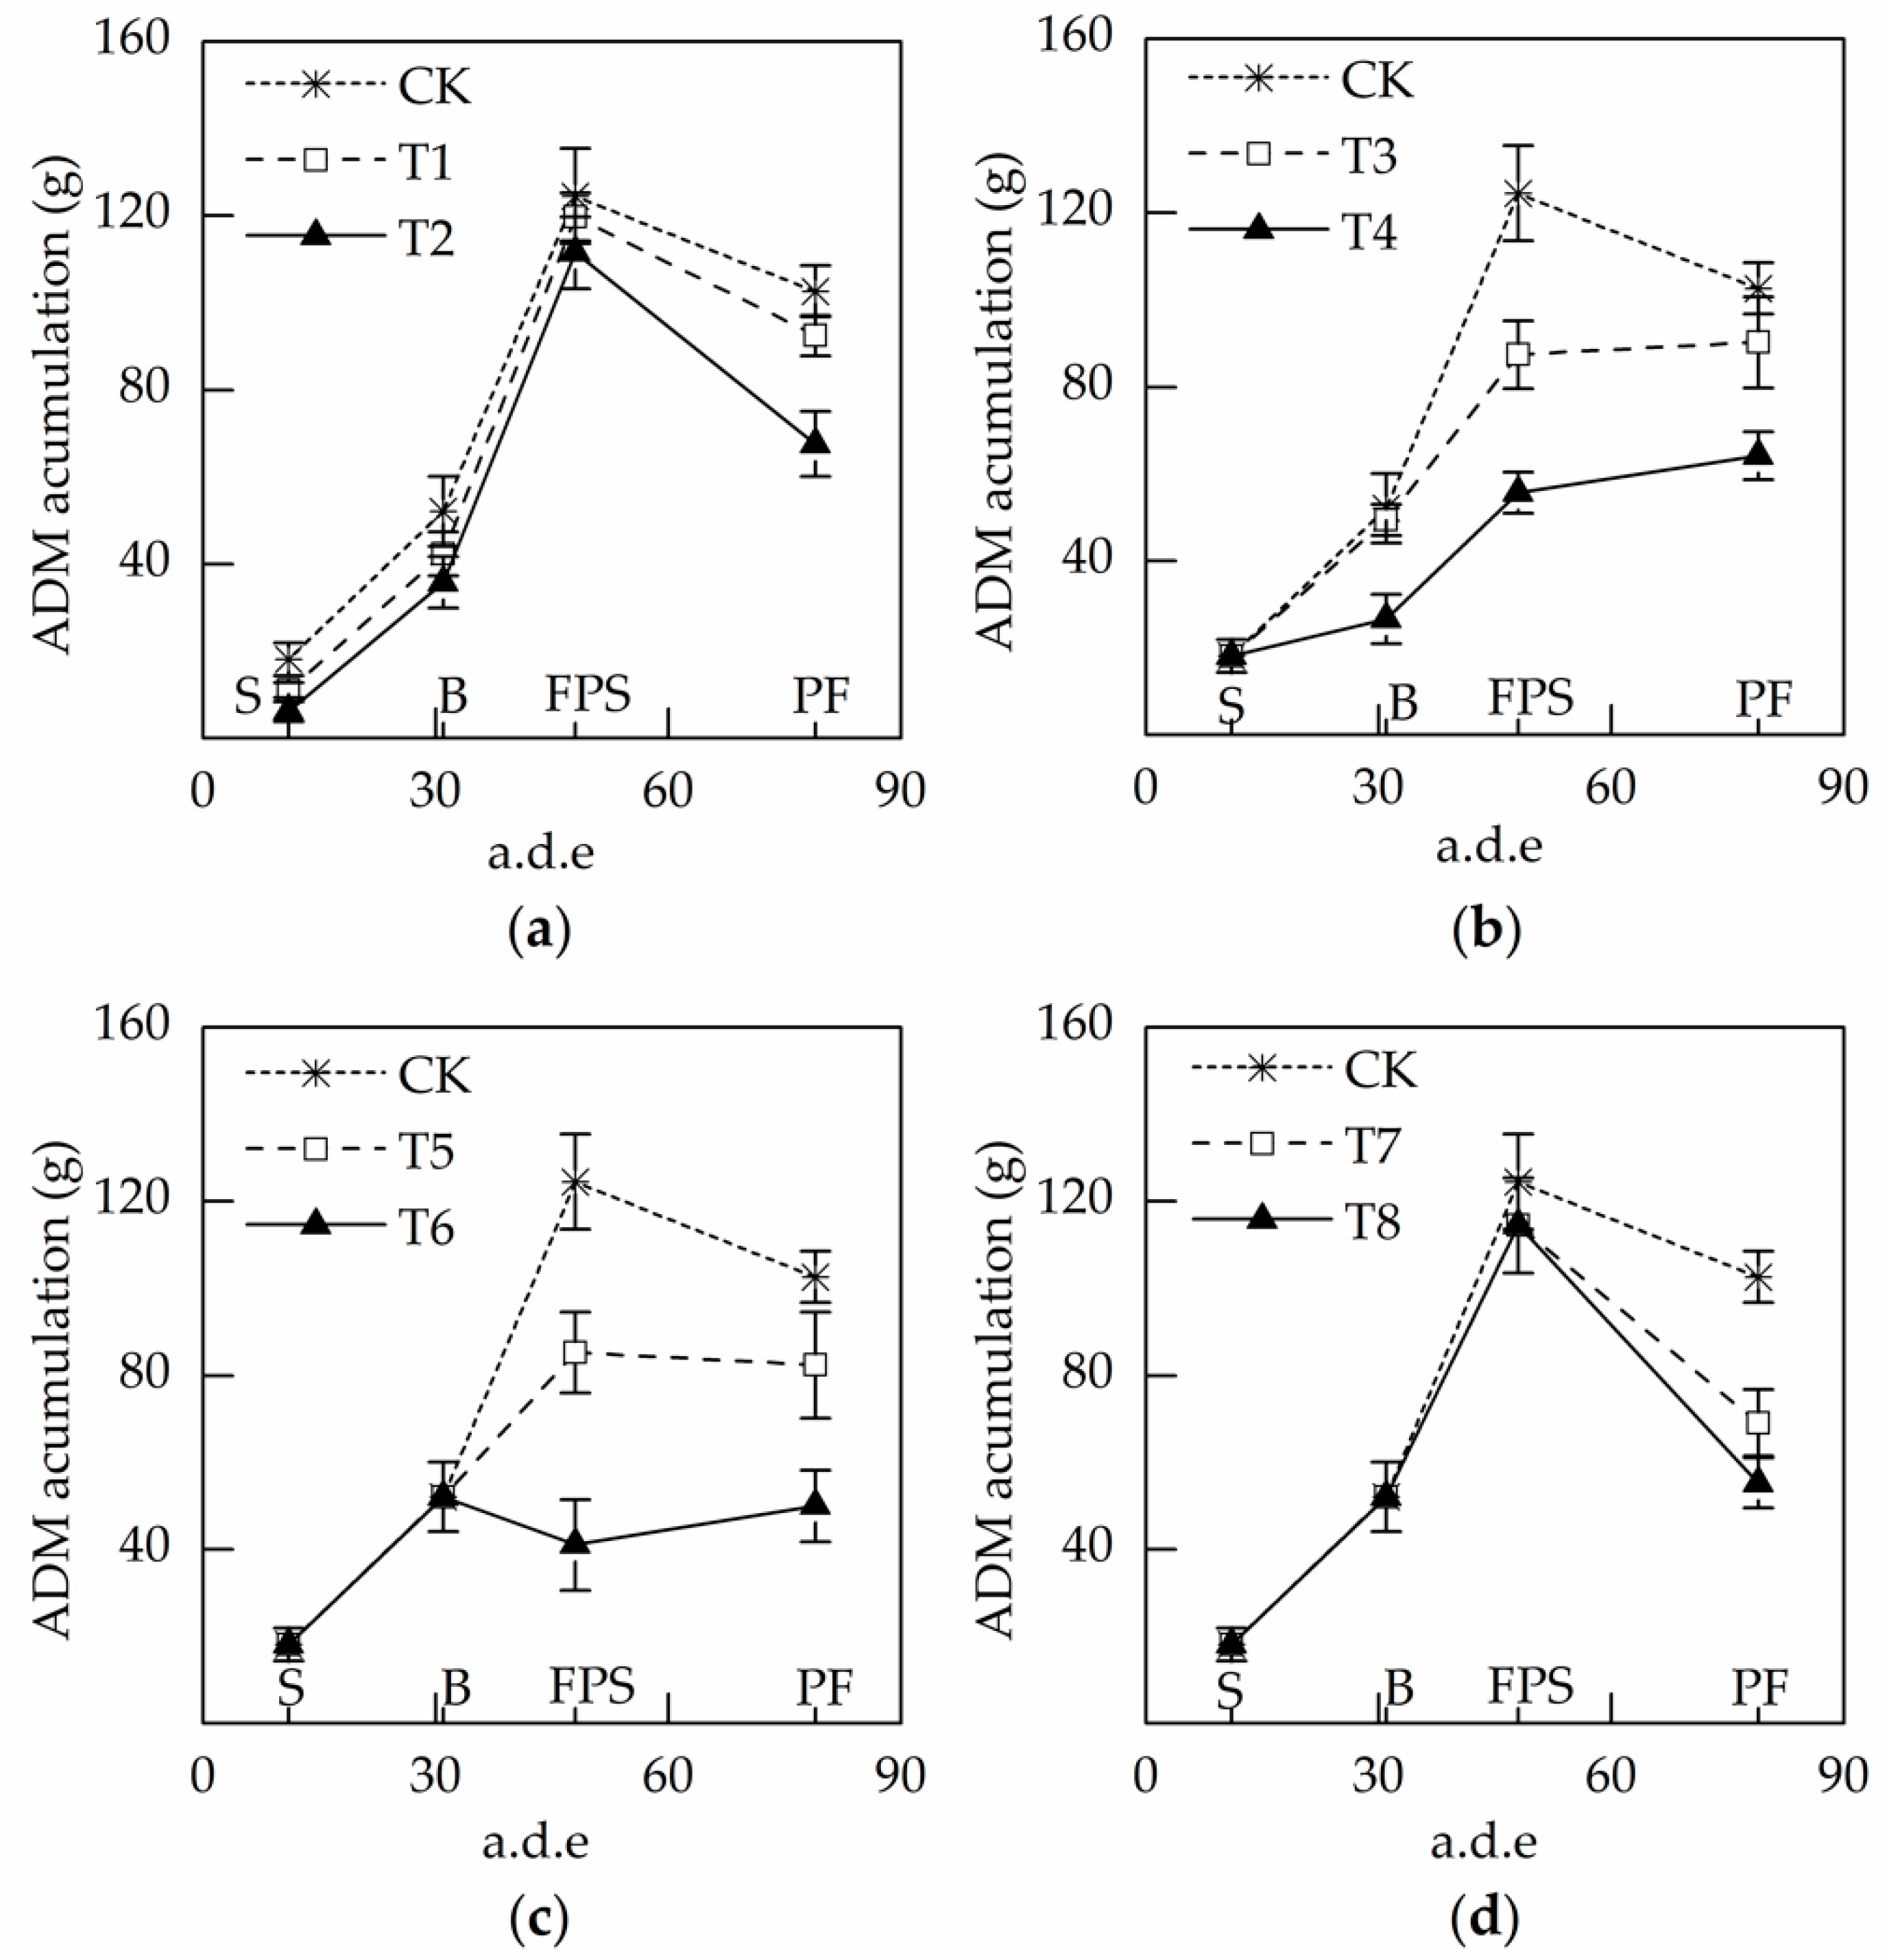
Results from the 2015 season study showed that aboveground dry matter accumulation was also affected by the soil water deficit (
Figure 4). The aboveground dry matter of soybean plants increased rapidly during B and FPS, and then declined after entering PF.
There were different drought stress effects during the various growth stages. The greater losses occurred during B and FPS, and the aboveground dry matter accumulation of the control group was 52 and 124 g at the end of B and FPS, respectively. Corresponding values of T4 and T6 were 26 and 41 g, respectively. Moreover, during these two stages, the adverse effects of different drought levels were more obvious than in the other stages. Compared with severe drought (T4 and T6), relatively high aboveground dry matter accumulation values of 49 and 85 g were observed in the treatments with slight drought stress during B and FPS (T3 and T5). Similar results were reported in the study by Karam et al. [
39]. They reported that the reduced dry matter accumulation of stressed soybean plants was mainly observed during the R2 stage (full bloom), and lower variability was observed during the R5 (seed enlargement) stage. Sun et al. [
40] and Wang et al. [
30] also found that there was a correlation between dry matter accumulation and water stress in different periods, and soybean was very sensitive to water stress during the latter growth period.
As for the final aboveground dry matter accumulation, the drought stress in FPS and PS resulted in greater losses, which during T6 and T8 were 64% and 68%, respectively. As in the case of plant height and LAI, the compensation effect was also reflected in the aboveground dry matter accumulation. The final loss of T1 (mild drought stress during S) was only 10%; even under severe drought stress the final loss was 37%, lower than that of T6 and T8. The different impacts caused by early and late drought were also observed in corn. Cakir et al. [
9] found that the dry matter weight loss under the treatment that omitted irrigation during tasseling and ear formation stages was in the range of 57–63%, while early short-term water stress caused only 20–28% losses in the final dry matter weight.
3.2. The Effects of Water Deficit on Yield and Its Components
Observation of seed yields per plant, 100-seed weight and nonviable pods rate of the two-season study are summarized in
Table 4. As shown, the seed yield per plant in two years were significantly (
p < 0.001) affected by water deficits during different growth stages. Maximum seed yields per plant of 24.7 and 21.1 g, and 22.2 and 16.1 g were obtained from long-term irrigated control (CK) and T1 in the two seasons, respectively. The severe drought stress in FPS (T6) yielded the least seed yield per plant, only 4.5 and 5.7 g in two seasons, respectively. The overall seed yield in 2016 was lower than that in 2015, which may be related to the lack of sunshine during the growth cycle. There was more precipitation during the 2016 season. Although the influence of precipitation could be eliminated by the awning, the plants were affected by the sunshine duration to some extent.
A statistically significant (
p < 0.001) effect of drought stress at different growth stages was observed based on 100-seed weight (
Table 4.). In addition to the control group, the highest 100-seed weight values, 24.1 g, was recorded for T1 in the two respective seasons. However, lower values were obtained for the plants with drought stress in PF, only 12.7 and 16.3 g, respectively. Compared with CK, the reduction of treatment T8 in the two seasons were 47% and 54%, while the losses of T1 were 4% and 22%, respectively.
The nonviable pods rate was also significantly (p < 0.001) affected by drought stress during each stage. The highest ineffective pods rate for the two seasons, 23.8% and 14.7%, appeared in T8. Moreover, values for T6 were 12.8% and 13.1%, just behind T8. On the other hand, empty pods rates for treatments with drought stress in S and B were only in the range of 4–8%.
These results showed that drought in FPS and PF led to the lowest 100-seed weight and the highest empty pods rate, agreeing with the previous study about vegetative growth and reproductive growth of plants [
41]. During the vegetative period, the stems and leaves are the main source of photosynthetic production. When the dry matter accumulation increases to a certain extent, it transfers these photosynthetic products to the seed, and flowering is a sign of the transition. Foroud et al. [
42] reported that water deficit before the early stage of flowering had little effect on soybean yields. Karam et al. [
39] reported that seed number per plant of soybean under a pod-filling stage water deficit decreased by 20%, while early drought had little effect.
3.3. Soil Water Deficit (SWD)
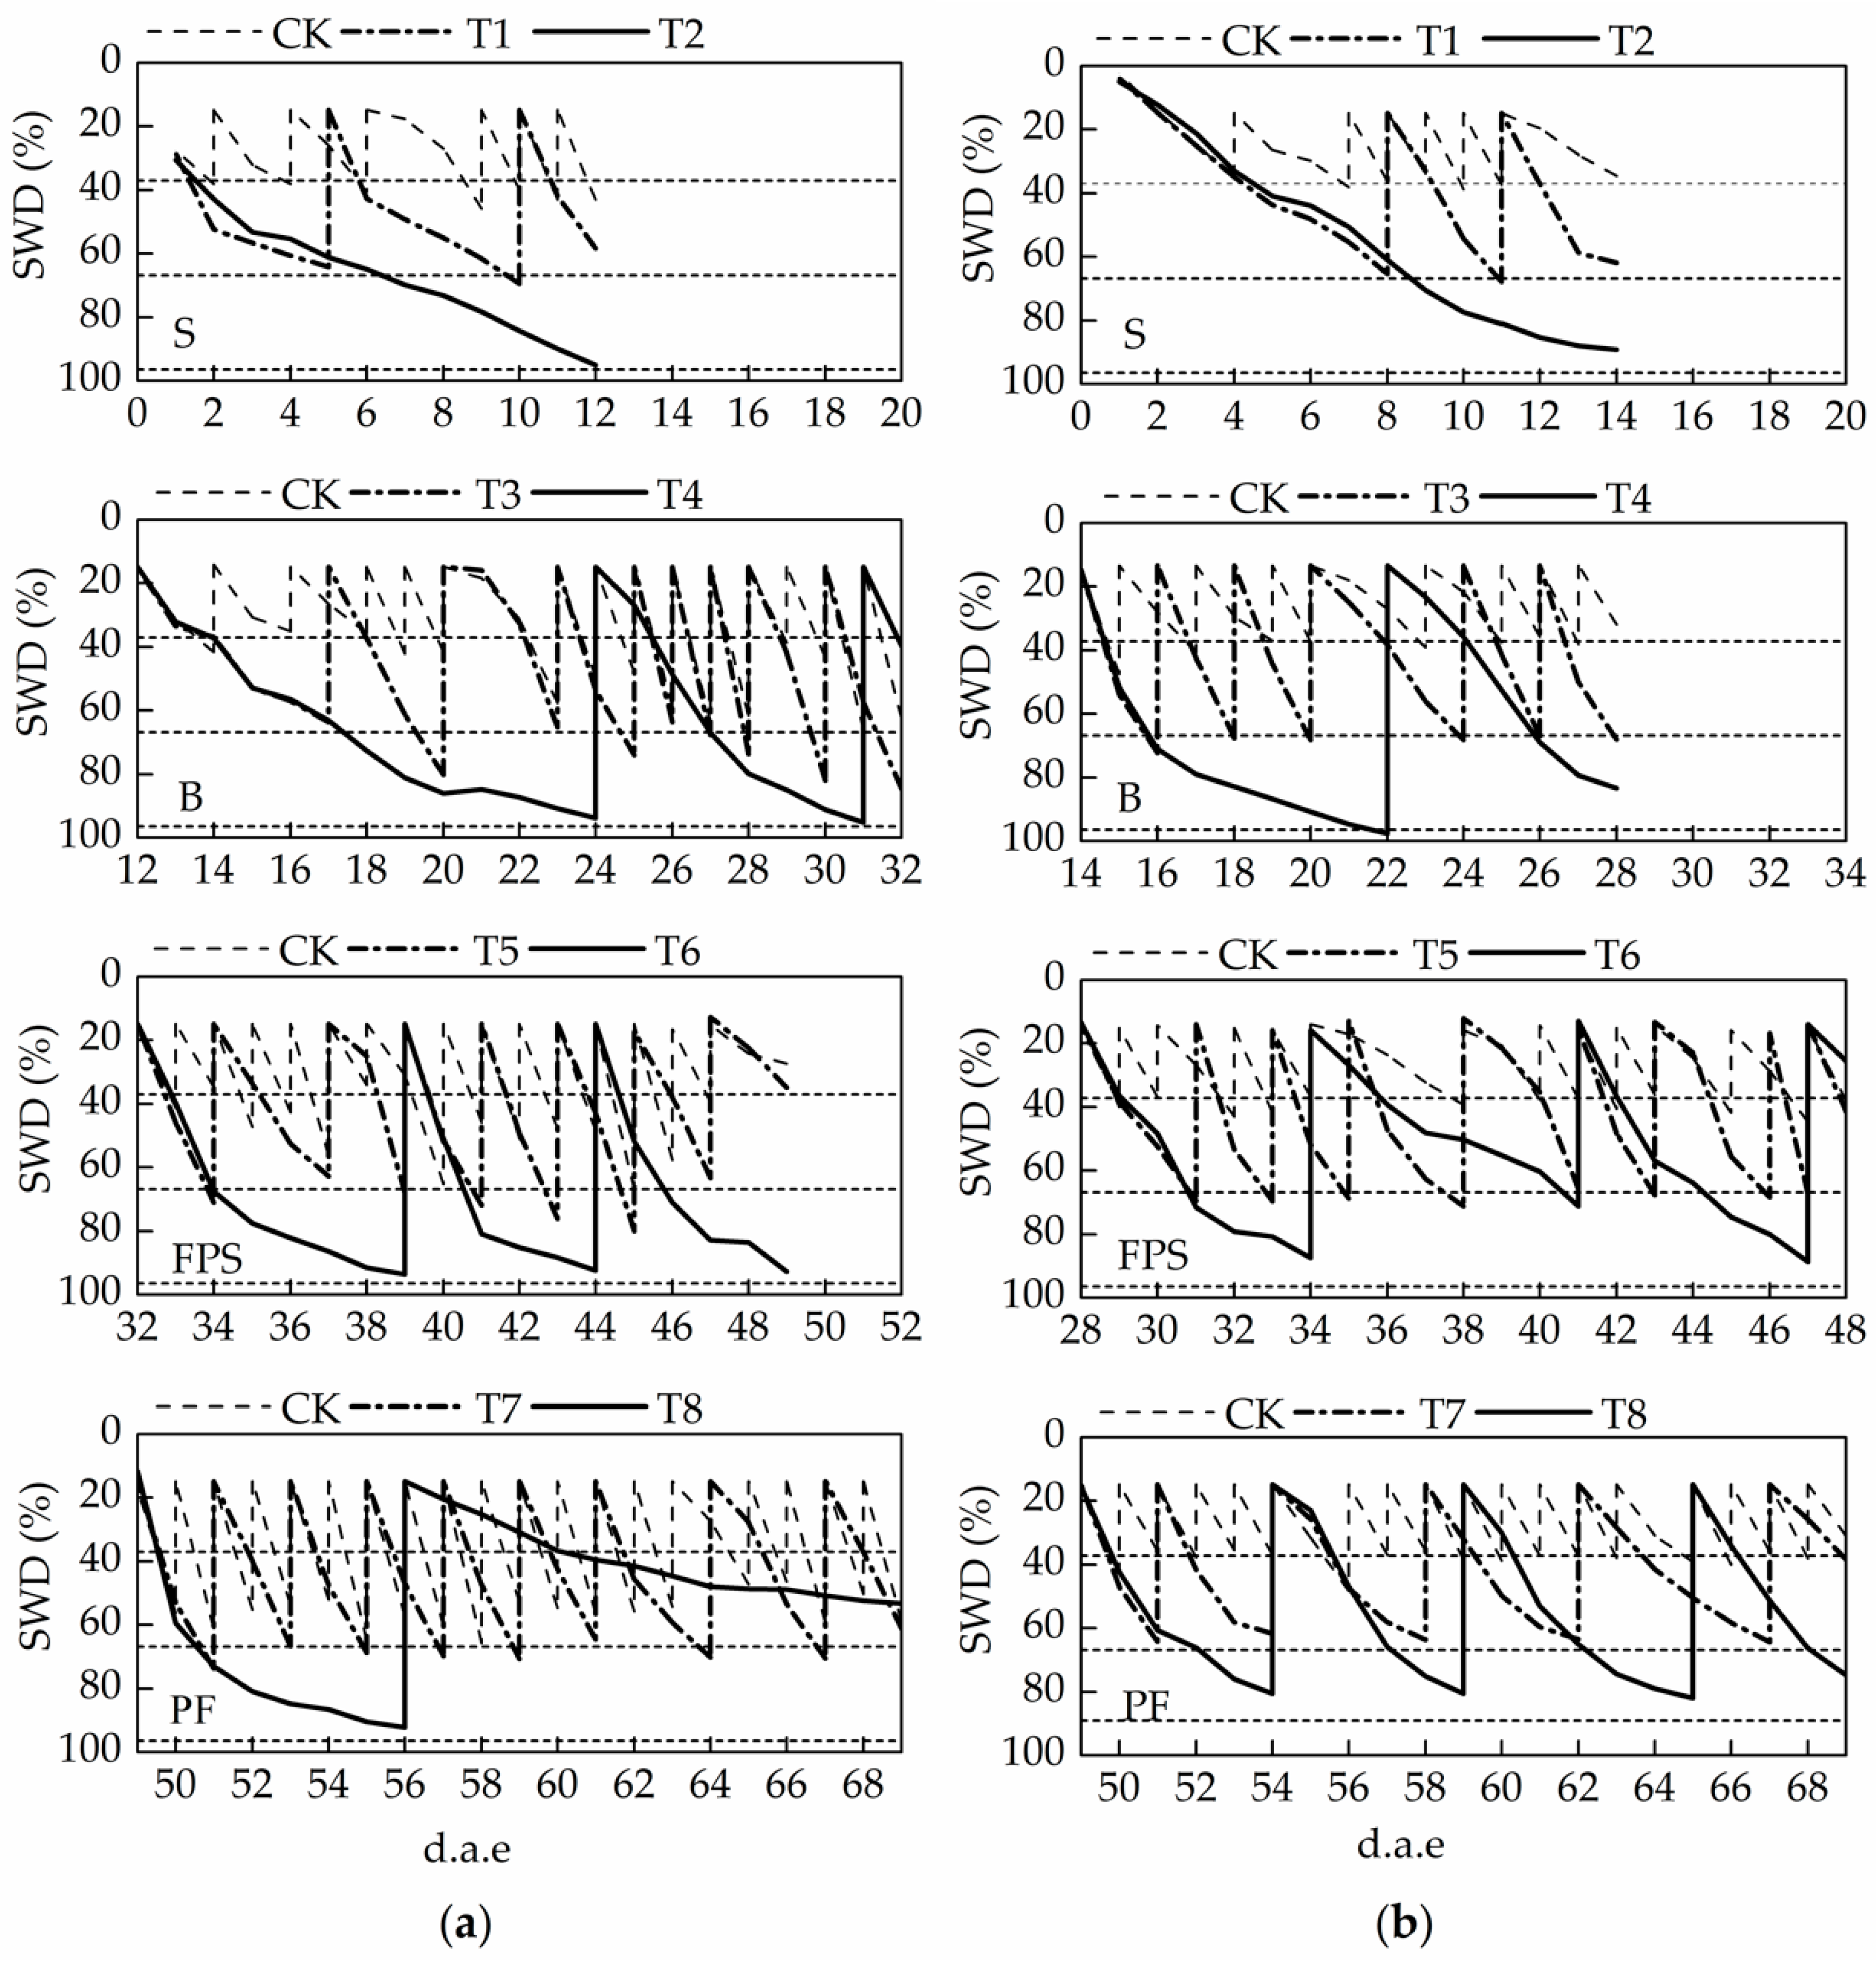
Soil water deficit results for the two levels of water stress (mild and severe) during each growth stage (20-day period) are shown in
Figure 5. The value of SWD shows the level of soil water stress during the plant growth process and higher values indicate greater water stress. SWD under the CK treatment was generally lower than that of the other treatments in the same period.
The soil water content of the different treatments was controlled by weighing. If the plants reached a corresponding lower limit, they were then irrigated to the upper limit on the following day. Therefore, SWD fluctuated at each stage. During the FPS and PF stages, SWD fluctuated greatly and the variations were wider and more frequent than in the other stages, which may be related to an increase in water consumption during the soybean reproductive stage [
43].
During the 2015 PF period, the SWD of the severe water stress treatment increased rapidly and reached the limit after water control began; however, the second rise after irrigation was very slow and did not reach the limit until the harvest. This phenomenon may have resulted from the premature death of plants during the drought process. Therefore, the soil water content limit for the severe water stress treatment increased from 35% to 40% in 2016 (
Figure 5b, PF). The survival of the plant was guaranteed, and the fluctuation of SWD during the PF stage was also restored.
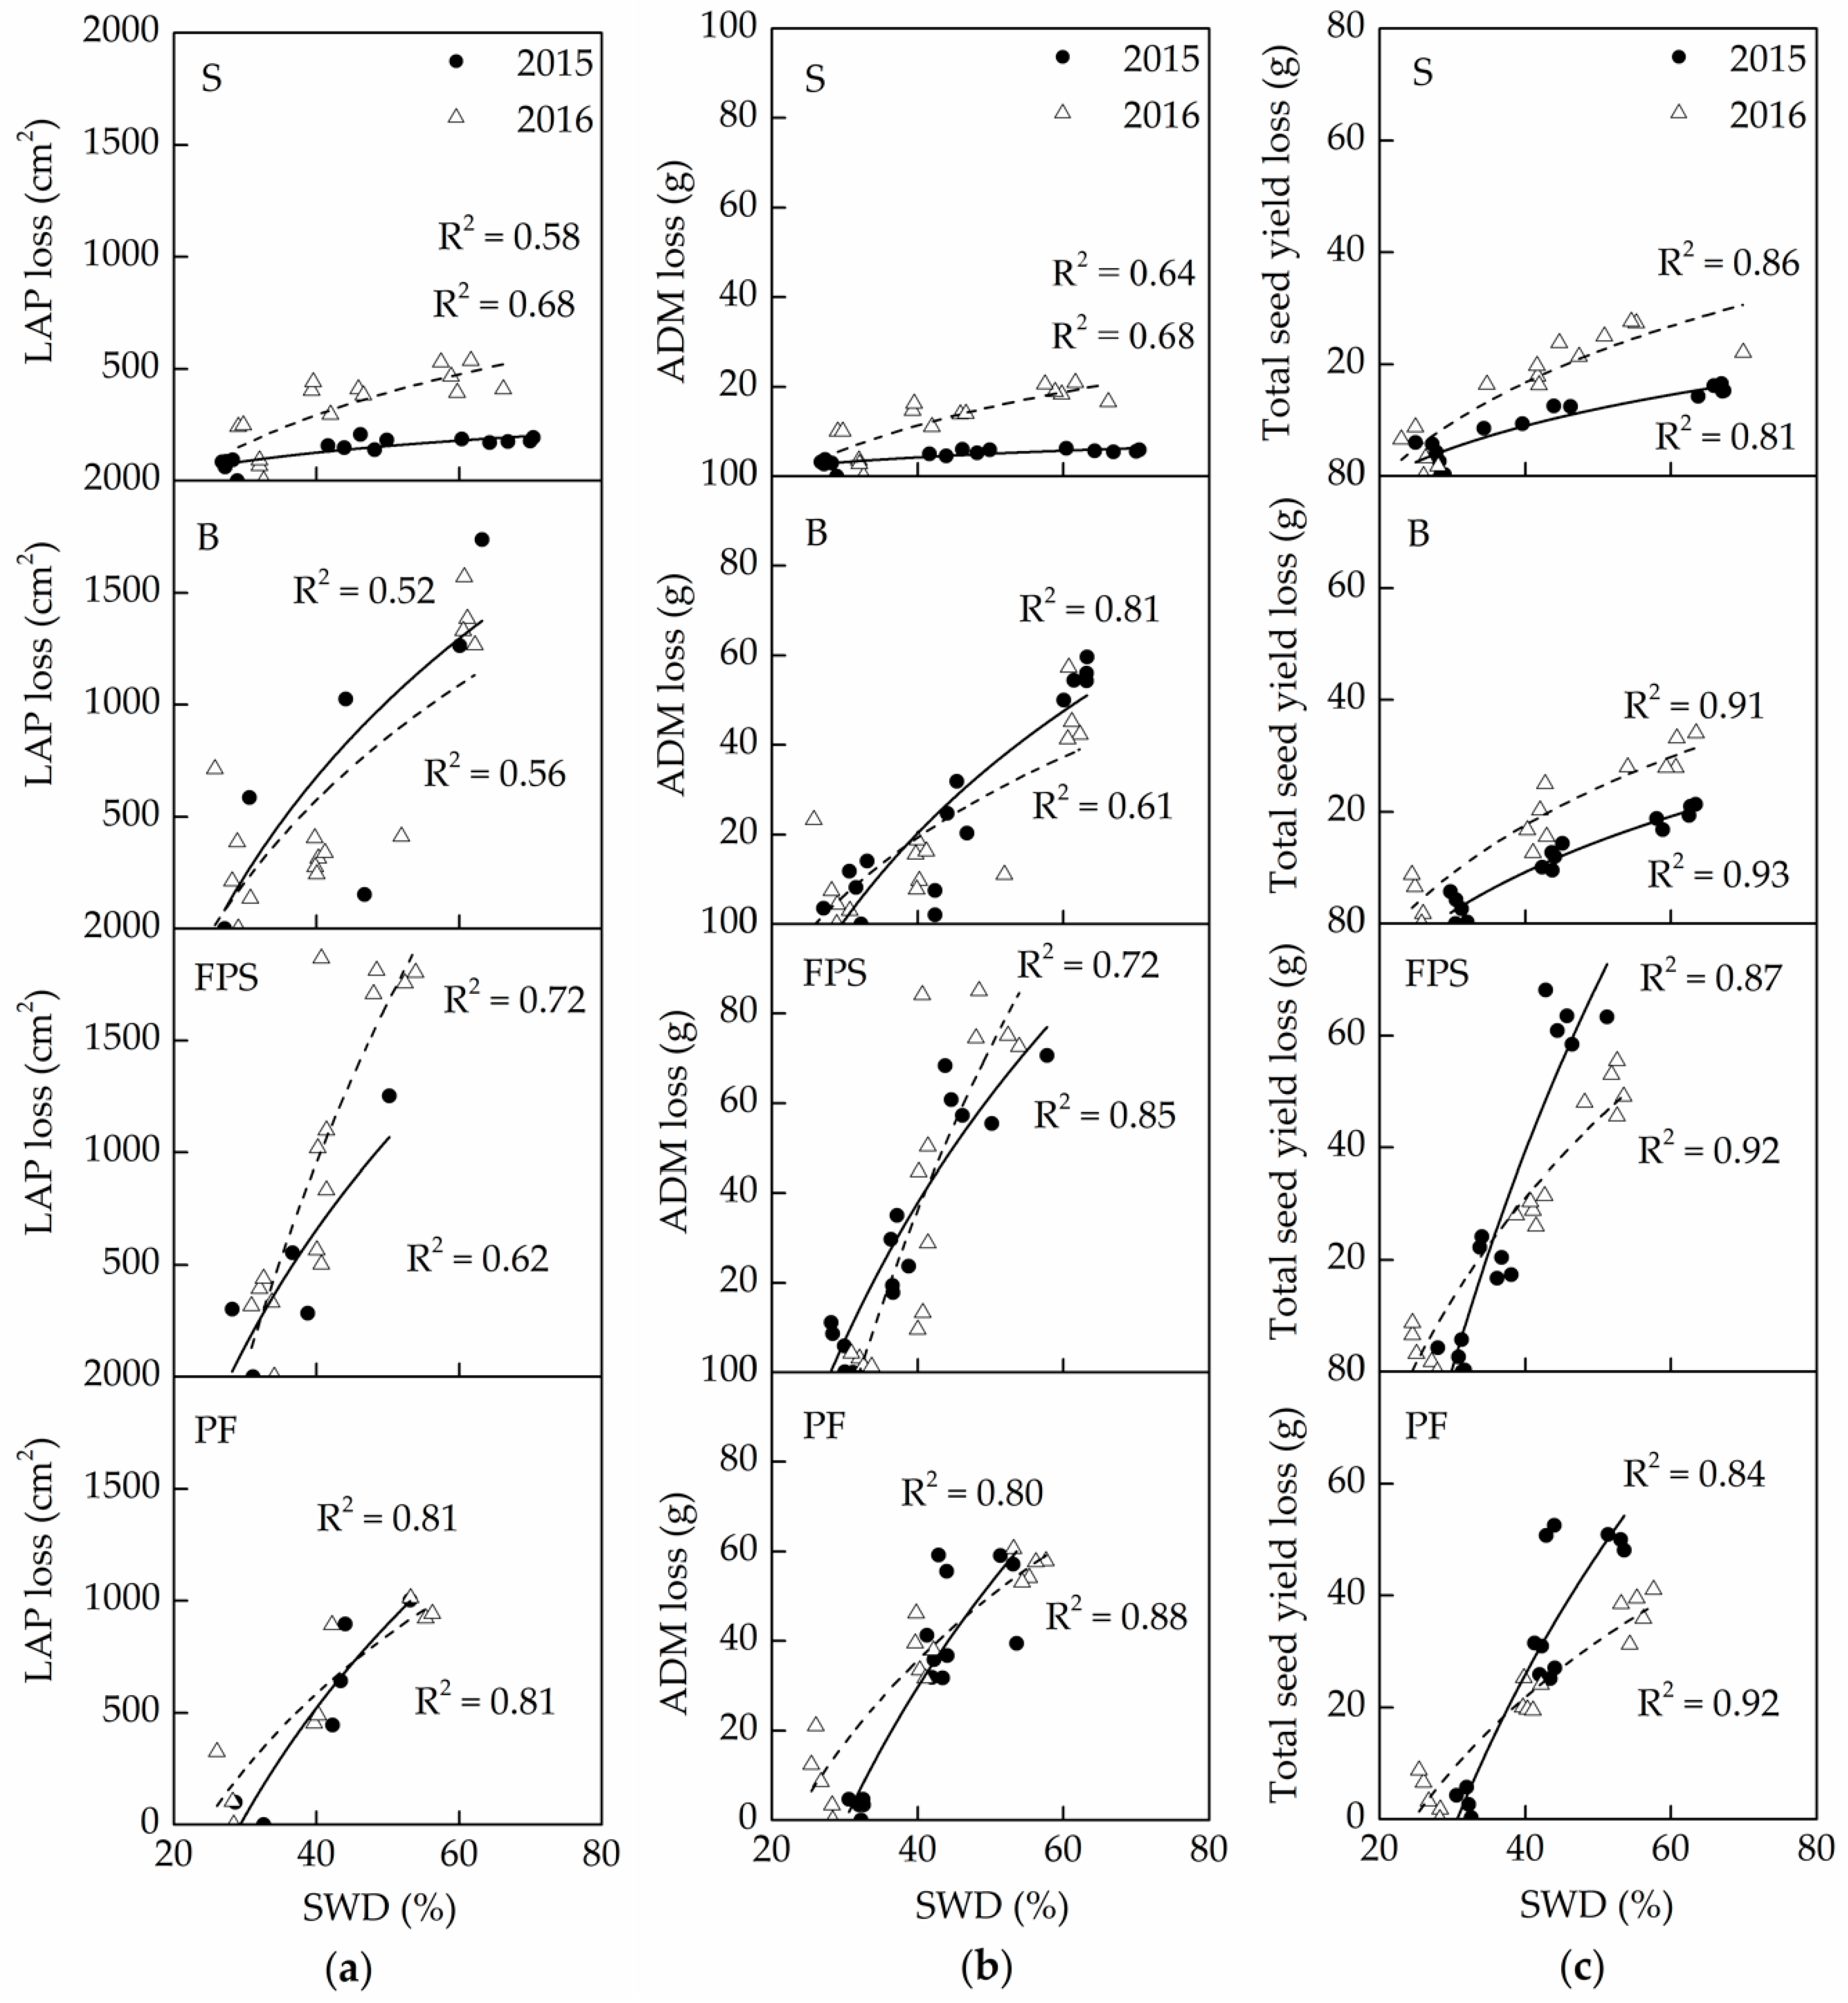
3.4. Relationships between Reductions in SWD and LAI Reduction, ADM Reduction and Yield
The relationships between LAP, aboveground dry matter accumulation, seeds weight loss, and SWD during the four soybean growth stages are shown in
Figure 6. Regression coefficients (
R2) ranged between 0.5 and 0.9 and the regression equation had a good fit. The response of loss to water stress can be quantified using the
k factor, reflecting the sensitivity of the change in the slope of the fitted curve to increased soil water deficit. Values of
k for various characteristics from S to PF in the two-year study are shown in
Table 5. A higher value of
k indicates a more rapid increase in loss with SWD. This may reflect the sensitivity of soybean to water, to a certain degree. Although there was a difference in
k values between the two years (especially to FPS and PF) due to the weather conditions during the four stages, the general trend was similar.
The curves for LAP and ADM (aboveground dry matter accumulation) losses reflected the impact of drought stress during the study period. A trend of increasing LAP losses with increasing SWD was observed (
Figure 6). The highest LAP reduction due to water deficit occurred in the treatment with FPS drought, where the curve was the steepest and values for
k in the two seasons were 1.81 and 3.20, respectively. On the other hand,
k values were much lower (0.13 and 0.45) during the seedling stage. As in the case of aboveground dry matter accumulation (ADM), the results obtained from this two-year study showed the highest losses and the maximum values of
k (106.71 and 162.56) occurred during FPS. The values of
k for the SWD-LAP and SWD-ADM reflection curves during the four growth stages were ranked from largest to smallest: FPS, PF, B, and S.
The seed weight loss curves reflected the effects of soil water deficit at various stages on final harvest seed weight. The results showed that higher values of
k (134.82 and 62.85) for each year were observed during the FPS drought stress treatment. This showed that the responses of final seed weight loss of soybean to FPS drought stress was the most significant. The sensitivity of soybean yield to water stress during the different growth stages was determined by Yan and Wang [
26] in Liaoning Province, China (41°49′ N and 123°32′ E). They estimated the water influence on growth stages in decreasing order: pod-filling, flowering, and vegetative growth stages. This disagreement could be explained by the soil type and weather conditions. On the other hand, studies of yield response factor
ky [
44] could explain the response of crop yield to the drought degree during the various stages. The FAO-derived value of
ky for corn in the flowering and yield formation stages was 2.3, while it was 0.4 in the early vegetative stage [
3].
4. Conclusions
The results of this two-year study showed that soybean growth is greatly affected by water deficit during different stages. As a general rule, plant height developed rapidly in the early growth stages, and stopped in the later FPS stage. Drought stress that occurs prior to FPS may interfere with the normal plant height. Leaf area per plants under favorable soil water conditions increased rapidly until the end of FPS, attaining 2593 cm2/plant, and then decreased as the leaves died. Drought stress during vegetative growth stages (S and B) led to slower LAP development, while moisture stress during the reproductive growth stages (FPS and PF) resulted in a reduction of LAP due to earlier defoliation.
Moreover, the early senescence of leaves decreased aboveground dry matter accumulation and seed weight as a result of reduced photosynthetic efficiency. There was a 10% loss of the final aboveground dry matter accumulation when the plants were exposed to mild water stress during S (T1). However, there was a much higher loss of 51% due to severe drought during FPS (T6). Compared to T1, these results showed that soybean could be compensated for water stress that occurred in the early vegetative growth stage.
Results from this study also showed that soybean yield and its components were significantly affected by water stress during the reproductive growth stages. Seed weight per plant was the most sensitive to water deficit during FPS, and the highest seed weight loss was 82% when compared with the control. However, the 100-seed weight and ineffective pods rate were more sensitive to soil moisture conditions during PF.
A close correlation existed between soil water deficit and various soybean losses (LAP, ADM, seed weight) during the different growth stages. Based on the logarithmic fitting curve analysis, during each stage, the loss of LAP and ADM increased with the degree of drought stress, and the extent of this rise in order of growth stage was: FPS, PF, B, and S. Regarding final seed weight, the ranked sensitivity of growth stages from high to low was: FPS, PF, B, and S.
Comparing the seed yield of the pot experiment with field rain-fed soybean in 2016, there was a reduction in field plants. The average seed yield of the pot was 4784 kg/ha, while the field yield was 3550 kg/ha. It is significant to maintain a stable and high yield of soybean by making reasonable irrigation rules. The value of k obtained in this study reflected the crop sensitivity to water deficit in each growth stage, which could be used as a basis for irrigation scheduling under limited water supply in regions with water scarcity, such as Anhui Province, China, where summer drought can significantly influence agricultural production. However, the field crops are affected by complex factors such as water tables, drainage percent, capillary rise and so on. The soil volume per plant of pot is lower than fields and the rooting zone is restricted. Therefore, the soil water deficit of pot would develop more quickly than in the field. This is the limitation of the pot experiment and deserves further research.


