Article

Antioxidant Capacity and UPLC-PDA ESI-MS Phenolic Profile of Stevia rebaudiana Dry Powder Extracts Obtained by Ultrasound Assisted Extraction

by
Ana G. Covarrubias-Cárdenas
1,
José Isabel Martínez-Castillo
1,
Nelly Medina-Torres
1,
Teresa Ayora-Talavera
1,
Hugo Espinosa-Andrews
2,
N. Ulises García-Cruz
3 and
Neith Pacheco
1,*
1
Centro de Investigación y Asistencia en Tecnología y Diseño del Estado de Jalisco (CIATEJ) Unidad Sureste, Mérida 97070, Mexico
2
CIATEJ Unidad Zapopan, Camino Arenero 1227, El Bajio del Arenal, Zapopan Jalisco 45019, Mexico
3
Departamento de Recursos del Mar, Centro de Investigación y Estudios Avanzados del Instituto Politécnico Nacional, Mérida 97310, Mexico
*
Author to whom correspondence should be addressed.
Agronomy 2018, 8(9), 170; https://doi.org/10.3390/agronomy8090170
Submission received: 24 July 2018 / Revised: 20 August 2018 / Accepted: 27 August 2018 / Published: 31 August 2018
(This article belongs to the Special Issue Functional Metabolism in Crops/Agronomy)

Abstract

:
Stevia leaves, which are commonly used as a natural sweetener in food products, have increased in importance for antioxidant delivery due to their high content of phenolic compounds. In this study, the influence of the drying process on stevia leaves, with regards to phenolic content and antioxidant activity during drying kinetics 40 °C for 7 h, was studied. The effect of solvent concentration and extraction time using a 32 factorial design on total phenol content (TPC), and on antioxidant activity of extracts obtained from dried stevia leaves, by ultrasound assisted extraction (UAE) as alternative method was evaluated. Steviol glycosides contents were also evaluated by a conventional and UAE method. Phenols identification, quantification and purification were performed by Ultra Performance Liquid Chromatography-Electrospray Ionization-Mass Spectrometry (UPLC-ESI-MS), Ultra Performance Liquid Chromatography-Photodiode Array (UPLC-PDA) and advanced automated flash purification, respectively. Drying time affected the moisture content of stevia leaves. A constant weight was reached after six hours of drying, and higher antioxidant activity was observed, while the highest TPC was obtained after seven hours of drying. The highest TPC (91.57 ± 8.8 mg GAE/g dw) and antioxidant activity (603.24 ± 3.5 μmol TE/g dw) in UAE method was obtained when ethanol 50% at 5 min was used. Steviol glycosides extracted by UAE were recorded with a content of 93.18 ± 1.36 mg/g dw and 98.97 ± 1.75 mg/g dw for stevioside and rebaudioside A respectively. Six phenolic compounds including four phenolic acids and two flavonoids were identified and quantified by UPLC-PDA, and confirmed by ESI-MS reporting its fragmentation pattern. Diosmin and chlorogenic acid were the most abundant compounds with values of 2032.36 μg/mL and 434.95 μg/mL respectively. As a novelty we found that the antioxidant activity evaluated in partially purified fractions suggested that biological activity might be attributed to the synergistic effect of the six phenols present in the stevia leaves extract. In addition to its sweeting properties, stevia leaves constitute a potential source of polyphenolic compounds, with antioxidant activity that could be used as a food additive.

1. Introduction

Stevia rebaudiana is an herbaceous perennial plant that is composed of leaves containing a natural source of diterpenic glycosides, allowing them to be extensively used as a non-caloric sugar substitute which is 250 to 300 times sweeter than sucrose [1]. It is traditionally used in non-alcoholic beverages, bakery products and chewing gum [2]. Besides glycosides, stevia leaves extracts contains phytochemicals, such as phenols which are the main compounds responsible of the antioxidant activity of the extracts [1,3]. Recently, these phytochemicals have become important in human health as protective agents against oxidative damage is due to their capabilities in delaying or inhibiting the formation and propagation of free radicals [4,5]. In an effort to extend the shelf life and preserve the quality of stevia leaves before the phenolic compounds extraction, a dehydration process is highly recommended in order to reduce the moisture content, to simplify the extraction process and increase the phytochemical compounds yield [6,7]. Previous studies have shown the influence of drying process on quality aspects of stevia leaves such as color, vitamin C, total phenols content and antioxidant activity [8,9]. Lemus-Mondaca et al. [9] claimed there was an increase in total phenol content (TPC) and antioxidant activity after drying stevia leaves at 30, 40, 50, 60, and 70 °C, with the highest value being reached at 40 °C.
Recently, significant development of extraction techniques for phenolic compounds have emerged [10,11,12]. Ultrasound assisted extraction (UAE) has been used successfully and is considered a sustainable method [13]. Several studies have reported UAE as a high recovery method for compounds in comparison with other extractions methods. Additionally, solvents with different polarities can be used, allowing the extraction of compounds with varied chemical structures [14]. Zlabur et al. [15] showed a higher extraction yield of TPC in aqueous extracts of stevia leaves by UAE compared to a conventional extraction method. Muanda et al. [16] reported that the major phenolic compounds in stevia leaves were quercetin dehydrate, protocatechuic acid and quercetin glucosyl using water and water-methanol as solvent by maceration.
The identification and quantification of phenols is more commonly performed by High Performance Liquid Chromatography (HPLC). Lemus-Mondaca et al. [17] reported the identification of chlorogenic acid, caffeic acid, Trans-ferulic acid and rutin in stevia leaves extracted by maceration method. Muanda et al. [16] identified by means of Reverse Phase (RP)-HPLC, 18 compounds in water and methanol-water stevia extracts by solid-liquid extraction. Additionally, specific chromatographic techniques, such as advanced automated flash purification of phenolic compounds are used to identify individual or synergic effects of different antioxidant compounds. In a previous study Covarrubias-Cárdenas [18] obtained phenolic fractions by advanced automated flash purification from sour orange extracts, from which the antioxidant activity evaluation of the fractions indicated that the biological activity may be attributed to the synergistic effect of the nine phenols present in the sour orange extract rather than from the partial purified extracts.
Therefore, this study aims to: (a) Determine the influence of the drying process on the TPC and antioxidant activity in order to produce stevia leaf powder; (b) evaluate the effect of solvent concentration and extraction time on the TPC and antioxidant activity of stevia leaf extracts obtained by UAE as an alternative method; (c) perform a partial phenolic purification, to evaluate where the antioxidant activity originates; and (d) identify and quantify the phenolic compounds present in the samples by Ultra Performance Liquid Chromatography-Photodiode Array (UPLC-PDA) Electrospray Ionization-Mass Spectrometry (ESI-MS).

2. Materials and Methods

2.1. Plant Materials and Reagents

The stevia leaves (Stevia rebaudiana Bertoni) were obtained from a local producer in Yucatán, México. Folin-Ciocalteu reagent, 2,2-diphenyl-1-picrylhydrazyl (DPPH) compound, analytical standards of: Caffeic acid, chlorogenic acid, ellagic acid, ferulic acid, diosmin, rutin, methanol and acetonitrile, were purchased from Sigma Aldrich. Ultra-pure water was prepared in a Milli-Q water filtration system (Millipore, Bedford, MA, USA).

2.2. Drying Kinetics of Stevia Leaves

Stevia leaves were selected based on color and freshness according to visual analysis in order to provide a homogeneous group. The drying process was performed at 40 °C with constant air velocity in a steam dehydrator (Jersa, 148-09, Mexico, Mexico) until constant weight was achieved after 7 h. Sampling was performed each hour and kept in a desiccator to avoid hydration until further analysis. The moisture content was determined in fresh stevia leaves and in the samples obtained during drying kinetic employing a thermobalance (Ohaus MB-45-2A0, Greifensee, Switzerland).
Phenolic extraction in the samples from drying kinetic was performed according to the maceration method described by Lemus-Mondaca et al. [17] with slight modifications. Briefly, 10 g of stevia leaves sample was homogenized in water to a solid ratio 1:10 (g/mL). Subsequently, the extracts were kept under stirring for 2 h at 50 °C, then samples were filtered through a Whatman® (GE Healthcare, Buckinghamshire, UK) filter paper (number 1) under vacuum conditions and stored at 4 °C for further analysis.

Total Phenolic Content and Antioxidant Activity Determinations

TPC present in the stevia leaves extracts was performed by the Folin-Ciocalteau assay [19] and TPC was expressed as mg of gallic acid equivalent (GAE) per g of dry weight samples through a calibration curve of gallic acid from 25 to 600 ppm. 250 μL Folin Ciocalteau 1N reagent was added to 20 μL of diluted stevia leaf extract and shaken vigorously. After 8 min, 1250 μL of 7.5% Na2CO3 and 480 μL of distilled water were added to the stevia leaves extraction mixture. The absorbance of the reactions mixtures was measured at 760 nm using a UV-vis spectrophotometer (Thermo Fisher Scientific, Biomate 3S, Madison, WI, USA). To determine antioxidant activity a 2,2-Diphenyl-1-picrylhydrazyl (DPPH) radical scavenging activity assay was carried out according to Chen et al. [20] The DPPH radical scavenging effect of the sample was expressed based on the Trolox calibration curve, as μmol of Trolox equivalent (TE) per g of dried fruit weight. Briefly, 100 μL of sample extract was added to 2900 μL of 0.01 mM DPPH in methanol, then stored in darkness for 30 min at 24 °C. The DPPH radical scavenging was calculated using the following formula:
D P P H   r a d i c a l   s c a v e n g i n g   ( % )   = ( A   c o n t r o l A   s a m p l e A   c o n t r o l ) × 100
where A control and A sample represets absorbance of the control and the sample respectively.

2.3. Ultrasound Assisted Extraction Evaluation

The UAE evaluation of the dried stevia leaves was carried out based on a 32 factorial design to determine the major factors influencing the TPC extraction process. Extraction times (5, 10, 15 min) and solvent concentrations (50% ethanol in water (v/v), 25% ethanol in water (v/v), and 100% water) were used as factor in three different levels. UAE process was performed using 4 g of dry ground leaves immersed in 200 mL of each solvent with the different ethanol concentrations. The samples were independently sonicated by an ultrasound probe of 13 mm tip diameter coupled to a net power output (Ultrasonic Processor, Model GEX130PB, Newtown, CT, USA), at fixed frequency of 20 kHz and power 130 W for 5, 10 or 15 min at 80% of radiation. After sonication, the samples were filtered through a Whatman® filter paper (number 1) under vacuum conditions and stored at 4 °C for further analysis. A control sample was evaluated using the maceration method with dry stevia leaves and water as a solvent, with a solid:solvent ratio of (1:10 g/mL). Determination of TPC and antioxidant activity of the samples was performed as describe above.
Steviol glycosides extraction was carried out using stevia powder, a solid:solvent (water) ratio of 1:10 (g/mL) was used. The samples were then sonicated by an ultrasound probe (Ultrasonic Processor, Newtown, CT, USA, frequency 20 kHz, Power 130 W) at 80% of radiation. A control sample was performed using maceration method with dry stevia leaves and water as a solvent, solid:solvent ratio (1:10 g/mL) was employed. Subsequently, the extracts were kept under stirring for 2 h at 50 °C.

2.4. UPLC-PDA Profile Analysis and Quantification

The steviol glycosides and the phenol chromatographic profiles of dry leaves extracts were performed using a Waters Ultra Pressure Liquid Cromatography (UPLC) Acquity H Class (Waters, Milford, MA, USA) equipped with a quaternary pump (UPQSM), autosampler injector (UPPDALTC) and PDA eλ photodiode array detector (UPPDALTC). Empower 3 software (Waters, 2010, Milford, MA, USA) was used for data acquisition and processing. Chromatographic separation of the steviol glycosides was carried out using a Waters Acquity UPLC Spherisorb NH2 4.6 × 250 mm × 5 μm, at room temperature with a linear flow rate of 0.5 mL min−1 and the injection volume a 10 μL. Quantification was performed by means of analytical standard curves prepared individually and by mixing authenticstandards Stevioside and Rebaudioside A at concentrations of 10 to 200 ppm.
Chromatographic separation of the phenolic compounds was carried out using a Waters Acquity UPLC BEH C18 column, 1.7 μm, 100 × 2.1 mm I. D. (Waters, Milford, MA, USA) at room temperature, with the flow rate at 0.2 mL min−1 and the injection volume programmed to 1.56 at 2 μL. The mobile phase consisted of two solvents, (A) 0.1% of formic acid in ultra-pure water and (B) 0.1% formic acid in acetonitrile. The elution conditions applied included the followed: 0–2 min 100% A isocratic; 2 min linear gradient from 100% to 90% A, 2 min linear gradient from 90% to 77% A, 1 min 77% A isocratic, 10.5 min linear gradient from 77% to 76.5% A, 0.5 min 0% A isocratic, 6 min linear gradient from 0% to 50% A and 6 min linear gradient from 50% to 100% A. The photodiode array detector was set at 290 nm with a resolution of 4.8 nm to analyte detection. Quantification was performed by means of analytical standard curves prepared individually and by mixing authentic standards caffeic acid, chlorogenic acid, ferulic acid, ellagic acid, diosmin, rutin at concentrations of 1 to 100 ppm.

2.5. Analysis by UPLC–PDA ESI–MS

The UPLC-PDA ESI-MS chromatographic analysis was performed with the same Waters Acquity instrument described above linked to a Waters Xevo TQ-S micro mass spectrometer detector (MS). MassLynx V4.1 software (Waters, Milford, MA, USA, 2014) was used for data acquisition and processing. The mass spectrometer detector was used in negative electrospray ionization mode (ESI), with a capillary voltage of 4.0 kV, cone voltage of 50 V, desolvation temperature at 350 °C, source temperature at 150 °C and collision energy of 1 V. Argon ultra- high purity was used as collision gas. Nitrogen, supplied by Peak Scientific NM32LA nitrogen generator (Inchinnan, Scotland, UK), was used as source gas desolvation at 650 L h−1 and a gas cone at 50 L h−1. The mass spectra were recorded in full scan mode in a range of 20 m/z up to 700 m/z. The chromatographic separation of phenolic compounds was achieved with the same conditions as in the quantitative analysis by UPLC-PDA.

2.6. Partial Purification of Phenolic Compounds

The phenolic compounds purification was performed using an Advanced Automated Flash Purification (Biotage System, Model Isolera One, Sweden). Four mL of the sample was concentrated to 50% by rotaevaporation using a rotavapor BUCHI R-215, Switzerland equipment, then loaded automatically on to a SNAP C18 30 g Biotage cartridge. The aqueous extract obtained by maceration (control method) was also loaded. Elution was carried out at a flow rate of 25 mL/min using a gradient of (A) 0.1% of formic acid in ultra pure water and (B) 0.1% formic acid in acetonitrile. The gradient was programmed as follows: Three Column Volume (CV) of 0% B isocratic; 2 CV linear gradient from 0% to 10% B; 2 CV linear gradient from 10% to 23% B; 1 CV of 23% B isocratic; 10.5 CV linear gradient from 23% to 24% B; 2 CV linear gradient from 24% to 100%, 2.8 CV from 100% to 76% B, 3.1 CV linear gradient from 76% to 50%, 2 and 0.7 CV of 0% B. Peak monitoring by UV detection was performed at a wavelength of 290 nm. Acetonitrile solvent was removed from the fractions by rotoevaporation, after which fractions were subjected to antioxidant determination and polyphenol compounds identification and quantification as previously explained. For the antioxidant activity determination, the TPC of fractions obtained by maceration and UAE method were fixed to 18 μg/mL in order to reveal comparable results.

2.7. Statistical Analysis

Data from the 32 factorial design was analyzed by a Multifactorial Analysis of Variance (ANOVA) using a p-value < 0.05 and significant differences were assessed by Least Square Design (LSD) using the Statgraphics Centurion XVI software program (version XVI, Manugistic, Inc., Rockville, MD, USA).

3. Results

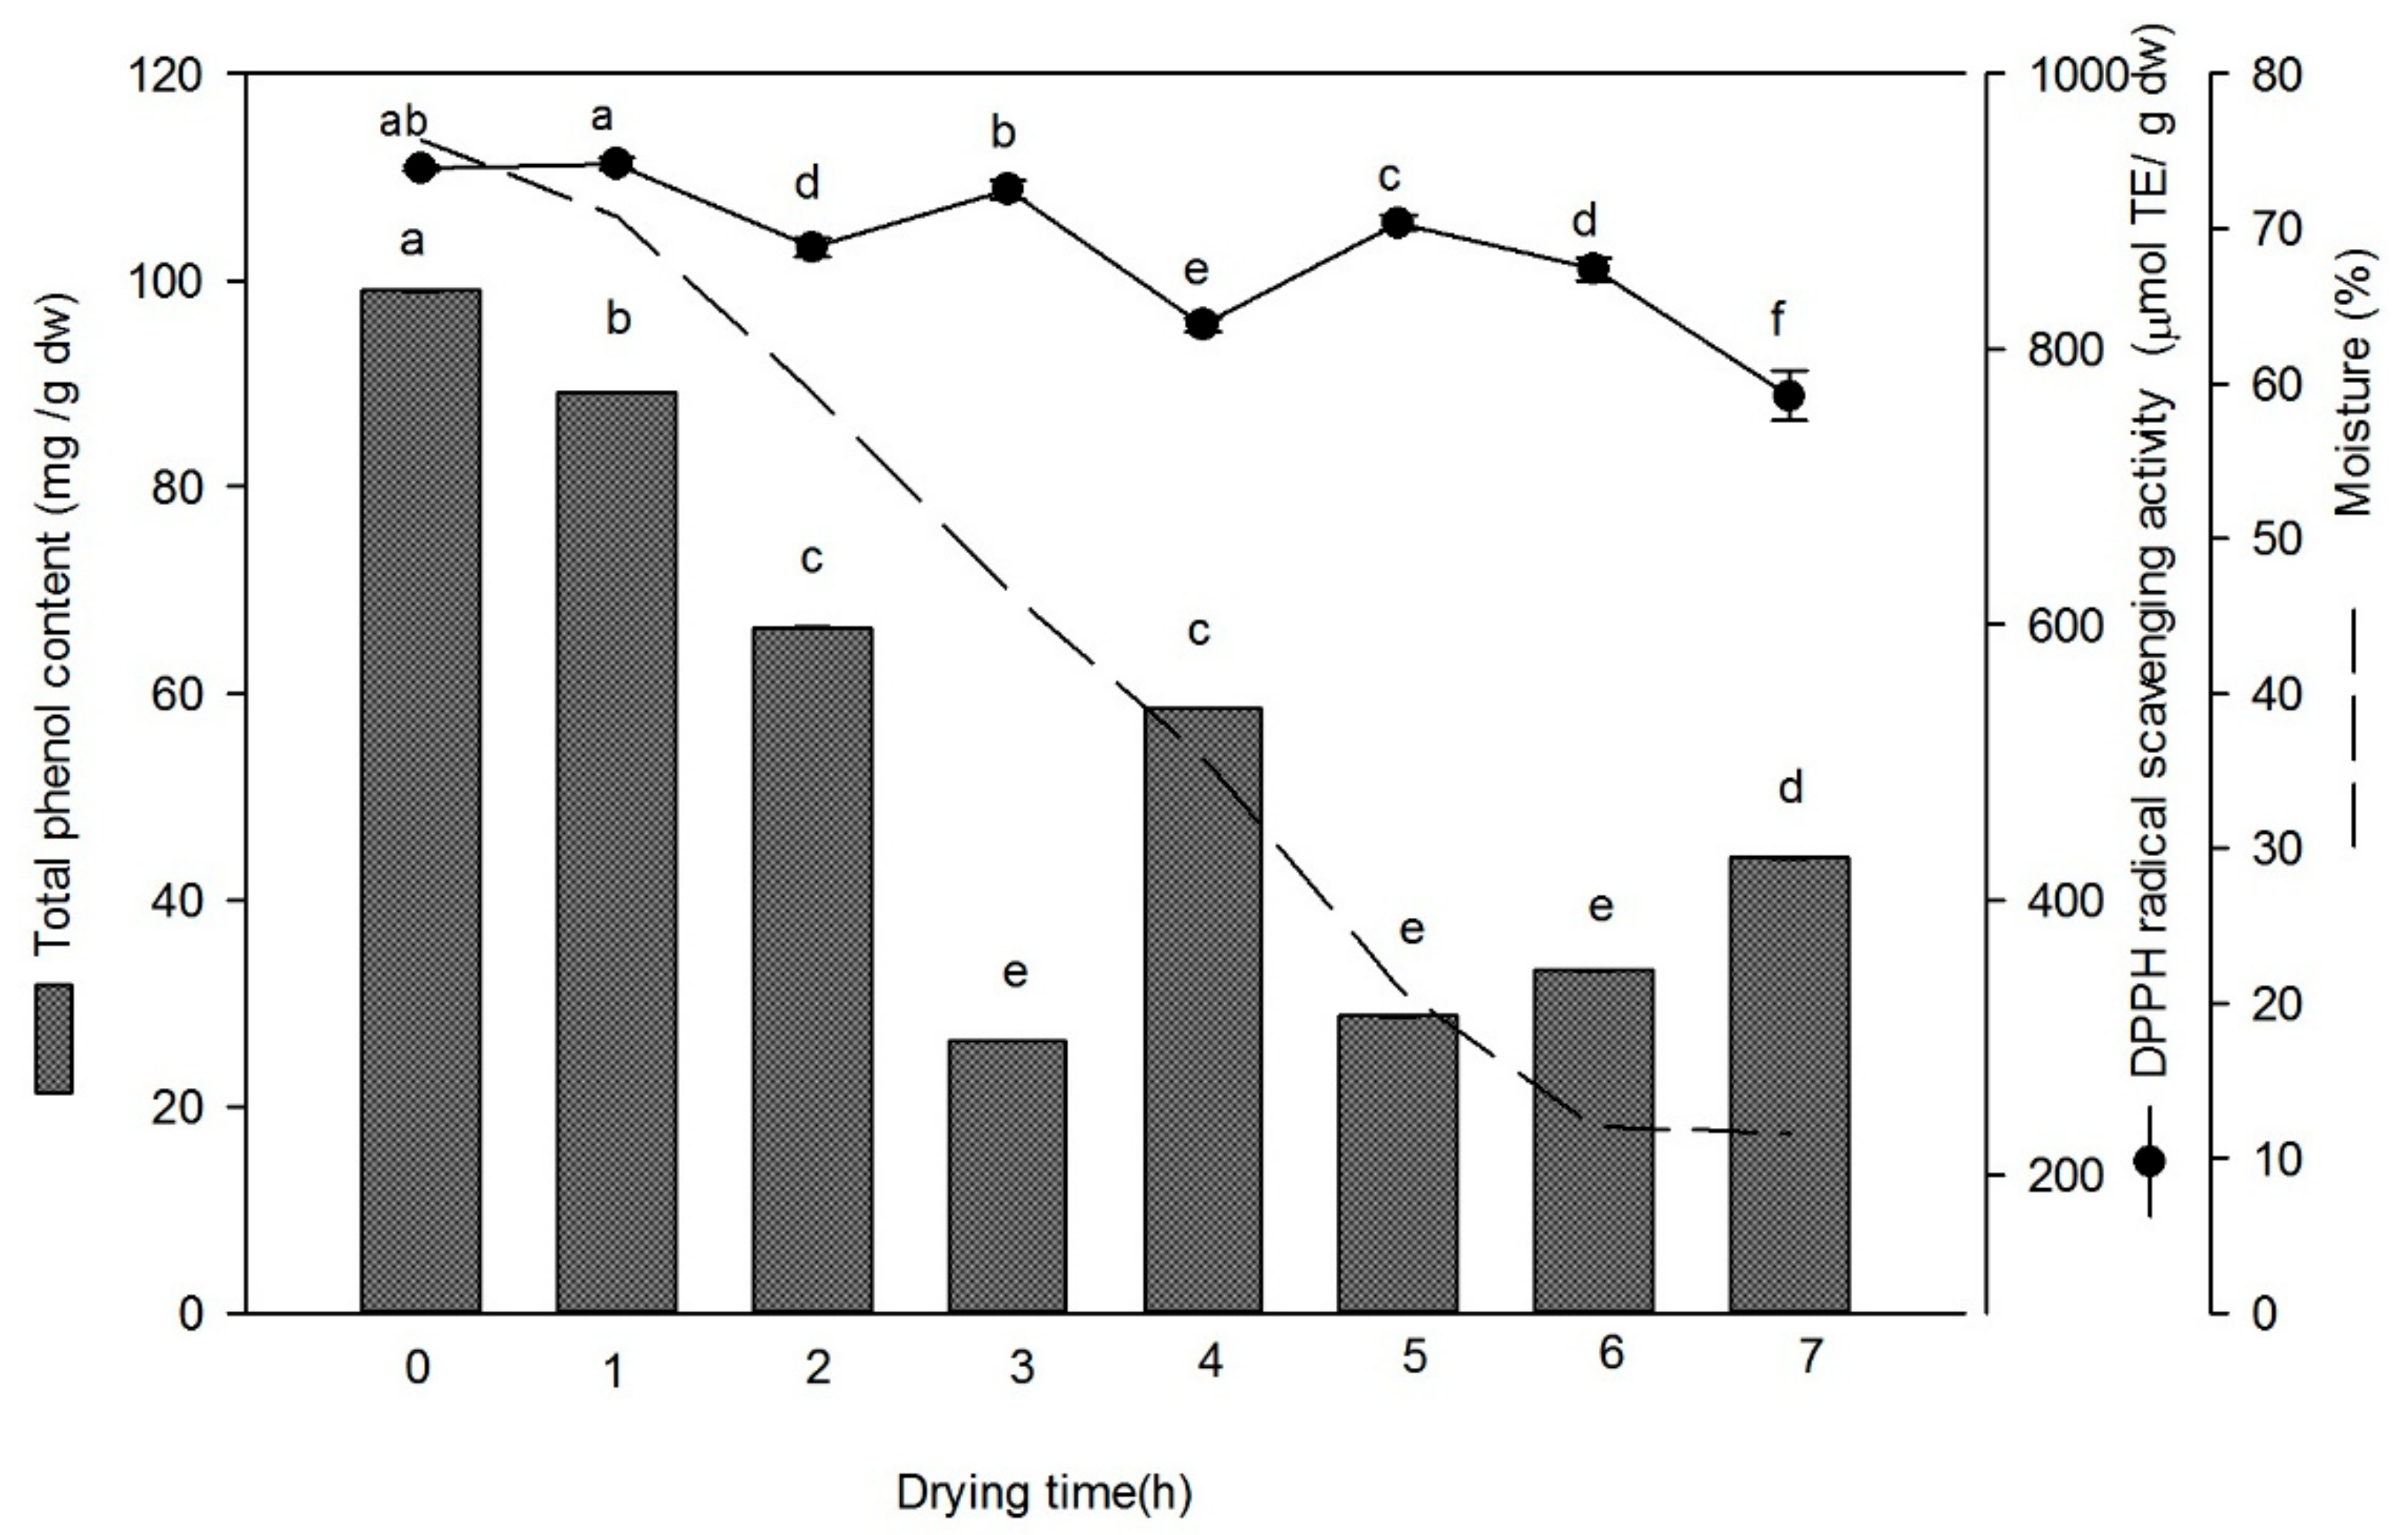
3.1. Drying Kinetic of Stevia Leaves

3.1.1. Moisture Content

The drying kinetic of stevia leaves was performed at 40 °C throughout the entire process to more accurately evaluate the effect of the heating time on the moisture content reduction, phenol content and antioxidant activity. Figure 1 shows the moisture content reduction with values obtained from the interval of 76.28% for fresh stevia leaves at the initial time and at 11.57% at 7 h of dried, time, in which the sample no longer presented further reduction in moisture content and the leaves reached a constant weight. Castillo-Téllez et al. [7] agreed that the best time to collect and store stevia leaves is when they become brittle with 10–12% moisture content. Previous studies also determined a significant (p < 0.05) increase in TPC after air drying reached the highest value at 40 °C with 55.05 ± 2.27 mg GAE/100 g dw, as reported by Lemus-Mondaca et al. [17]. Better understanding of these dehydration processes of Stevia leaves will allow higher yields of the active compounds.

3.1.2. Total Phenolic Compounds

The effect of drying time on total phenolic compounds extracted from Stevia rebaudiana leaves by the maceration extraction method are also shown in Figure 1. The values obtained fall in the range 26.29 ± 0.03 mg GAE/g dw to 98.99 ± 0.03 mg GAE/g dw. Significant statistical differences (p < 0.05) in the polyphenol content were observed.
The highest TPC content was found in fresh stevia leaves at the initial drying time with 98.99 mg GAE/g dw while the lowest values were obtained at drying times 3 h, 5 h and 6 h. Similar behavior was observed by Periche et al. [5] at 100 °C, who reported that higher levels of phenols were obtained in fresh stevia leaves (44.4 ± 1.04 mg GAE /g stevia) than in dried ones (31.5 mg equivalent). Capecka et al. [21] also obtained lower phenol content values for shade dried leaves of lemon balm than the fresh lemon balm leaves. Once stevia leaves reached constant weight, a statistically difference was observed between drying time of 6 and 7 with values of 33.139 ± 0.06 and 44.08 ± 0.07 mg GAE/g dw respectively.

3.1.3. DPPH Radical Scavenging Activity

Results of antioxidant activity related to the drying processes of stevia leaves varied from 765.89 ± 18.12 to 934.68 ± 4.46 μmol TE/g dw (Figure 1). Higher antioxidant activity was observed at the initial time when the moisture content was approximately 70%. Lemus-Mondaca et al. [17] obtained a similar behavior, where higher antioxidant activity was identified in fresh stevia leaves than in dried ones. Nevertheless, higher values of antioxidant activity were obtained herein. Although the highest phenol content in stevia leaves was present at 7 h of drying, this was not the case for antioxidant activity. The highest amount of antioxidant activity was observed in a drying time 6 h, while drying time of 4 h showed the lowest value for antioxidant activity, making it the least suitable drying treatment.
It has been previously reported that glycosides and phenols compounds which are characteristic for stevia composition have a large number of hydroxyl groups that contribute to their antioxidant activity. Periche et al. [5] discussed the influence of the drying method on antioxidant activity of stevia leaves and observed that the amount of antioxidants was lower in fresh stevia leaves than dried leaves obtained by different drying methods.

3.2. Ultrasound Assisted Extraction Evaluation

Total Phenolic Content and DPPH Radical Scavenging Activity

A 32 factorial design to evaluate the effect of solvent concentration and extraction time on the TPC and antioxidant activity of stevia dried leaves by UAE was used. TPC from the factorial design treatments varied from 59.64 ± 2.5 mg GAE/g dw to 91.57 ± 8.8 mg GAE/g dw (Table 1). The highest TPC value was obtained when 50% ethanol at 5 min was used and the lowest value was recorded when water at 15 min was used (Table 1). The Analyses of Variance (ANOVA) reveals a significant effect (p < 0.05) of the solvent factor on TPC. A conventional maceration extraction method using water as solvent was also evaluated to compare to the UAE. The TPC value obtained from this maceration method (44.08 ± 0.07 mg GAE/g dw) was lower than the lowest value obtained by UAE (59.64 ± 2.5 mg GAE/g dw). Muanda et al. [16] reported lower TPC (20.85 ± 0.40 mg GAE/g dw) from stevia leaves using a conventional extraction methodology and water as a solvent, however they also reported the use of methanol-water as a solvent which obtained higher TPC (25.25 ± 0.21 mg GAE/g dw) than with the water. Nevertheless, the values obtained by Muanda et al. [16] were lower than the TPC obtained in this study. The selection of solvent polarity employed for the extraction is highly dependent on the compound being extracted and on the final use of the extracts. In the case of ethanol and water mixtures, water can create a more polar medium, which favors the extraction of compounds with similar polarity [22], and has the advantage of easy concentration by evaporation. Additionally, the Generally Recognized As Safe (GRAS) classification of ethanol allows its use as extraction solvent for products that can be use in food industry [23].
The conventional method (maceration) consists of soften and breaking the plant cell wall to release the soluble phytochemicals by heat being is transferred through convection and conduction to liberate compounds [24]. During the sonication process according to Vinatoru et al. [25], the suspended solids in a solvent promotes asymmetric bubbles that collapse, acting as extremely high speeds jets of solvent targeting the vegetal material, making UAE extremely effective.
For the antioxidant activity response, the ANOVA reveals a significant effect (p < 0.05) of both factors (solvent concentration and extraction time) individually and in their interaction. Antioxidant activity response varied from 54.08 ± 4.27% to 87.96 ± 0.32% (Table 1). Higher antioxidant activity was observed when ethanol 50% was used, at 5 min of extraction (87.96%). Yildiz-Ozturk et al. [26] reported DPPH radical scavenging activities of 92.49% using UAE method and methanol. Antioxidant activity of stevia dry leaves extracted by maceration method presented lower values (431.73 ± 18.12 μm TE/g dw) compare to the better treatments obtained by UAE, being significant different (p < 0.05) according to the LSD analysis.

3.3. Steviol Glycosides and Phenolic Compounds Profiles in Dry Stevia Dry Leaf Extracts by UPLC

The steviol glycosides and phenolic compounds profiles from the dry stevia leaf extracted with the UAE and conventional method are listed in Table 2. The profile of steviol glycosides obtained by UAE indicate the presence of stevioside and rebaudioside A with contents of 93.18 ± 1.36 mg/g dw and 98.97 ± 1.75 mg/g dw respectively. Jana et al. [15] determined the content of stevioside (96.48 mg/g extract) and rebaudioside A (36.92 mg/g extract) of stevia leaf extracts using UAE, however a higher content of rebaudioside A was obtained in the current study. Using the maceration extraction method showed steviolgycosides values higher than the stevioside (30.3 ± 0.27 mg/g dw) and rebaudioside A (36.81 ± 0.65 mg/g dw). In addition to the stevioside and rebaudioside A quantified in the stevia leaf extracts, rebaudioside C (10.8 ± 1.91 mg/g dw) was only observed in the maceration extract.
Martins et al. [27], studied a dynamic maceration of stevia leaves using different ethanol concentrations (water, ethanol 70% and 90%), their results showed that ethanol 70% extract higher content of stevioside and rebaudioside in comparison with water an ethanol 90%. These results are consistent with the higher values obtained in UAE.
With regards to polyphenolic compounds, the treatment using 50% ethanol and 10 min of extraction that resulted in the highest antioxidant activity and was selected for the phenolic profile determination by UPLC-PDA, and presented in Table 2. In order to compare the results, the maceration extract was also selected for the phenolic profile determination. The phenolic compounds were identified based on their retention times and quantified according to their respective standard calibration curves. Reverse-phase chromatography analysis of stevia leaf extracts showed a total of 6 phenolic compounds for both extracts. Higher amounts of each phenolic compound were observed in the extract obtained by UAE, in comparison to maceration. Among the phenolic compounds, diosmin (111.67 mg/g dw) and chlorogenic acid (23.90 mg/g dw) were the most abundant in UAE stevia leaves extract. In a previous study, Muanda et al. [16] reported lower amounts of chlorogenic acid extracted from methanol-water stevia leaf extract. Minor chromatographic peaks were also detected indicating the presence of caffeic acid, ellagic acid, ferulic acid and rutin. Compounds such as caffeic acid and rutin have also been identified in previous studies [28,29].

3.4. Analysis by UPLC-PDA ESI-MS

The spectroscopy and spectrometry data obtained by the analysis using UPLC-PDA-ESI-MS are presented in Table 3. The parameters of mass spectrometer were adjusted until the quasi molecular ions [M-H] were the most intense. In addition, some polyphenolic compounds showed fragmentations. Mass spectra of hydroxycinnamic acid derivatives such as caffeic and ferulic acid displayed fragments of [M-H-44]. Diosmin exhibited fragments of [M-H-308], which corresponded to loss of rutinoside, releasing aglycone [30]. Chlorogenic acid showed a fragment attributable to the loss of [M-H-163] caffeic acid and releasing (−)-quinic acid anion (detected). Mass spectra of ellagic acid and rutin displayed fragments of [M-H-300.99] and [M-H-610.23] attributed to the loss of a proton, these result are similar to the reported in previous studies [31,32].

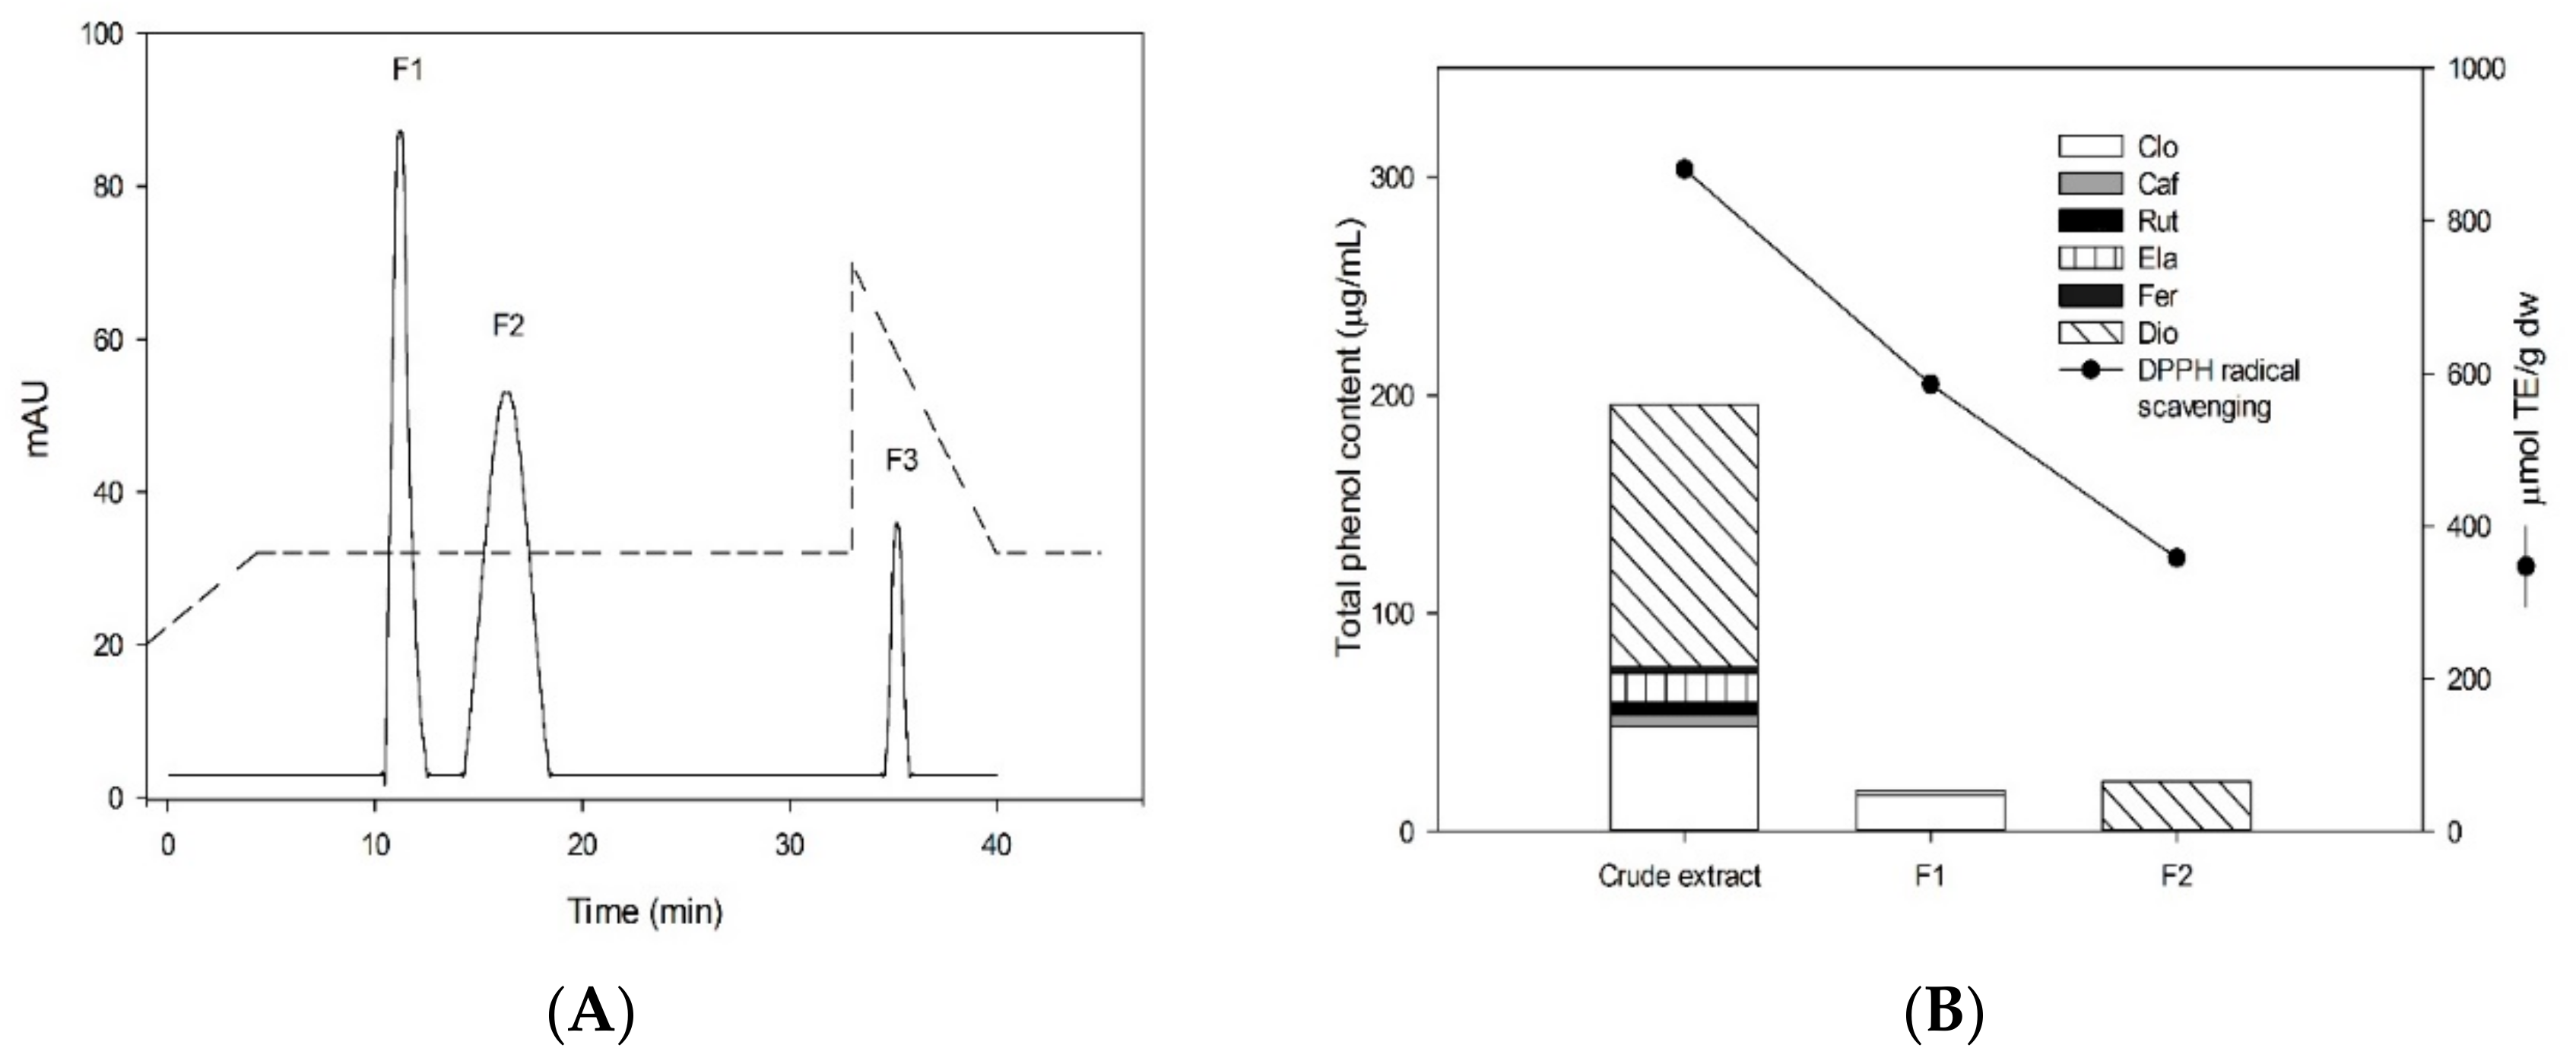
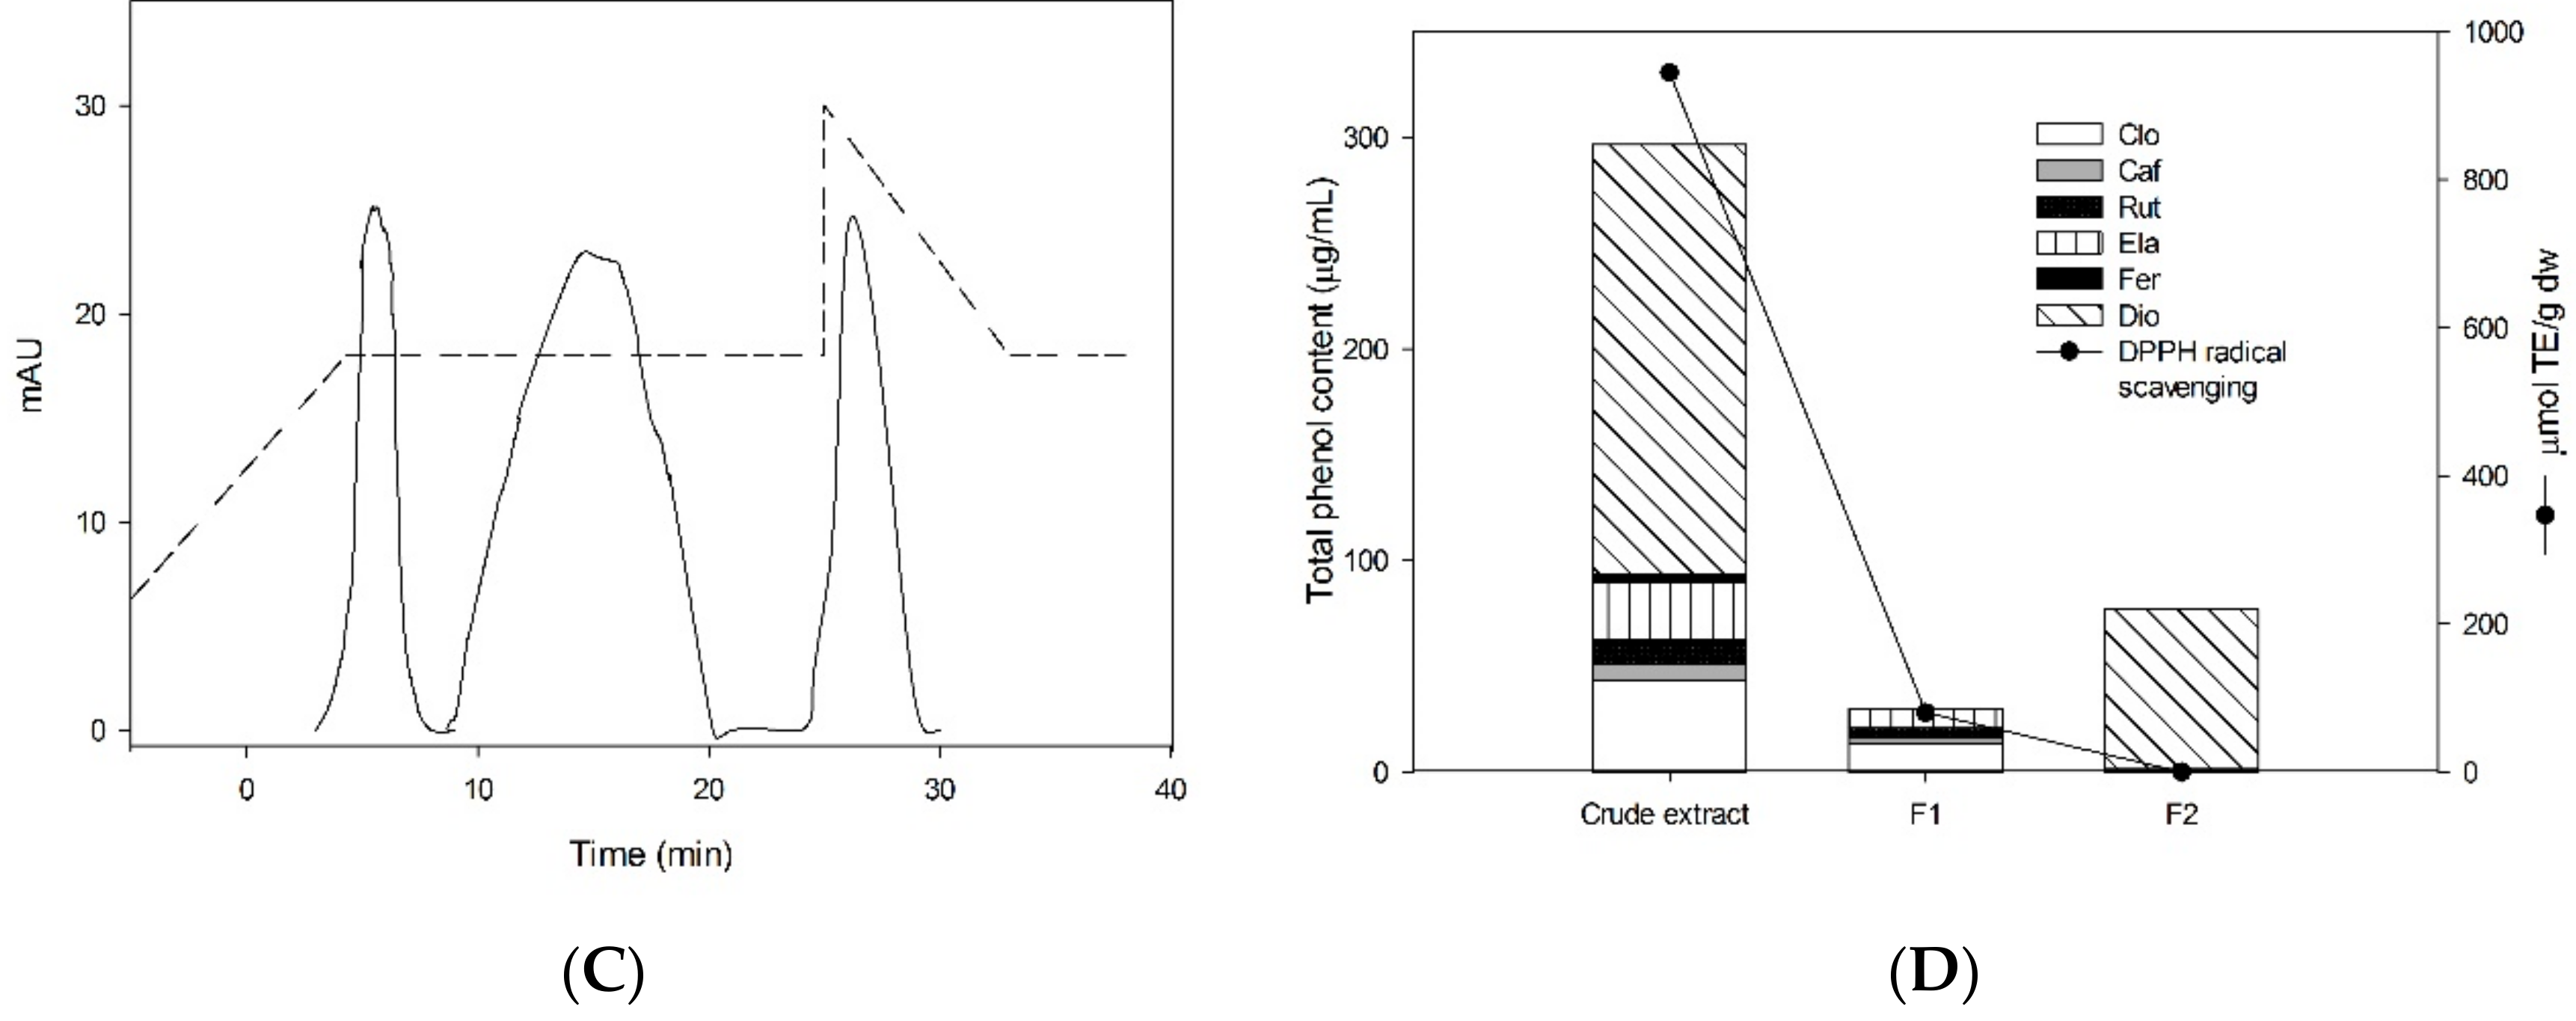
3.5. Analysis of Phenolic Profile and Antioxidant Activity of Partial Purified Samples

A partial purification of phenols of stevia leaves extracted by UAE and maceration methods was performed using an advanced automated flash purification system. Antioxidant activity, identification and quantification of partially purified polyphenolic fractions of stevia leaves were also determined. Figure 2A shows a modified chromatogram of partial purification of stevia leaves extracted by UAE from the automated flash chromatography system using the wavelength of 290 nm, whereby the chromatogram clarifies the presence of three peaks which represents the three fractions expressed as F1, F2 and F3. Figure 2A showed a peak at a retention time of 23 min, which is attributed to the gradient change determined during the separation of compounds. The above mentioned could be corroborated by UV spectrum analysis which did not show any phenolic compounds.
Identification and quantification of polyphenolic compounds obtained in each fraction were determined by UPLC as is explained in the materials and methods section. Figure 2B shows the main polyphenolic compounds presents in F1 and F2 whereby crude extract compounds were also expressed as a comparison. Fraction 3 did not show any polyphenolic compounds therefore it is not shown in the Figure 2B. The chromatographic results indicated that F1 exhibited chlorogenic acid as the compound that presented the major percentage in the fraction (60.06%) followed by an unknown compound coded as NC-1 (13.83%), caffeic acid (11.35%), ellagic acid (6.61%) rutin (6.60%) and an NC-2 (1.52%) with 29.75 μg/mL TPC of the fraction. F2 showed the presence of diosmin as the predominant compound (70.94%) followed by the unknown compounds coded as NC-1 (15.22%), NC-2 (7.46%) and ferulic acid (6.34%) with a TPC of 76.65 μg/mL.
Partial purification data by UAE is collected in Figure 2C and shows the modified chromatogram of stevia leaves extracted by maceration in the automated flash chromatography system, whereby the chromatogram identifies three peaks which represents the three fractions expressed as F1, F2 and F3. The third peak coded as F3 is also attributed to the gradient change determined during the separation of compounds. Figure 2D shows the main polyphenolic compounds presents in F1 and F2 whereby crude extract compounds where also expressed as a comparison. Fraction 3 did not show any polyphenolic compounds therefore it is not shown in the Figure 2D. The chromatographic results indicated that F1 exhibited chlorogenic acid as the major compound (74.31%), followed by caffeic acid (14.02%) and three unknown compounds coded as NC-1 (5.43%), NC-2 (3.70%) and NC-3 (2.54%) with 93.61 μg/mL TPC of the fraction. Although the amount of phenols was higher in fractions obtained by maceration, UAE revealed two compounds that were not present in the maceration extract: Ellagic acid and rutin, F2 showed lower values of diosmin (65.94%), and ferulic acid (3.51%) in comparison to UAE fractions, while other compounds such NC-1 (30.55%) were also obtained with 115.22 μg/mL TPC.
The phenolic compounds present in the crude extract may have different antioxidant activities. Therefore, the crude extracts and the fractions obtained after purification were fixed at 18 μg/mL to better evaluate the antioxidant activity. A comparison amongst the data is presented herein in order to obtain information related to the influence of the different polyphenolic compounds on the antioxidant activity. The UAE crude extract presented higher antioxidant activity (944 μmol TE/g dw) than the maceration crude extract (867.31 ± 36.36 μmol TE/dw). Antioxidant activity of F1 of maceration extract was higher (585.51 μmol TE/g dw) than F1 of UAE (80.00 ± 6.29 μmol TE/g dw). Although diosmin and ferulic acid were the predominant phenols in F2, UAE did not reveal antioxidant activity unlike F2 maceration extract (358.13 ± 20.31 μmol TE/g dw). In regards to these results, it can be suggested that the antioxidant activity is higher due to a synergic effect by the mixture of phenolic compounds present in the crude extract.

4. Conclusions

Phytochemical changes in phenol content and antioxidant activity responses occurred during the drying process of stevia leaves. The comparison results of the composition of steviol glycosides and the phenolic compounds composition from the dried stevia leaves extracted with a conventional (maceration) and UAE method, provided the better conditions to produce a more successful extraction of phenolic compounds. The highest total phenol content and antioxidant activity was obtained when 50% ethanol was used as a solvent at 5 min of extraction. As major contribution of this paper it can be conclude that six phenolic compounds including four phenolic acids and two flavonoids were identified and quantified by UPLC-PDA and confirmed by mass spectrometry ESI-MS reporting its fragmentation pattern. Diosmin and chlorogenic acid were the most abundant compounds in stevia leaf extracts. The novelty of this study lies in the attribution of the biological activity to the synergistic effect of the six phenols present in the ethanolic 50% extract, due to antioxidant activity was higher when phenolic compounds were together. Stevia leaf extract is not only a sweetener, but also a potential source of polyphenolic compounds that can be use in functional food production.

Author Contributions

A.G.C.-C. and J.I.M.-C. for the performance of experiments, N.M.-T. for the development of the chromatographic techniques, H.E.-A. for the analysis of the results and supervision of A.G.C.-C. experiments performed in his laboratory, A.G.C.-C., T.A.-T., N.U.G.-C. and N.P. for the approach of the research, the topic expertise, supervision of the experimental work, analysis of the information and the structure of the paper.

Funding

This research was funded by Fondo Sep-Conacyt Ciencia Básica Number CB2015-01.

Acknowledgments

We thank Consejo Nacional de Ciencia y Tecnología CONACYT for the grant of Ana Covarrubias-Cárdenas. To ASPELAB® to provide the equipment (Advanced Automated Purification Biotage System Model Isolera) for partial purification performed in this work. And Jamie Prutt for the English spelling.

Conflicts of Interest

The authors declare no conflict of interest.

References

  1. Kim, I.S.; Yang, M.; Lee, O.H.; Kang, S.N. The antioxidant activity and the bioactive compound content of Stevia rebaudiana water extracts. LWT–Food Sci. Technol. 2011, 44, 1328–1332. [Google Scholar] [CrossRef]
  2. Goyal, S.K.; Goyal, R.K. Stevia (Stevia rebaudiana) a bio-sweetener: A review. Int. J. Food Sci. Nutr. 2010, 61, 1–10. [Google Scholar] [CrossRef] [PubMed]
  3. Najafian, S.; Moradi, M. Polyphenolic compounds (HPLC analysis) and Antioxidant Activity of Stevia Rebaudiana (Asteraceae) by FRAP and DPPH Assay in greenhouse and free space condition. Int. J. Farm. Allied Sci. 2017, 3, 49–55. [Google Scholar]
  4. Kumar, Y.; Yadav, D.N.; Ahmad, T.; Narsaiah, K. Recent trends in the use of natural antioxidants for meat and meat products. Compr. Rev. Food Sci. Food Saf. 2015, 14, 796–812. [Google Scholar] [CrossRef]
  5. Fattore, M.; Montesano, D.; Pagano, E.; Teta, R.; Borrelli, F.; Mangoni, A.; Seccia, S.; Albrizio, S. Carotenoid and flavanoid profile and antioxidant activity in “ Pomodorino Vesuviano” tomatoes. J. Food Compost Anal. 2016, 53, 61–68. [Google Scholar] [CrossRef]
  6. Periche, A.; Castello, M.L.; Heredia, A.; Escriche, I. Influence of drying method on steviol glycosides and antioxidants in Stevia rebaudiana leaves. Food Chem. 2015, 172, 1–6. [Google Scholar] [CrossRef] [PubMed]
  7. Castillo Téllez, M.; Pilatowsky Figueroa, I.; Castillo Téllez, B.; López Vidaña, E.C.; López Ortiz, A. Solar drying of Stevia (Rebaudiana Bertoni) leaves using direct and indirect technologies. Sol. Energy 2018, 159, 898–907. [Google Scholar] [CrossRef]
  8. Garau, M.C.; Simal, S.; Rosselló, C.; Femenia, A. Effect of air-drying temperature on physico-chemical properties of dietary fibre and antioxidant capacity of orange (Citrus aurantium v. Canoneta) by-products. Food Chem. 2007, 104, 1014–1024. [Google Scholar] [CrossRef]
  9. Vega-Gálvez, A.; Di Scala, K.; Rodríguez, K.; Lemus-Mondaca, R.; Miranda, M.; López, J.; Perez-Won, M. Effect of air-drying temperature on physico-chemical properties, antioxidant capacity, colour and total phenolic content of red pepper (Capsicum annuum L. var. Hungarian). Food Chem. 2009, 117, 647–653. [Google Scholar] [CrossRef]
  10. Katsampa, P.; Valsamedou, E.; Grigorakis, S.; Makris, D.P. A green ultrasound-assisted extraction process for the recovery of antioxidant polyphenols and pigments from onion solid wastes using Box-Behnken experimental design and kinetics. Ind. Crops Prod. 2015, 77, 535–543. [Google Scholar] [CrossRef]
  11. Zhu, Z.; Li, S.; He, J.; Thirumdas, R.; Montesano, F.; Barba, F. Enzyme-assisted extraction of polyphenol from edible lotus (Nelumbo nucifera) rhizome knot: Ultra-filtration performance and HPLC-MS2 profile. Food Res Int. 2018, 111, 291–298. [Google Scholar] [CrossRef] [PubMed]
  12. Kovačević, D.; Maras, M.; Barba, F.; Granato, D.; Roohinejad, S.; Mallikarjunan, K.; Montesano, D.; Lorenzo, J.; Putnik, P. Innovative technologies for the recovery of phytochemicals from Stevia rebaudiana Bertono leaves: A review. Food Chem. 2018, 268, 513–521. [Google Scholar] [CrossRef] [PubMed]
  13. Medina-Torres, N.; Ayora-Talavera, T.; Espinosa-Andrews, H.; Sánchez-Contreras, A.; Pacheco, N. Ultrasound Assisted Extraction for the Recovery of Phenolic Compounds from Vegetable Sources. Agronomy 2017, 7, 47. [Google Scholar] [CrossRef]
  14. Falleh, H.; Ksouri, R.; Lucchessi, M.E.; Abdelly, C.; Magné, C. Ultrasound-assisted extraction: Effect of extraction time and solvent power on the levels of polyphenols and antioxidant activity of Mesembryanthemum edule L. Aizoaceae shoots. Trop. J. Pharm. Res. 2012, 11, 243–249. [Google Scholar] [CrossRef]
  15. Žlabur, J.Š.; Voća, S.; Dobričević, N.; Brnčić, M.; Dujmić, F.; Brnčić, S.R. Optimization of ultrasound assisted extraction of functional ingredients from Stevia rebaudiana Bertoni leaves. Int. Agrophys. 2015, 29, 231–237. [Google Scholar] [CrossRef]
  16. Muanda, F.N.; Soulimani, R.; Diop, B.; Dicko, A. Study on chemical composition and biological activities of essential oil and extracts from Stevia rebaudiana Bertoni leaves. LWT-Food Sci. Technol. 2011, 44, 1865–1872. [Google Scholar] [CrossRef]
  17. Lemus-Mondaca, R.; Ah-Hen, K.; Vega-Gálvez, A.; Honores, C.; Moraga, N.O. Stevia rebaudiana Leaves: Effect of drying process temperature on bioactive components, antioxidant capacity and natural sweeteners. Plant Foods Hum. Nutr. 2016, 71, 49–56. [Google Scholar] [CrossRef] [PubMed]
  18. Covarrubias-Cardenas, A.; Patrón-Vasquez, J.; Ayora-Talavera, T.; Espinosa-Andrews, H.; García-Cruz, N.U.; Pacheco, N. Antioxidant capacity and ULPC-PDA-ESI-MS polyphenolic profile of Citrus aurantium extracts obtained by ultrasound assisted extraction. J. Food Sci. Technol. 2018. submitted. [Google Scholar]
  19. Folin, O.; Ciocalteau, V. Tyrosine and Tryptophane in Proteins. J. Biol. Chem. 1927, 73, 627–648. [Google Scholar]
  20. Chen, M.L.; Yang, D.J.; Liu, S.C. Effects of drying temperature on the flavonoid, phenolic acid and antioxidative capacities of the methanol extract of citrus fruit (Citrus sinensis (L.) Osbeck) peels. Int. J. Food Sci. Technol. 2011, 46, 1179–1185. [Google Scholar] [CrossRef]
  21. Capecka, E.; Mareczek, A.; Leja, M. Antioxidant activity of fresh and dry herbs of some Lamiaceae species. Food Chem. 2005, 93, 223–226. [Google Scholar] [CrossRef]
  22. Nayak, B.; Dahmoune, F.; Moussi, K.; Remini, H.; Dairi, S.; Aoun, O.; Khodir, M. Comparison of microwave, ultrasound and accelerated-assisted solvent extraction for recovery of polyphenols from Citrus sinensis peels. Food Chem. 2015, 187, 507–516. [Google Scholar] [CrossRef] [PubMed]
  23. Rodrigues, S.; Fernandes, F.A.N.; de Brito, E.S.; Sousa, A.D.; Narain, N. Ultrasound extraction of phenolics and anthocyanins from jabuticaba peel. Ind. Crops Prod. 2015, 69, 400–407. [Google Scholar] [CrossRef]
  24. Nn, A. A Review on the Extraction Methods Use in Medicinal Plants, Principle, Strength and Limitation. Med. Aromat. Plants 2015, 4, 3–8. [Google Scholar] [CrossRef]
  25. Vinatoru, M.; Mason, T.J.; Calinescu, I. Ultrasonically assisted extraction (UAE) and microwave assisted extraction (MAE) of functional compounds from plant materials. TrAC-Trends Anal. Chem. 2017, 97, 159–178. [Google Scholar] [CrossRef]
  26. Yildiz-ozturk, E.; Nalbantsoy, A.; Tag, O.; Yesil-celiktas, O. A comparative study on extraction processes of Stevia rebaudiana leaves with emphasis on antioxidant, cytotoxic and nitric oxide inhibition activities. Ind. Crops Prod. 2015, 77, 961–971. [Google Scholar] [CrossRef]
  27. Martins, P.M.; Thorat, B.N.; Lanchote, A.D.; Freitas, L.A.P. Green extraction of glycosides from Stevia rebaudiana (Bert.) with low solvent consumption: A desirability approach. Resour. Technol. 2016, 2, 247–253. [Google Scholar] [CrossRef]
  28. Formigoni, M.; Gimenez, P.; Avíncola, S.; Jorge, V.; Benossi, L.; Sergio, A.; Jorge, E.; Claudio, S. Pretreatment with ethanol as an alternative to improve steviol glycosides extraction and purification from a new variety of stevia. Food Chem. 2018, 241, 452–459. [Google Scholar] [CrossRef] [PubMed]
  29. Ciulu, M.; Quirantes-Piné, R.; Spano, N.; Sanna, G.; Borrás-Linares, I.; Segura-Carretero, A. Evaluation of new extraction approaches to obtain phenolic compound-rich extracts from Stevia rebaudiana Bertoni leaves. Ind. Crops Prod. 2017, 108, 106–112. [Google Scholar] [CrossRef]
  30. Barreca, D.; Bellocco, E.; Caristi, C.; Leuzzi, U.; Gattuso, G. Flavonoid profile and radical-scavenging activity of Mediterranean sweet lemon (Citrus limetta Risso) juice. Food Chem. 2011, 129, 417–422. [Google Scholar] [CrossRef]
  31. De Andrade, N.; César, P.; Gómez-Alonso, S.; Hermosín-Gutiérrez, I. Flavonols and ellagic acid derivatives in peels of different species of jabuticaba (Plinia spp.) identified by HPLC-DAD-ESI/MSn. Food Chem. 2018, 252, 61–71. [Google Scholar] [CrossRef]
  32. Ledesma-Escobar, C.A.; Priego-Capote, F.; Robles-Olvera, V.J.; de Castro, M.L. Changes in the composition of the polar fraction of Persian lime (Citrus latifolia) during fruit growth by LC-QTOF MS/MS analysis. Food Chem. 2017, 234, 262–268. [Google Scholar] [CrossRef] [PubMed]
Figure 1. Effect of drying time at 40 °C on total phenol content (TPC) and 2-diphenyl-1-picrylhydrazyl (DPPH) antiradical activity of stevia leaves. Similar letters indicated no significant differences (p > 0.05) among drying times.
Agronomy 08 00170 g001
Figure 2. Modified chromatogram at 290 nm of UAE (A) and maceration (C) fractions separation obtained by an Isolera Prime System. Fractions polyphenolic profiles from UAE (B) and maceration (D) obtained by UPLC and Antioxidant activity expressed as µmol TE/g dw of each fraction fixed at a concentration of 18 μg/mL (B). Caf, caffeic acid; clo, chlorogenic acid; rut, rutin, ela, ellagic acid; fer, ferulic acid; dio, diosmin.
Agronomy 08 00170 g002aAgronomy 08 00170 g002b
Table 1. Ultrasound Assisted Extraction parameters for 32 factorial design, TPC and DPPH radical scavenging activity.
TreatmentSolventExtraction Time (min)TPC
(mg GAE/g dw)
DPPH Radical Scavenging Activity
DPPH Inhibition (%)(μmol TE/g dw)
MacerationcontrolWater12044.08 ± 0.07 e71.92 ± 1.69 e431.73 ± 18.12 d
UAE1Water573.83 ± 14.1 abcd70.20 ± 4.28 e413.21 ± 45.7 cd
2Water1063.45 ± 11.0 cd75.34 ±3.00 de467.20 ± 33.6 de
3Water1559.64 ± 2.5 de54.08 ± 4.27 f240.84 ± 45.7 f
4Ethanol 25582.14 ± 6.0 abc82.68 ± 1.97 bc546.72 ± 21.1 ab
5Ethanol 251074.74 ± 6.8 abcd79.17 ± 1.03 cd509.17 ± 11.0 bc
6Ethanol 251571.76 ± 6.1 bcd79.98 ± 0.17cd517.88 ± 1.8 bc
7Ethanol 50591.57 ± 8.8 a87.96 ± 0.32 a603.24 ± 3.5 a
8Ethanol 501077.55 ± 8.1 abcd87.91 ± 1.02 ab602.67 ± 10.9 a
9Ethanol 501585.95 ± 7.4 ab86.20 ± 1.01 ab584.35 ± 10.8 a
Different superscript letters within same column denote significant difference at p-value < 0.05 by least square design (LSD). All values are the mean of two replications. TPC, Total phenol content; GAE, Gallic Acid Equivalent; TE, Trolox equivalent.
Table 2. Steviol glycosides and polyphenol content of maceration and ultrasound assisted extraction (UAE) results.
PhytochemicalCompoundsExtraction Method
MacerationUAE
Steviol glycosides
(mg/g dw)
Stevioside30.3 ± 0.27 a93.18 ± 1.36 b
Rebaudioside A36.81 ± 0.65 a98.97 ± 1.75 b
Rebaudioside C10.8 ± 1.91 aND
Total77.91 a192.15 b
Phenolic compounds
(mg/g dw)
Chlorogenic acid24.16 ± 0.13 a23.90 ± 0.04 b
Caffeic acid2.58 ± 0.0 a4.27 ± 0.03 b
Ellagic acid6.72 ± 0.05 a14.84 ± 0.05 b
Rutin3.05 ± 0.07 a6.12 ± 0.04 b
Ferulic acid1.41 ± 0.03 a2.20 ± 0.07 b
Diosmin36.71 ± 13.27 a111.67 ± 0.12 b
Total98.4 ± 13.19 a163 ± 0.04 b
Different superscript letters within different column denote significant difference at p-value < 0.05 by least square design (LSD). All values are the mean of two replications.
Table 3. Mass spectrometer (MS) parameters of phenolic compounds.
CompoundsUV Spectra (nm)MS (m/z) 1Structural Formula *
Chlorogenic acid244.6, 325.6[M-H] 353.04 (72.9), 190.94 (100) Agronomy 08 00170 i001
Caffeic acid239.9, 324.4[M-H] 178.91 (58.6), 134.85 (100.0) Agronomy 08 00170 i002
Ellagic acid243.3, 367.3[M-H] 300.99 (100) Agronomy 08 00170 i003
Ferulic acid217.34, 322.34[M-H] 193.03 (100), 179.00 (1.50) Agronomy 08 00170 i004
Diosmin251.7, 346.6[M-H] 607.18 (100.0), 299.05 (18.0), 283.28 (18.7), 255.29 (25.6) Agronomy 08 00170 i005
Rutin255.34, 354.34[M-H]611.28 (1.97), 610.23 (8.88), 609.18 (34.46), 516.41 (2.05) Agronomy 08 00170 i006
1 Negative electrospray ionization mode (ESI). * Structural formula was obtained by using ChemDraw Prime free software.

