Article

Yields, Soil Health and Farm Profits under a Rice-Wheat System: Long-Term Effect of Fertilizers and Organic Manures Applied Alone and in Combination

1
ICAR-Indian Agricultural Research Institute, New Delhi-110 012, India
2
ICAR-Indian Institute of Farming Systems Research, Modipuram-250 110, India
3
ICAR-Indian Institute of Soil Science, Bhopal-462 038, India
4
Soils and Environment Research Group, Faculty of Veterinary and Agricultural Sciences, University of Melbourne, Victoria 3010, Australia
5
International Plant Nutrition Institute, Gurgaon-122001, India
*
Author to whom correspondence should be addressed.
Agronomy 2019, 9(1), 1; https://doi.org/10.3390/agronomy9010001
Submission received: 21 October 2018 / Revised: 9 December 2018 / Accepted: 12 December 2018 / Published: 20 December 2018
(This article belongs to the Special Issue Fertilizer Application on Crop Yield)

Abstract

:
The rice-wheat system (RWS), managed over 10.5 Mha in the Indo-Gangetic Plains of India suffers from production fatigue caused by declining soil organic matter, multi-nutrient deficiencies and diminishing factor productivity. We, therefore, conducted a long-term field experiment (1998–1999 to 2017–2018) in Modipuram, India to study the effect of continuous use of farmyard manure (FYM) as an organic fertilizer (OF), mineral fertilizers applied alone (RDF) and their combination (IPNS), as well as the inclusion of forage berseem (IPNS+B) or forage cowpea (IPNS+C) on crop yield, soil health and profits. The long-term yield trends were positive (p < 0.05) in all treatments except the control (unfertilized) in rice, and the control and RDF in wheat. Although the yields of rice, wheat and RWS were highest under IPNS treatments (IPNS, IPNS+B, IPNS+C), the maximum annual yield increase in rice (9.2%) and wheat (13.7%) was obtained under OF. A linear regression fitted to the yield data under different IPNS options revealed a highly significant (p < 0.001) annual yield increase in rice (5.1 to 6.6%) and wheat (6.8 to 7.7%) crops. Continuous rice-wheat cropping with RDF brought an increase in soil bulk density (Db) over the initial Db at different soil profile depths, more so at depths of 30–45 cm, but inclusion of forage cowpea or berseem in every third year (IPNS+B or C) helped to decrease Db, not only in surface (0–15 cm) but also in sub-surface (15–30 and 30–45 cm depth) soil. Whereas soil organic carbon (SOC) increased under OF, IPNS and IPNS + legume (B or C) treatments, it remained unaffected under RDF after 20 RW cycles. The inclusion of legumes along with IPNS not only helped to trap the NO3–N from soil layers below 45 cm but also increased its retention in the upper soil (0–15 cm depth). On the other hand, RDF had a higher NO3–N content in the lower layers (beyond 45 cm depth), indicating downward NO3–N leaching beyond the root zone. A build-up of Olsen-P was noticed under RDF at different time intervals. The soil exchangeable K and available S contents were maximal under OF and IPNS options, whereas a decline in DTPA extractable-Zn was recorded under OF. Overall, RWS economics revealed that OF treatment involved the maximum cost of cultivation (US$1174 ha−1) with the least economic net return (US$1211 ha−1). Conversely, IPNS + legume (B or C) had lowest cost of cultivation (US$707 to 765 ha−1) and a significantly higher (p < 0.05) net return (US$2233 to 2260 ha−1). The study, thus, underlines the superiority of IPNS over RDF or OF; the inclusion of legumes gives an added advantage in terms of production sustainability and soil health. Further studies involving IPNS ingredients other than FYM is needed to develop location-specific IPNS recommendations.

1. Introduction

The rice (Oryza sativa L.)-wheat (Triticum aestivum L.) system (RWS) occupying around 13.5 million hectares area in South Asia is the spine of social and economic growth of millions of people [1,2]. The RWS remains the mainstay of cereal production by contributing 23% of food grains [3]. However, the system has begun to show signs of fatigue with yield plateau and soil health decline. Moreover, the differential ecological requirement for more than 10 Mha of agricultural area in India [4], where these crops are grown in sequence, makes the system complex, and the maintenance of sustainability remains a challenge as well as a necessity [5]. The sustainability of the system has been questioned due to yield stagnation, soil health deterioration and poor carbon and water footprints in the environment for more than two decades now [6,7]. Further, the low system diversity results in the associated problems of multi-nutrient deficiencies, higher insect-pest and disease insurgence, and infestation of some noxious weeds. The input-intensive nature of this system makes it less profitable under the ever-diminishing natural resources such as the declining water table and poor soil fertility [8]. Although there are limited options for the diversification of RWS, its productivity ought to rise with the increasing demographic pressure.
Ladha et al., (2003) [9] reviewed 33 years of long-term experiments (LTEs) and observed yield stagnation in rice and wheat in 72% and 85% of the LTEs, respectively, with the application of recommended rates of N, P and K, whereas 22% and 6% of the LTEs showed significant declining trends for rice and wheat yields, respectively. The decadal yield trend analysis also revealed that the RWS have not only suffered productivity stagnation but have also undergone a depletion of inherent nutrients and a reduction in the quantity and quality of organic matter [10]. The soil organic C (SOC) content in LTEs in the major RWS growing areas of Northwestern India decreased sharply under unbalanced fertilizer input [11].
In an intensive RWS, nutrient removal often exceeds replenishment through fertilizers [12,13,14,15,16]. LTEs continuing under diverse agro-ecologies in India underlined that neither the fertilizers nor the organic sources in isolation can achieve sustainable production. The superiority of the combined use of these nutrient sources over their sole application is well-documented [6,17]. Nutrient management strategies thus have an over-riding impact on RWS production through alterations of soil resilience, responsiveness and receptiveness. The nutrient management strategies for this economically and socially important cropping system should ensure optimum plant nutrient supply and desired crop productivity while sustaining or improving soil fertility. The benefits of the use of fertilizers have been documented [18,19], yet the timely availability of cheaper or subsidised fertilizers and lack of options for providing all the limiting nutrients in the right proportions and in the right amounts often prevents their use as a complete nutrient package [20]. The integrated plant nutrient supply system (IPNS), which involves applying the traditionally used organic nutrient sources in conjunction with fertilizers, provides a plant-demand synchronized and slow-release nutrient input to maintain a continuous nutrient supply, preventing losses and ensuring efficient utilization of the applied nutrients [21]. With IPNS, organic manures along with fertilizers serve as a labile source and an immediate sink of C, N, P and S in the soils which improves crop productivity, organic carbon, and soil fertility status [22]. The long-term application of organic manures alone in the form of well-rotten and good quality farmyard manure (FYM) has been reported to make nutrients available gradually, in synchrony with plant needs. Besides improving the physico-chemical properties of soil, the application of organic manures can also increase productivity while maintaining a better energy and environmental balance [23]. Nonetheless, low and variable nutrient contents, scarce availability and problems associated with handling and storage of organic manures are the major constraints in their large-scale usage [19].
However, the inclusion of legumes, especially forage legumes, as a break crop during the third or fourth cycle can benefit RWS without impairing the food security [14]. Besides providing the green fodder for cattle, there is evidence that a forage legume crop can fix 35–120 kg N ha−1 in the current season with a carryover effect ranging between 35–60 kg N ha−1 for the succeeding crop [16,24,25]. The inclusion of a legume crop in RWS adds N through biological N fixation, recycles nutrients from the deeper soil layers, minimizes soil compaction, increases soil organic matter, breaks weed and pest cycles and minimizes harmful allelopathic effects [26,27]. However, the effects of fertilizers and IPNS vis-à-vis sole organic input and the substitution of main crop with a forage legume as a break crop at 2–3 year intervals, have rarely been studied in intensively cultivated RWS. Also, the limited information on the use of sole organics in RWS makes it difficult to compare different nutrient management options. Such comparisons are, however, essentially required to aid in the understanding of the effects of different nutrient supply options on soil health and crop productivity and to formulate optimum recommendations to attain sustainability of this important cropping system.
Against this background, the present long-term experiment was conducted to study the effects of continuous application of distinct nutrient supply and crop diversification options viz. organics and fertilizers applied alone or in combination as well as the effect of the inclusion of forage legumes on crop yield, soil health and farm profits under RWS.

2. Materials and Methods

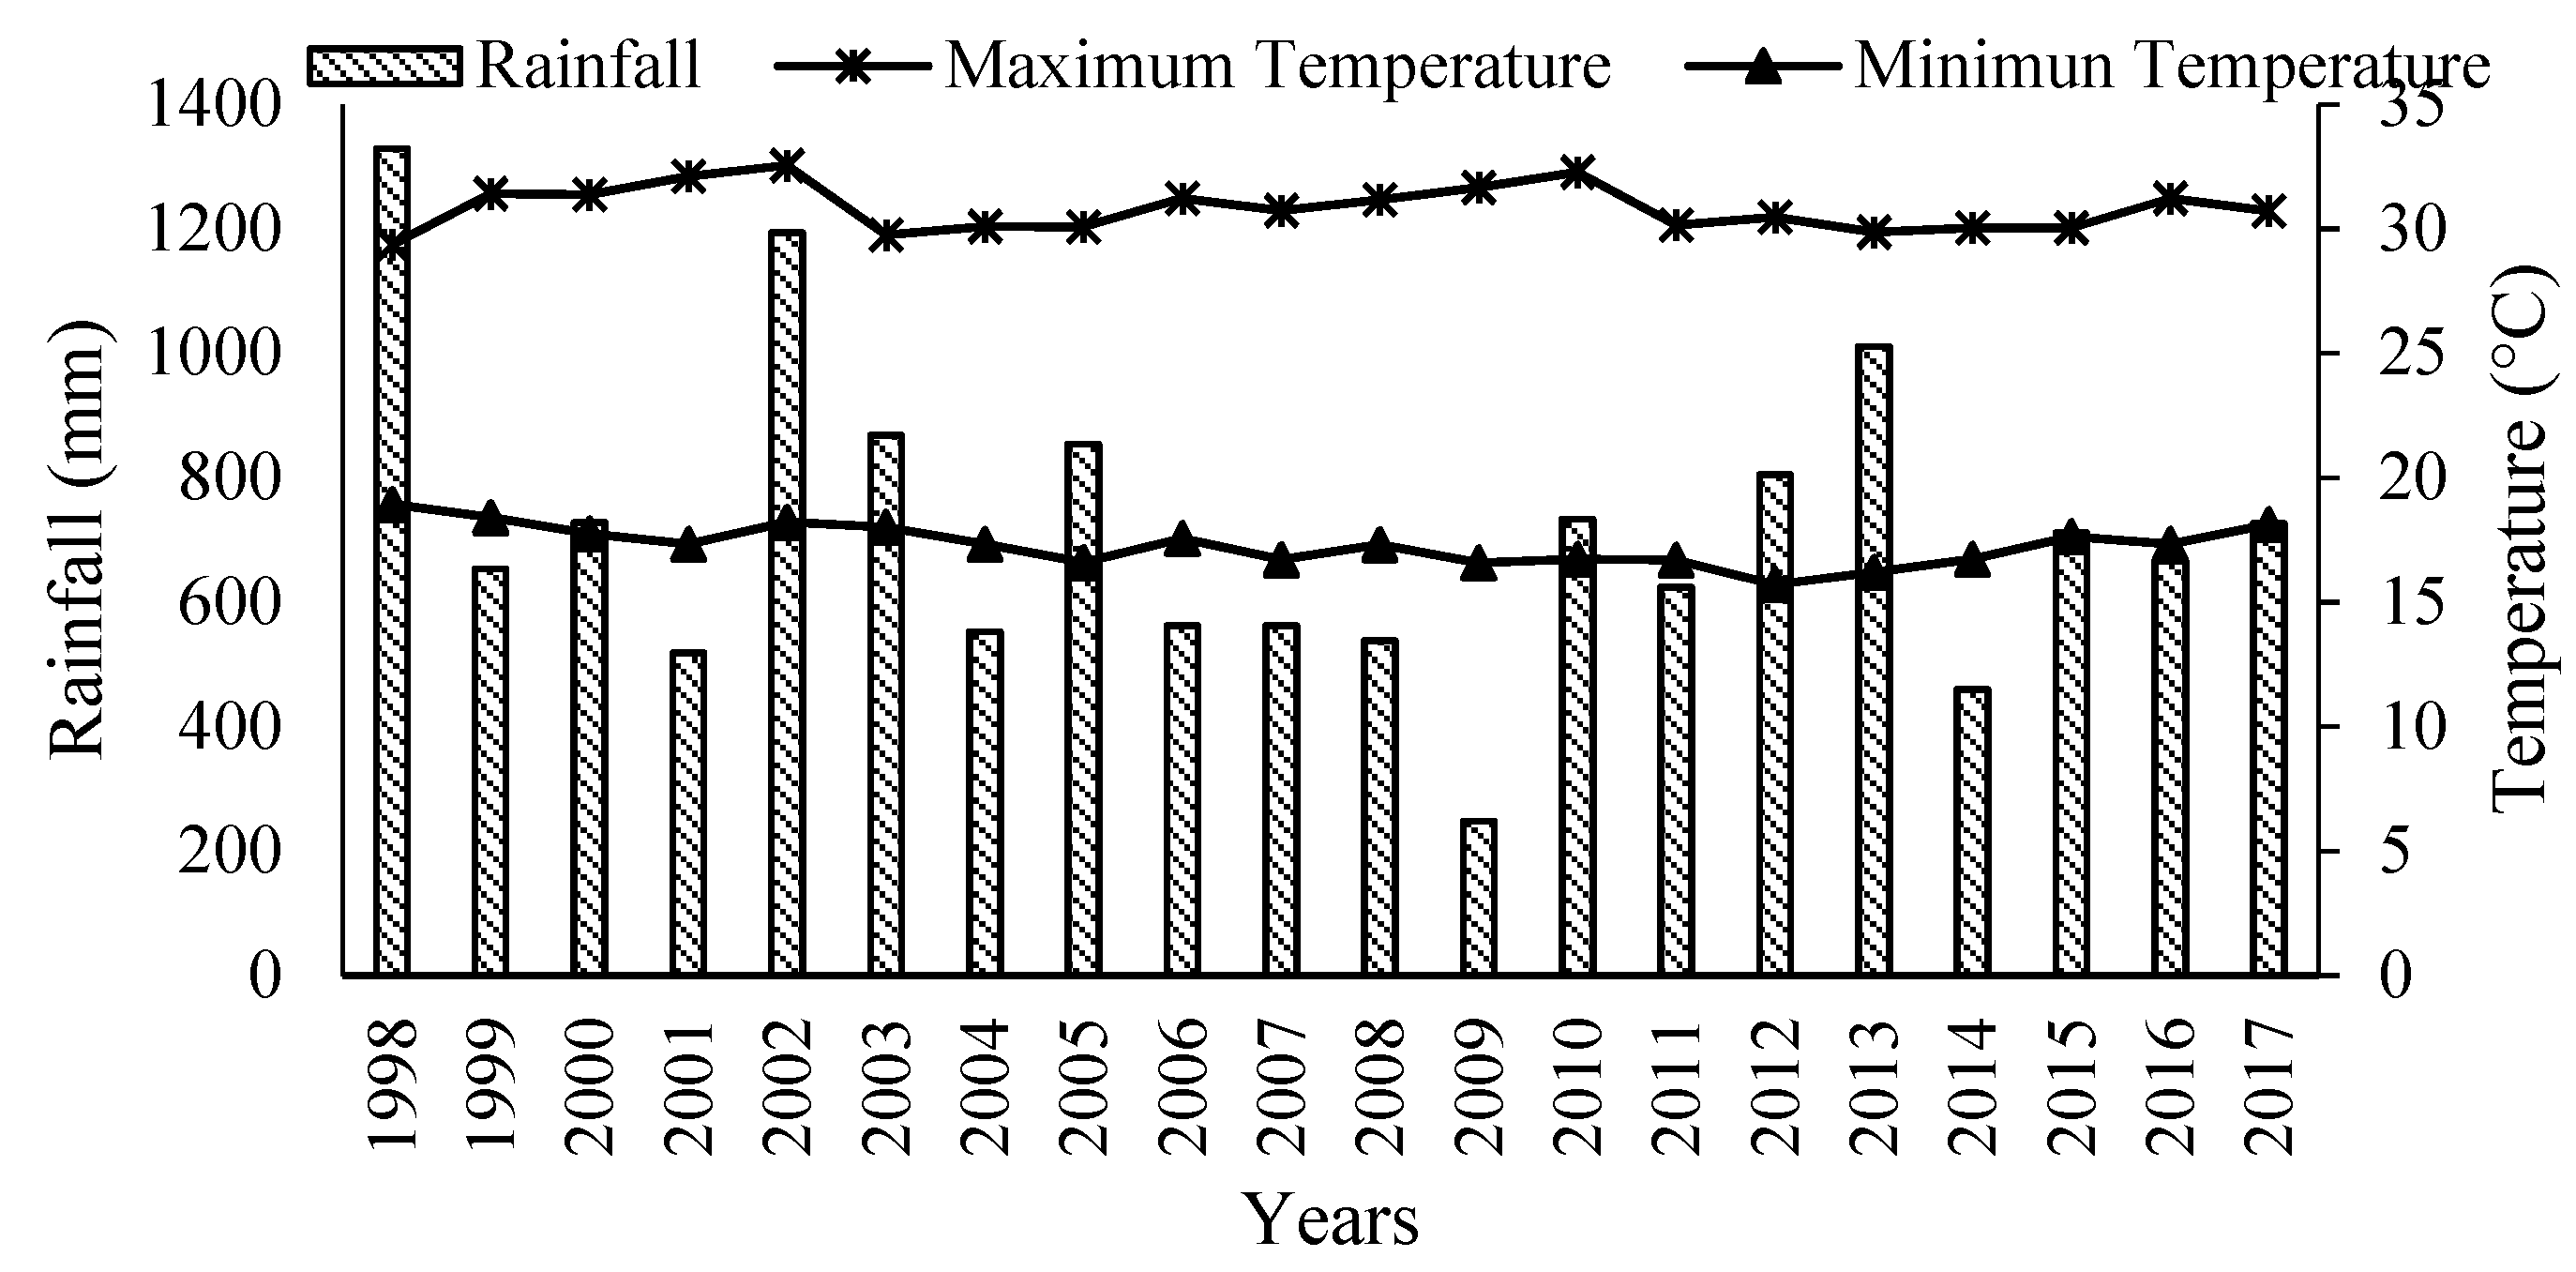
2.1. The Experimental Site

A long-term field experiment was established during the monsoon season of 1998–1999 and continued for twenty consecutive years, i.e., up until 2017–2018, on Typic Ustocrept soil of the Research Farm of the Indian Institute of Farming Systems Research, Modipuram, Meerut to study the changes in yield, soil health and farm profits of rice and wheat grown in sequence with different nutrient management and crop diversification options. Modipuram (29°4′ N, 77°46′ E, 237 m above sea level), located in the Western part of Uttar Pradesh, represents an irrigated, mechanised and input-intensive cropping area of the Upper Gangetic Plain (UGP) transect of the Indo-Gangetic Plain (IGP). The climate of the experimental site is semi-arid sub-tropical, with dry hot summers and cold winters. The long-term average annual rainfall is 807 mm, and nearly 80% of the total rainfall is received through northwest monsoons from July to September. The year-wise variations in temperature and rainfall are illustrated in Figure 1. Apparently, there were no remarkable changes in these weather parameters over the years of experimentation.
Nonetheless, the average monthly minimum temperatures fluctuated from 4.5 to 7.8 °C in January (the coolest month) and from 23.7 to 25.4 °C in May (the hottest month). The respective maximum temperatures ranged from 15.7 to 23.4 °C in January and 37.1 to 42.9 °C in May. The soil at the long-term experimental site was sandy loam (17.8% clay, 19.3% silt and 62.9% sand) of Gangetic alluvial origin, which was very deep (>20 m), well-drained, and flat (about 1% slope), representing one of the most extensive soil series, i.e., the Sobhapur series of northwest India.
Data on the initial soil characteristics of the surface soil (0–15 cm depth) measured at the onset of the experiment in 1998–1999 revealed that the soil was mildly alkaline (pH 8.1) and non-saline (electrical conductivity (EC) 0.11 dSm−1) and contained 5.1 g kg−1 Walkley and Black carbon (WBC), 8.3 mg kg−1 Olsen (0.05 M NaHCO3-extractable) P, 74.1 mg kg−1 exchangeable (1 M ammonium acetate-extractable) K, 14.3 mg kg−1 available (0.15% CaCl2-extractable) S and 0.54 mg kg−1 of DTPA-extractable Zn. The important physico-chemical characteristics of the soil at commencement of the experiment are presented in Table 1. Prior to establishment of the long-term experiment, the site was managed under a sugarcane–ratoon–wheat cropping system, with an intermittent rice (puddled–transplanted)–wheat system.

2.2. Treatments and Crop Culture

The long-term experiment comprised six treatments involving the following nutrient management options: control (no-fertilizer), FYM as the sole organic fertilizer (OF), recommended doses of fertilizers (RDF) alone, combination of FYM and fertilizers (IPNS), and IPNS with cowpea (Vigna ungiculata L.) (IPNS+C) and berseem (Trifolium alexandrinum L.) (IPNS+B) as a break crop introduced every third year. These were evaluated on a permanent (undisturbed) layout with a randomised block design (Table 2). The experiment was established as a randomised block design with four replications.
The plot size was 25 m × 10 m. The recommended NPK rates of 120 kg ha−1 N, 26 kg ha−1 P and 33 kg ha−1 K for both rice and wheat crops were applied through urea (46.4% N), diammonium phosphate (DAP, 18% N and 20.09% P) and muriate of potash (MOP, 49.6% K), respectively. Apart from the control and OF plots, 5 kg ha−1 Zn was applied through zinc sulfate (33% Zn) to rice in all treatments. One-third of the N and the entire quantity of P, K and Zn were applied as basal doses to each treatment, except OF at the time of transplanting or sowing, and the remaining N was top-dressed in two equal portions at the maximum tillering stage and at panicle or ear emergence. The quantity of FYM was predetermined on the basis of the N content. The average composition of FYM was C (%) 29.8 ± 6.2, N (%) 0.72 ± 0.13, P (%) 0.26 ± 0.08, K (%) 0.51 ± 0.18, S (%) 0.16 ± 0.05 and a C: N ratio of 6.2. Thus, the quantity of FYM used annually in the IPNS and OF treatments averaged 4.2 and 16.8 t ha−1, respectively. FYM was incorporated into the soil 1 week before the transplantation or sowing of crops.
Each year, 25-day-old rice seedlings (cv. PD 4/PR 106/PR112) were transplanted manually at intervals of 15 cm in rows spaced at 20 cm in puddled plots during the first week of July. After rice harvesting, wheat (cv. UP 2338/ PBW 343/ HD 2967) was sown in rows spaced at 20 cm intervals during the third week of November. All crops were grown under assured irrigated conditions, and chemical weed control was used to maintain almost completely weed-free conditions in the different treatments, except for the OF plots wherein weeds were managed through manual weeding. Need-based spot-weeding was also done in other treatments at 60 days after rice transplantation/wheat sowing depending on weed intensity, despite chemical weed control. Crops were harvested manually using sickle just above the ground level, and the above ground biomass was removed from the plots. The treatments involving cowpea in place of rice (IPNS+C) and berseem in place of wheat (IPNS+B) were sown during first week of July and second week of November during every third rice-wheat cycle. Forage cowpea was harvested manually at the maximum vegetative growth stage, whereas four cuttings of berseem were taken, and green biomass was removed from the plots.

2.3. Soil Sampling and Analysis

Soil samples were collected from a profile depth of 0–75 cm at 15-cm depth intervals from four places in the experimental field using a core sampler of 8 cm diameter before commencement of the experiment in 1998–1999. The post-wheat harvest soil samples (profile depth of 0–105 cm at 15-cm depth intervals) were drawn following the same procedure after completion of every fifth crop cycle at wheat harvest (2002–2003, 2007–2008, 2012–2013 and 2017–2018) in each treatment. The sub-samples obtained were mixed and bulked, and representative soil samples for each depth were drawn for chemical analysis. The initial and post-harvest soil samples were pulverized using a wooden pestle-mortar and sieved through a 2 mm sieve. The processed samples were analysed for mineral N content [28] at all sampled depths and organic carbon [29], Olsen P (0.5 M NaHCO3, pH 8.5 extractable) [30], exchangeable K (1 M NH4OAc, pH 7.0 extract) [31], available S (0.15% CaCl2 extraction) [32], and DTPA-extractable Zn (DTPA-CaCl2–TEA, pH 7.3 extraction) [33] at depths of 0–15 and 15–30 cm. During 2012–2013, soils from a depth of 0–15 cm were also analysed for extractable N by the alkaline KMNO4 method [34] at 15-day intervals starting from 15 days after transplantation/sowing in rice and wheat up until 120 days into the crop period. The initial samples were also analysed for pH and electrical conductivity (1:2 soil:water suspensions) and mechanical composition (international pipette method), following standard analytical procedures [35].

2.4. Soil Bulk Density

The soil bulk density (Db) at 0–15, 15–30, 30–45, 45–60, 60–75, 75–90 and 90–105 cm depths was measured using undisturbed soil cores [36] drawn just before start of the study (1998–1999) and in the terminal year (post-wheat 2017–2018). Two cores were collected at random in each plot by placing metal cores (5 cm inner diameter) in the middle of each soil layer (i.e., 6–9, 21–24, 36–39, 51–54, 66–69, cm depth in 0–15, 15–30, 30–45, 45–60 and 60–75 cm soil layers). Bulk density was obtained from the gravimetric weights of cores and from the core volume (58.9 cm3) after oven drying for 48 h at 105 °C. The average Db of two cores collected for each layer was reported for each plot.

2.5. Economic Analysis

Partial economics based on averaged data for the final three years (2015–2016, 2016–2017 and 2017–2018) was computed by using variable costs and income from the sale of grains and straw of rice and wheat as well as berseem and cowpea fodder. The variable cost of cultivation (VCC) of rice and wheat crops included the costs involved in different operations (e.g., rice nursery raising, tillage for seed bed preparation, seeding, insect-pest and weed management, harvesting, threshing) and the inputs (seed, irrigation, fertilizers and agrochemicals and labour) used for raising the crops. The economic analysis, however, did not include the value of the land. The market price considered for different inputs was US$0.5 kg−1 of rice and wheat seed, US$1.5 kg−1 of berseem and US$0.8 kg−1 of cowpea (1US$ = Indian rupees, INR = 70.00). The cost of fertilizers was calculated on nutrient basis as, N = US$0.17 kg−1, P = US$1.99 kg−1, K = US$0.46 kg−1, Zn= US$1.21 kg−1. The cost of FYM, herbicide/insecticide and bio-pesticides use was US$14.28 t−1, US$10 ha−1 and US$ 8ha−1 application−1, respectively. Among the field operations, the cost of nursery raising was taken as US$0.035 m−2, plowing/harrowing was US$8.5 ha−1, puddling was US$20.00 ha−1, dry planking was US$10.00 ha−1, wet planking was US$17.00 ha−1, sowing of wheat using seed drill was US$25.00 ha−1 and transplantation of rice was US$45.00 ha−1. The cost of irrigation was taken as US$7 ha−1, hand weeding was US$50 ha−1, spot weeding was US$25 ha−1 insecticide/ herbicide spraying was US$8.5 ha−1 and labour was US$5.0 unit−1 day−1.
Gross returns (GR) were calculated by multiplying the grain, straw yield and green fodder by their prices. The minimum support prices (MSPs) fixed by the government for rice (US$0.18 kg−1) and wheat grain (US$0.21 kg−1) were used, whereas the price of rice straw (US$0.016 kg−1) and wheat straw (US$0.05 kg−1), respectively, and green fodder of cowpea and berseem (US$ = 0.71) were taken as the prevailing prices in local markets at the time of harvest. The net return (NR) for each crop was calculated as the GR minus the VCC. The NR of rice/cowpea was added to the NR of wheat/berseem to compute the cropping system’s net returns for each treatment in respective years. Here, we report data based on the average of the three terminal years (2015–2016, 2017–2018, 2018–2019) for economic analysis.

2.6. Statistical Analysis and Computations

In Figures 2–4, the standard error (SE ±) of the treatment means was computed as
SE = SD (√N)−1
where SD is the standard deviation of the mean, and N is the number of observations on which the mean is based.
For comparison of treatment means in the field experiments, a multivariate analysis was adapted for multiple comparison of the means, following the procedures of randomized block design [37], as shown in Tables 4–9 and Figure 5. In order to compare the treatments over the years, the yield data of the initial years (1998–1999 and 1999–2000) and final years (2016–2017 and 2017–2018) were pooled, and an analysis of variance (ANOVA) was performed (Table 4).
A least-squares linear regression of yield versus time (years) was computed for all treatments to test the hypothesis that yield trends throughout the experimentation period are not significantly different from zero. In order to understand the yield stability in rice and wheat over time, the yields of 20 years from the start of the experiment were analysed against time using a least-squares linear regression:
Y = a + bt
where Y is the grain yield (t ha−1) of rice or wheat, a is a constant, b is the slope or magnitude of the annual yield change, and t is the time (experimentation period in years).

3. Results

3.1. Effect on Rice and Wheat Yields

The application of RDF either alone or in combination with FYM (IPNS, i.e., 75% RDF + 25% N through FYM in rice and 100% RDF in wheat) significantly (p < 0.05) increased the yield of rice over the control (unfertilized) or OF during the initial years (1998–1999 and 1999–2000). The yields of rice under RDF were, however, on par (p > 0.05) with the IPNS and IPNS+B or IPNS+C (Table 3). The differences between OF and the control were not significant during the initial years (Table 3). On the other hand, yield reductions under OF as compared with RDF, IPNS, IPNS+B, IPNS+C were in the range of 2.36 to 2.53 t ha−1, during the initial years.
The average rice yields for the terminal years (2016–2017 and 2017–2018) revealed that the treatments receiving conjoint use of fertilizers and FYM, with or without inclusion of a legume, i.e., IPNS, IPNS+B or IPNS+C had significantly (p < 0.05) greater yields than those receiving RDF (Table 3). The magnitude of increase in rice yield in IPNS or IPNS+B or IPNS+C over RDF was in the range of 26% to 29% during the terminal years. Rice yield under OF was also significantly (p < 0.05) lower as compared with RDF during the terminal years.
Although the residual effects of FYM application to rice on the succeeding wheat yields were not significant (p < 0.01) over RDF during the initial years, this varied based on the use of IPNS and different organic and legume combinations during the terminal years (2016–2017 and 2017–2018). Compared with RDF, wheat yields under IPNS, IPNS+B and IPNS+C during the terminal years were greater by 64%, 72% and 73%, respectively (Table 3). Wheat yields under OF also increased with the passage of time and gave significantly (p < 0.05) higher yield gains over RDF and the control. Nonetheless, the yields under OF remained 21% to 25% lower than those of IPNS after two decades of experimentation (Table 3).
Further, a comparison of yields during the terminal years vis-à-vis the initial years (2-year average) revealed that OF had the maximum yield gain (63% in rice and 108% in wheat). This yield gain under different IPNS options during the terminal years as compared with the initial years ranged from 20% to 23% in rice and 27% to 34% in wheat in the following order: IPNS > IPNS+C > IPNS+B. After 20 years of RW cropping, changes in the system productivity under the control and RDF showed negative trends (58.1% and 9.43% decline over the initial years) whereas, system productivity gains of 83.4%, 28.2%, 27.2% and 23.6% were noticed under OF, IPNS+C, IPNS+B and IPNS, respectively (Table 4).

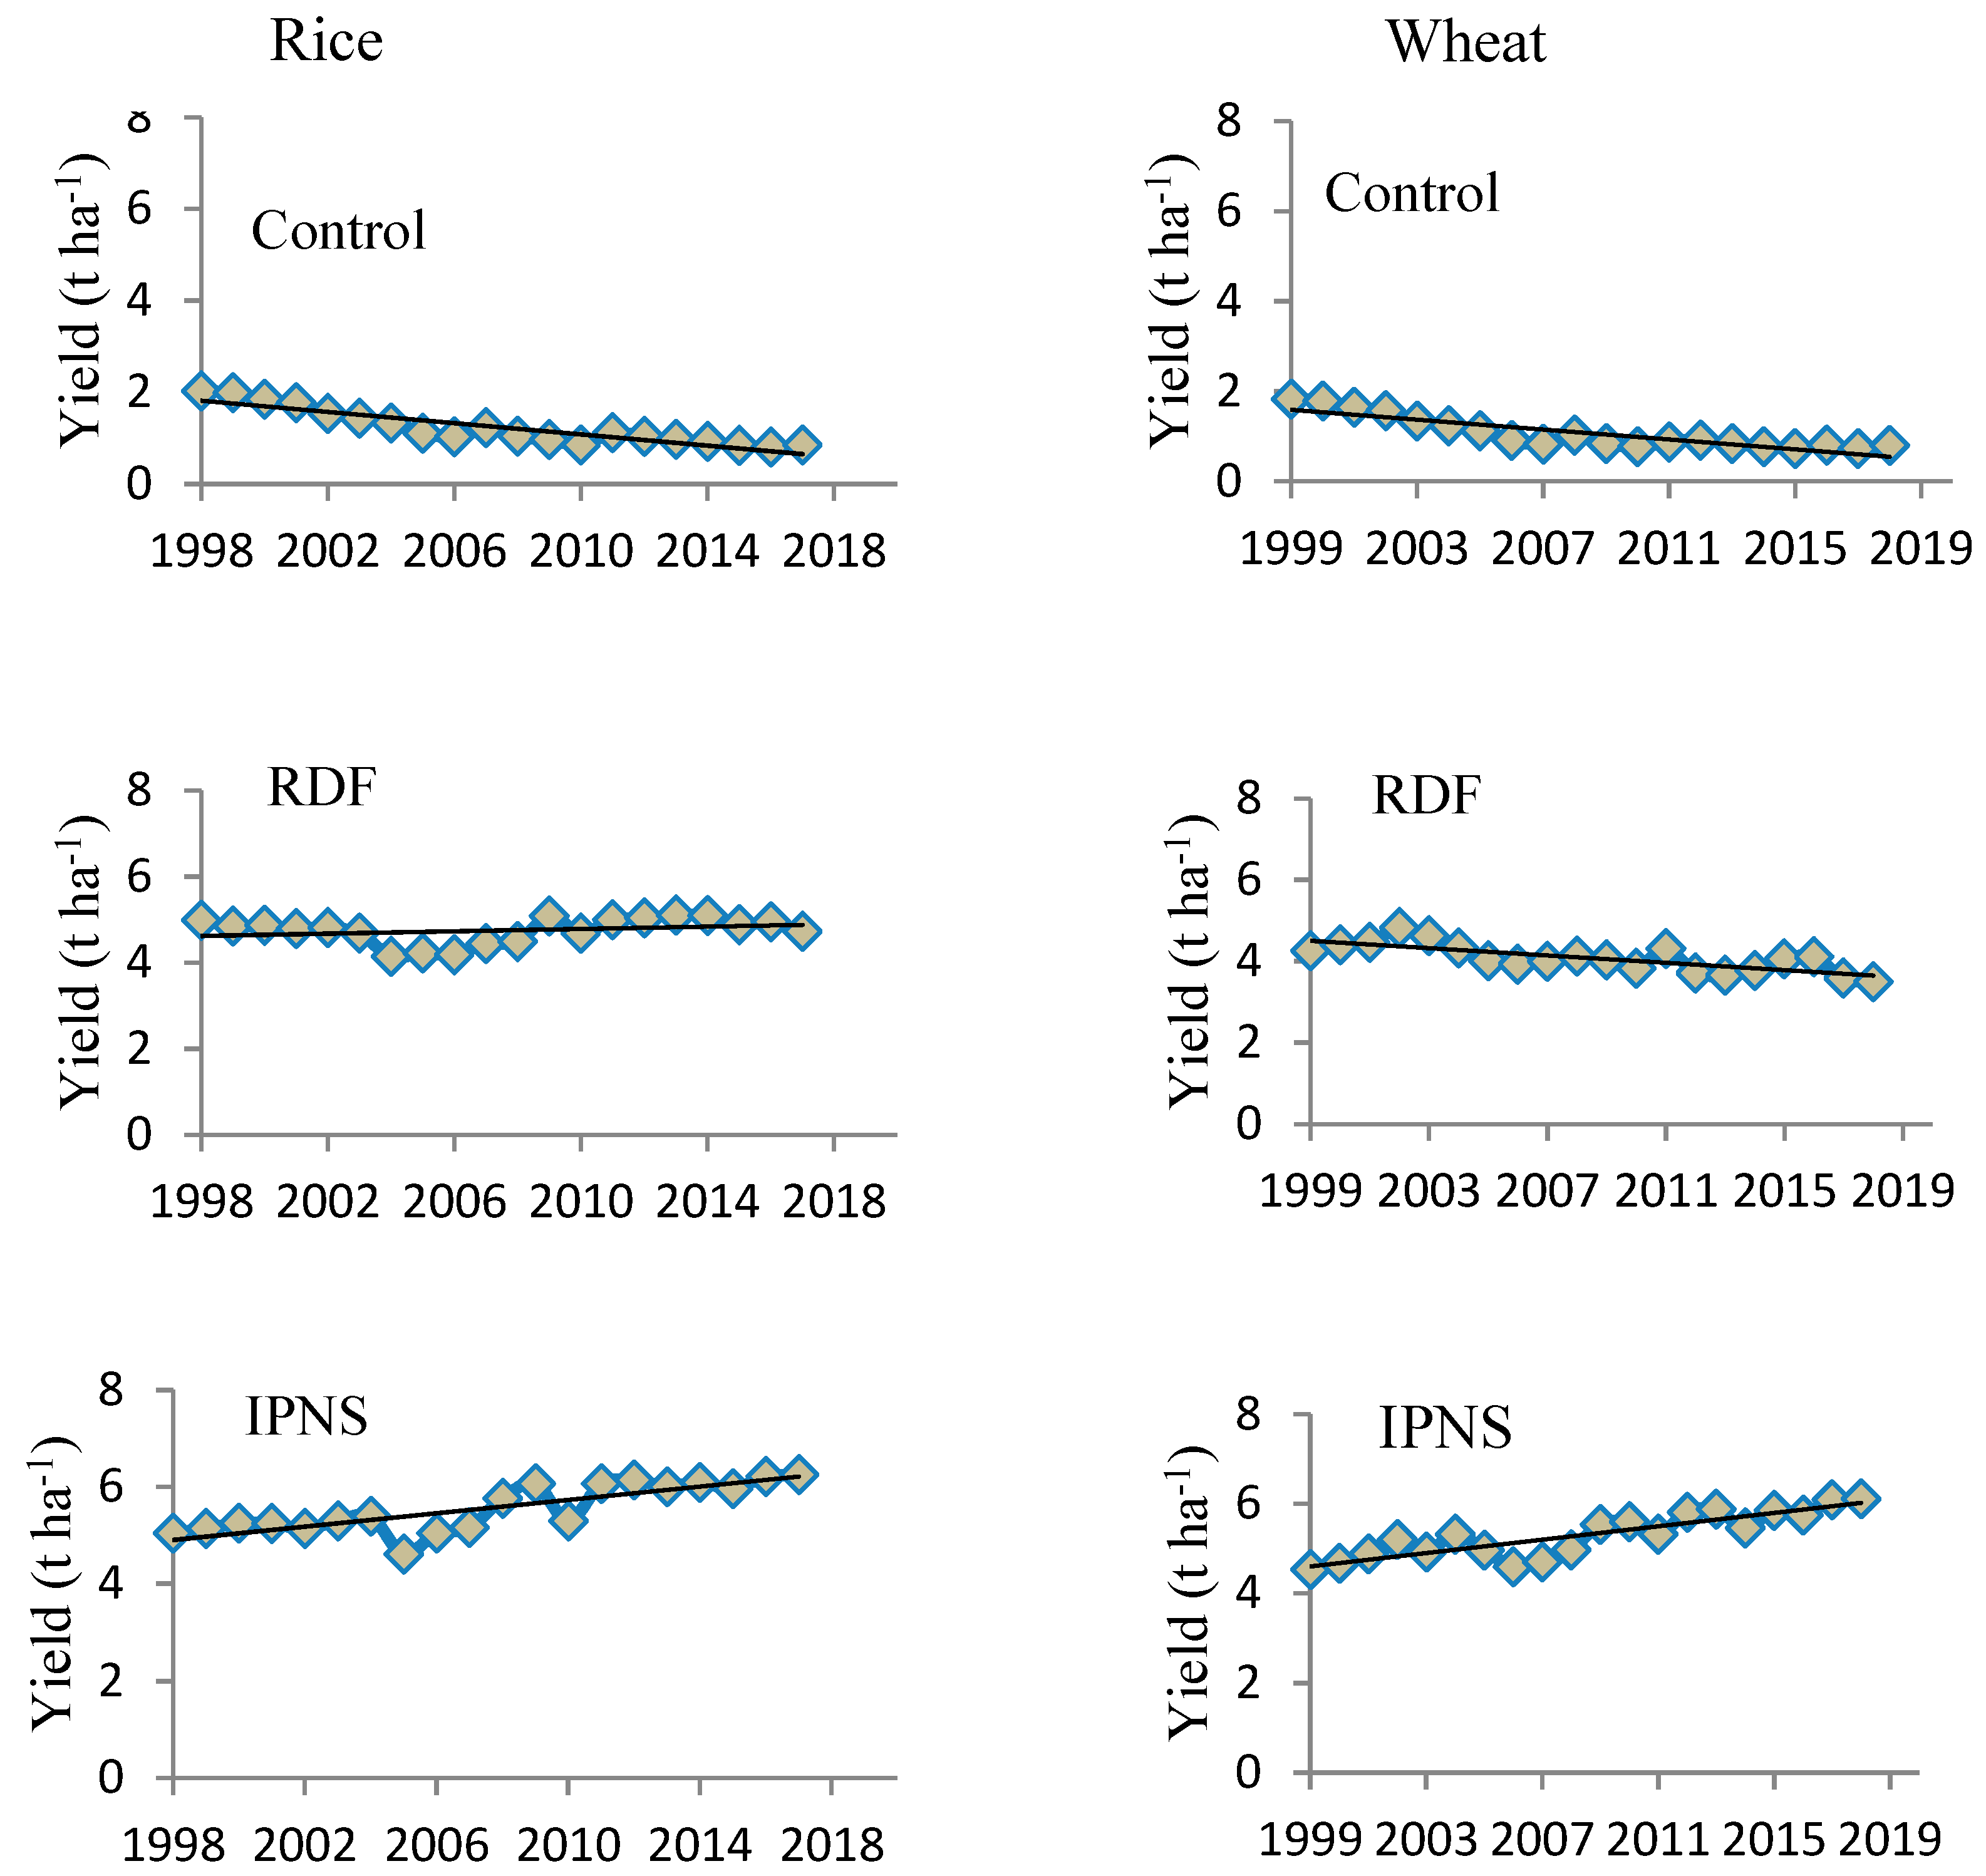
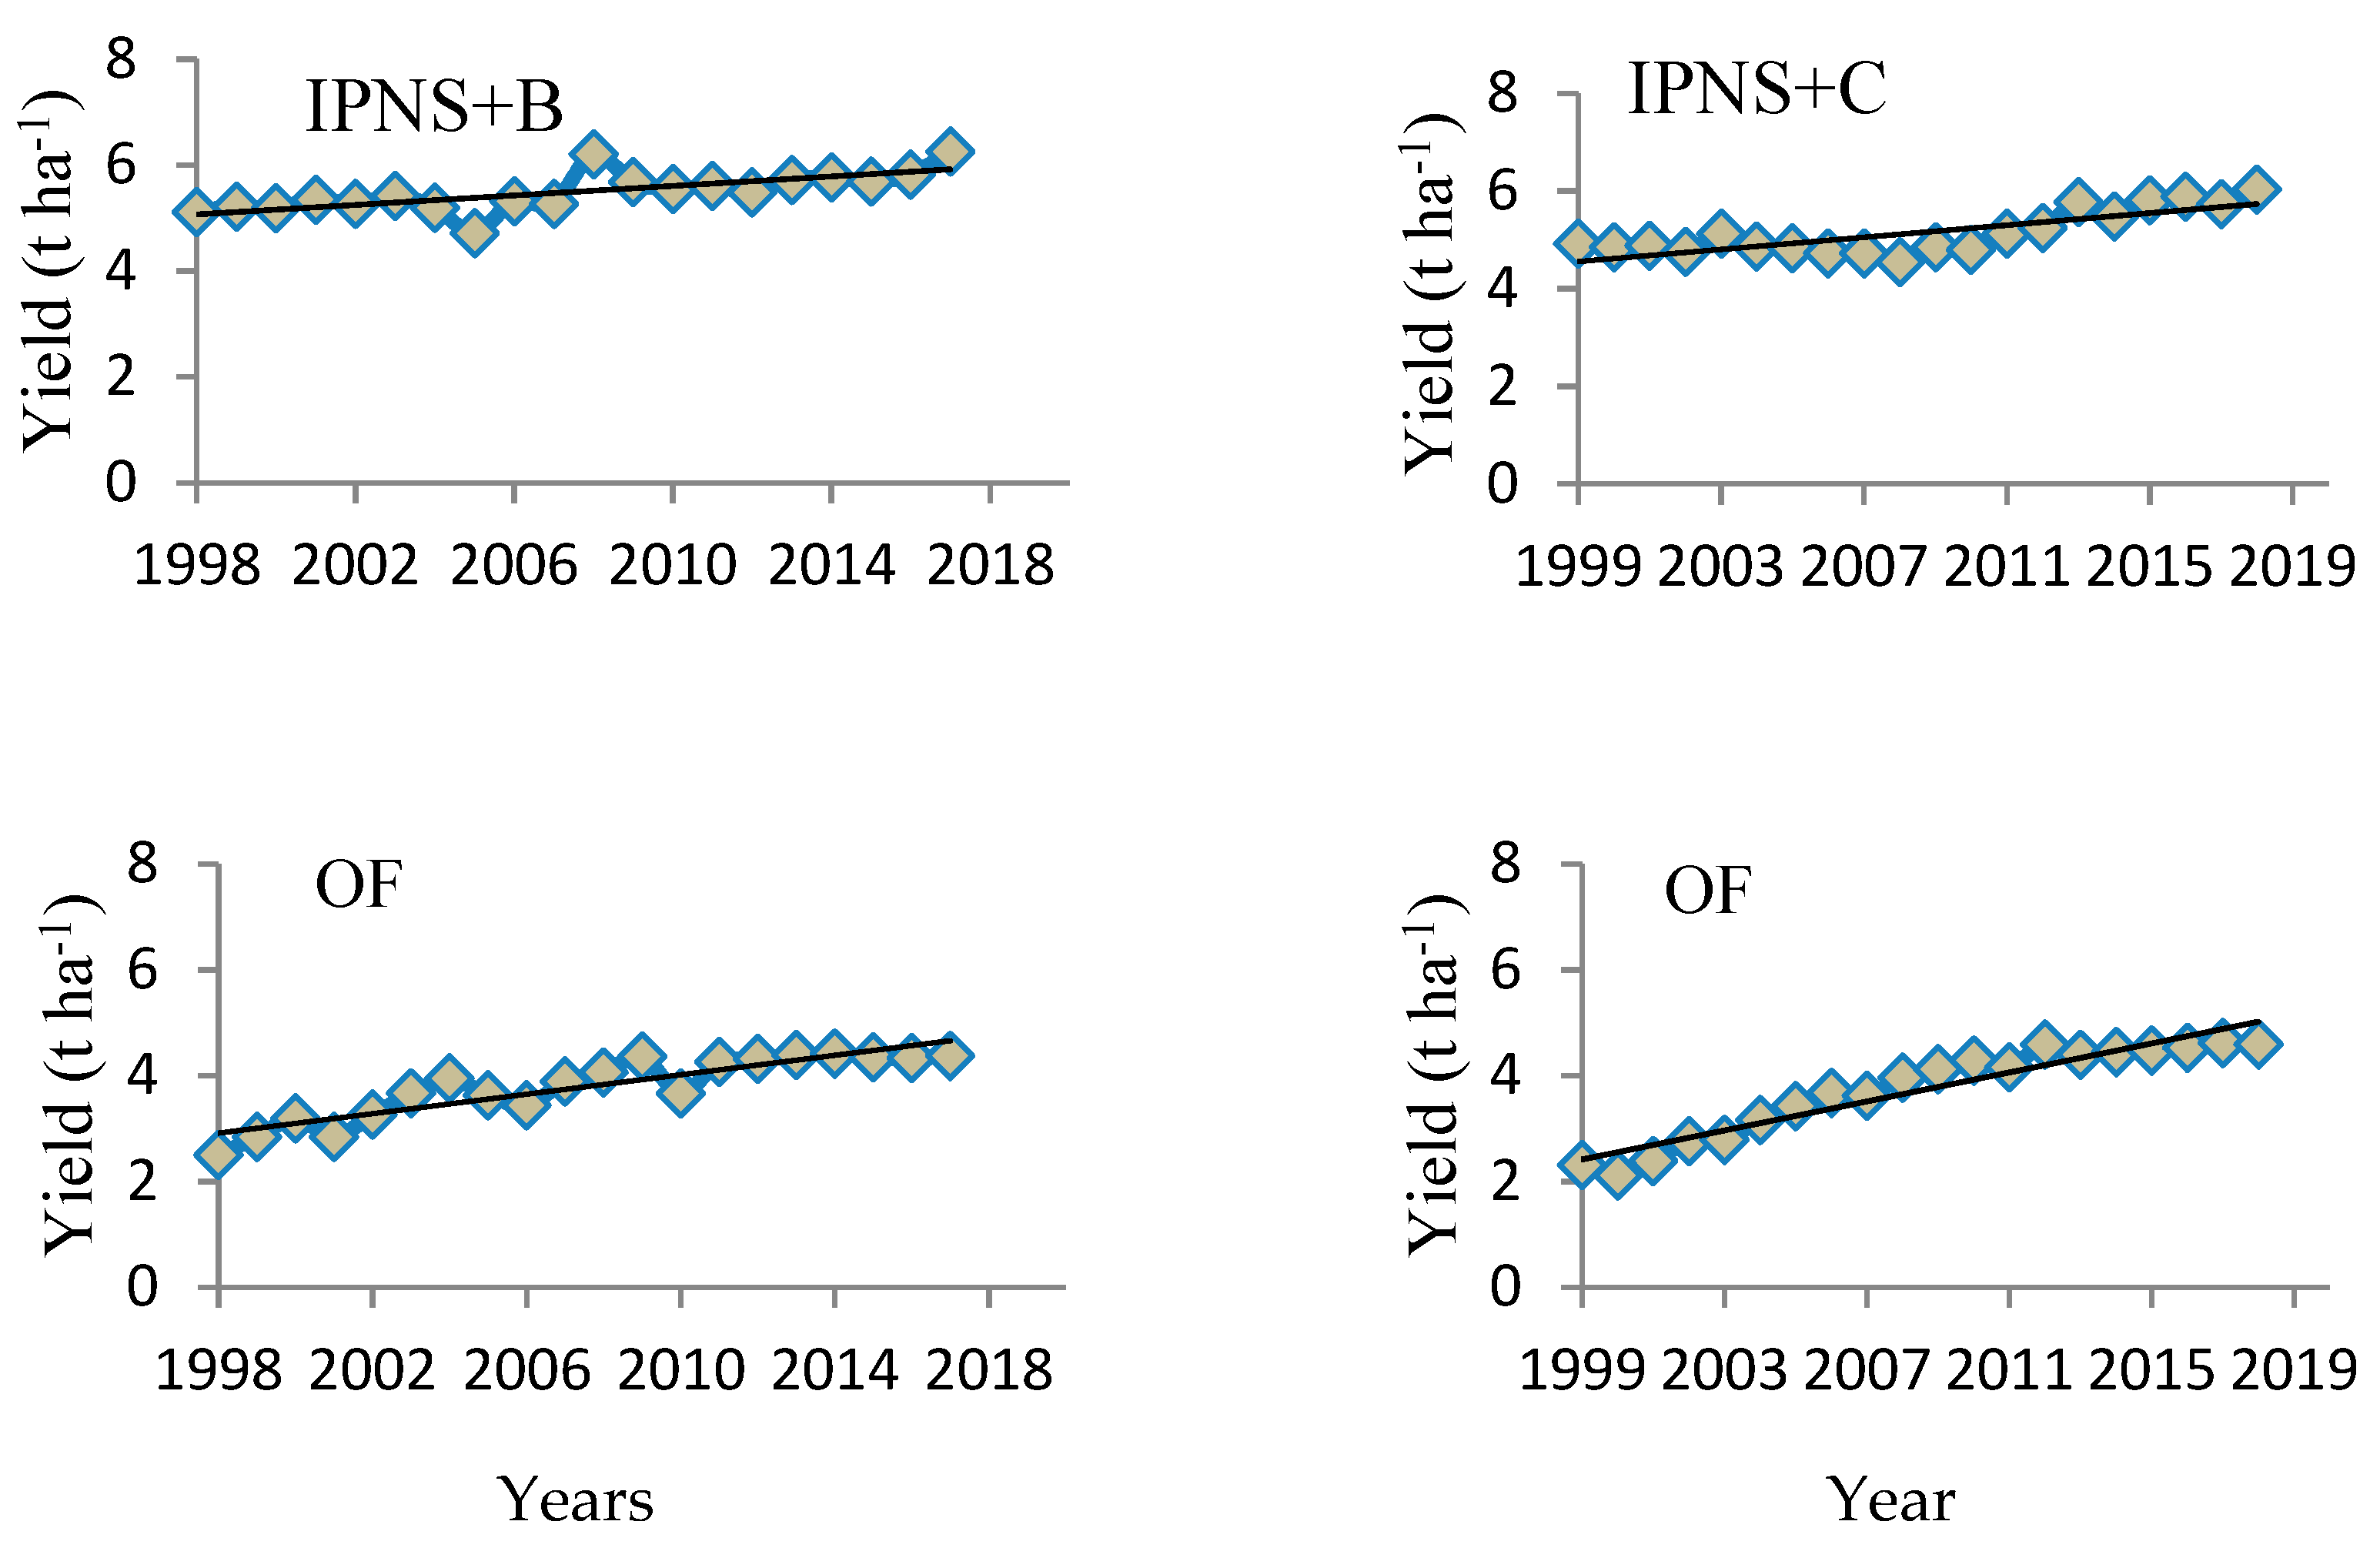
3.2. Yield Trends in Rice and Wheat

In rice, the trends in yield were positive (p < 0.001) in all treatments except for the control (Table 4, Figure 2). The annual increase was 9.2% under OF, 6.6% in IPNS, 5.1% in IPNS+B and 1.4% under RDF, which was statistically significantly different from zero (p < 0.001). Skipping fertilizer application caused a significant (p < 0.001) annual yield decline (−6.1%) during the study.
The trends in wheat yield in the control as well as RDF were negative (p < 0.001), with annual yield declines of −5.5% and −4.5%, respectively (Table 4, Figure 1). In contrast, yield trends were positive and significant (p < 0.001) in all other treatments. The maximum annual wheat yield gain (13.7%) was noticed under OF, followed by IPNS+C (7.7%) and IPNS (6.8%).

3.3. Effect on Soil Health

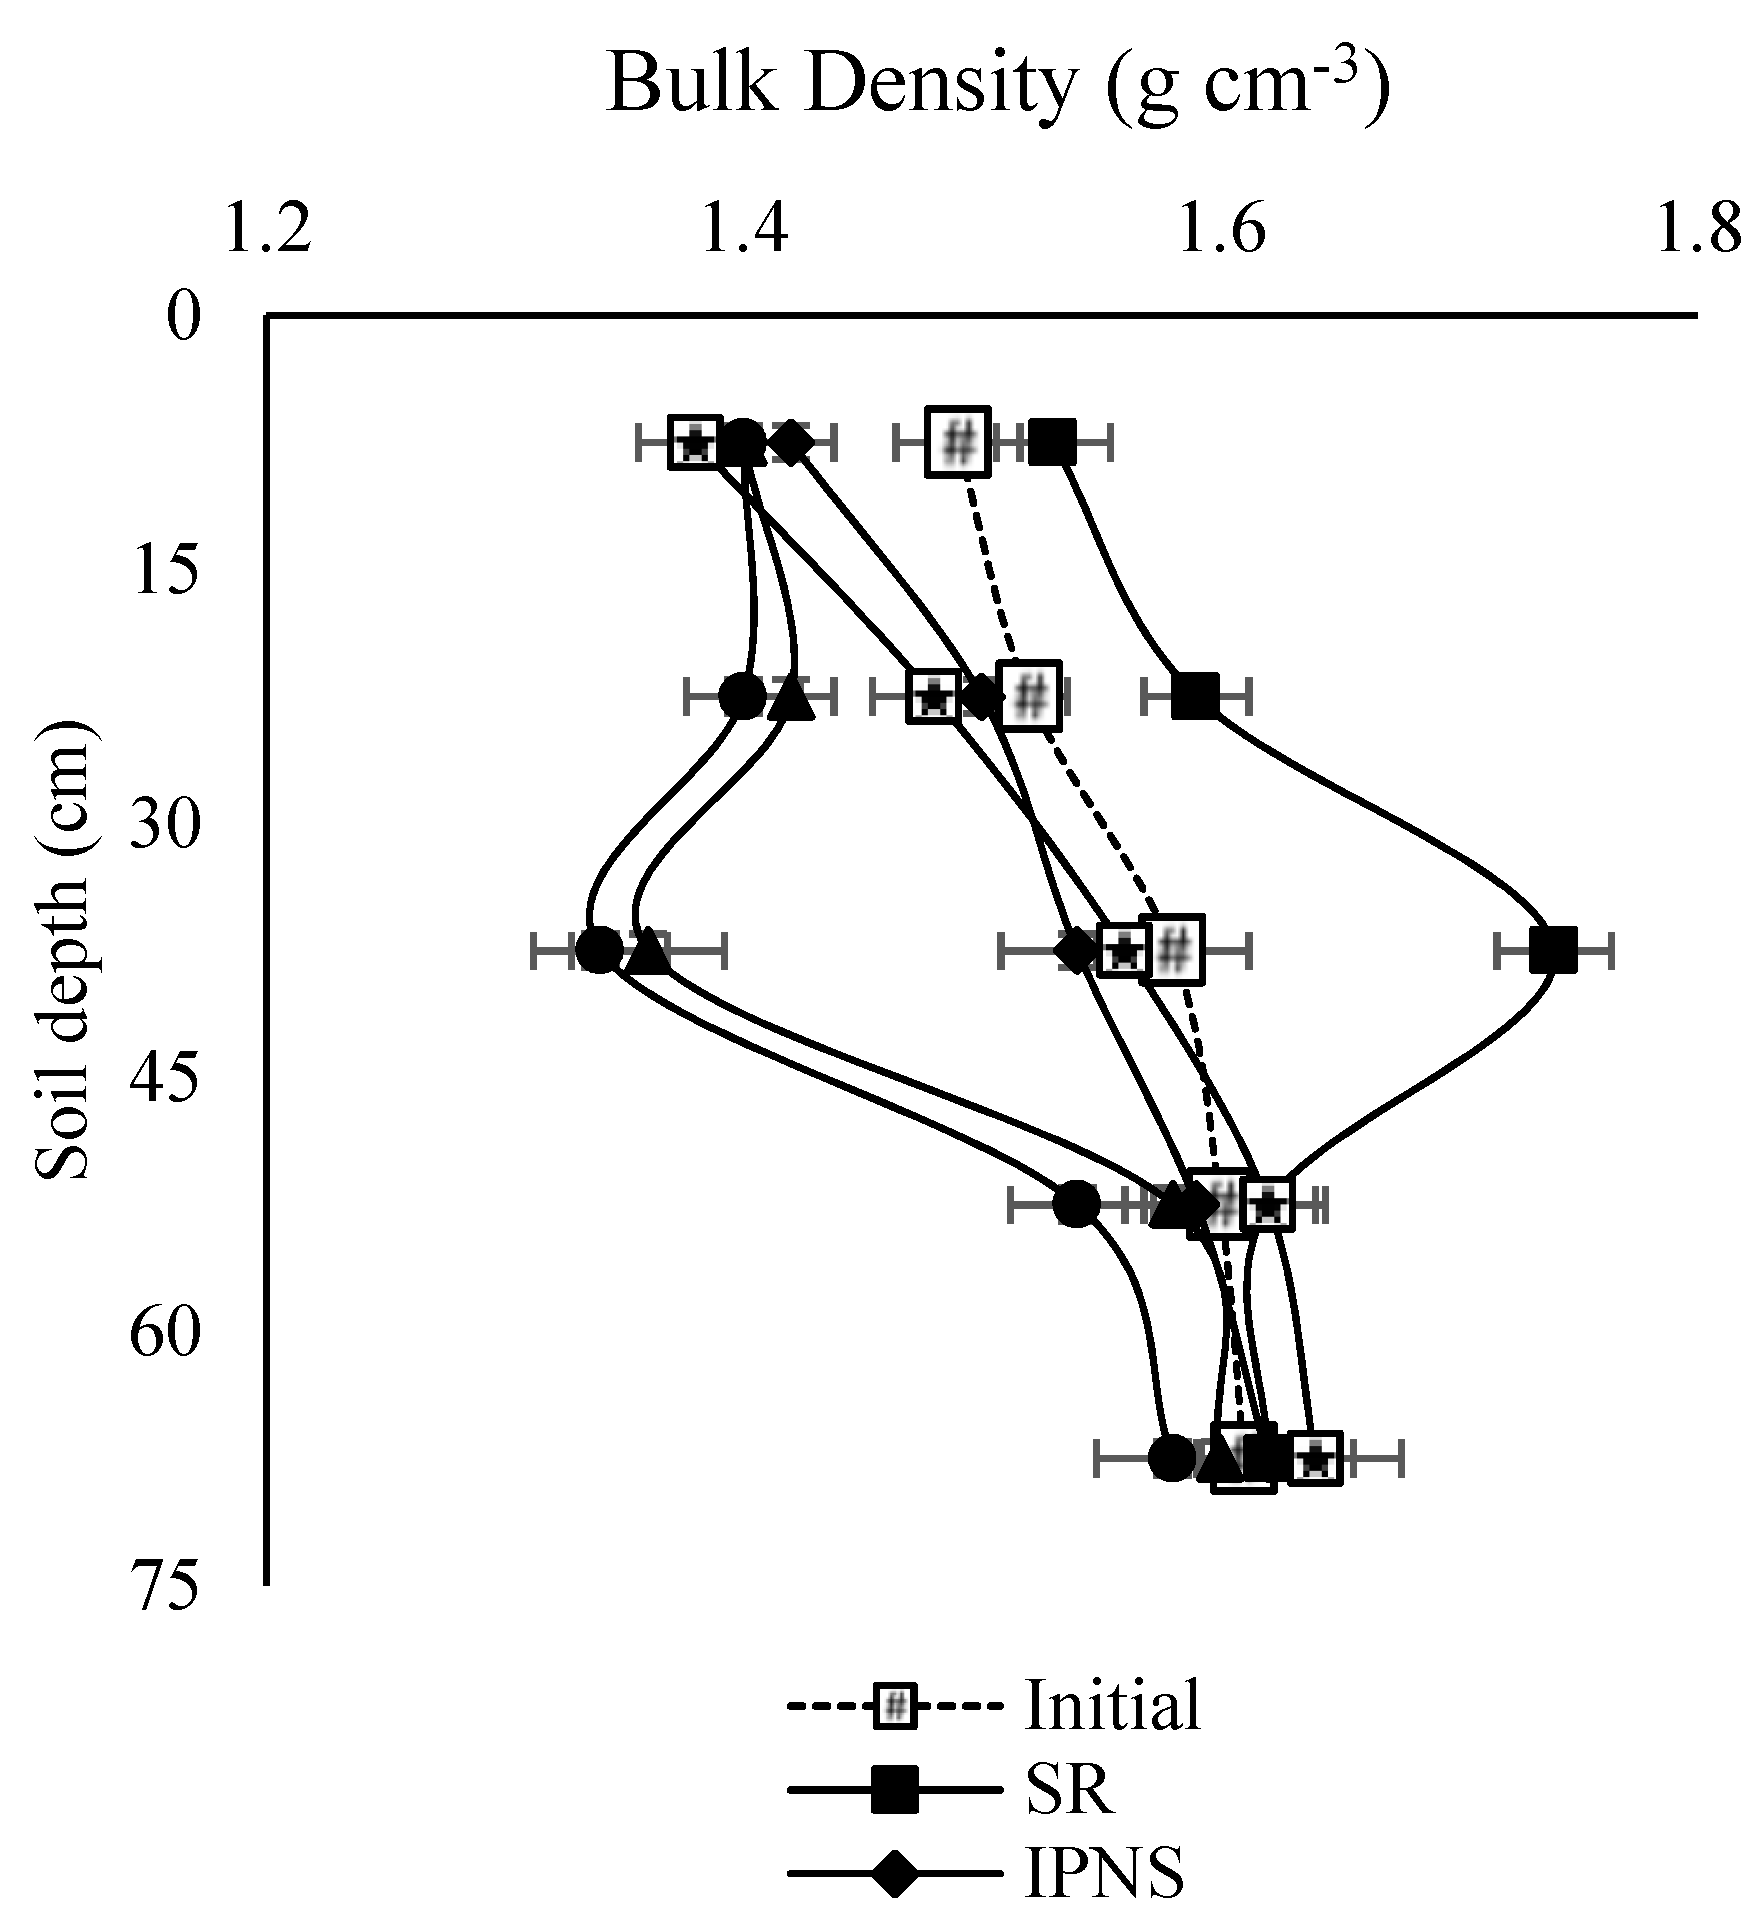
3.3.1. Soil Bulk Density

The soil bulk density (Db) of the surface layer (0–15 cm), was 1.49 ± 0.013 Mg m−3 at the onset of the experiment. It, however, increased with an increasing soil profile depth, measuring 1.61 ± 0.010 Mg m−3 at a depth of 60–75 cm (Figure 3). At the end of experimentation in 2017–2018, the RDF treatment did not influence the soil Db in the upper soil depths (0–15 cm and 15–30 cm), but the Db values at the 30–45 cm soil depth were greater (1.74 ± 0.012 Mg m−3) compared with the initial Db (1.58 ± 0.016 Mg m−3) at this depth, thereby indicating ta tendency towards sub-surface soil compaction. In the plots having IPNS with legumes as a break crop during every third year, no such compaction was noticed. The Db of soil at a profile depth of 30–45 cm was much smaller (1.36 ± 0.16 Mg m−2 and 1.34 ± 0.014 Mg m−2 in IPNS+B and IPNS+C plots, respectively) compared with the Db in RDF plots (1.74 ± 0.013 Mg m−2). Although the Db values under IPNS and OF treatments were much smaller (1.42 ± 0.018 and 1.38 ± 0.024) at the 0–15 cm depth as compared with the Db at the onset of the experiment, this did not influence values at the other soil profile depths.

3.3.2. Soil OC Content

The soil organic carbon (SOC) content measured at profile depths of 0–15 and 15–30 cm during 2002–2003, 2007–2008, 2012–2013 and 2017–2018 varied in accordance with the soil depth and with the passage of time (Table 5). In surface soil (0–15 cm depth), during 2002–2003, the SOC content was highest (5.3 g kg−1) under OF which was on par with IPNS (5.6 g kg−1) and IPNS+C or IPNS+B (5.8 g kg−1), though statistically higher (p < 0.05) than RDF (5.2 g kg−1). The SOC content increased (p < 0.05) under OF, IPNS and IPNS+B or C over the years but declined in the control plots. The SOC remained unaffected under RDF during the different years of study. During the terminal year (2017–2018), the maximum SOC (6.9 g kg−1) was noticed under OF which was significantly higher (p < 0.05) than that under IPNS (6.2 g kg−1) and IPNS+B or IPNS+C (6.4 g kg−1). The RDF and control plots had significantly (p < 0.05) lower SOC contents than the different IPNS options.
The SOC content also varied with soil depth, and a relatively lower SOC was noticed at the 15–30 cm depth (Table 5). At this soil depth, IPNS combined with legumes had a significant edge over OF in different years of the study. The SOC, measured after 20 annual RW cycles vis-à-vis the onset of the experiment, showed improvements of 6–39% and 19–74% at the 0–15 and 15–30 cm soil depths, respectively, in all treatments except for the control, wherein the SOC declined by 14–35% from its initial value.

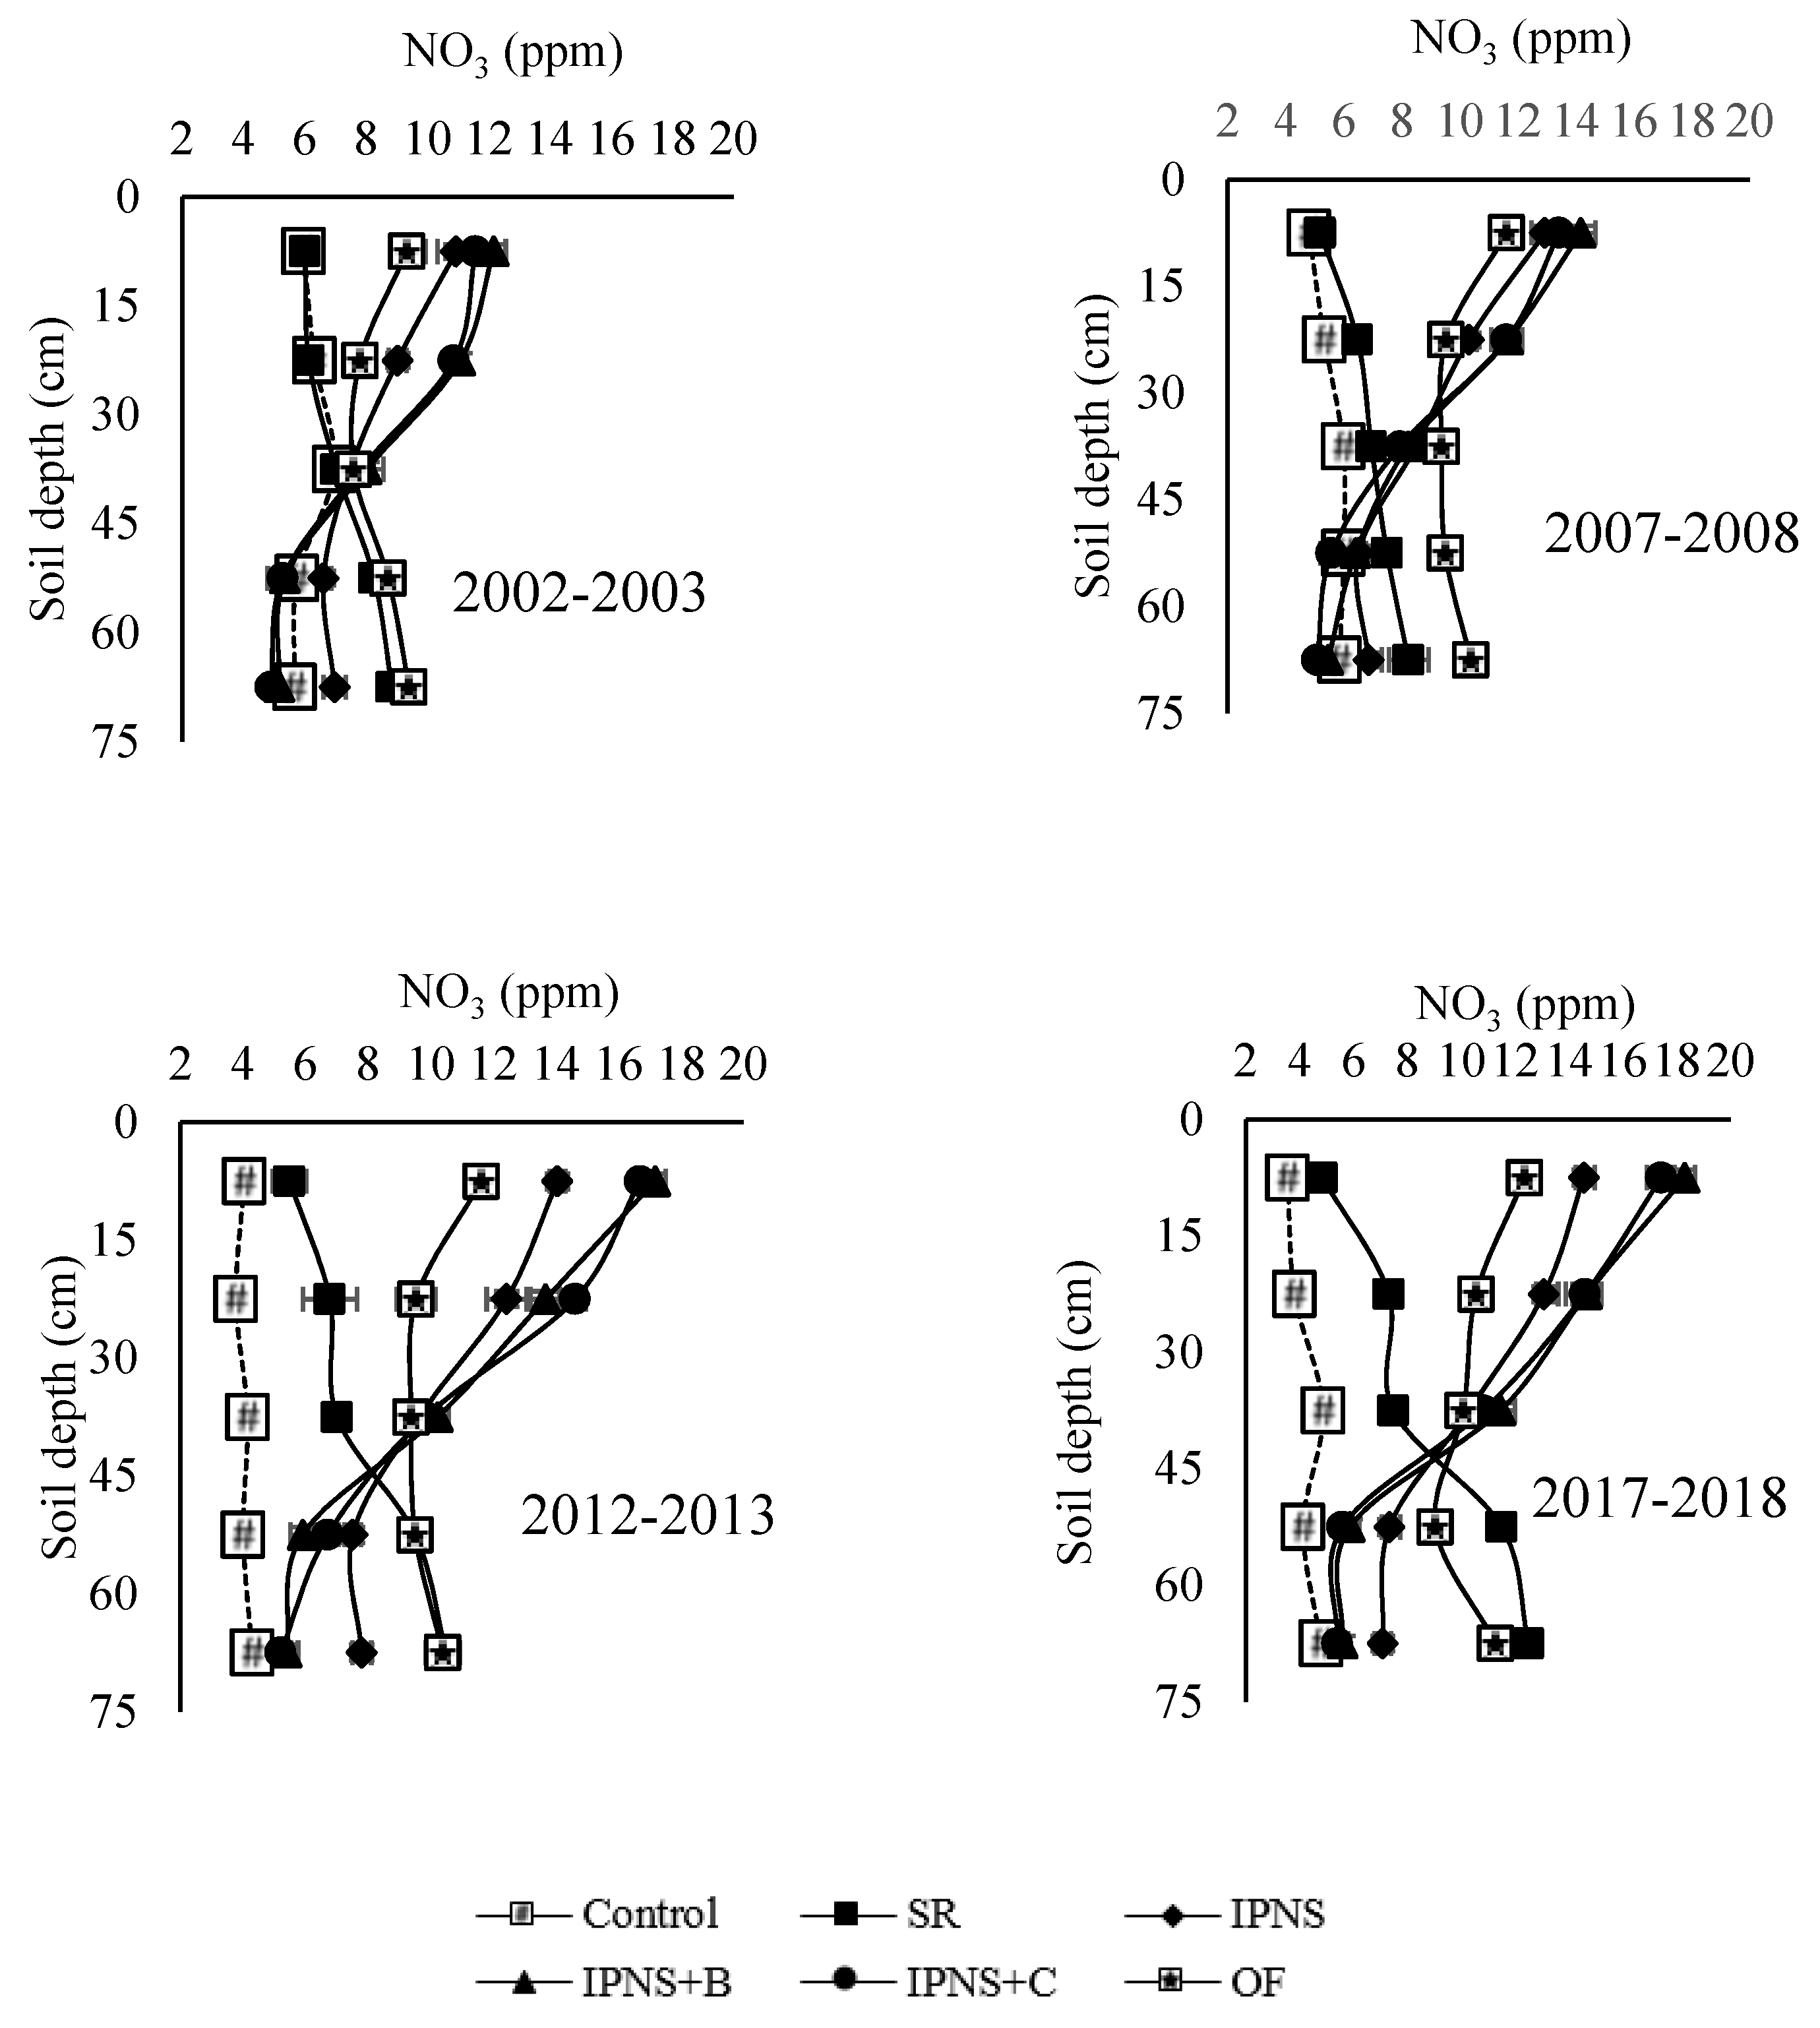
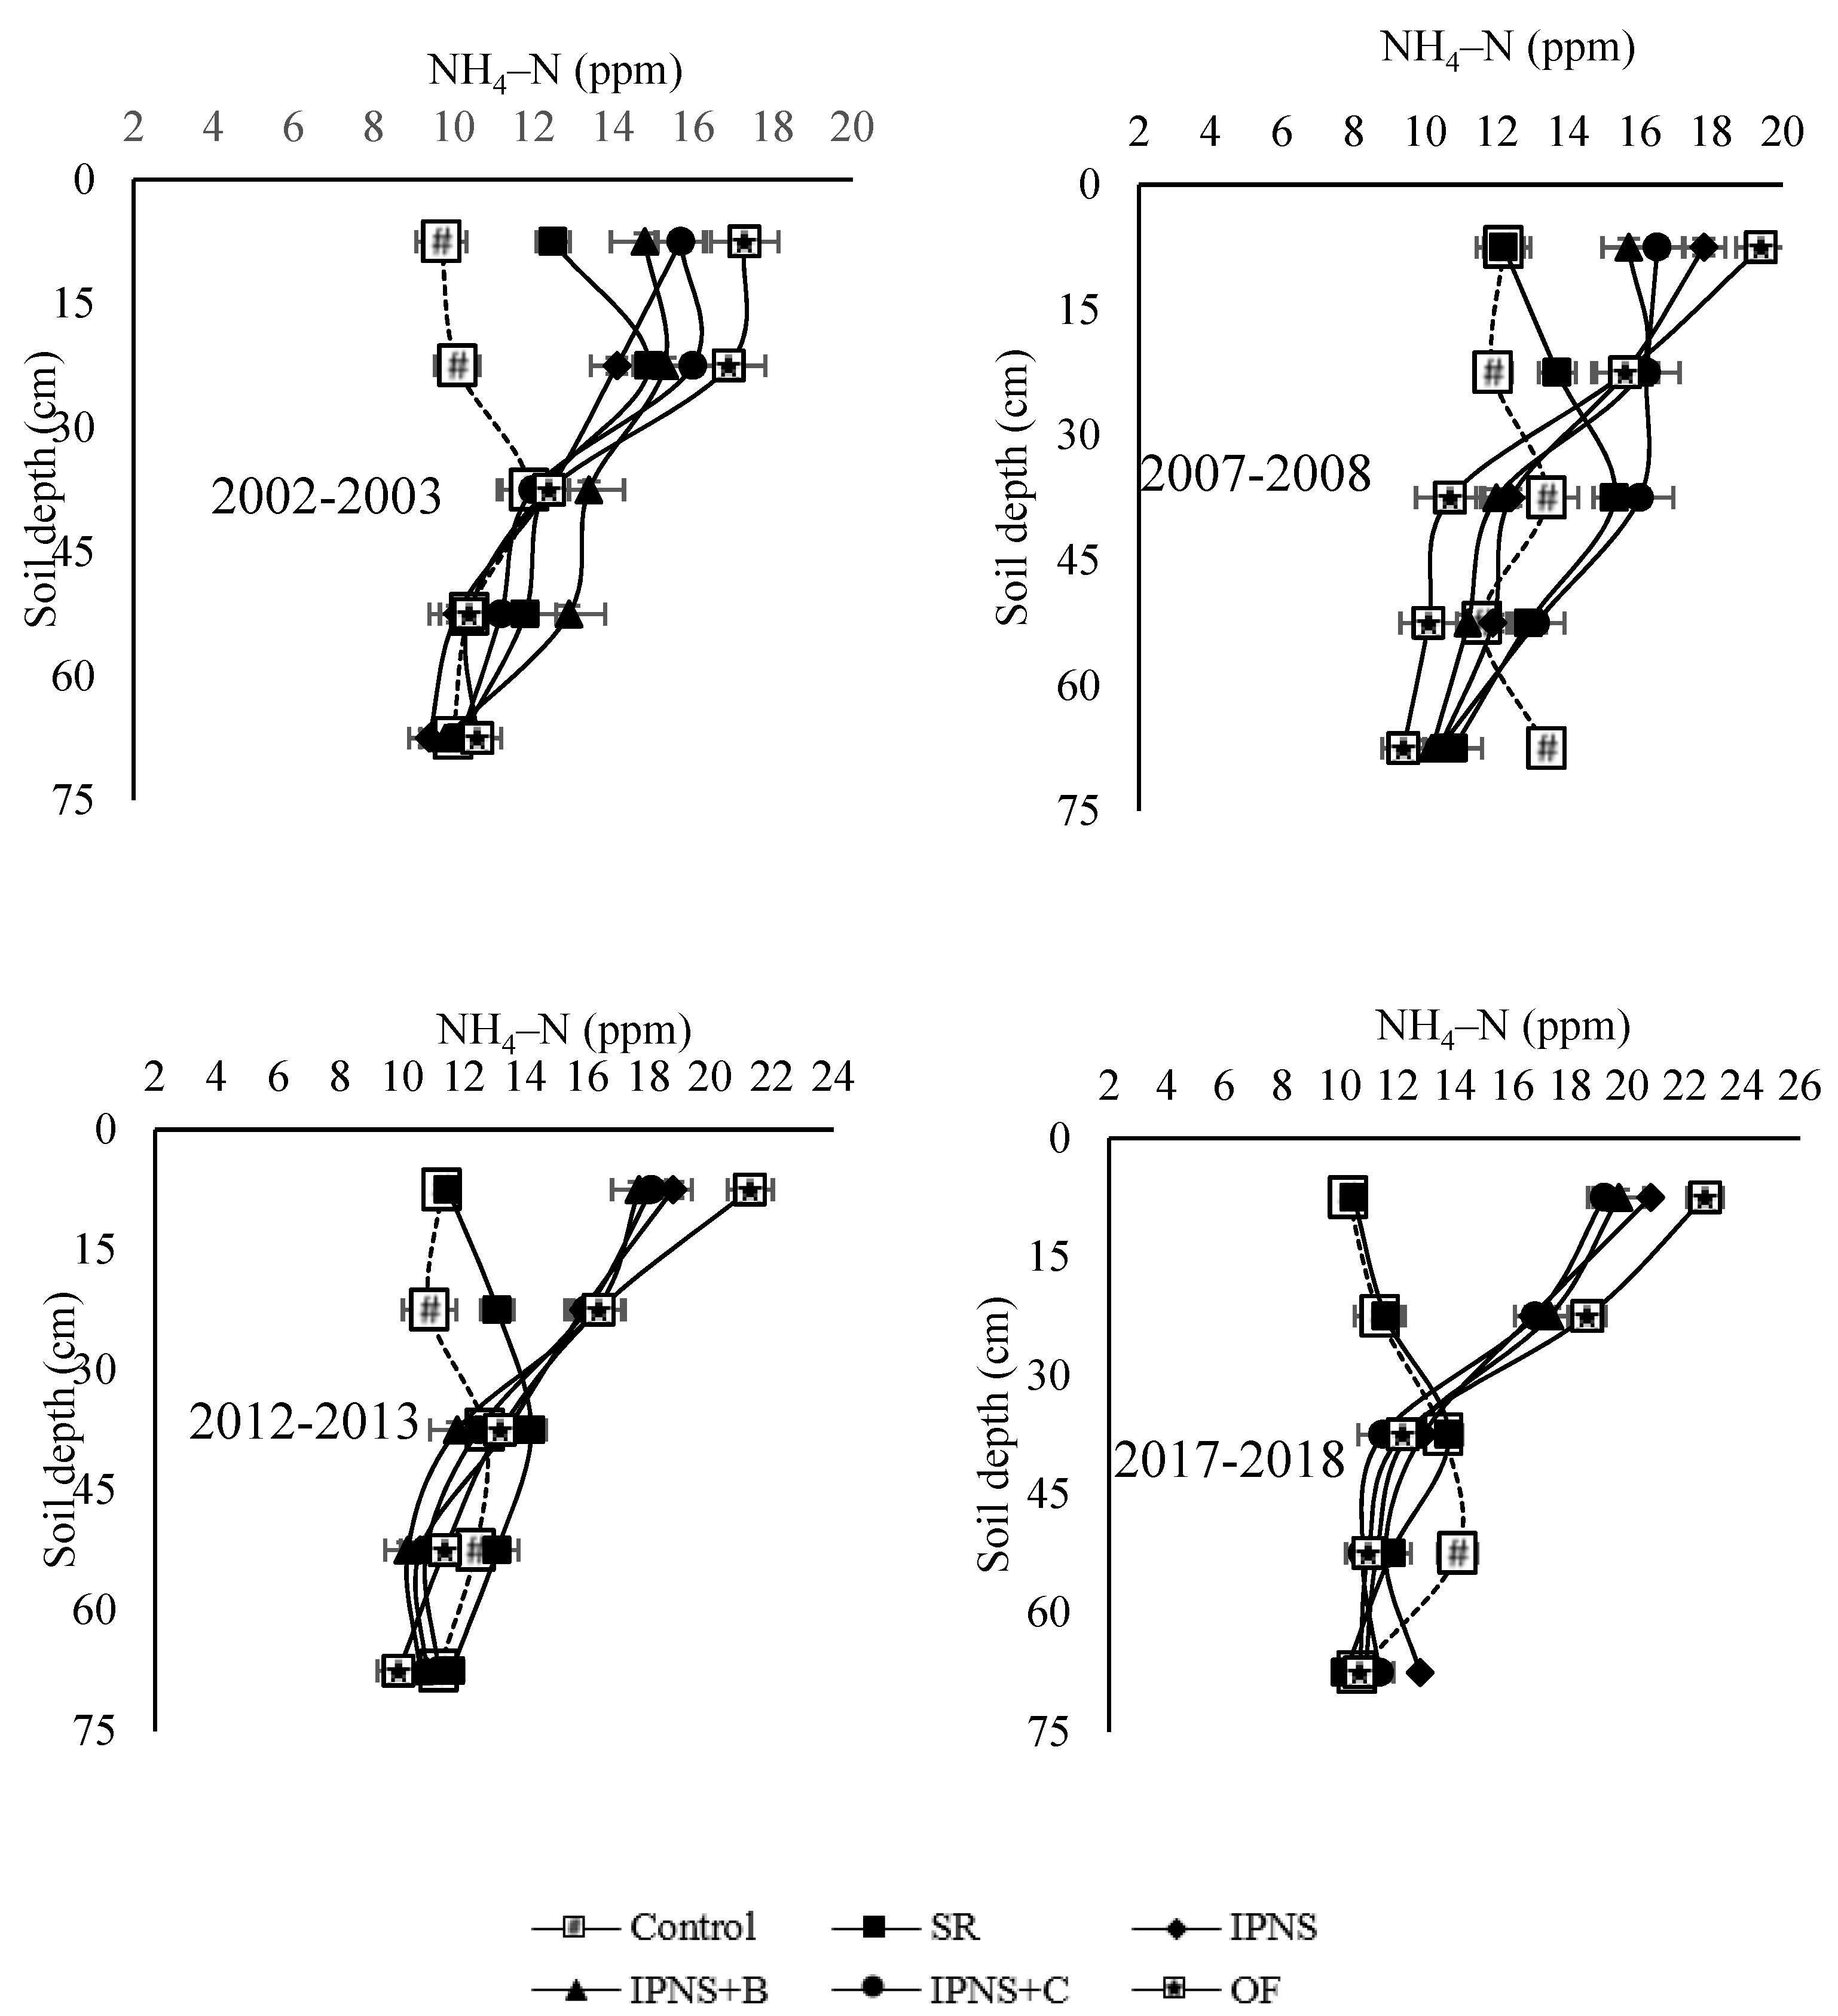
3.3.3. Soil Mineral N Content

The nitrate (NO3)–N content of surface soil (0–15 cm) was greater under IPNS+B and IPNS+C compared with the other nutrient management options; the differences were more prominent during 2012–2013 and 2017–2018 (Figure 4). The NO3–N content in the surface soil layer after wheat harvest in the IPNS+B treatment was greater than that in the RDF by 103% in 2002–2003, 173% in 2007–2008, 213% in 2012–2013 and 268% in 2017–2018. The corresponding increases with the inclusion of cowpea as a break crop (IPNS+C) were 93%, 159%, 204% and 255%, respectively.
Compared with the initial NO3–N content of the surface soil layer (6.9 mg kg−1), the NO3–N content in IPNS, IPNS+B, IPNS+C, and OF treatments was greater by 7.76, 7.76, 11.5 and 10.6 mg kg−1, respectively, during the terminal year. On the other hand, no application of fertilizer or the application of FYM (control) and RDF led to depletion of NO3–N by 3.25 mg kg−1 and 1.96 mg kg−1, respectively, over the initial status (Figure 4).
Different nutrient management options markedly influenced the distribution of NO3–N in the soil profile. Whereas the NO3–N content increased over the initial content up to a profile depth of 75 cm in the RDF and OF plots, a constant decrease in the NO3–N content was observed under the IPNS + legume options (Figure 4). The inclusion of legumes in every third RW cycle (IPNS+B or IPNS+C) not only favoured a greater NO3–N content in the surface layer as compared with RDF, but also resulted in a lower NO3–N content in the deeper soil layers, as was evident from a decrease in the NO3–N content with an increasing soil profile depth. This advantage (greater retention of NO3–N in the surface soil) of the inclusion of legumes in RWS as a break crop was, however, more spectacular during the terminal year (2017–2018).
The nutrient supply through fertilizers, organic compounds, or both increased the NH4–N content as compared with no fertilizer application in the surface soil layer; the magnitude of such increase was greater under OF, followed by IPNS+C, IPNS+B, IPNS and RDF during 2002–2003 (Figure 5).
Compared with the initial NH4–N content (11.3 mg kg−1), OF and different IPNS options had a 31–53% higher NH4–N content in the surface soil layer during 2002–2003 (Figure 5). A similar pattern of increase in NH4–N content as the consequence of different fertilizer options was also observed after wheat harvest during 2007–2008, 2012–2013 and 2017–2018. The NH4–N content profile at different depths under OF and IPNS was almost uniformly distributed up to a depth of 0–45 cm, and was relatively greater than the initial NH4–N concentration. Values beyond a soil depth of 45 cm did not show any consistent trend among different sampling intervals.

3.3.4. Soil Olsen-P Content

The Olsen-P content of the surface soil (0–15 cm) increased compared with the initial content (8.3 mg kg−1) under different nutrient management options and with the passage of time (Table 6). After the 20th RWS cycle (2017–2018), the maximum P build-up in the surface soil was noticed under RDF (21.8 mg kg−1), followed by OF (18.2 mg kg−1), whereas a relatively lower P content (16.0 mg kg−1) was recorded under the IPNS treatments. The effect of fertilizer options was relatively smaller in the sub-surface soil (15–30 cm soil depth). Nonetheless, fertilizer input at the recommended rate increased Olsen-P over the initial content (6.1 mg kg−1) in the sub-surface layer by 122% during the terminal crop cycle (2017–2018). Relatively smaller P accumulations over the initial content in the sub-surface soil (15–30 cm depth) were noticed under IPNS (51%) and OF (11%). On the other hand, a 20–23% decline in Olsen-P over the initial content was noticed under IPNS+B and IPNS+C (Table 6).

3.3.5. Soil Exchangeable K Content

Over the years, a consistent increase in soil exchangeable K was noticed under IPNS as well as OF (Table 7). At soil depths of 0–15 and 15–30 cm, the highest exchangeable K contents were recorded under OF (110 and 90 mg kg−1, respectively) and these were on par with the values under the different IPNS options during 2017–2018. When compared with the initial K contents (74.1 and 66.3 mg kg−1 at 0–15 and 15–30 cm soil depth, respectively), the exchangeable K content of the soil after 20 RW cycles increased by 48%, 43%, 42% and 36% at the 0–15 cm depth and by 36%, 30%, 29% and 28% at the 15–30 cm depth under OF, IPNS, IPNS+B and IPNS+C, respectively (Table 7). On the contrary, a consistent depletion of exchangeable K was observed in the RDF and unfertilized plots, wherein it remained significantly lower (p < 0.05) than that in the other treatments at different soil sampling intervals at both soil profile depths (0–15 and 15–30 cm).

3.3.6. Soil Available S Content

After 20 RW cycles, the soil available S content increased considerably over the initial content (14.3 and 9.0 mg kg−1) at soil profile depths of 0–15 and 15–30 cm under the OF and IPNS options (Table 8). Compared with the initial S status, OF had a 114% and 89% higher available S content at the 0–15 and 15–30 cm profile depths during 2017–2018. The increases under IPNS, IPNS+B and IPNS+C were 76% and 70%, 59% and 57% and 62% and 67%, respectively during the terminal years. On the other hand, RDF could not prevent a decline in S content, as depletions of 42% and 31% over the initial soil S content were noticed at soil depths of 0–15 and 15–30 cm, respectively, during 2017–2018 (Table 8). A depletion of available S over the initial S content was also noticed in the control, but the magnitude was smaller than that under the RDF plots.

3.3.7. Soil DTPA–Zn Content

The DTPA–Zn content varied among the different nutrient management options, soil profile depths and years of experimentation (Table 9). Whereas DTPA–Zn increased significantly over the initial content (0.54 and 0.46 mg kg−1 in the 0–15 and 15–30 soil depths, respectively, under RDF, IPNS, IPNS+C and IPNS+B, a continuous decline in DTPA–Zn was noticed under OF and control over the years at both profile depths. After 20 RW cycles, an additional Zn accumulation of 0.30 to 0.39 mg kg−1 at 0–15 cm and 0.14 to 0.18 mg kg−1 at the 15–30 cm soil profile depth was noticed over its initial status under RDF and in the different IPNS options. Conversely, declines of 0.18 and 0.12 mg kg−1 in DTPA–Zn were noticed under OF treatment at the 0–15 and 15–30 cm profile depths, respectively, during 2017–2018.

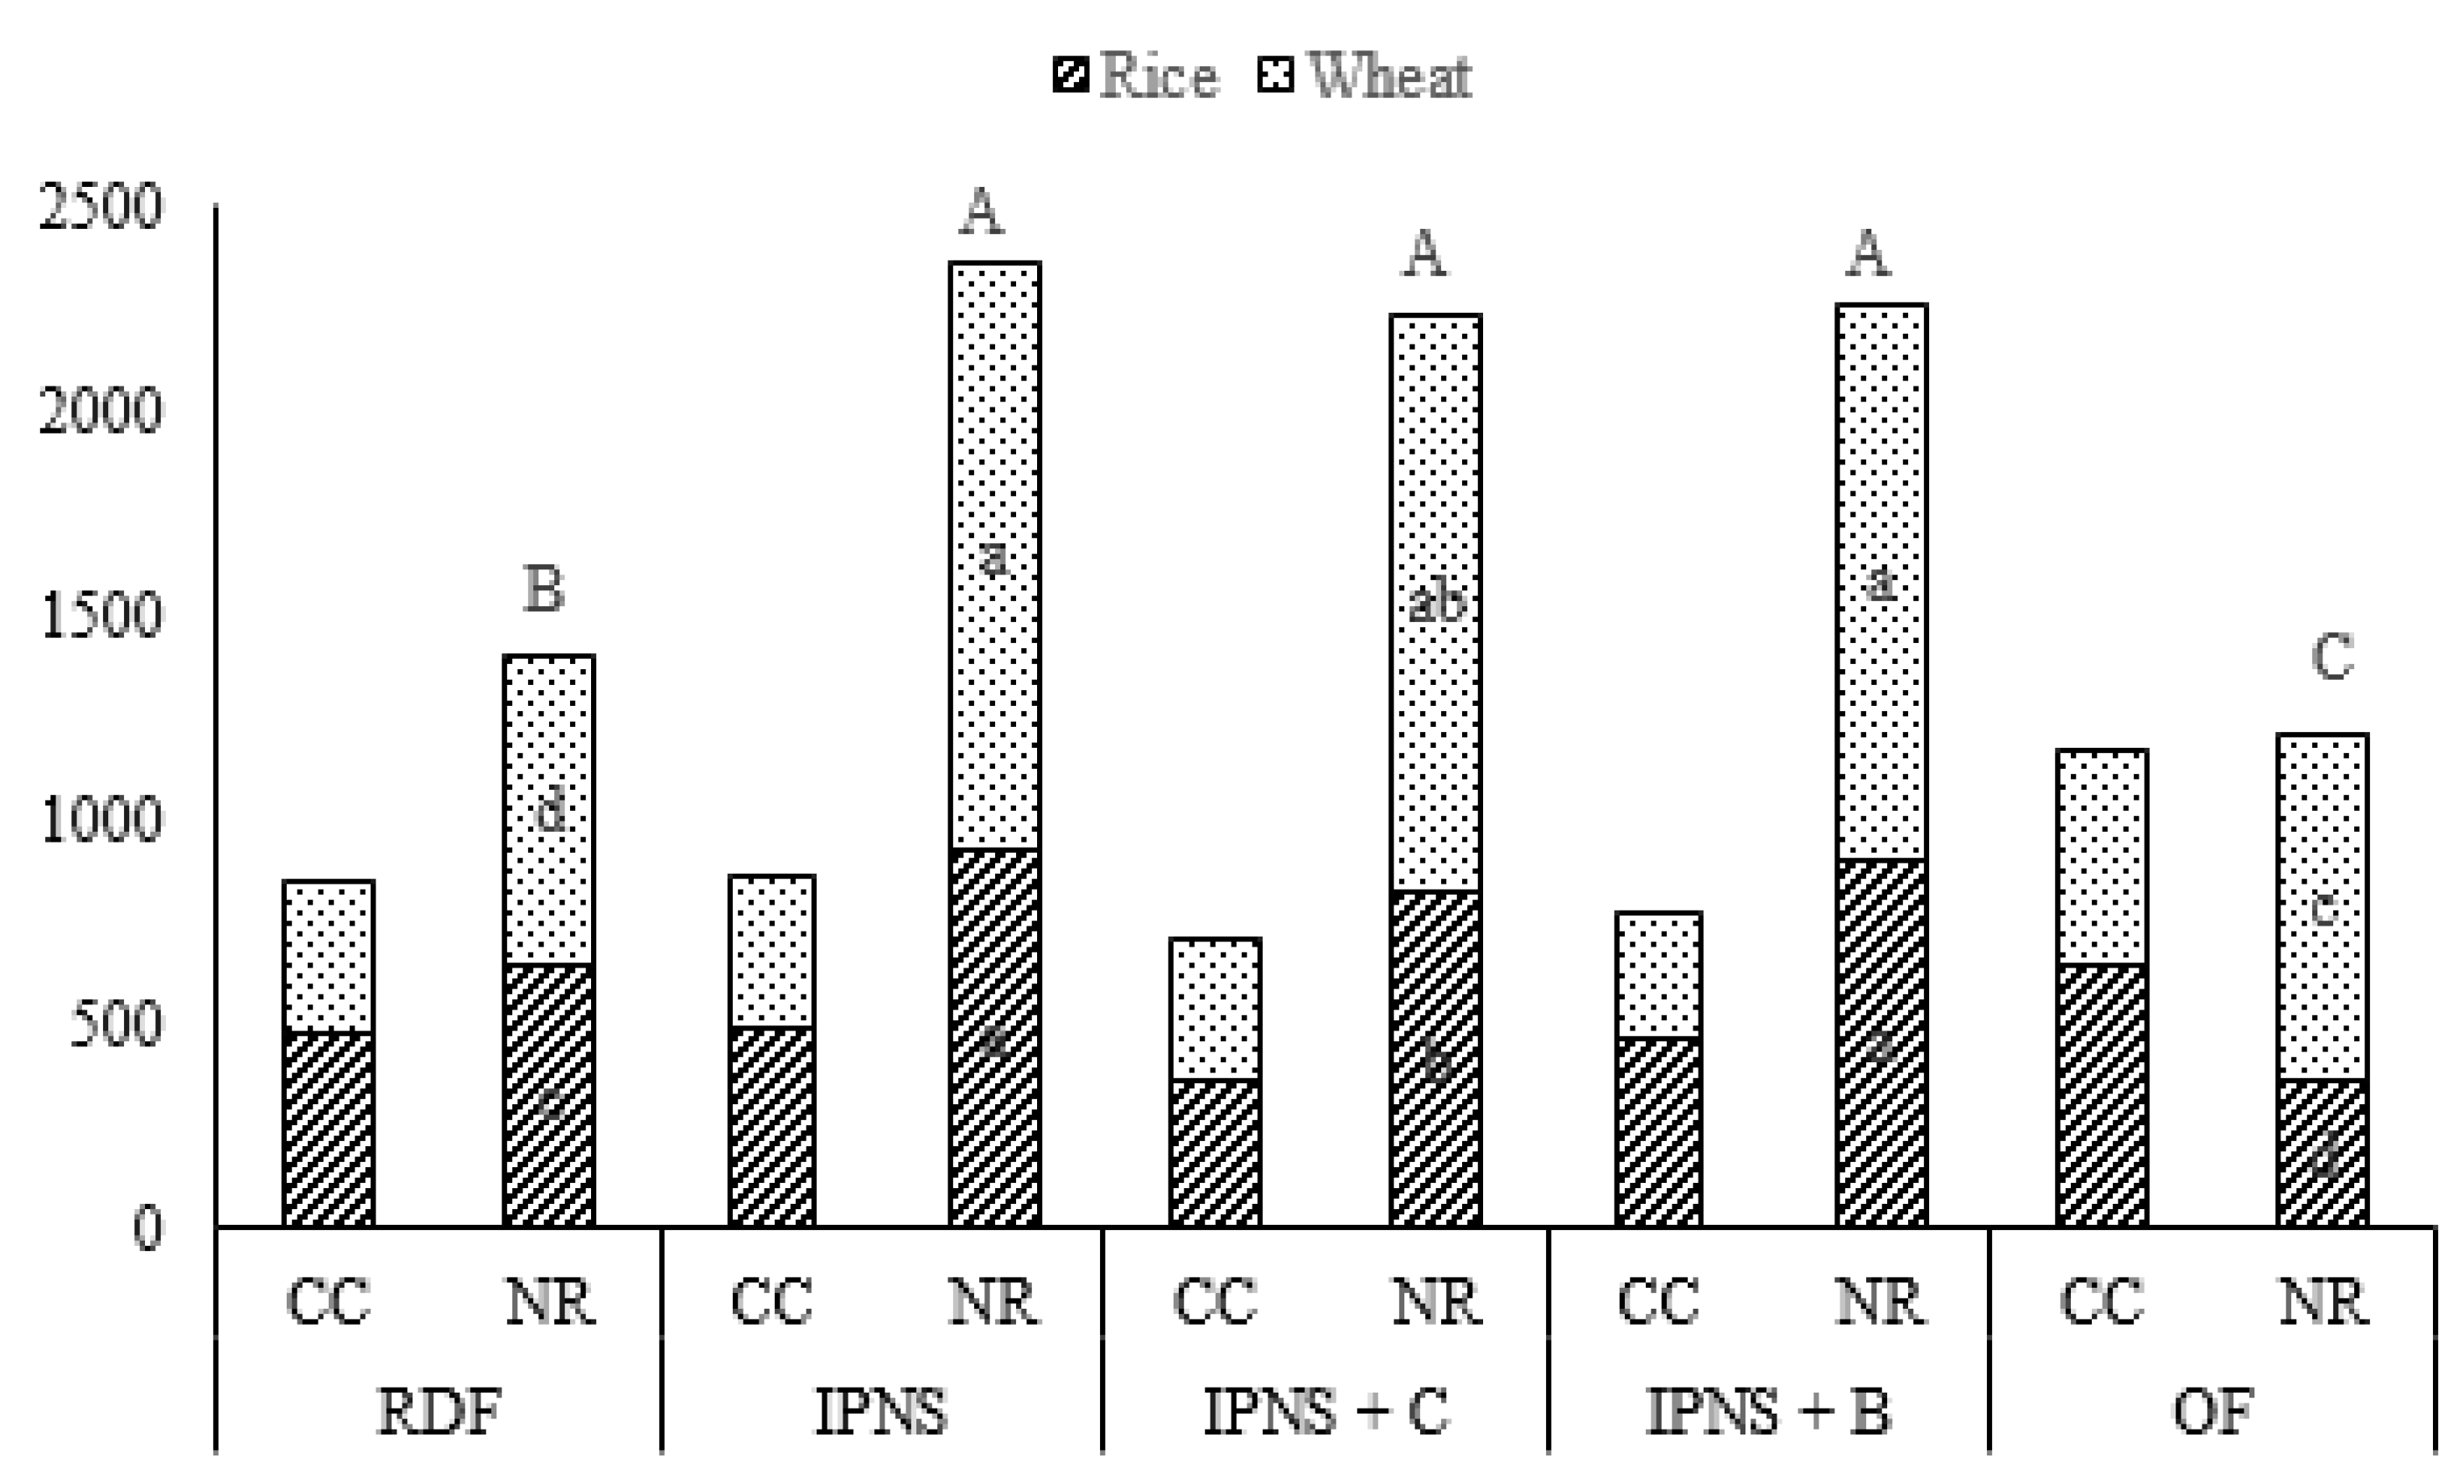
3.4. Effect on Economics

The average cost of cultivation in rice over the terminal three years was US$644 ha−1 under OF, US$481 ha−1 under RDF, US$489 ha−1 under IPNS, US$464 ha−1 under IPNS+B and US$356 ha−1 under IPNS+C. The net returns from the rice produce (grain + straw) ranged between US$361 ha−1 to US$931 ha−1 and were lowest under OF and highest under IPNS.
The cost of wheat was US$530 ha−1, US$368 ha−1, US$375 ha−1, US$303 ha−1 and US$351 ha−1, under the different treatments (Figure 6). The net returns for wheat were highest under IPNS (US$1436 ha−1), closely followed by IPNS+C (US$1414 ha−1) and IPNS+B (US$1355 ha−1). Also, the net returns for wheat under OF (US$850 ha−1) were greater than those under RDF (US$763 ha−1) (Figure 6). Apparently, the net returns under OF were greater than those under rice. For the RWS, OF had the highest cost of cultivation (US$1174 ha−1) followed by the IPNS options (US$864) and RDF (US$849 ha−1) and the cultivation costs were lowest under IPNS+C or B (US$707 ha−1 to US$767 ha−1). Considering RWS as whole, the economics favoured the integrated use of organics and fertilizers, as the net returns were higher under IPNS (US$2367 ha−1) followed by IPNS+B (US$2260 ha−1) and IPNS+C (US$2233 ha−1). The continuous use of fertilizers (RDF) gave a net return of US$1406 ha−1 which was significantly (p < 0.001) lower than the IPNS options. The net return for RWS under OF was US$1211 ha−1 only.

4. Discussion

4.1. RWS Productivity

In the present investigation, yields of both rice and wheat declined over the years under the RDF plots that received 120 kg N, 26 kg P and 33 kg K to each crop along with 5 kg Zn ha−1 to rice. On the other hand, the literature suggests that the soils in the RWS growing area of the IGP are inherently low in organic matter, and suffer from widespread multi-nutrient deficiencies including N, P, K, S, Zn and B [7,17,38,39]. Sustainable high productivity of RWS on these soils is obviously possible with adequate supply of these limiting nutrients through fertilizers and organics. In the present case, the RDF plot exhibited marginal changes in SOC (Table 5), and a decline in mineral N, exchangeable K and available S in the effective root zone (0–45 cm depth) compared with their initial contents at different time intervals (Figure 4 and Figure 5, Table 7 and Table 8), thus suggesting a depletion in the native nutrient supply due to continuous RW cropping. Further, changes in soil physico-chemical properties due to continuous flooding and drying under a puddled transplanted rice-conventional till wheat system [40,41] also had adverse effects on the soil nutrient supply [42]. The relatively greater yield reduction in wheat as compared with rice under RDF (Table 3) could, therefore, be explained in two ways: (i) the post-rice drying of soil promoted fixation of P and decreased its availability to subsequent wheat crops; and (ii) the restricted root growth of wheat [7,24,27] caused by increased soil Db (Figure 3) after puddled rice hindered nutrient access in the root zone [7,41]. On the other hand, the superiority of IPNS involving the concurrent use of FYM and fertilizers (75% RDF) vis-à-vis RDF is ascribed to improvements in soil physico-chemical properties due to the organic input and addition of significant quantities of P, K, S and other micro-nutrients through FYM. The manure (FYM) applied to substitute 25% of the recommended N in rice contributed greater amounts of P and K than those curtailed due to the 25% reduction of RDF in the IPNS treatments, as well as supplying an additional 6.7 kg S ha−1 annually. Also, the continuous and slow release of nutrients from manure would have enabled their efficient utilization by the crops [22,43].
Among the different IPNS options, the maximum yield gain recorded with the inclusion of legumes as a break crop may be ascribed to a reduction in sub-soil compaction as indicated by the lower Db values beyond the 30 cm soil depth (Figure 3) which improved the root proliferation of both rice and wheat [24,27,44], thus facilitating nutrient absorption from lower soil profiles. The lower NO3–N concentration below the 30 cm soil depth and its relatively higher content in the surface soil (0–15 cm) under legume inclusion plots supports this contention. The sustainable high yield under the IPNS+B or IPNS+C treatments may also be associated with a reduction in prominent weeds like Echinochloa sp. in rice and Phalaris minor in wheat under the legume-included plots (data not presented).
The significantly lower yields of rice and wheat under OF plots compared with under RDF and IPNS may be visualized in two possible ways: (i) the FYM equivalent to 120 kg N ha−1 applied at the time of sowing/transplanting was unable to supply the nutrients (especially, N) in adequate quantities up to the reproductive stages of crop (data not reported) causing yield reduction; and (ii) the micronutrient content of soil, especially soil Zn, declined over the period (Table 9) as FYM alone could not ensure a sufficient Zn supply. Widespread Zn deficiency is one of major soil fertility constraints in RW growing areas of the IGP [17], and its inclusion in the fertilization schedule is essential to achieve a sustainable high yield. The study, therefore, underlines that the OF nutrient management protocols that ensure adequate supplies of macro- and micro-nutrients (especially Zn) throughout the cropping seasons can hardly sustain high yields of RWS in the IGP [19].
The annual change in the yield of rice under RDF was meagre, whereas the yield of wheat declined significantly over the years. Such yield trends may be ascribed to the high yield level (4.62 t ha−1) in the initial years. An analysis of long-term experiments conducted in the IGP suggested earlier that the magnitude of yield decline in rice-based systems is negatively related to the level of initial yield [45,46]. In the present investigation, the decline in crop productivity under RDF may also explained in terms of greater NO3–N leaching beyond the root zone (beyond a soil depth of 45 cm) (Figure 4), and depletion of soil exchangeable K and available S contents (Table 7 and Table 8). These results are corroborated by earlier reports of other long-term experiments wherein the emergence of multi-nutrient deficiencies [11] led to a yield decline over the passage of time, and the supply of different nutrients in adequate amounts helped to attain yield stability [16,47].
Conversely, initial rice and wheat yield levels under OF plots were lower (2.9 and 2.33 t ha−1 respectively) than those under RDF but showed a significant (p < 0.001) positive annual yield increase (9.2% annum−1) (Table 4). Further, the significantly (p < 0.05) higher annual yield increases in both rice and wheat under IPNS and IPNS+B or IPNS+C, even over their initial high yields, is ascribed to the balanced and continuous nutrient supply owing to the improved soil structure (lower Db, Figure 3), SOC and other soil fertility parameters (Table 5, Table 6, Table 7, Table 8 and Table 9 and Figure 2, Figure 3 and Figure 4). Thus, our study indicates that integrated use of organics and fertilizers can sustain higher productivity of RWS in the IGP [19].

4.2. Soil Health

4.2.1. Bulk Density and Organic Carbon

Continuous RWS under RDF showed an increase in the Db value at soil depths of 30–45 cm (Figure 3). The sub-surface compaction below the puddled zone owing to aggregate disruption [48] is one of the important constraints for sustainable RWS productivity in the IGP [1]. The migration of clay towards a lower profile consequent to puddling increases soil strength rapidly upon drying [41], which restricts the root growth of the subsequent crop [7,24,27]. On the other hand, a decrease in Db, particularly in the sub-soil (30–45 cm depth) under the IPNS+B or IPNS+C plots, consequent to the inclusion of tap rooted legumes and subsequent decomposition of roots increased SOC and helped to improve soil porosity [17,27,49], in turn, facilitating root proliferation. The reduction in Db under IPNS was due to the fibrous nature of added organic matter, which prevents closer packing of soil separates [50]. Also, the use of organic matter input results in better soil aeration and improved soil aggregation, which leads to decreased soil Db [51]. In fact, changes in organic matter not only have a direct bearing on soil Db due to its lower particle density vis-à-vis mineral soil, they also increase soil aggregation and permanent pore development due to the increased soil biological activity [51,52].
The soil organic carbon concentration in the surface layer (0–15 cm) increased significantly under the IPNS options and OF plots (Table 5). In fact, the SOC at any given location largely depends on the annual turnover of organics, root + shoot stubbles and root exudates, and their recycling [17,21,27]. Thus, the use of organics in the IPNS treatments including those with legumes brought further improvement in SOC over sole fertilizers. The relatively higher increase in SOC under OF may be attributed to greater recycling of organic matter compared to under the other nutrient management options. The maintenance of SOC at its initial status may be corroborated with the findings of soil fertility delineation studies in similar agro-ecologies of the IGP (Singh et al., 2015) wherein SOC under balanced fertilization either remained unaffected or even increased depending upon the initial SOC content. The higher SOC in sub-soil under the IPNS treatments involving legumes (cowpea/berseem) is apparently due to the recycling of legume roots in the deeper soil layer, which has created a further conducive environment for the root growth of rice and wheat over the years [24,53].

4.2.2. Soil N, P and K Contents

The NO3–N content in the upper soil (0–15 cm depth) increased sizeably under the OF and IPNS treatments. The favourable effects of organic manures and legume inclusion on soil N supply have already been documented [14,25], underlining the slow release of nutrients bound in aggregates [43,54] and the addition of N through BNF [55].On the other hand, control (unfertilized) and RDF plots underwent a depletion of NO3–N by 3.25 mg kg−1 and 1.96 mg kg−1, respectively, over the initial status, which suggests excessive nutrient mining due to an inadequate supply of nutrients under high yielding RWS [15,56]. The relatively lower NO3–N content in the deeper soil profile under IPNS+C or IPNS+B compared with RDF or IPNS was obviously due to greater root proliferation in the deeper soil profile [15,57] leading ultimately to greater NO3–N uptake by rice and wheat from the deeper layers under treatments involving legumes [24,27,44]. In view of the lower NO3–N content further down the soil profile, the inclusion of legumes as a break crop at certain interval in RWS could be considered a potential option to overcome the groundwater pollution through curbing NO3–N leaching in the RWS dominated areas of the IGP [58].
In the present study, the build-up of P highest under RDF (Table 6) was very much expected under regular P addition through fertilizer as cereal crops utilize only a fraction of the applied P [13]. The relatively greater Olsen-P content in soil under OF and IPNS compared with control (unfertilized) may be ascribed to the fact that FYM and legume litter/stubbles supply sizeable amounts of P to the soil. A reduction in the fixation/sorption of applied P in the soil consequent to the enhanced competition of organic molecules with PO43− ions for P retention sites [59] under OF/IPNS could be another explanation for these findings. Further, an increased SOC from 5.1 g kg−1 to 6.9 g kg−1 under OF increased the negative charges that contributed to decreased P sorption by the repulsion of forces between orthophosphate ions and the negatively-charged surface [60]. On the contrary, the Olsen-P content of surface soil (0–15 cm) under the control declined from the initial content by 17% at the end of the 2017–2018 RW cycle. This decline in P content is associated with the lack of addition of P despite continuous removal by rice and wheat crops (data not reported) and a gradual decline in SOC under the control (Table 5). Further, the depletion of soil P content in the soil sub-surface and the relatively lower P content in the surface layer observed with legume inclusion as a break crop is explained by the fact that legumes have higher P demands and better P utilization efficiency [17,57].
The depletion of exchangeable K under RDF despite the regular addition of K through fertilizers can be explained in light of the higher K demands of the constituent crops of RWS. Being exhaustive K feeders, these crops may require 20.5–22.0 kg K t−1 of grain production (24). At high productivity levels, the net balance of K in the soil generally remains negative, even with the application of the recommended K content [14,61,62]. Besides, leaching loss of K with percolating water is one of the most significant methods of K removal from the rhizosphere, especially under irrigated ecology. The higher K fixing capacity of the illite-dominant soil minerology of IGP is also one of the major reasons for the depletion of exchangeable K in soil [12,63]. On the other hand, the higher exchangeable K content under OF or IPNS may be ascribed to the release of organic acids during the decomposition which generates negative electric charges in the soil with a preference for di-or-tri-valent cations, such as Al3+, Ca2+ and Mg2+, leaving K+ to be adsorbed by the negatively-charged soil colloids [64]. This phenomenon might have helped to reduce the K fixation and enhance its availability in soil.

4.2.3. Secondary and Micro-Nutrients

The greater S availability under the OF and IPNS options was associated with the greater S addition through FYM in these plots. Since the organic S fraction in the soil is positively related to the organic matter status [65] and is generally considered an important pool of available S [17], lesser deficiencies are expected in soils containing high SOC (Table 5) or those receiving organic manure regularly. On the other hand, the depletion of available S under RDF plots may be explained as (i) the RDF treatments did not include S application, (ii) there was substantial S removal by the crops grown under RDF owing to higher yield levels (data not reported), or (iii) there was reduced SO42− retention due to higher available P under the RDF plots (Table 6) [17,56]. Since H2PO4 is a strong competitor of SO42− for anion exchange sites, its high availability in the exchange complex can cause concurrent desorption of SO42− from colloidal surfaces and subsequent leaching with irrigation and rain water [66,67]. The smaller depletion of available S in the control (unfertilized) over the initial S content compared to that in the RDF plots might be due to the smaller S uptake by crops grown under the control.
A gradual accumulation of DTPA–Zn in soil was noticed under RDF and IPNS, whereas a declining trend was noticed under OF. It is pertinent to mention that 5 kg Zn ha−1 was applied annually to RDF as well as in the different IPNS options (IPNS, IPNS+B and IPNS+C). The increase in DTPA–Zn reflected the application of zinc in excess of its removal in harvested grain and straw [39]. On the other hand, the addition of Zn in meagre quantities through FYM under OF led to the mining of soil native Zn, resulting in a lower soil Zn content.

4.3. Economics of RWS

The cost of cultivation (CC) for rice, wheat and RWS was maximum under the OF treatments. The higher CC (US$310 to 467) under OF compared with that under the RDF and IPNS options was attributed to the greater cost of FYM and the excess expenditure on hand-weeding. On the other hand, the lower CC of RWS under the IPNS + legume treatments (US$707 and 767) vis-à-vis RDF or IPNS may be ascribed to the lower investment on fertilizer nutrients, irrigation, weed/pest management and laborers under legume fodder grown at every third cycle in place of rice or wheat. Further, the higher economic net returns of RWS under different IPNS options over the RDF and OF treatments was mainly due to improved yields (grain + straw) over time. Although the cost of cultivation under the IPNS+B or IPNS+C treatments was lower than that of the IPNS, the net returns under these treatments remained on par, as the cost of legume fodder produced was much smaller (US$14.3 t−1 of fodder) than the cost of grain + straw of rice and wheat. The low returns under OF may be associated with higher CC involved in rice and wheat, and the relatively lower annual productivity as compared with the RDF or IPNS treatments. The economics of RWS thus favour the adoption of IPNS with or without inclusion of legumes.

5. Conclusions

The foregoing results of the present long-term study underline the fact that the sustainable high productivity of RWS in the intensively-cropped IGP cannot be achieved through a single nutrient source, be it fertilizer or organic manure. Conjoint use of both, on the other hand, proved superior in terms of crop productivity, soil health and economic returns. The inclusion of forage legumes as a break crop in the RWS had an added advantage vis-à-vis IPNS alone, as was evident from the improvement in yield and different soil parameters. In view of scarcity of conventional manure (FYM), there is a need to conduct well planned studies involving other locally available organics to develop rational IPNS prescriptions for large-scale adoption. Also, the environmental impacts of continuous use of organic inputs in sizeable amounts under OF need to be studied in a holistic manner.

Author Contributions

In this study, Drs. Vinod K. Singh, Brahma S. Dwivedi, Arvind K Shukla and Rajendra P. Mishra were involve in research conceptualization, data curation, field investigation, project administration and writing original draft for publication. Dr Azad. S. Panwar helped in funding acquisition and general project administration. Drs. Pravin K. Upadhyay, Kapila Shekhawat, Kaushik Majumdar and Jagadish Timsina supported for evolving methodology, formal data analysis, writing and editing of draft at different stages.

Funding

Authors are thankful to Indian Council of Agricultural Research for needful funding support to conduct the study.

Acknowledgments

The authors thank the directors of ICAR—Indian Institute of Farming Systems Research, Modipuram for providing the necessary facilities for field experimentation and laboratory analyses.

Conflicts of Interest

The authors declare no conflict of interest.

References

  1. Chauhan, B.S.; Mahajan, G.; Sardana, V.; Timsina, J.; Jat, M.L. Productivity and Sustainability of the Rice-Wheat Cropping System in the Indo-Gangetic Plains of the Indian subcontinent: Problems, Opportunities, and Strategies. Adv. Agron. 2012, 117, 316–369. [Google Scholar]
  2. Ladha, J.K.; Pathak, H.; Padre, A.T.; Dawe, D.; Gupta, R.K. Productivity trends in intensive rice-wheat cropping systems in Asia. In Improving the Productivity and Sustainability of Rice-Wheat Systems: Issues and Impacts; Ladha, J.K., Hill, J., Gupta, R.K., Duxbury, J., Buresh, R.J., Eds.; ASA Special Publication 65; ASA-CSSA-SSSA: Madison, WI, USA, 2003; pp. 45–76. [Google Scholar]
  3. Verma, B.C.; Datta, S.P.; Rattan, R.K.; Singh, A.K. Long-Term Effect of Tillage, Water and Nutrient Management Practices on Mineral Nitrogen, Available Phosphorus and Sulphur Content under Rice-Wheat Cropping System. J. Indian Soc. Soil Sci. 2016, 64, 71–77. [Google Scholar] [CrossRef]
  4. FAOSTAT; Food and Agriculture Organization of the United Nations: Rome, Italy, 2017.
  5. Yadvinder-Singh; Gupta, R.K.; Gurpreet-Singh; Jagmohan-Singh; Sidhu, H.S.; Bijay-Singh. Nitrogen and residue management effects on agronomic productivity and nitrogen use efficiency in rice–wheat system in Indian Punjab. Nutr. Cycl. Agroecosyst. 2009, 84, 141–154. [Google Scholar] [CrossRef]
  6. Das, D.; Dwivedi, B.S.; Singh, V.K.; Datta, S.P.; Meena, M.C.; Chakraborty, D.; Bandyopadhyay, K.K.; Kumar, R.; Mishra, R.P. Long-term effects of fertilizers and organic sources on soil organic carbon fractions under a rice–wheat system in the Indo-Gangetic Plains of north-west India. Soil Res. 2017, 55, 296–308. [Google Scholar] [CrossRef]
  7. Timsina, J.; Connor, D.J. Productivity and management of rice-wheat cropping systems: Issues and challenges. Field Crops Res. 2001, 69, 93–132. [Google Scholar] [CrossRef]
  8. Bhatt, R.; Kukal, S.S.; Busari, M.A.; Arora, S.; Yadav, M. Sustainability issues on rice–wheat cropping system. International Soil and Water Conservation Research. Int. Soil Water Conserv. Res. 2016, 4, 64–74. [Google Scholar] [CrossRef]
  9. Ladha, J.K.; Yadvinder-Singh; Erenstein, O.; Hardy, B. Integrated Crop and Resource Management in the Rice? Wheat System of South Asia; International Rice Research Institute: Los Banos, Philippines, 2009. [Google Scholar]
  10. Majumder, B.; Mandal, B.; Bandyopadhyay, P.K. Soil organic carbon pools and productivity in relation to nutrient management in a 20-year old rice-berseem agroecosystem. Biol. Fertil. Soils 2008, 44, 451–464. [Google Scholar] [CrossRef]
  11. Singh, M.; Reddy, K.S.; Singh, V.P.; Rupa, T.R. phosphorus availability to rice (Oryza sativa L.)–wheat (Triticum aestivum L.) in a vertical soil after eight years of inorganic and organic fertilizer addition. Bioresource. Technol. 2007, 98, 1474–1481. [Google Scholar] [CrossRef]
  12. Panaullah, G.M.; Timsina, J.; Saleque, M.A.; Ishaque, M.; Pathan, A.B.M.B.U.; Connor, D.J.; Saha, P.K.; Quayyum, M.A.; Humphreys, E.; Meisner, C.A. Nutrient Uptake and Apparent Balances for Rice-Wheat Sequences. III. Potassium. J. Plant Nutr. 2006, 29, 173–187. [Google Scholar] [CrossRef]
  13. Saleque, M.A.; Timsina, J.; Panaullah, G.M.; Ishaque, M.; Pathan, A.B.M.B.U.; Connor, D.J.; Saha, P.K.; Quayyum, M.A.; Humphreys, E.; Meisner, C.A. Nutrient Uptake and Apparent Balances for Rice-Wheat Sequences. II. Phosphorus. J. Plant Nutr. 2006, 29, 157–172. [Google Scholar] [CrossRef]
  14. Singh, V.K.; Sharma, B.B.; Dwivedi, B.S. The impact of diversification of a rice–wheat cropping system on crop productivity and soil fertility. J. Agric. Sci. 2002, 139, 405–412. [Google Scholar] [CrossRef]
  15. Timsina, J.; Panaullah, G.M.; Saleque, M.A.; Ishaque, M.; Pathan, A.B.M.B.U.; Quayyum, M.A.; Connor, D.J.; Saha, P.K.; Humphreys, E.; Meisner, C.A. Nutrient Uptake and Apparent Balances for Rice-Wheat Sequences. J. Plant Nutr. 2006, 29, 137–155. [Google Scholar] [CrossRef]
  16. Dwivedi, B.S.; Singh, V.K.; Dwivedi, V. Application of phosphate rock, with or without Aspergillus awamori inoculation, to meet P demands of rice-wheat systems in the Indo-Gangetic plains of India. Aust. J. Exp. Agric. 2014, 44, 1041–1050. [Google Scholar] [CrossRef]
  17. Singh, V.K.; Dwivedi, B.S.; Shukla, A.K.; Kumar, V.; Gangwar, B.; Rani, M.; Singh, S.K.; Mishra, R.P. Status of available sulphur in soils of north-west Indo-Gangetic Plain and Western Himalayan Region and response of rice and wheat to applied sulphur in farmers’ fields. Agric. Res. 2015, 4, 76–92. [Google Scholar] [CrossRef]
  18. Bijay-Singh. Are Nitrogen Fertilizers Deleterious to Soil Health? Agron. J. 2018, 8, 48. [Google Scholar] [CrossRef]
  19. Timsina, J. Review Can Organic Sources of Nutrients Increase Crop Yields to Meet Global Food Demand? Agron. J. 2018, 8, 214. [Google Scholar] [CrossRef]
  20. Bandyopadhyay, K.K.; Misra, A.K.; Ghosh, P.K.; Hati, K.M. Effect of integrated use of farmyard manure and chemical fertilizers on soil physical properties and productivity of soybean. Soil Tillage Res. 2010, 110, 115–125. [Google Scholar] [CrossRef]
  21. Numbiar, K.K.M. Soil Fertility and Crop Production under Long-Term Fertilizer Use in India; ICAR: New Delhi, India, 1994. [Google Scholar]
  22. Dwivedi, B.S.; Singh, V.K.; Meena, M.C.; Dey, A.; Datta, S.P. Integrated nutrient management for enhanced nutrient use efficiency. Indian J. Fertil. 2016, 12, 62–71. [Google Scholar]
  23. Singh, V.K.; Dwivedi, B.S.; Tiwari, K.N.; Majumdar, K.; Rani, M.; Singh, S.K.; Timsina, J. Optimizing nutrient management strategies for rice-wheat system in the Indo-Gangetic Plains and adjacent region for higher productivity, nutrient use efficiency and profits. Field Crops Res. 2014, 164, 30–44. [Google Scholar] [CrossRef]
  24. Dwivedi, B.S.; Shukla, A.K.; Singh, V.K.; Yadav, R.L. Improving nitrogen and phosphorus use efficiencies through inclusion of forage cowpea in the rice–wheat system in the Indo-Gangetic plains of India. Field Crops Res. 2003, 84, 399–418. [Google Scholar] [CrossRef]
  25. Yadav, S.K.; Babu, S.; Yadav, M.K.; Singh, K.; Yadav, G.S.; Suresh, P. A Review of Organic Farming for Sustainable Agriculture in Northern India. Int. J. Agron. 2003, 2013, 718145. [Google Scholar] [CrossRef]
  26. Wani, S.P.; Rego, T.J.; Rajeswari, S.; Lee, K.K. Effect of legume-based cropping systems on nitrogen mineralization potential of Vertisol. Plant Soil. 1995, 175, 265–274. [Google Scholar] [CrossRef] [Green Version]
  27. Singh, V.K.; Dwivedi, B.S.; Shukla, A.K.; Chauhan, Y.S.; Yadav, R.L. Diversification of rice with pigeonpea in a rice–wheat cropping system on a Typic Ustochrept: Effect on soil fertility, yield and nutrient use efficiency. Field Crops Res. 2005, 92, 85–105. [Google Scholar] [CrossRef]
  28. Bremner, J.M.; Keeney, D.R. Steam distillation methods for determination of ammonium, nitrate and nitrite. Anal. Chem. Acta 1965, 32, 485–495. [Google Scholar] [CrossRef]
  29. Walkley, A.; Black, C.A. An examination of the Degitjareff method for determining soil organic matter, and a proposed modification of the chromic acid titration method. Soil Sci. 1934, 37, 29–38. [Google Scholar] [CrossRef]
  30. Olsen, S.R.; Cole, C.V.; Watanabe, F.S.; Dean, L.A. Estimation of Available Phosphorus in Soils by Extraction with Sodium Bicarbonate; United States Department of Agriculture: Washington, DC, USA, 1954. [Google Scholar]
  31. Washington, D.C.; Helmke, P.A.; Sparks, D.L. Lithium, sodium, potassium, rubidium, and cesium. In Methods of Soil Analysis. Part 3; Sparks, D.L., Ed.; Chemical Methods-Soil Science Society of America Book Series No. 5; SSSA and ASA: Madison, WI, USA, 1996; pp. 551–574. [Google Scholar]
  32. Williams, C.H.; Steinbergs, H. Soil sulphur fractions as chemical indices of available sulphur in some Australian soils. Aust. J. Agric. Res. 1995, 10, 340–352. [Google Scholar] [CrossRef]
  33. Lindsay, W.L.; Norvell, WA. Development of a DTPA Soil Test for Zinc, Iron, Manganese, and Copper. Soil Sci. Soc. Am. J. 1978, 42, 421–428. [Google Scholar] [CrossRef]
  34. Subbiah, B.V.; Asija, G.L. A rapid procedure for the determination of available nitrogen in soils. Curr. Sci. 1956, 25, 259–260. [Google Scholar]
  35. Page, A.L.; Millar, R.H.; Keeney, D.R. (Eds.) Methods of Soil Analysis. Part-2; American Society of Agronomy and Soil Science Society of America: Madison, WI, USA, 1982. [Google Scholar]
  36. Blake, G.R.; Hartge, K.H. Bulk density. In Methods of Soil Analysis, Part 1; Klute, A., Ed.; Physical and Mineralogical Properties, Monograph 9; ASA: Madison, WI, USA, 1986; pp. 363–376. [Google Scholar]
  37. Cochran, W.G.; Cox, G.M. Experimental Designs; Wiley: New York, NY, USA, 1957. [Google Scholar]
  38. Dwivedi, B.S.; Singh, V.K.; Shekhawat, K.; Meena, M.C.; Dey, A. Enhancing Use Efficiency of Phosphorus and Potassium under Different Cropping Systems of India. Indian J. Fertil. 2017, 13, 20–41. [Google Scholar]
  39. Cassman, K.G.; Peng, S.; Olk, D.C.; Ladha, J.K.; Reichardt, W.; Dobermann, A.; Singh, U. Opportunities for increasing nitrogen use effciency from improved resource management in irrigated rice systems. Field Crops Res. 1998, 56, 7–39. [Google Scholar] [CrossRef]
  40. Dwivedi, B.S.; Singh, V.K.; Shukla Arvind, K.; Meena, M.C. Optimizing dry and wet tillage for rice on a Gangetic alluvial soil: Effect on soil characteristics: Water use efficiency and productivity of the rice-wheat system. Eur. J. Agron. 2012, 43, 155–165. [Google Scholar] [CrossRef]
  41. Cassman, K.G.; Pingali, P.L. Extrapolating trends from long-term experiments on farmers’ felds: The case study of irrigated rice-systems in Asia. In Agricultural Sustainability: Economic, Environmental and Statistical Considerations; Barnet, V., Payre, R., Steiner, R., Eds.; Wiley: Chichester, UK, 1995; pp. 63–84. [Google Scholar]
  42. Mahajan, A.; Gupta, R.D. Integrated Nutrient Management (INM) in a Sustainable Rice-Wheat System; Springer: Dordrecht, The Netherlands, 2017. [Google Scholar]
  43. Singh, V.K.; Dwivedi, B.S.; Shukla, A.K. Yields, and nitrogen and phosphorus use efficiency as influenced by fertilizer NP additions in wheat (Triticum aestivum) under rice (Oryza sativa)-wheat and pigeonpea (Cajanus cajan)-wheat system on a Typic Ustochrept soil. Indian J. Agric. Sci. 2000, 76, 92–97. [Google Scholar]
  44. Dawe, D.; Dobermann, A.; Moya, P.; Abdulrachman, S.; Singh, B.; Lal, P.; Li, S.Y.; Lin, B.; Panaullah, G.; Sariam, O.; et al. How widespread are yield declines in long-term rice experiments in Asia? Field Crops Res. 2000, 66, 175–193. [Google Scholar] [CrossRef]
  45. Yadav, R.L.; Dwivedi, B.S.; Pandey, P.S. Rice–wheat cropping system: Assessment of sustainability under green manuring and chemical fertilizer input. Field Crops Res. 2000, 65, 15–30. [Google Scholar] [CrossRef]
  46. Swarup, A.; Wanjari, R.H. Three Decades of All India Coordinated Research Project on Long-Term Fertilizer Experiments to Study Changes in Soil Quality, Crop Productivity and Sustainability; IISS: Bhopal, India, 2000. [Google Scholar]
  47. Six, J.; Elliott, E.T.; Paustian, K. Soil macroaggregate turnover and microaggregate formation: A mechanism for C sequestration under no-tillage agriculture. Soil Biol. Biochem. 2000, 32, 2099–2103. [Google Scholar] [CrossRef]
  48. Sharma, P.K.; Ladha, J.K.; Bhushan, L. Soil physical effects of puddling in rice–wheat cropping system. In Improving the Productivity and Sustainability of Rice–Wheat Systems: Issues and Impacts; Ladha, J.K., Hill, J., Gupta, R.K., Duxbury, J., Buresh, R.J., Eds.; ASA Special Publication 65; ASA, CSSA and SSSA: Madison, WI, USA, 2003; pp. 97–114. [Google Scholar]
  49. Adams, W.A. The effect of organic matter on the bulk and true densities of some uncultivated podzolic soils. Eur. J. Soil Sci. 2006, 24, 10–17. [Google Scholar] [CrossRef]
  50. Halvorson, A.D.; Reule, C.A.; Follet, R. Nitrogen Fertilization Effects on Soil Carbon and Nitrogen in a dryland cropping system. Soil Sci. Soc. Am. J. 1999, 63, 912–917. [Google Scholar] [CrossRef]
  51. Franzluebbers, A.J.; Stuedemann, J.A.; Schomberg, H.H.; Wilkinson, S.R. Soil organic C and N pools under long-term pasture management in the Southern Piedmont USA. Soil Biol. Biochem. 2000, 32, 469–478. [Google Scholar] [CrossRef]
  52. Oussible, M.; Crookston, R.K.; Larson, W.E. Subsurface Compaction Reduces the Root and Shoot Growth and Grain Yield of Wheat. Agron. J. 1992, 84, 34–38. [Google Scholar] [CrossRef]
  53. Das, B.; Chakraborty, D.; Singh, V.K.; Aggarwal, P.; Singh, R.; Dwivedi, B.S. Effect of organic inputs on strength and stability of soil aggregates under rice-wheat rotation. Int. Agrophys. 2014, 8, 163–168. [Google Scholar] [CrossRef]
  54. Awonaike, K.O.; Kumarsinghe, K.S.; Danso, S.K.A. Nitrogen fixation and yield of cowpea as influenced by cultivar and Bradyrhizobium strain. Field Crop Res. 1990, 24, 163–171. [Google Scholar] [CrossRef]
  55. Dwivedi, B.S.; Shukla, A.K.; Singh, V.K.; Yadav, R.L. Response of wheat (Triticum aestivum), potato (Solanum tuberosum) and mustard (Brassica juncea) to potassium applied through muriate of potash of varying particle size. Indian J. Agric. Sci. 2001, 71, 634–638. [Google Scholar]
  56. Dwivedi, B.S.; Shukla, A.K.; Singh, V.K.; Yadav, R.L. Results of participatory diagnosis of constraints and opportunities (PDCO) based trials from the state of Uttar Pradesh. In Development of Farmers’ Resource-Based Integrated Plant Nutrient Supply Systems: Experience of a FAO–ICAR–IFFCO Collaborative Project and AICRP on Soil Test Crop Response Correlation; Subba Rao, A., Srivastava, S., Eds.; IISS: Bhopal, India, 2001; pp. 50–75. [Google Scholar]
  57. Singh, V.K.; Dwivedi, B.S.; Shukla, A.K.; Mishra, R.P. Permanent raised bed planting of the pigeonpea-wheat system on a Typic Ustochrept: Effects on soil fertility, yield, and water and nutrient use efficiencies. Field Crops Res. 2010, 116, 127–139. [Google Scholar] [CrossRef]
  58. Aulakh, M.S.; Singh, B. Nitrogen losses and fertilizer N use efficiency in irrigated porous soils. Nutr. Cycl. Agroecosyst. 1997, 147, 197–212. [Google Scholar] [CrossRef]
  59. Xie, R.J.; Fyles, J.W.; Mckenzie, A.F.; O’Hollaran, I.P. Ligno-sulphate retention in a clay soil: Casual modeling. Soil Sci. Soc. Am. J. 1991, 55, 711–716. [Google Scholar] [CrossRef]
  60. Moshi, A.O.; Wild, A.M.; Greenland, D.J. Effect of organic matter on the charge and phosphate adsorption characteristics of Kikuyu red clay from Kenya. Geoderma 1974, 11, 275–285. [Google Scholar] [CrossRef]
  61. Nayak, A.K.; Gangwar, B.; Shukla, A.K.; Mazumdar, S.P.; Kumar, A.; Raja, R.; Kumar, A.; Kumar, V.; Rai, P.K.; Mohan, U. Long-term effect of different integrated nutrient management on soil organic carbon and its fractions and sustainability of rice–wheat system in Indo Gangetic Plains of India. Field Crop Res. 2012, 127, 129–139. [Google Scholar] [CrossRef]
  62. Singh, V.K.; Dwivedi, B.S.; Yadvinder-Singh; Singh, S.K.; Mishra, R.P.; Shukla, A.K.; Rathore, S.; Shekhawat, K.; Majumdar, K.; Jat, M.L. Effect of tillage and crop establishment, residue management and K fertilization on yield, K use efficiency and apparent K balance under ricemaize system in north-western India. Field Crop Res. 2018, 224, 1–12. [Google Scholar]
  63. Tandon, H.L.S.; Sekhon, G.S. Potassium Research and Agricultural Production in India; Fertilizer Development and Consultation Organization: New Delhi, India, 1988. [Google Scholar]
  64. Timsina, J.; Singh, V.K.; Majumdar, K. Potassium management in rice-maize systems in South Asia. J. Plant Nutr. Soil Sci. 2013, 176, 317–330. [Google Scholar] [CrossRef]
  65. Pasricha, N.S.; Sarkar, A.K. Secondary nutrients. In Fundamentals of Soil Science, 2nd ed.; Goswami, N.N., Rattan, R.K., Dev, G., Narayanasamy, G., Das, D.K., Pal, D.K., Rao, D.L.N., Eds.; Indian Society of Soil Science: New Delhi, India, 2009; pp. 449–460. [Google Scholar]
  66. Pasricha, N.S.; Aulakh, M.S. Twenty Years of Sulphur Research and Oilseed Production in Punjab, India; Sulphur in Agriculture; TSI: Washington, DC, USA, 1991. [Google Scholar]
  67. Tandon, H.L.S. Biofertilizers and Organic Farming: A Source-Cum-Directory; Fertilizer Development and Consultation Organisation: New Delhi, India, 2011. [Google Scholar]
Figure 1. Average yearly temperature (minimum and maximum) and total annual rainfall during the study period.
Agronomy 09 00001 g001
Figure 2. Trends in yields of rice and wheat in a long-term RWS under different nutrient management options. Measured mean yields of the treatments (symbols) and the trend line fitted by linear regression (Table 3) are shown.
Agronomy 09 00001 g002aAgronomy 09 00001 g002b
Figure 3. Changes in the bulk density of soil at different profile depths after 20 RWS cycles under the influence of different nutrient management options. Bars indicate the standard error of the mean, n = 4.
Agronomy 09 00001 g003
Figure 4. Effects of the nutrient management options on the distribution of nitrate–N in different soil profiles after wheat harvest at five-year intervals of the RWS cycle. Bars indicate the standard error of the mean, n = 4.
Agronomy 09 00001 g004
Figure 5. Effect of nutrient management options on the distribution of the ammonium–N content in different soil profiles after wheat harvest at five-year intervals of the RWS cycle. Bars indicate the standard error of the mean, n = 4.
Agronomy 09 00001 g005
Figure 6. Economics (US$ha−1) of different nutrient management practices in rice and wheat under long-term RWS. CC and NR denote the cost of cultivation and the net returns, respectively. Values followed by different lower case letter(s) within rice or wheat for the net returns are statistically significant (p < 0.05). Values followed by different capital letter(s) within RWS for net return are statistically significant (p < 0.05).
Agronomy 09 00001 g006
Table 1. Physico-chemical characteristics of the soil measured at commencement of the field experiment in 1998.
Soil Profile-Depth (cm)Bulk Density (Mgm−3)pHEC (dS m−1)Organic Carbon (g kg−1)NO3–N (mg kg−1)NH4–N (mg kg−1)Olsen Available P (mg kg−1)Available K (mg kg−1)Available S (mg kg−1)DTPA–Zn (mg kg−1)
0–151.498.010.115.16.911.38.374.114.30.54
15–301.527.890.123.66.811.66.166.39.10.46
30–451.58---6.111.64----
45–601.60---5.4210.8----
60–751.61---5.210.4----
Table 2. Treatment details of the long-term experiment chosen for different nutrient management options.
Treatment CodeTreatment Details
Monsoon (Rice)Winter (Wheat)
ControlNo chemical fertilizer or organic manureNo chemical fertilizer or organic manure
RDFRecommended N, P and K through fertilizersRecommended N, P and K through fertilizers
IPNS75% of recommended N, P and K through fertilizers + 25% substitution of recommended N through FYMRecommended N, P and K through fertilizers
IPNS+C75% of recommended N, P and K through fertilizers + 25% substitution of recommended N through FYM + every third rice substituted with cow peaRecommended N, P and K through fertilizers
IPNS+B75% of recommended N, P and K through fertilizers + 25% substitution of recommended N through FYM + every third wheat substituted with berseemRecommended N, P and K through fertilizers
OF100% of recommended N, P and K through organic manures (FYM)100% of recommended N, P and K through organic manures (FYM)
Table 3. Trends in the yields of rice and wheat in a long-term rice-wheat system under different nutrient management options.
ParticularsAnnual Yield Changes aInitial Yield b (t ha−1)
b-Valuet-Statisticsp-ValueR2-Value
Rice
Control−0.06−6.98***0.831.84
RDF0.01−4.34***0.074.62
IPNS0.07−3.72***0.655.01
IPNS+B0.05−3.78***0.584.99
OF0.09−5.05***0.812.90
Wheat
Control−0.06−7.11***0.781.58
RDF−0.05−4.85***0.574.42
IPNS0.07−3.91***0.724.54
IPNS+C0.08−4.04***0.724.49
OF0.14−5.08***0.912.33
a computed from linear regression; b the intercept (a value) of the linear regression; *** significant at p < 0.001.
Table 4. Changes in rice, wheat and RWS productivity under different long-term nutrient management options during the initial and terminal years.
TreatmentsRice Yield (t ha−1)% ChangeWheat Yield (t ha−1)% ChangeRW System Yield (t ha−1) % Change
Initial Years aTerminal Years bInitial YearsTerminal YearsInitial YearsTerminal Years
Control2.01 c0.83 d−58.71.81 d0.77 d−57.53.82 c1.60 c−58.1
RDF4.96 a4.88 b−1.64.37 b3.57 c−18.359.33 a8.45 b−9.4
IPNS5.09 a6.13 a20.44.60 ab5.85 a27.29.69 a11.98 a23.6
IPNS+B5.13 a6.27 a22.24.65 a6.18 a32.99.78 a12.44 a27.2
IPNS+C5.09 a6.27 a23.24.59 ab6.14 a33.89.68 a12.41 a28.2
OF2.60 b4.23 c62.72.15 c4.48 b108.44.75 b8.71 b83.4
a Average of 1998–1999 and 1999–2000; b average of 2016–2017 and 2017–2018.
Table 5. Effects of different nutrient management options on the soil organic carbon (SOC) content (g kg−1) at soil depths of 0–15 and 15–30 cm after 5 RWS cycle intervals.
Treatment2002–20032007–20082012–20132017–2018Mean2002–20032007–20082012–20132017–2018Mean
0–15 cm Depth15–30 cm Depth
Control4.7 cA4.3 cAB3.9 cB3.3 dC4.1 c3.0 cA2.8 bA2.8 eA2.6 dA2.8 d
RDF5.2 bA5.1 bA5.3 bA5.4 cA5.3 b3.2 aA3.4 aA3.5 cA3.7 bcA3.5 c
IPNS5.6 abB5.8 aAB6.0 aAB6.2 bA5.9 a3.6 aA4.0 aB4.2 dB4.4 cB4.1 b
IPNS+B5.5 abC5.9 aBC6.2 aAB6.4 bA6.0 a3.9 b4.7 aB5.0 aA5.3 aAB4.7 a
IPNS+C5.5 abB5.8 aB6.4 aA6.4 bA6.0 a4.0 a4.5 aB5.1 aA5.4 aA4.8 a
OF5.8 aC6.4 aBC6.9 aB7.1 aA6.6 a3.3 c3.8 aA4.0 bcA4.2 bA3.8 bc
Values followed by different lower case letter(s) within a column are significant at p < 0.05. Values followed by different capital letter(s) within a row are significant at p < 0.05.
Table 6. Effects of different nutrient management options on soil Olsen-P (mg kg−1) at soil depths of 0–15 and 15–30 cm after 5 RWS cycle intervals.
Treatment2002–20032007–20082012–20132017–2018Mean2002–20032007–20082012–20132017–2018Mean
0–15 cm Depth15–30 cm Depth
Control8.0 eA7.6 dAB7.1 eAB6.9 dB7.4 d5.6 cA4.9 eB4.9 dB3.9 eC4.8 eB
RDF13.0 aD15.9 aC19.7 aB21.9 aA17.6 a6.3 bD8.5 aC10.9 aB13.6 aA9.8 aC
IPNS11.7 bD13.9 bC15.9 bB17.7 bA14.8 b7.3 aC7.4 bC8.4 bB9.2 bA8.1 bB
IPNS+B8.9 deD11.3 cC13.7 dB15.9 cA12.5 c5.3 cAB5.7 dA4.8 dBC4.7 dC5.1 deB
IPNS+C10.0 cdD12.1 cC14.3 cdB16.0 cA13.1 c6.0 bcA6.0 cdA5.1 dB4.9 dB5.5 dA
OF12.7 aD14.1 aC17.2 bcB18.2 bA15.6 b6.5 bAB6.4 cB6.9 cA6.8 cAB6.6 cAB
Values followed by different lower case letter(s) within a column are significant at p < 0.05. Values followed by different capital letter(s) within a row are significant at p < 0.05.
Table 7. Effects of different nutrient management options on the soil exchangeable K content (mg kg−1) in at soil depths of 0–15 and 15–30 cm after 5 RWS cycle intervals.
Treatment2002–20032007–20082012–20132017–2018Mean2002–20032007–20082012–20132017–2018Mean
0–15 cm Depth15–30 cm Depth
Control69.1 bA67.1 bA64.7 bA61.9 dA65.7 b64.7 bAB62.5 bA60.6 cAB58.1 cB61.5 b
RDF70.5 bA65.2 bA61.2 bA58.9 dA64.0 b65.8 bA62.2 bAB59.9 cAB56.2 cB61.0 b
IPNS83.0 aC91.3 aAB96.5 aAB106.4 bcA94.3 a69.9 abC76.0 aB79.3 bAB86.2 bA77.9 a
IPNS+B82.3 aC92.0 aB98.2 aB104.5 abA94.3 a67.5 abC75.9 aB79.9 abB85.7 abA77.3 a
IPNS+C82.4 aB92.6 aA96.7 aA101.4 cA93.3 a69.5 abB76.8 aA80.6 abA84.0 bA77.7 a
OF87.3 aC94.6 aB99.4 aB109.6 aA97.7 a72.0 aC79.8 aB84.7 aB90.4 aA81.7 a
Values followed by different lower case letter(s) within a column are significant at p < 0.05. Values followed by different capital letter(s) within a row are significant at p < 0.05.
Table 8. Effects of different nutrient management options on the soil available S content (mg kg−1) at soil depths of 0–15 and 15–30 cm after 5 RWS cycle intervals.
Treatment2002–20032007–20082012–20132017–2018Mean2002–20032007–20082012–20132017–2018Mean
0–15 cm Depth15–30 cm Depth
Control11.0 dA10.4 eAB9.6 dBC8.7 dC9.9 d8.1 cA7.8 dA7.9 dA7.5 dA7.8 d
RDF10.9 dA9.8 eAB9.1 dBC8.3 dC9.5 d7.7 cA7.1 dAB6.9 dB6.3 dB7.0 d
IPNS16.0 bD19.2 bA22.9 bB25.2 bA20.8 b10.3 bD12.9 abC14.0 bB15.4 bA13.2 b
IPNS+B14.5 cD16.4 dA19.7 cB22.7 cA18.3 c9.9 bD11.6 cC12.6 cB14.3 cA12.1 c
IPNS+C15.1 bcC17.8 B22.0 bA23.1 cA19.5 c10.4 bD12.1 bcC13.5 bB14.6 bcA12.7 bc
OF18.2 aD22.1 aC28.3 aB30.6 aA24.8 a11.5 aD13.7 aC15.0 aB17.2 aA14.4 a
Values followed by different lower case letter(s) within a column are significant at p < 0.05. Values followed by different capital letter(s) within a row are significant at p < 0.05.
Table 9. Effects of different nutrient management options on soil DTPA extractable Zn content (mg kg−1) at soil depths of 0–15 and 15–30 cm after 5 RWS cycle intervals.
Treatment2002–20032007–20082012–20132017–2018Mean2002–20032007–20082012–20132017–2018Mean
0–15 cm Depth15–30 cm Depth
Control0.48 bA0.43 bAB0.40 cBC0.37 cC0.42 b0.41 bA0.39 bA0.37 cAB0.34 bB0.38 b
RDF0.67 aB0.70 aB0.83 abA0.87 bA0.77 a0.51 aB0.54 aB0.60 abA0.62 aA0.57 a
IPNS0.65 aB0.70 aB0.80 bA0.84 bA0.75 a0.48 aB0.51 aB0.56 bA0.60 aA0.54 a
IPNS+B0.67 aD0.73 aC0.87 aB0.93 aA0.80 a0.49 aB0.53 aB0.58 abA0.61 aA0.55 a
IPNS+C0.69 aB0.72 aB0.88 aA0.88 abA0.79 a0.50 aC0.55 aB0.61 aA0.64 aA0.57 a
OF0.51 bA0.44 bB0.40 cBC0.36 cC0.43 bB0.43 bA0.40 bA0.35 cB0.34 bB0.38 b
Values followed by different lower case letter(s) within a column are significant at p < 0.05. Values followed by different capital letter(s) within a row are significant at p < 0.05.

