Article

Exploiting Genetic and Genomic Resources to Enhance Heat-Tolerance in Tomatoes

by
Valentino Ruggieri
1,†,‡,
Roberta Calafiore
1,‡,
Carlo Schettini
2,
Maria Manuela Rigano
1,
Fabrizio Olivieri
1,
Luigi Frusciante
1 and
Amalia Barone
1,*
1
Department of Agricultural Sciences, University of Naples Federico II, Portici, 80055 Naples, Italy
2
ALMA SEGES Soc. Coop., Eboli, 84025 Salerno, Italy
*
Author to whom correspondence should be addressed.
Current Address: CRAG Centre for Research in Agricultural Genomics CSIC-IRTA-UAB-UB, 08193 Barcelona, Spain.
These authors contributed equally to this work.
Agronomy 2019, 9(1), 22; https://doi.org/10.3390/agronomy9010022
Submission received: 30 November 2018 / Revised: 22 December 2018 / Accepted: 4 January 2019 / Published: 8 January 2019
(This article belongs to the Special Issue Genetics and Genomics of Tomato and Solanaceae)

Abstract

:
High temperature is one of the most detrimental abiotic stresses in tomatoes. Many studies highlighted that even small increases in temperature can alter the plant reproductive system, causing a significant reduction in tomato yield. The aim of this study was to exploit the phenotypic and genomic variations of a tomato landrace collection grown at high temperatures. Fifteen genotypes were selected as the best performing in two experimental fields. The selection was based on six yield-related traits, including flower earliness, number of flowers per inflorescence, fruit set, number of fruit per plant, fruit weight and yield per plant. In order to identify markers targeting traits that could be highly influenced by adverse climate conditions, such as flowering and fruit setting, an association mapping approach was undertaken exploiting a tomato high-throughput genomic array. The phenotypic variability observed allowed us to identify a total of 15 common markers associated with the studied traits. In particular, the most relevant associations co-localized with genes involved in the floral structure development, such as the style2.1 gene, or with genes directly involved in the response to abiotic stresses. These promising candidate genes will be functionally validated and transferred to a cultivated tomato to improve its performance under high temperatures.

1. Introduction

Global climate change and growing food demand have become two of the major challenges faced by humans in the last few years. The predicted increase of global warming [1,2] poses a large risk for crop productivity and imposes the urgent development of strategies to substantially improve food availability. High temperature is a major abiotic stress compromising productivity and stability of several crops, mostly due to the modification of plant life cycle stages. This is a consequence of the alteration of a number of basic molecular processes, such as protein folding, maintenance of membrane stability, photosynthesis and assimilate metabolism [3]. Although plants possess various mechanisms to ensure survival under elevated temperatures, even a small temperature increase (1.5 °C) can have a significant impact on the processes related to reproductive development, negatively affecting fruit set and crop yield [4]. Heat-induced yield reduction was documented in many cultivated crops including cereals (e.g., rice, wheat, barley, sorghum and, maize), pulses (e.g., chickpea and, cowpea), oil crops (e.g., mustard and, canola) and vegetables, as reviewed by Hasanuzzaman and colleagues [5]. In the tomato, which is an important horticultural crop grown for fruit production worldwide, high temperatures can negatively affect the vegetative and reproductive growth phases, resulting in up to 70% tomato harvest losses [6]. Indeed, it has been reported that for tomatoes, when the temperature exceeds 35 °C, seed germination, seedling and vegetative growth, flowering and fruit set, as well as fruit ripening, are adversely affected. For these reasons, new strategies need to be developed in order to limit the negative impact of high temperatures on field-grown tomatoes, in particular in tomato-producing countries, such as the South of Italy, that will likely experience increases in the mean temperatures in the near future due to global warming. Besides the choice of the best management practices, the selection of heat tolerant genotypes could work to mitigate the decrease of tomato yeild grown under unfavourable temperatures. Since the response to heat stress is a very complex genetic trait, molecular markers targeting quantitative trait loci (QTLs) and genes involved in the heat tolerance might aid the selection of genotypes tolerant to high temperatures.
In the past few years, conventional breeding schemes have been extensively deployed to identify genes involved in heat tolerance and their inheritance patterns, and to unravel their underlying molecular mechanisms [7,8]. DNA marker discovery and genotyping assays have permitted the determination of chromosomal positions of the QTLs controlling heat tolerance in different crops, including tomato [9,10,11] rice [12] and cowpea (Vigna unguiculata L.) [13]. However, these identifications using conventional linkage studies are time-consuming and only allow for exploring the variability present in the two parental lines. The natural variation in heat tolerance exhibited by different tomato cultivars can be better exploited to detect useful alleles by association mapping approaches that constitute a powerful tool for identifying promising regions or candidate genes involved in heat tolerance [14].
The aim of this work was to exploit a collection of tomato landraces to identify the best performing genotypes growing under high temperatures. The landraces analysed in this study were previously genotyped using the 7.7K SolCAP high-throughput genomic platform available for tomato [15,16]. Herein an association mapping study was also performed in order to detect markers targeting genomic regions potentially involved in the control of yield-related traits under high temperatures. The combination of the genetic and genomic resources used in the present work enabled the selection of promising landraces for cultivation under high temperatures and the identification of molecular markers suitable for screening heat tolerant genotypes. Our results will help in the setting-up of superior tomato genotypes better adapted to high temperature conditions in the near future.

2. Materials and Methods

2.1. Material and Plant Growth

Eighty-one tomato landraces, belonging to a collection available at the University of Naples Federico II, Department of Agricultural Sciences (details hosted at LabArchive repository http://dx.doi.org/10.6070/H4TT4NXN.), were grown in 2016 in two different experimental fields. This collection included 36 landraces from Italy, 26 landraces from South America countries, and 19 landraces from other European and worldwide regions.
All genotypes were grown in a completely randomized design with three replica and 10 plants per replica in two Southern Italy regions (Giugliano–Campania 40°55′54″ N latitude, 14°11′44″ E longitude, and Pulsano–Puglia 40°23′03″ N latitude, 17°21′17″ E longitude), usually characterized by high temperatures during the flowering and fruit set periods (from June to August). Seeds were sown in plateau under plastic-house and then seedlings were transplanted in open fields in the second-half of May. Tomato plants were grown following the standard cultural practices of the area. Tomato plants grown in the South of Italy are usually transplanted in open fields in April. However, in this study, in order to expose growing plants to high temperatures, the genotypes were transplanted in open fields located in two different regions of Southern Italy with a delay of one month compared to the usual transplanting period, thus imposing a high-temperature condition during flowering and fruit setting.
During the whole growing period climatic data were recorded using the weather station VantagePro2 from Davis Instrument Corp.

2.2. Traits Evaluation and Statistical Analysis

Traits related to flowering and fruit production were evaluated in all genotypes grown in the two experimental fields. Flower earliness (FRL) was recorded as days from sowing when at least one open flower was observed on 5 out of 10 plants of each biological replicate. The average number of flowers per inflorescence (NFL) and the percentage of fruit set (FS) were evaluated on inflorescences produced from the second to the fifth truss on three plants for each biological replicate randomly chosen. Finally, at fruit red ripe stage, total fruit number (TFN) and fresh weight (FW) were measured; these last measurements allowed us to evaluate the yield production per plant (YP).
For each trait, the normal distribution of data was verified using a Shapiro-Wilk test and for all traits, apart from FS, a log10 transformation was applied in order to better fit a normal distribution. The extent of environment by genotype interactions was assessed by a two-factor ANOVA. All the analyses were carried out using the software SPSS statistics 24.0 (IBM Corp., Armonk, NY, USA). Finally, a Selection Index (SI) was calculated by assigning to three traits (FS, TNF, YP) the following arbitrary scale: for FS and TNF, 0 = trait value ranging from 0 to 10, 1 = from 11 to 20, 2 = from 21 to 30, 3 = from 31 to 40 etc.; for YP, the scale was applied by multiplying the kg/plant value by 10, thus giving greater weight to yield.

2.3. Association Mapping Analysis

Genotypic data were retrieved from previous studies carried out at the Department of Agricultural Sciences, University of Naples Federico II [15,16], which used the 7.7K SolCAP single nucleotide polymorphism (SNP) array on the same germplasm collection evaluated in the present study (data hosted at NCBI dbSNP section as “SOLCAP_TOM_LAND” project). In order to reduce false positive associations, only SNPs showing a Minor Allele Frequency (MAF) >10% and missing values <10% were retained. In addition, since a high rate of homozygous variants are expected [17] in tomatoes, the heterozygous ones were excluded. Filtering and manipulation of genotypic data were performed using vcftools [18], TASSEL 5 [19] and some in house scripts.
To assess the genetic relationships of the investigated collection, the population structure was determined by using the STRUCTURE 2.3.4 software (Pritchard Lab, Stanford University, Stanford, CA, USA) [20], with no a priori information regarding population origin. The degree of admixture was estimated by setting for both burn-in period and Markov Chain Monte Carlo iterations a value of 50,000 for each run. Seven independent runs across a range of K values (K = 1–12) were made. The best number of clusters (K) was obtained using STRUCTURE HARVESTER program [21] based on the Evanno method [22]. Associations between genotypes and phenotypes were determined using the Mixed Linear Model (MLM) as implemented in TASSEL 5. Significant associations were detected for p-value lower than 1−3. If no association was detected for a trait in one of the two trials, associations with a higher p-value were further explored. In the association analysis, we considered both the kinship matrix based on the SNP data and the population structure covariates detected by the STRUCTURE analysis.
Different databases were exploited to find candidate genes related to flowering mechanisms and heat stress. For instance, the FLOR-ID database [23] was exploited to detect candidate genes related to flowering. Heat-stress section of the STIFDB V2.0 database [24] was also taken into account for identifying candidate genes involved in the heat stress response. The corresponding tomato homolog genes were detected by blast approach, filtering out matches with p-value >1−10, query coverage <60% and similarity <60%. In addition, genes related to fruit shape and weight were retrieved from previous studies carried out in tomatoes [15,16,25]. IntersectBed [26] was used to detect genes of tomatoes (iTAG3.2) falling in an interval of ±500 kbp from the associated marker.

3. Results and Discussion

Extreme temperature is one of the most detrimental abiotic stresses during the plant reproductive phase. Indeed, reduced final yields due to high temperatures experienced by plants during flowering have been reported for many plant species [27,28]. In particular, high temperatures during flowering of crops normally used for human consumption may have a large impact on global food production, and this effect will likely increase in the coming years because of the expected climatic changes. For example, in the year 2000, 15% of the global harvested area of maize (Zea mays L.) was exposed to at least five days of heat stress during the flowering period, and by 2050 this area is expected to increase to 44% [2]. Plant breeding for tolerance to heat stress will play a crucial role to face this challenge. To achieve this goal, it is crucial to identify the natural range of variation within species and gain a profound understanding of the mechanisms controlling the molecular processes in plant tolerance to heat stress.
In this study, a tomato landraces collection of 81 genotypes, previously characterized for morphological traits and metabolites content in the mature fruit [15,16], was grown under high temperatures. The majority of the landraces used in this study originated from regions often characterized by high temperatures during the growing season and represent high variability in terms of plant habit, fruit morphology (Figure 1) and market destination. Tomato plants grown in the South of Italy are usually transplanted in open fields in April. However, in this study the genotypes were transplanted in open fields located in two different regions of Southern Italy with a delay of one month compared to the usual transplanting period, thus imposing a high-temperature condition during flowering and fruit setting. The variation of maximum temperatures over July and August 2016 is reported in Figure 2. From this figure is possible to observe that a similar trend of temperature variation was recorded in the two fields, except for a 15-days window (from the 23rd of July to the 6th of August) where the maximum temperature in Pulsano showed an increase of 2–4 °C compared to the temperatures recorded in Giugliano. As a whole, the maximum temperatures recorded in both fields, even with some discrepancy along some periods, were sufficiently elevated to analyse the response to high temperature conditions of the landraces investigated in this study. Indeed, maximum temperatures of 32 °C and 26 °C, during the day and during the night, respectively, represent critical thresholds in the sensitive stages of reproductive development [29]. In our trials these temperatures were frequently exceeded.

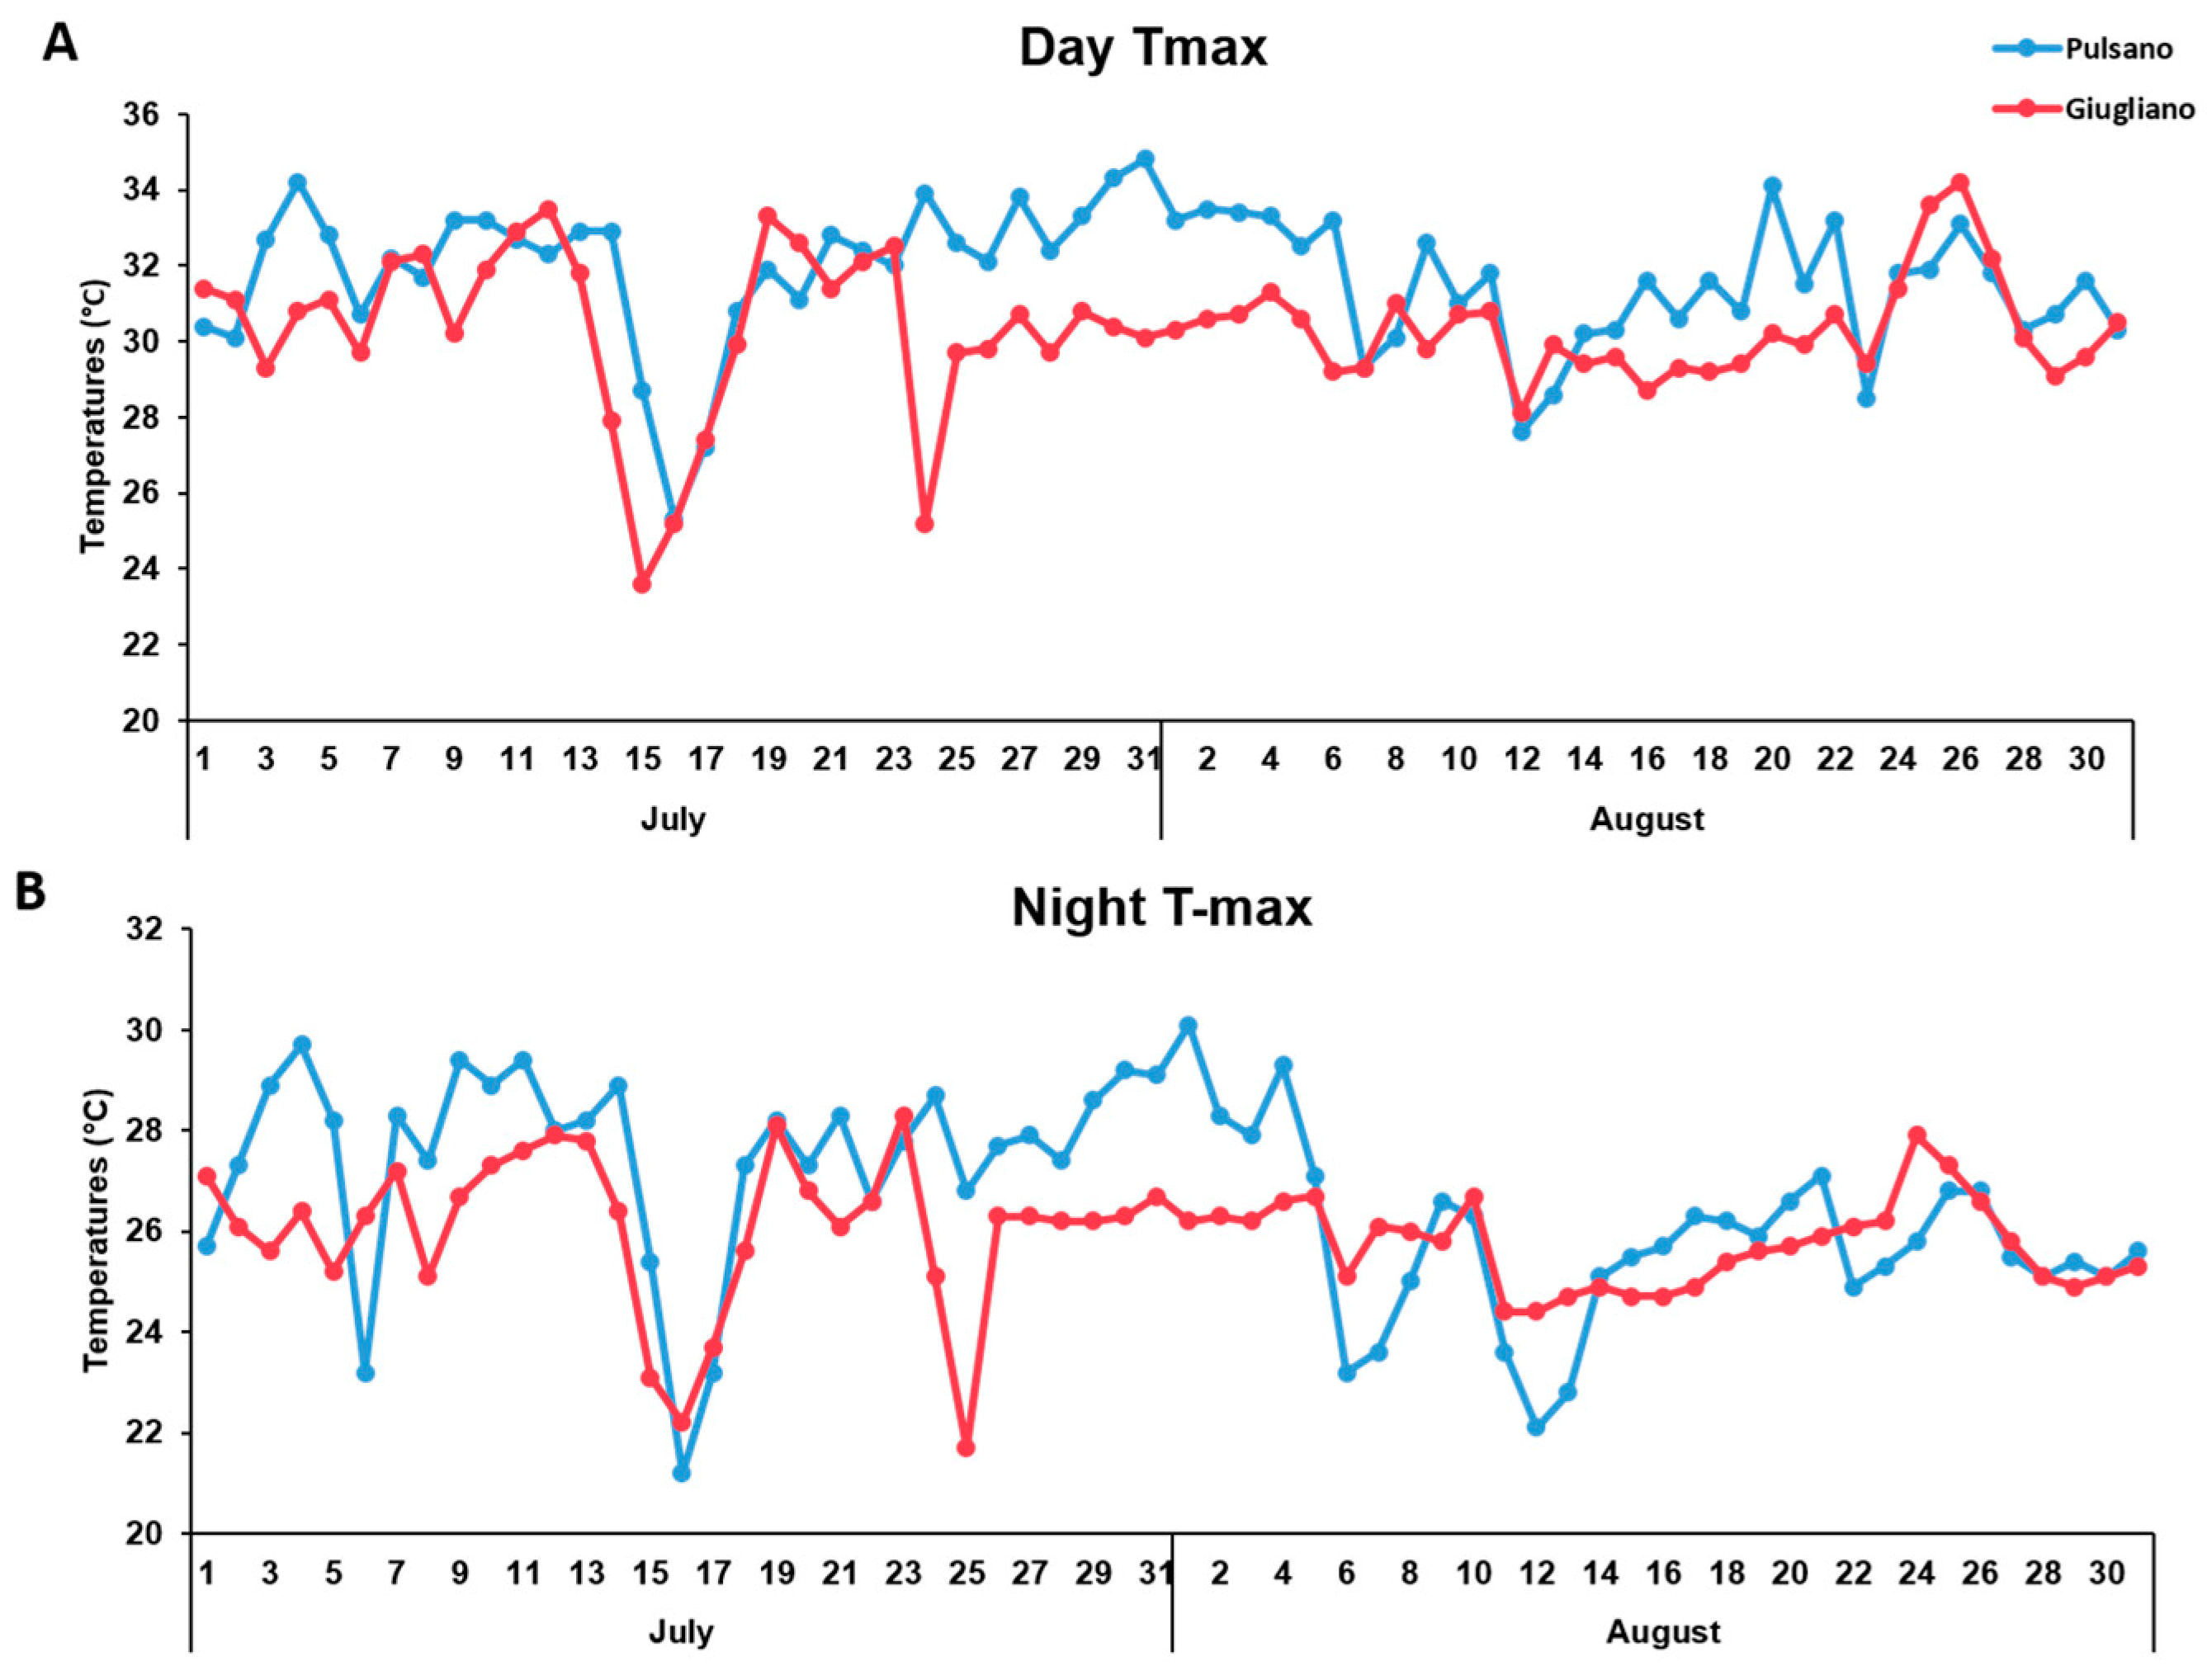
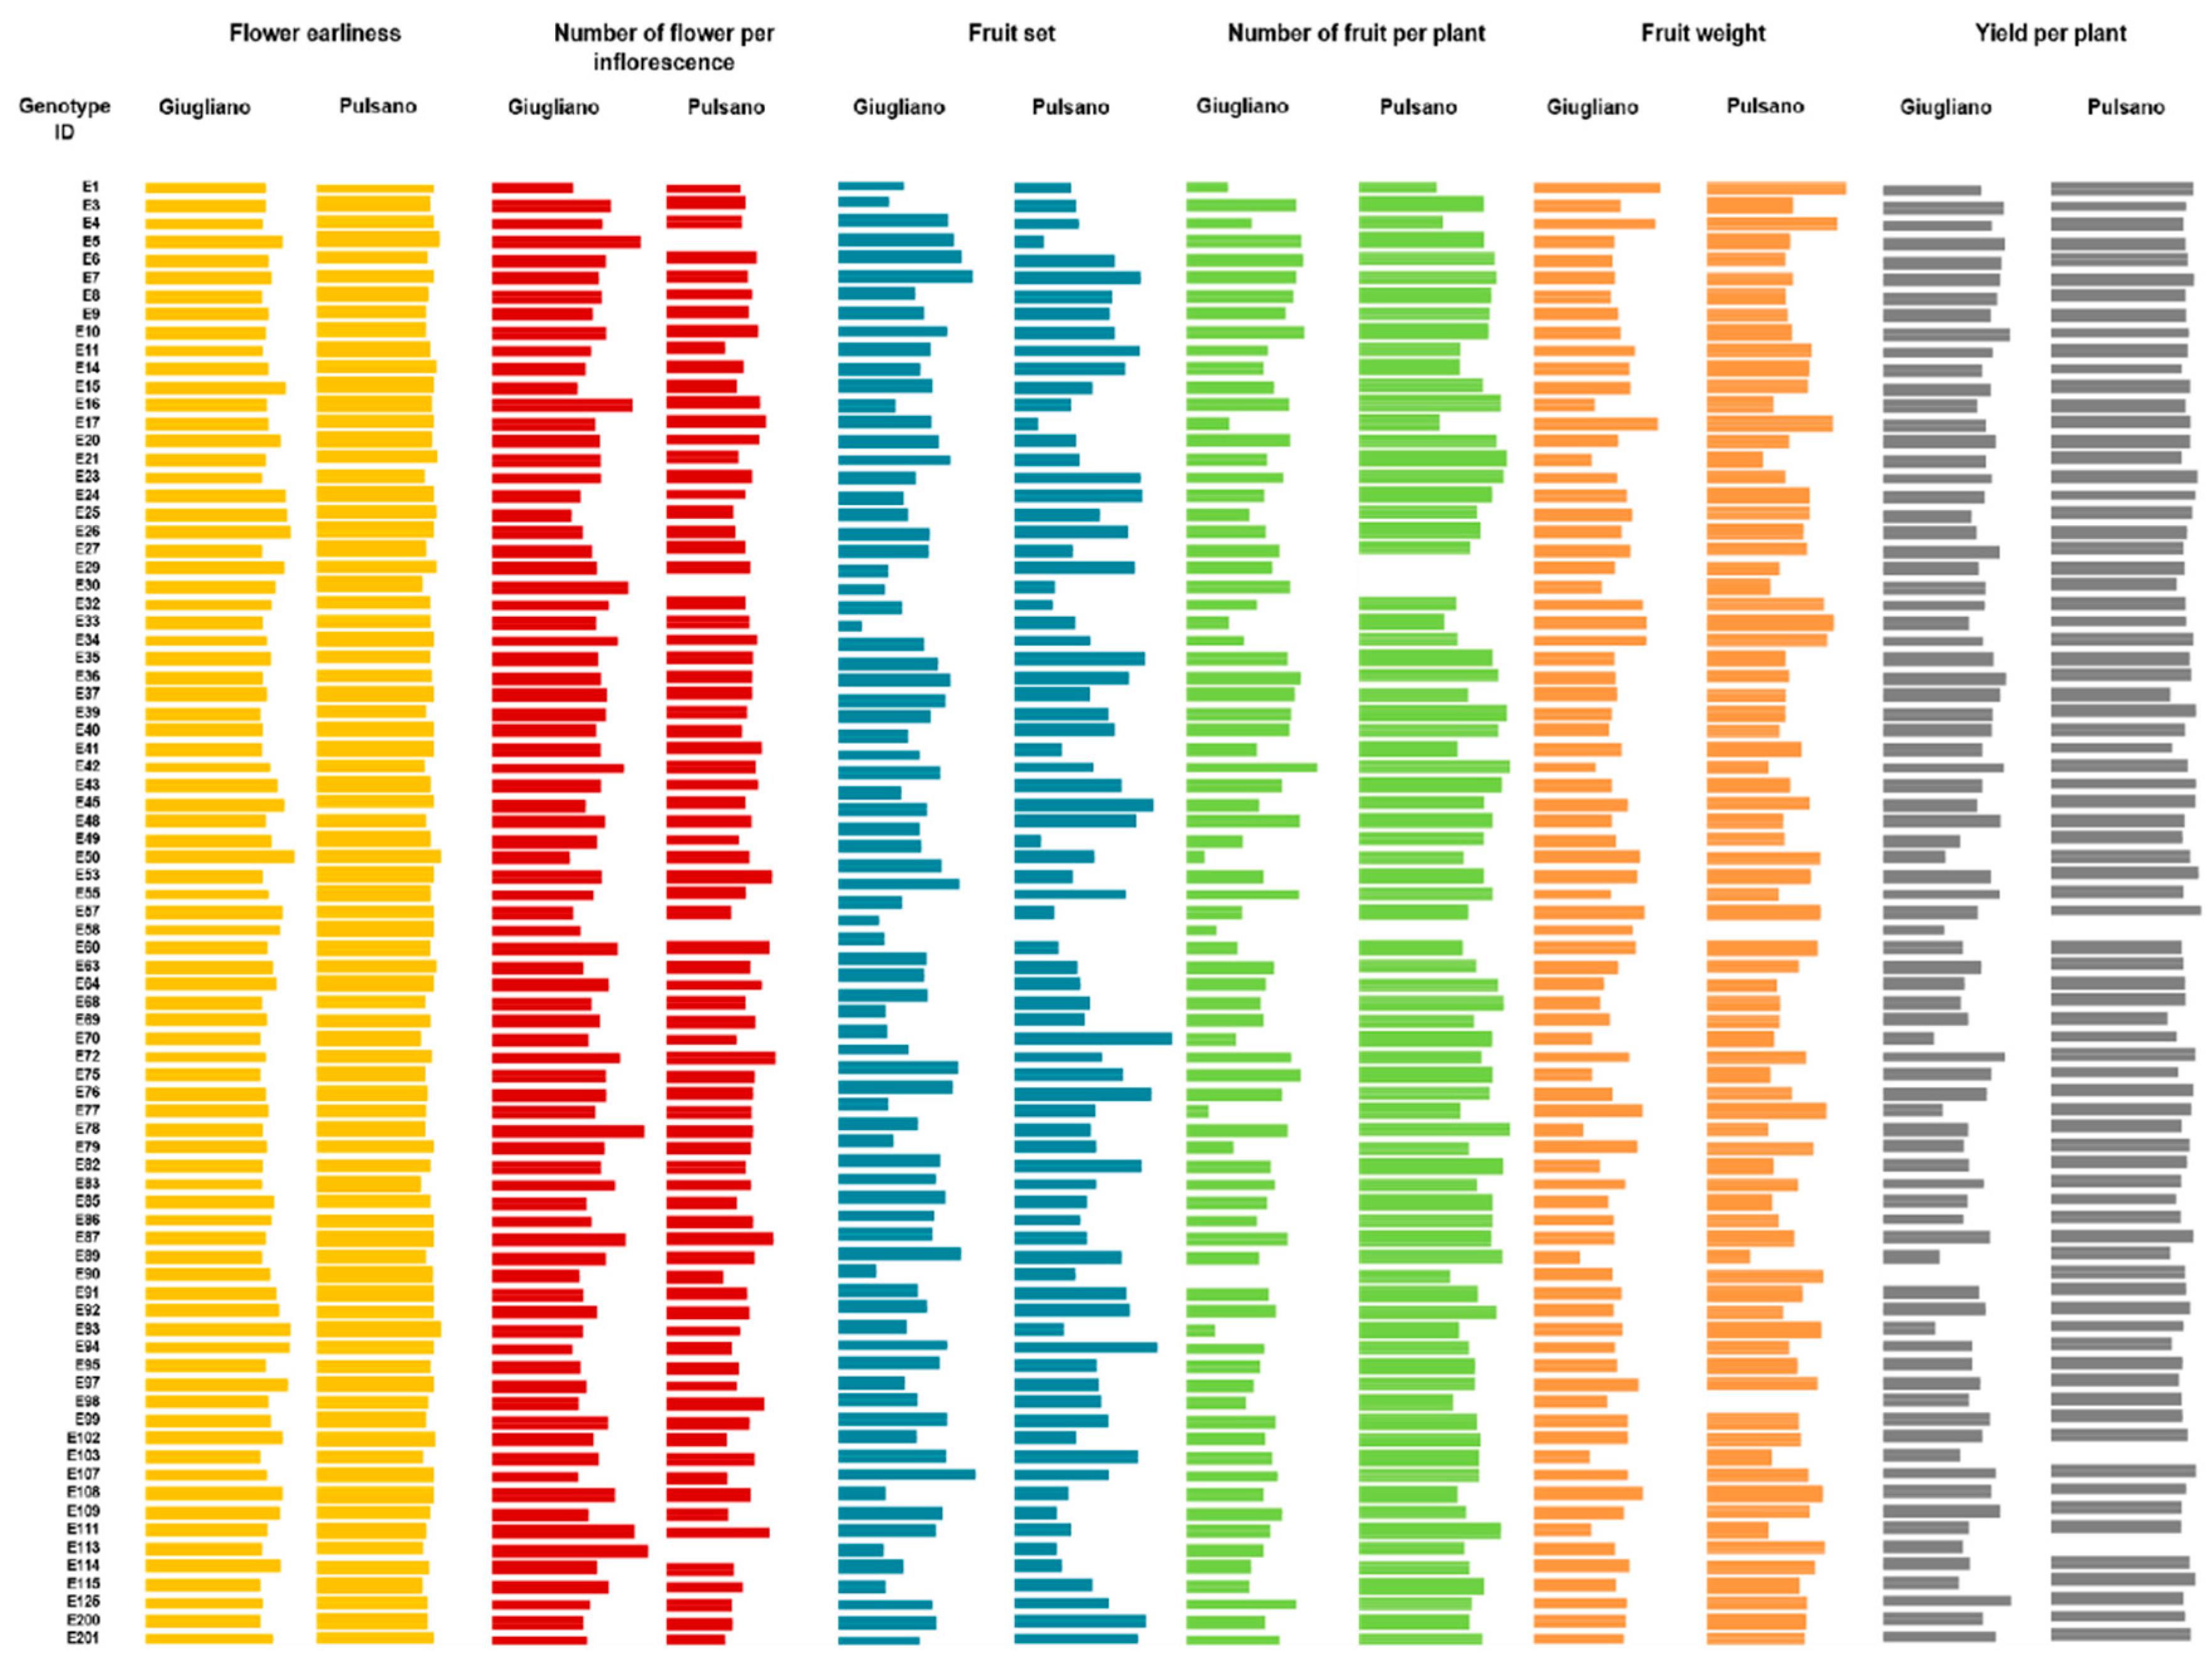
3.1. Phenotypic Evaluation

The tomato landraces grown under high temperature conditions were phenotyped for six traits related to flower and fruit set, and for productivity. Mean data related to all the traits measured on plants grown in the two experimental fields are reported in the Supplementary Table S1, and summarized in Table 1 and Figure 3. ANOVA revealed that there were significant differences (p < 0.05) among tomato genotypes, growing locations, and their interaction, thus highlighting that the environment deeply influenced all the traits under study. As a whole, flower earliness in the experimental field located in Giugliano was anticipated compared to the experimental field located in Pulsano, with the number of days from sowing ranging from 56 to 72 in the former and from 63 to 75 in the latter (Table S1). This was probably due to the different soil composition, which may have consequently influenced the complete root development time.
Fruit set, which usually is a trait deeply influenced by high temperatures in tomatoes [29,30,31], as well as in other species [32,33,34], was highly variable in both experimental fields. The 48% and 53% of genotypes in Pulsano and Giugliano fields, respectively, showed a fruit set percentage higher than 50%. Since most genotypes analysed in this study have indeterminate plant growth, their flowering period extended from June to August in both experimental fields, and consequently fruit set was subjected to a wide range of different temperatures. However, notwithstanding the higher temperatures recorded in Pulsano for at least 15 days (Figure 2), 11 out of 81 (14%) genotypes showed very high percentages of fruit set in this field (FS > 75%), thus revealing that high temperature was probably not the only environmental factor affecting this trait in our conditions. Consistent with the higher fruit set observed in Pulsano, the number of fruit per plant was generally higher in this field; it ranged from 0 to 24 fruits/plant for about 21% of genotypes, with 19% of genotypes producing more than 100 fruits/plant. By contrast, from 0 to 24 fruits/plant were estimated for about 80% of genotypes grown in Giugliano. Observing the correlation values among the six traits (Table S2), we detected a negative correlation (−66% and −37%, in Pulsano and Giugliano, respectively) between TNF and FW, thus evidencing that a lower number of fruit produced increased fruit weight, probably by altering the local competition for photosynthesis products.
The total number of fruit, combined with fruit weight, resulted in the final production of each genotype measured as kilos per plant. As shown in Table 1, fruit weight was a trait highly variable among the 81 genotypes, depending on fruit morphology and size. In our collection, the typology of fruit ranged from small to very big. When the total yield was measured as kilos produced by each plant, a higher production was generally observed in Pulsano, with mean values ranging from 0.5 kg/plant to more than 4.6 kg/plant, whereas a lower production was recorded in Giugliano, with values ranging from 0.02 kg/plant to 1.4 kg/plant.
Finally, in order to select the best performing genotypes under high temperatures, a Selection Index (SI) was calculated for each genotype and for each experimental field considering the three traits FS, TNF and YP. This index varied from 1 (genotype E70) to 22 (E42) for genotypes grown at Giugliano, and from 13 (E41) to 55 (E23) for those grown in Pulsano. This analysis allowed us to select 15 best performing genotypes that fell in the upper right quadrant of the scatter plot shown in Figure 4, since they combined higher SI scores in both experimental fields. These genotypes will be further evaluated in more experimental trials carried out under high temperatures, in order to confirm their higher performances in facing heat stress.

3.2. Association Mapping

In the present work, we performed an association mapping on a wide germplasm collection by screening it for traits that mainly affect yield (FRL, NFL, FS, TNF and, FW) in a condition of heat constrain. The discovery of markers associated with some of these traits would allow us to dissect the heat response in factors that influence the yield of tomatoes grown under adverse environmental conditions. Therefore, we searched for polymorphisms in the genome of our landraces with the aim of associating some SNPs with the traits analysed from flowering to fruit maturity.
The genotyped variants used in this study accounted for 1800 polymorphic SNPs distributed across the 12 tomato chromosomes. An evaluation of the structure of the population was also inferred in order to model the association test by using the co-ancestry values for each individual. In accordance with previous works [15,35,36], the best number of sub-populations was inferred to be K = 3 (Figure S1) and the corresponding values were used as a covariate in the Mixed Linear Model. Since the ANOVA test evidenced a significant genotype x environment interaction for all traits, the marker-traits associations were calculated separately across the two different environmental fields located in Giugliano and Pulsano (Figure S2). As summarized in Table 2, a higher number of associations were detected for FRL, TNF and FW, whereas fewer associations were detected for, NFL, FS and YP. No association was detected for FS and NFL in Pulsano.
As a whole, 35 marker-trait associations were detected, which map into 17 genes and 5 inter-genic regions, since some of them mapped in the same gene and/or region. Among markers associated with the analysed traits, 13 were detected in both experimental fields, and these common markers were considered more reliable to target genes and/or regions involved in the control of mechanisms related to heat stress (Table 3). In particular, based on their functional annotation (iTAG3.2), the targeted genes Solyc01g008350 and Solyc03g123800 may be directly involved in the heat tolerance response, being annotated as heat shock protein DnaJ and SlMAPKK2, respectively. The former is a protein functioning as a molecular chaperone and is a key component responsible for protein folding, assembly, translocation, and degradation under stress conditions [37], while the latter is part of the MAPKK gene family known to be involved in the response to various biotic and abiotic stresses in plants [38]. In particular, polymorphisms detected in the DNAJ-heat shock gene among the landraces analysed may influence the different TNF produced by the groups of genotypes exhibiting high and low TNF values.
As for the other associated markers, in order to identify genes co-localized with them and putatively affecting the traits under study, an exploration of genes surrounding a region of approximately ±500 kbp was performed, since in previous studies carried out in tomatoes [15,16,36] this was the detected average distance for LD decay. Table 3 reports the QTLs and/or candidate genes linked to the common associated markers. Associations were mainly found on chr01 and chr03, in accordance with a recent study by Xu et al. [11], who also identified most of the QTLs for heat tolerance in tomato mapping on chr01, chr02 and chr03.
Marker solcap_snp_sl_18195 was associated with the NFL trait: an exploration of possible candidate genes around this common locus allowed detecting the gene Solyc08g067050 coding for an arginine methyltransferase protein (PRMT). This gene is homologous to AT1G04870 (82.7% of positives), which is reported to be involved in flower development in the FLOR-ID DB, a database of flowering-time gene network in Arabidopsis [23].
Fruit setting (FS) also represents a sensible step under abiotic stress condition, and it can directly affect the total number of fruit (TNF). Although the cultivated crops are widely adapted to grow in many areas of the world, some developmental stages are very sensitive to environmental stresses, such as temperature fluctuations occurring during anther and pollen development [39,40]. Such vulnerability is considered an important factor for the failure of setting fruits under high temperatures. It is noteworthy that our association study detected a marker (solcap_snp_sl_20344) strongly associated with both FS and TNF traits. The marker closely co-localizes (17.2 kbp) with the gene style2.1 (Solyc02g067380), which encodes a putative transcription factor regulating cell elongation in developing styles and represents a major quantitative trait locus responsible for style length [41]. Style2.1 is one of the five genes composing the complex locus se2.1 on chr02 in tomato [42]. The other four genes included in the se2.1 locus control stamen length (three genes) and the conditioning of anther dehiscence (one gene). Our association results reported that this marker could have a relevant effect on both the fruit setting process and (consequently) the total number of fruit per plant. Interestingly, in a recent work aimed at mapping QTLs for heat tolerance in tomato [11], the authors found QTLs in the same region on chr02, further corroborating the involvement of this locus in the heat tolerance response. Further studies will ascertain the contribution and the stability of this locus under high temperature growing conditions.
It has been demonstrated that fruit weight (FW) is a quantitatively inherited trait that is highly genetically determined and is controlled by up to 28 QTLs, even though most (67%) of the phenotypic variation in fruit size could be attributed to only six major loci (fw1.1, fw1.2, fw2.1, fw2.2, fw3.2 and fw11.3) [43,44]. In this study, among the 15 markers detected and confirmed in both fields, six are present on chr03 and co-localize with two major QTLs, fw3.2 and fw3.3, and with a group of genes controlling fruit shape. Co-localization of another marker (marker solcap_snp_sl_59728) concerns a gene homolog to YABBY (Solyc12g009580) and SUN (Solyc12g014130) on chr12.
Finally, only few significant associations were detected for YP under high temperatures growing conditions. Yield is a complex trait affected by several genetic factors [45], highly vulnerable to environmental fluctuations and highly dependent on other traits mainly related to a correct development of flower and fruit. A common association was identified in both fields with a marker (solcap_snp_sl_70992) mapping on chr07 and co-localizing with a minor QTL previously identified for yield in tomato (fd7.1 or ty7.1) [25]. Although this marker probably explains only a small part of the variability observed, it could be interesting for breeding purposes and further studies will be conducted to better evaluate and dissect this QTL.

4. Conclusions

Taking into account the recent projection of global warming and the significant efforts currently devoted to developing crops with improved tolerance, our findings could contribute to breeding heat-tolerant crops, which could be cultivated under high temperatures with no growth penalty. The 15 genotypes selected as best performing under high temperatures will be further tested by carrying out additional experimental trials in different environmental conditions. Each chromosomal region here identified by a genome-wide association study (GWAS) as a region carrying genes linked to traits related to fruit set and yield under high temperatures will be further investigated and the group of candidate genes detected in the present study will be functionally validated by exploiting TILLING collections or CRISPR-Cas9 mutants. The candidate genes confirmed to be involved in the heat-tolerance response could be then transferred to cultivated tomatoes to improve performances under high temperatures. Finally, the markers/genes associated with the investigated yield-related traits may be helpful in the future for assisting the selection of heat tolerant genotypes, to drive the pyramiding of favourable alleles, and to walk along the chromosomes in order to specifically detect the target gene.

Supplementary Materials

The following are available online at https://www.mdpi.com/2073-4395/9/1/22/s1, Table S1: Mean and standard error of data related to the six traits measured on each genotype during the growing season in the two experimental fields, Table S2: Pearson’s correlation among pair of traits in the two experimental fields (Pulsano and Giugliano), Figure S1: (A) Optimal K inferred by Structure Harvester (Evanno method), (B) Population structure; Each vertical bar represents one individual of the collection and each colour is proportional to the corresponding ancestry value inferred, Figure S2: Manhattan plots of GWAS analysis of the six evaluated traits in the two experimental fields (Pulsano and Gugliano).

Author Contributions

Conceptualization, A.B. and L.F.; Acquisition and analysis of data, R.C., F.O., C.S.; Statistic and bioinformatic analysis, V.R.; Data curation, R.C., M.M.R.; Writing—original draft preparation, V.R. and A.B.; Writing—review and editing, M.M.R.; Funding acquisition, A.B. and L.F.

Acknowledgments

The authors have received funding from the European Union’s Horizon 2020 research and innovation programme through the TomGEM project under grant agreement No 679796. VR was supported by the European Union’s Horizon 2020 research and innovation programme under Marie Skłodowska-Curie grant agreement No 6655919. The authors wish to thank Silvana Francesca, Mirko Francese and Vincenzo Fontanella for their technical support.

Conflicts of Interest

The authors declare no conflict of interest.

References

  1. Ainsworth, E.A.; Ort, D.R. How do we improve crop production in a warming world? Plant Physiol. 2010, 154, 526–530. [Google Scholar] [CrossRef] [PubMed]
  2. Gourdji, S.M.; Sibley, A.M.; Lobell, D.B. Global crop exposure to critical high temperatures in the reproductive period: Historical trends and future projections. Environ. Res. Lett. 2013, 8, 024041. [Google Scholar] [CrossRef]
  3. Bokszczanin, K.L. Perspectives on deciphering mechanisms underlying plant heat stress response and thermotolerance. Front. Plant Sci. 2013, 4, 315. [Google Scholar] [CrossRef] [PubMed]
  4. Warland, J.; McKeown, A.W.; McDonald, M.R. Impact of high air temperatures on Brassicacae crops in southern Ontario. Can. J. Plant Sci. 2006, 86, 1209–1215. [Google Scholar] [CrossRef] [Green Version]
  5. Hasanuzzaman, M.; Nahar, K.; Alam, M.M.; Roychowdhury, R.; Fujita, M. Physiological, biochemical, and molecular mechanisms of heat stress tolerance in plants. Int. J. Mol. Sci. 2013, 14, 9643–9684. [Google Scholar] [CrossRef]
  6. Sato, S.; Peet, M.M.; Gardner, R.G. Altered flower retention and developmental patterns in nine tomato cultivars under elevated temperature. Sci. Hortic. 2004, 101, 95–101. [Google Scholar] [CrossRef]
  7. Farooq, M.; Bramley, H.; Palta, J.A.; Siddique, K.H.M. Heat Stress in Wheat during Reproductive and Grain-Filling Phases. CRC Crit. Rev. Plant Sci. 2011, 30, 491–507. [Google Scholar] [CrossRef]
  8. Wahid, A.; Gelani, S.; Ashraf, M.; Foolad, M.R. Heat tolerance in plants: An overview. Environ. Exp. Bot. 2007, 61, 199–223. [Google Scholar] [CrossRef]
  9. Grilli, G.V.G.; Braz, L.T.; Lemos, E.G.M. QTL identification for tolerance to fruit set in tomato by FAFLP markers. Crop Breed. Appl. Biotechnol. 2007, 7, 234–241. [Google Scholar] [CrossRef]
  10. Xiang-yang, X.; Dong-mei, W.; Li-gong, K.; Jing-fu, A.L. Selection of SSR and RAPD Markers Related to Tomato Heat Tolerance. Acta Hortic. 2008, 35, 47–52. [Google Scholar]
  11. Xu, J.; Driedonks, N.; Rutten, M.J.M.; Vriezen, W.H.; de Boer, G.J.; Rieu, I. Mapping quantitative trait loci for heat tolerance of reproductive traits in tomato (Solanum lycopersicum). Mol. Breed. New Strateg. Plant Improv. 2017, 37, 58. [Google Scholar] [CrossRef] [PubMed]
  12. Ye, C.R.; Argayoso, M.A.; Redona, E.D.; Sierra, S.N.; Laza, M.A.; Dilla, C.J.; Mo, Y.; Thomson, M.J.; Chin, J.; Delavina, C.B.; et al. Mapping QTL for heat tolerance at flowering stage in rice using SNP markers. Plant Breed. 2012, 131, 33–41. [Google Scholar] [CrossRef]
  13. Lucas, M.R.; Ehlers, J.D.; Huynh, B.L.; Diop, N.N.; Roberts, P.A.; Close, T.J. Markers for breeding heat-tolerant cowpea. Mol. Breed. 2013, 31, 529–536. [Google Scholar] [CrossRef]
  14. Bergelson, J.; Roux, F. Towards identifying genes underlying ecologically relevant traits in Arabidopsis thaliana. Nat. Rev. Genet. 2010, 11, 867–879. [Google Scholar] [CrossRef] [PubMed]
  15. Ruggieri, V.; Francese, G.; Sacco, A.; D’Alessandro, A.; Rigano, M.M.; Parisi, M.; Milone, M.; Cardi, T.; Mennella, G.; Barone, A. An association mapping approach to identify favourable alleles for tomato fruit quality breeding. BMC Plant Biol. 2014, 14, 337. [Google Scholar] [CrossRef] [PubMed]
  16. Sacco, A.; Ruggieri, V.; Parisi, M.; Festa, G.; Rigano, M.M.; Picarella, M.E.; Mazzucato, A.; Barone, A. Exploring a Tomato Landraces Collection for Fruit-Related Traits by the Aid of a High-Throughput Genomic Platform. PLoS ONE 2015, 10, e0137139. [Google Scholar] [CrossRef] [PubMed] [Green Version]
  17. Ruggieri, V.; Anzar, I.; Paytuvi, A.; Calafiore, R.; Cigliano, R.A.; Sanseverino, W.; Barone, A. Exploiting the great potential of Sequence Capture data by a new tool, SUPER-CAP. DNA Res. 2016, 24, 81–91. [Google Scholar] [CrossRef]
  18. Danecek, P.; Auton, A.; Abecasis, G.; Albers, C.A.; Banks, E.; DePristo, M.A.; Handsaker, R.E.; Lunter, G.; Marth, G.T.; Sherry, S.T.; et al. The variant call format and VCFtools. Bioinformatics 2011, 27, 2156–2158. [Google Scholar] [CrossRef]
  19. Bradbury, P.J.; Zhang, Z.; Kroon, D.E.; Casstevens, T.M.; Ramdoss, Y.; Buckler, E.S. TASSEL: Software for association mapping of complex traits in diverse samples. Bioinformatics 2007, 23, 2633–2635. [Google Scholar] [CrossRef]
  20. Pritchard, J.K.; Stephens, M.; Donnelly, P. Inference of population structure using multilocus genotype data. Genetics 2000, 155, 945–959. [Google Scholar]
  21. Earl, D.A.; Vonholdt, B.M. Structure Harvester: A website and program for visualizing STRUCTURE output and implementing the Evanno method. Conserv. Genet. Resour. 2012, 4, 359–361. [Google Scholar] [CrossRef]
  22. Evanno, G.; Regnaut, S.; Goudet, J. Detecting the number of clusters of individuals using the software STRUCTURE: A simulation study. Mol. Ecol. 2005, 14, 2611–2620. [Google Scholar] [CrossRef] [PubMed]
  23. Bouche, F.; Lobet, G.; Tocquin, P.; Perilleux, C. FLOR-ID: An interactive database of flowering-time gene networks in Arabidopsis thaliana. Nucleic Acids Res. 2016, 44, 1167–1171. [Google Scholar] [CrossRef] [PubMed]
  24. Naika, M.; Shameer, K.; Mathew, O.K.; Gowda, R.; Sowdhamini, R. STIFDB2: An updated version of plant stress-responsive transcription factor database with additional stress signals, stress-responsive transcription factor binding sites and stress-responsive genes in Arabidopsis and rice. Plant Cell Physiol. 2013, 54, e8. [Google Scholar] [CrossRef] [PubMed]
  25. Hernandez-Bautista, A.; Lobato-Ortiz, R.; Cruz-Izquierdo, S.; Garcia-Zavala, J.J.; Chavez-Servia, J.L.; Hernandez-Leal, E.; Bonilla-Barrientos, O. Fruit size QTLs affect in a major proportion the yield in tomato. Chil. J. Agric. Res. 2015, 75, 402–409. [Google Scholar] [CrossRef]
  26. Quinlan, A.R.; Hall, I.M. BEDTools: A flexible suite of utilities for comparing genomic features. Bioinformatics 2010, 26, 841–842. [Google Scholar] [CrossRef]
  27. Bita, C.E.; Gerats, T. Plant tolerance to high temperature in a changing environment: Scientific fundamentals and production of heat stress-tolerant crops. Front. Plant Sci. 2013, 4, 273. [Google Scholar] [CrossRef]
  28. Hedhly, A. Sensitivity of flowering plant gametophytes to temperature fluctuations. Environ. Exp. Bot. 2011, 74, 9–16. [Google Scholar] [CrossRef] [Green Version]
  29. Sato, S.; Kamiyama, M.; Iwata, T.; Makita, N.; Furukawa, H.; Ikeda, H. Moderate increase of mean daily temperature adversely affects fruit set of Lycopersicon esculentum by disrupting specific physiological processes in male reproductive development. Ann. Bot. 2006, 97, 731–738. [Google Scholar] [CrossRef]
  30. Harel, D.; Fadida, H.; Slepoy, A.; Gantz, S.; Shilo, K. The Effect of Mean Daily Temperature and Relative Humidity on Pollen, Fruit Set and Yield of Tomato Grown in Commercial Protected Cultivation. Agronomy 2014, 4, 167. [Google Scholar] [CrossRef]
  31. Golam, F.; Prodhan, Z.H.; Nezhadahmadi, A.; Rahman, M. Heat tolerance in tomato. Life Sci. J. 2012, 9, 1936–1950. [Google Scholar]
  32. Shivanna, K.R.; Linskens, H.F.; Cresti, M. Responses of tobacco pollen to high humidity and heat stress: Viability and germinability in vitro and in vivo. Sex. Plant Reprod. 1991, 4, 104–109. [Google Scholar] [CrossRef]
  33. Erickson, A.N.; Markhart, A.H. Flower production, fruit set, and physiology of bell pepper during elevated temperature and vapor pressure deficit. J. Am. Soc. Hortic. Sci. 2001, 126, 697–702. [Google Scholar] [CrossRef]
  34. Saha, S.; Hossain, M.; Rahman, M.; Kuo, C.; Abdullah, S. Effect of high temperature stress on the performance of twelve sweet pepper genotypes. Bangladesh J. Agric. Res. 2010, 35, 525–534. [Google Scholar] [CrossRef]
  35. Mazzucato, A.; Papa, R.; Bitocchi, E.; Mosconi, P.; Nanni, L.; Negri, V.; Picarella, M.E.; Siligato, F.; Soressi, G.P.; Tiranti, B.; et al. Genetic diversity, structure and marker-trait associations in a collection of Italian tomato (Solanum lycopersicum L.) landraces. TAG Theor. Appl. Genet. 2008, 116, 657–669. [Google Scholar] [CrossRef] [PubMed]
  36. Sim, S.C.; Durstewitz, G.; Plieske, J.; Wieseke, R.; Ganal, M.W.; Van Deynze, A.; Hamilton, J.P.; Buell, C.R.; Causse, M.; Wijeratne, S.; et al. Development of a large SNP genotyping array and generation of high-density genetic maps in tomato. PLoS ONE 2012, 7, e40563. [Google Scholar] [CrossRef] [PubMed]
  37. Park, C.J.; Seo, Y.S. Heat Shock Proteins: A Review of the Molecular Chaperones for Plant Immunity. Plant Pathol. J. 2015, 31, 323–333. [Google Scholar] [CrossRef] [Green Version]
  38. Wu, J.; Wang, J.; Pan, C.; Guan, X.; Wang, Y.; Liu, S.; He, Y.; Chen, J.; Chen, L.; Lu, G. Genome-wide identification of MAPKK and MAPKKK gene families in tomato and transcriptional profiling analysis during development and stress response. PLoS ONE 2014, 9, e103032. [Google Scholar] [CrossRef]
  39. Erickson, A.N.; Markhart, A.H. Flower developmental stage and organ sensitivity of bell pepper (Capsicum annuum L.) to elevated temperature. Plant Cell Environ. 2002, 25, 123–130. [Google Scholar] [CrossRef]
  40. Giorno, F.; Wolters-Arts, M.; Mariani, C.; Rieu, I. Ensuring reproduction at high temperatures: The heat stress response during anther and pollen development. Plants 2013, 2, 489–506. [Google Scholar] [CrossRef]
  41. Chen, K.Y.; Cong, B.; Wing, R.; Vrebalov, J.; Tanksley, S.D. Changes in regulation of a transcription factor lead to autogamy in cultivated tomatoes. Science 2007, 318, 643–645. [Google Scholar] [CrossRef] [PubMed]
  42. Chen, K.Y.; Tanksley, S.D. High-resolution mapping and functional analysis of se2.1: A major stigma exsertion quantitative trait locus associated with the evolution from allogamy to autogamy in the genus Lycopersicon. Genetics 2004, 168, 1563–1573. [Google Scholar] [CrossRef] [PubMed]
  43. Causse, M.; Duffe, P.; Gomez, M.C.; Buret, M.; Damidaux, R.; Zamir, D.; Gur, A.; Chevalier, C.; Lemaire-Chamley, M.; Rothan, C. A genetic map of candidate genes and QTLs involved in tomato fruit size and composition. J. Exp. Bot. 2004, 55, 1671–1685. [Google Scholar] [CrossRef] [PubMed] [Green Version]
  44. Grandillo, S.; Ku, H.M.; Tanksley, S.D. Identifying the loci responsible for natural variation in fruit size and shape in tomato. Theor. Appl. Genet. 1999, 99, 978–987. [Google Scholar] [CrossRef]
  45. Ariizumi, T.; Shinozaki, Y.; Ezura, H. Genes that influence yield in tomato. Breed. Sci. 2013, 63, 3–13. [Google Scholar] [CrossRef] [PubMed] [Green Version]
Figure 1. Variability of fruit morphology exhibited by the tomato landraces used as genetic resources. The percentage of landraces belonging to each fruit type is reported.
Agronomy 09 00022 g001
Figure 2. Maximum temperatures recorded in the experimental fields located in Giugliano and Pulsano during the day (A) and the night (B) from June to August 2016.
Agronomy 09 00022 g002
Figure 3. Trend of variation of traits measured from flowering to fruit ripening in the tomato landrace collection. Each bar represents the mean of values of flower earliness, number of flowers per inflorescence, percentage of fruit set, total number of fruit, fruit weight and yield per plant. All trait values were log10 transformed to better fit a normal distribution, except than fruit set.
Agronomy 09 00022 g003
Figure 4. Selection Index (SI) estimated in the fields of Giugliano and Pulsano on 81 tomato landraces. The SI was calculated on FS, TNF and YP data collected in the two fields.
Agronomy 09 00022 g004
Table 1. Phenotypic variation of the six traits analysed in the tomato landraces collection. Mean (Mean), standard deviation (SD), minimum (Min) and, maximum (Max) values related to the two experimental fields (Giugliano and Pulsano) are reported.
Trait aGiuglianoPulsano
MinMaxMeanSDMinMaxMeanSD
FRL56.072.361.14.463.075.068.92.7
NFL5.943.512.26.23.892.77.99.6
FS13.778.448.514.814.395.351.418.8
TNF0.389.213.413.87.6175.160.140.6
FW7.4225.249.839.16.0328.761.456.8
YP0.021.480.450.370.544.632.300.81
a FRL = Flower earliness (days after sowing); NFL = Number of flowers per inflorescence; TNF = Total number of fruit per plant; FS = Fruit set (%); FW = Fruit weight (g) and YP = Yield per plant (kg).
Table 2. Overview of common and specific markers associated with the six traits analysed in the two experimental fields (Giugliano and Pulsano). The chromosome location (Chr.) is also reported.
TraitAssociated Markers (No.)Chr.
TotalCommonGiugliano SpecificPulsano Specific
FRL90631,3
NFL31203,4,8
FS32202,8
TNF83241,2,5,6,8
FW98013,5,6,12
YP31023,5,7
Table 3. Co-localization of common associated markers and candidate genes. For each marker, the SolCap ID, the Chromosome (Ch), the position on SL3.0 tomato genome assembly, the co-localized known quantitative trait loci (QTLs), the co-localized candidate genes (Associated CGs) and the corresponding distance from the associated marker as well as the functional description (CG predicted function) of each CG are reported.
TraitCommon MarkerCh.Marker Position (SL3.0)Associated QTLAssociated CGsCG/QTL Distance from MarkerCG Predicted Function
NFLsolcap_snp_sl_18195856,317,554 Solyc08g067050285 Kbpprotein arginine methyltransferase
FSsolcap_snp_sl_10567240,605,496 Solyc02g070430121 KbpGibberellic acid oxidase
FS/TNFsolcap_snp_sl_20344238,133,120 Solyc02g06738017.4 KbpStyle2.1
TNFsolcap_snp_sl_865512,381,257
solcap_snp_sl_865612,381,153 Solyc01g00835022 KbpDNAJ-heat shock
FWsolcap_snp_sl_33830371,244,368 Fw3.2Solyc03g1149405 MbpCytochrome P450
Fw3.3
solcap_snp_sl_33829371,244,962
solcap_snp_sl_33828371,245,034 Solyc03g1201901.1 MbpSlOFP7 member of a gene family involved in fruit shape
solcap_snp_sl_33827371,245,238 Solyc03g120790697 KbpSlOFP8 member of a gene family involved in fruit shape
solcap_snp_sl_33822371,293,803 Solyc03g12176023 KbpSlSUN11 is part of the 34 members SUN-like gene family
solcap_snp_sl_36532372,029,476 Solyc03g1238000 KbpSlMAPKK2
solcap_snp_sl_2525361,453,932
solcap_snp_sl_59728126,426,351 Solyc12g0095803.6 MbpSlYABBY5b is a part of the YABBY gene family
Solyc12g0141301.5 MbpSlSUN33 is part of the 34 members SUN-like gene family
YPsolcap_snp_sl_70992765,761,751 fd7.1/ty7.1

