Cherry and Fresh Market Tomatoes: Differences in Chemical, Morphological, and Sensory Traits and Their Implications for Consumer Acceptance

Abstract
:1. Introduction
2. Materials and Methods
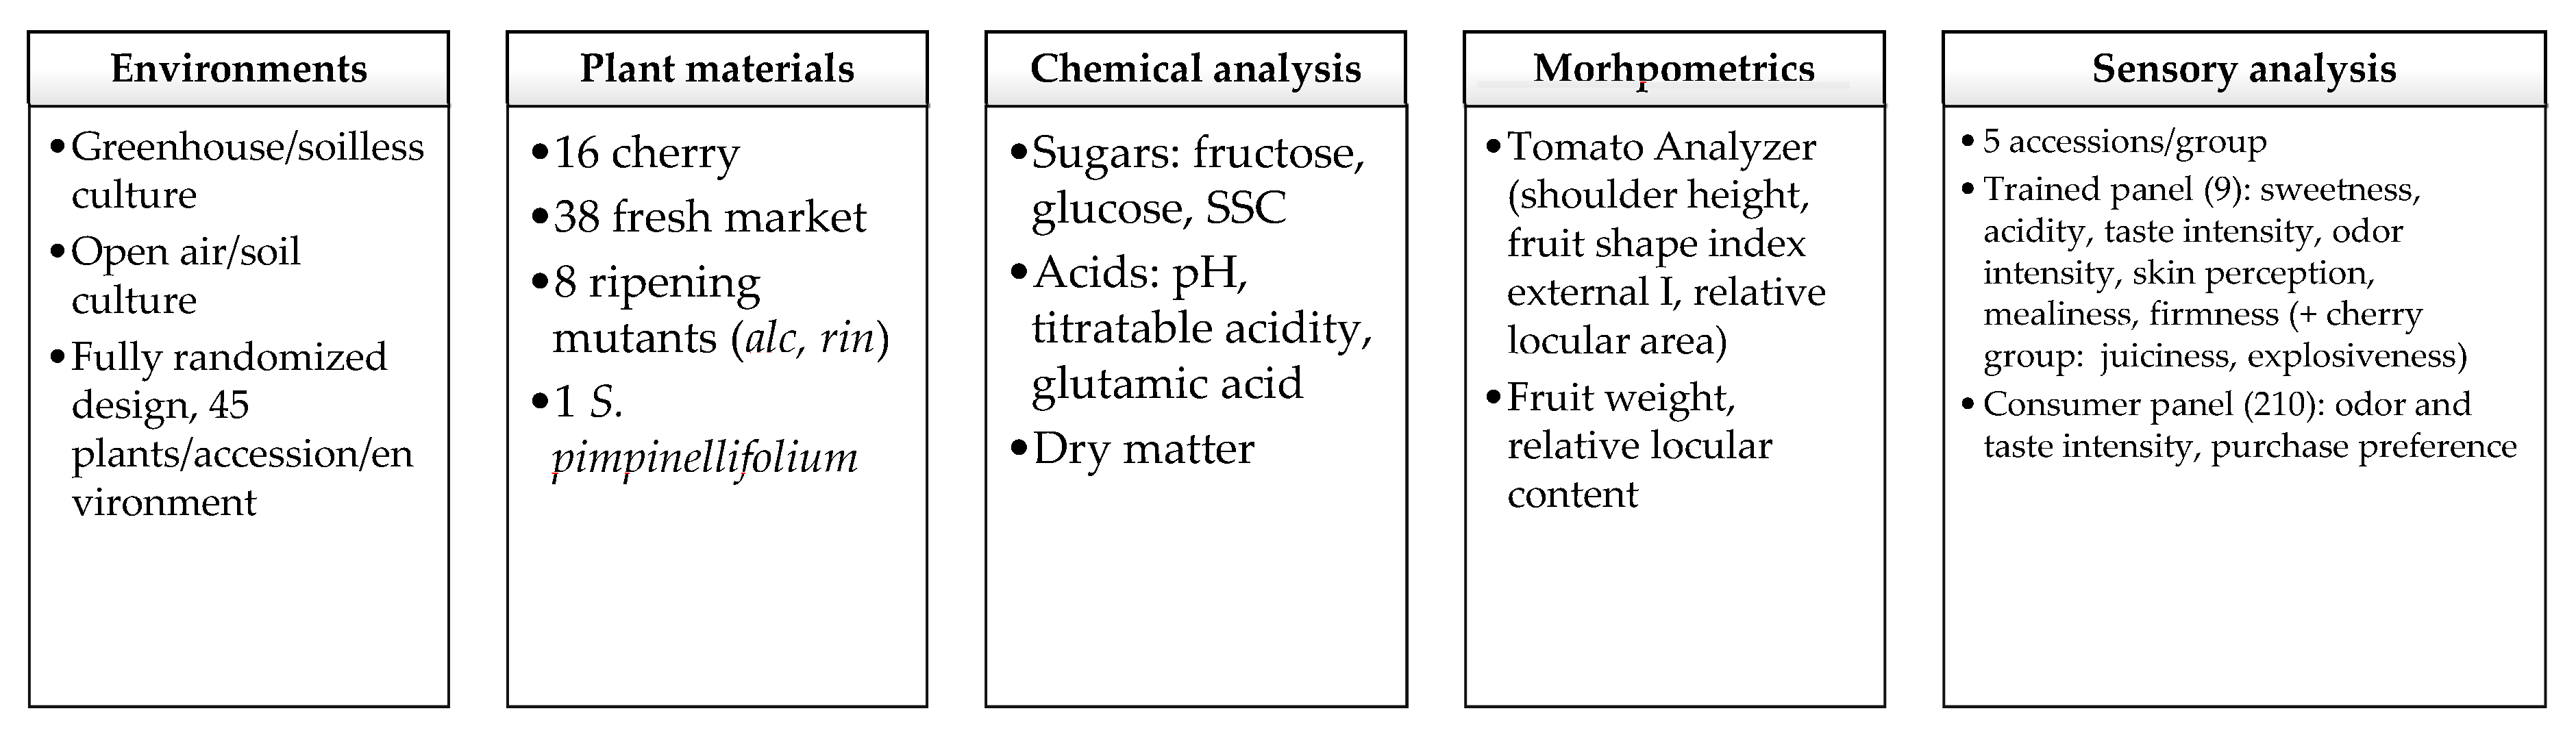
2.1. Plant Materials and Experimental Design
2.2. Measurements
2.2.1. Morphometrics
2.2.2. Chemical Analysis
2.2.3. Sensory Analysis
Trained Panel Evaluations
Consumer Test
2.3. Statistical Analysis
3. Results
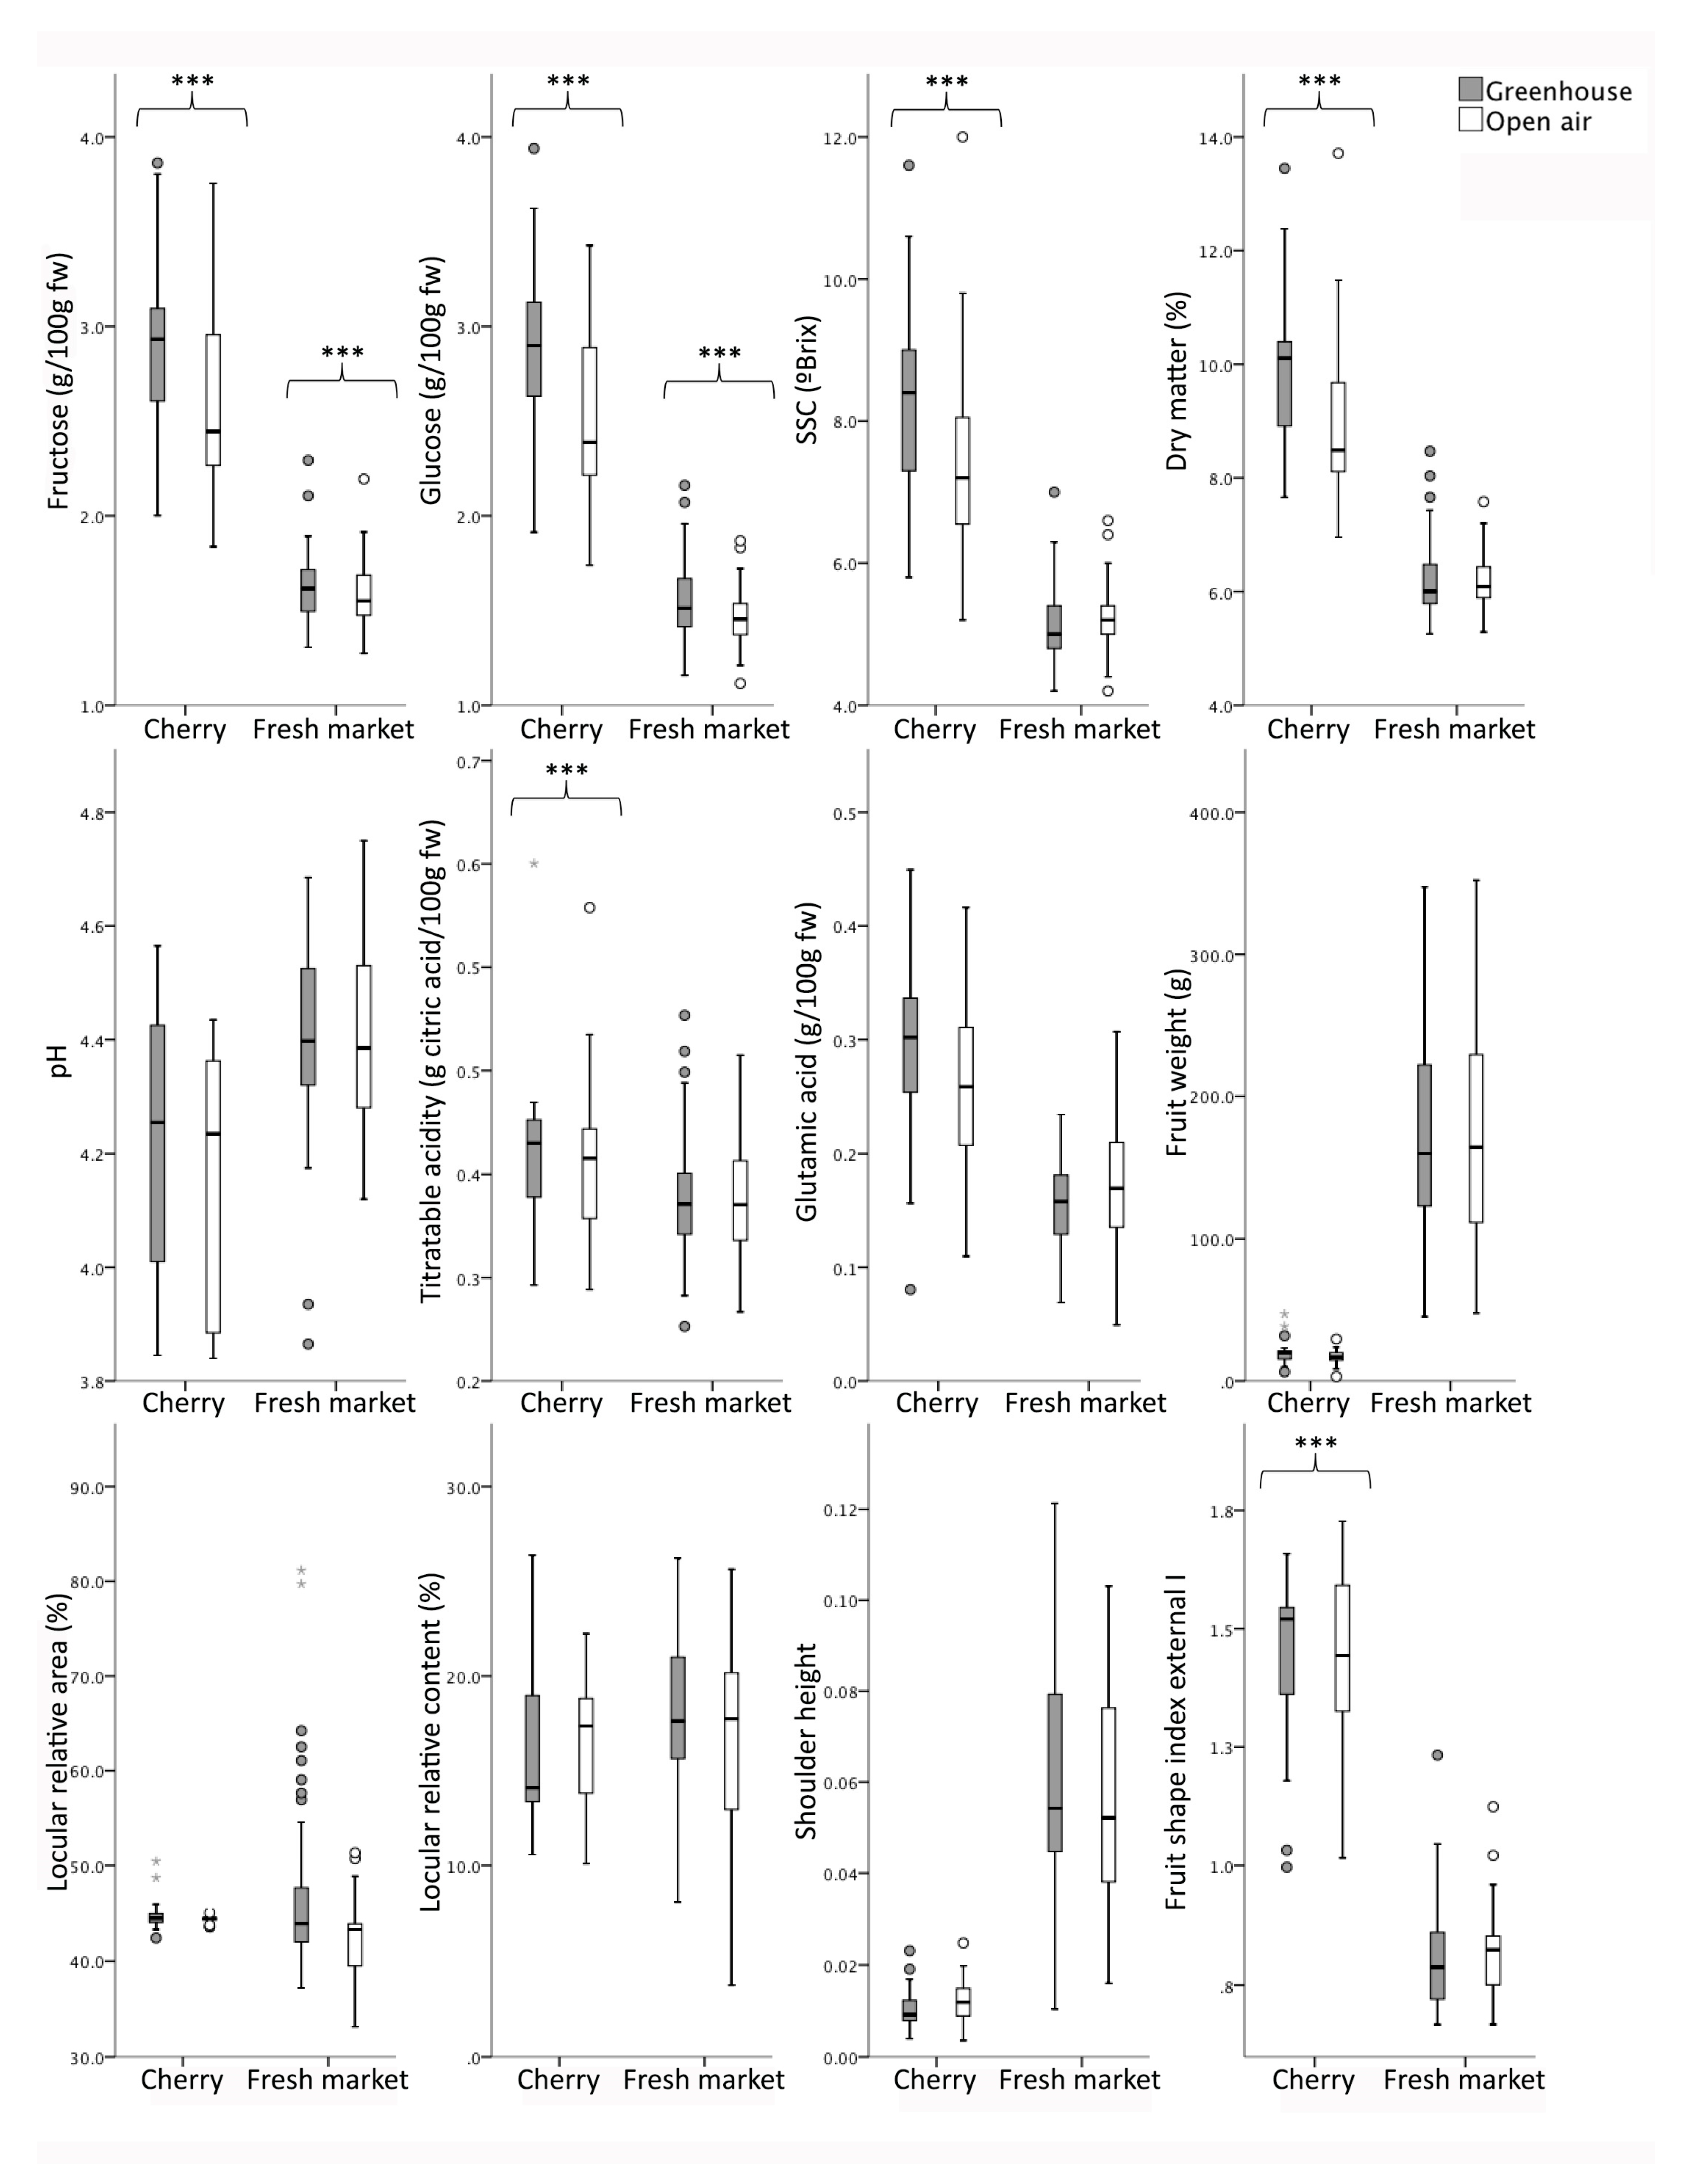
3.1. Chemical Traits
3.2. Morphology
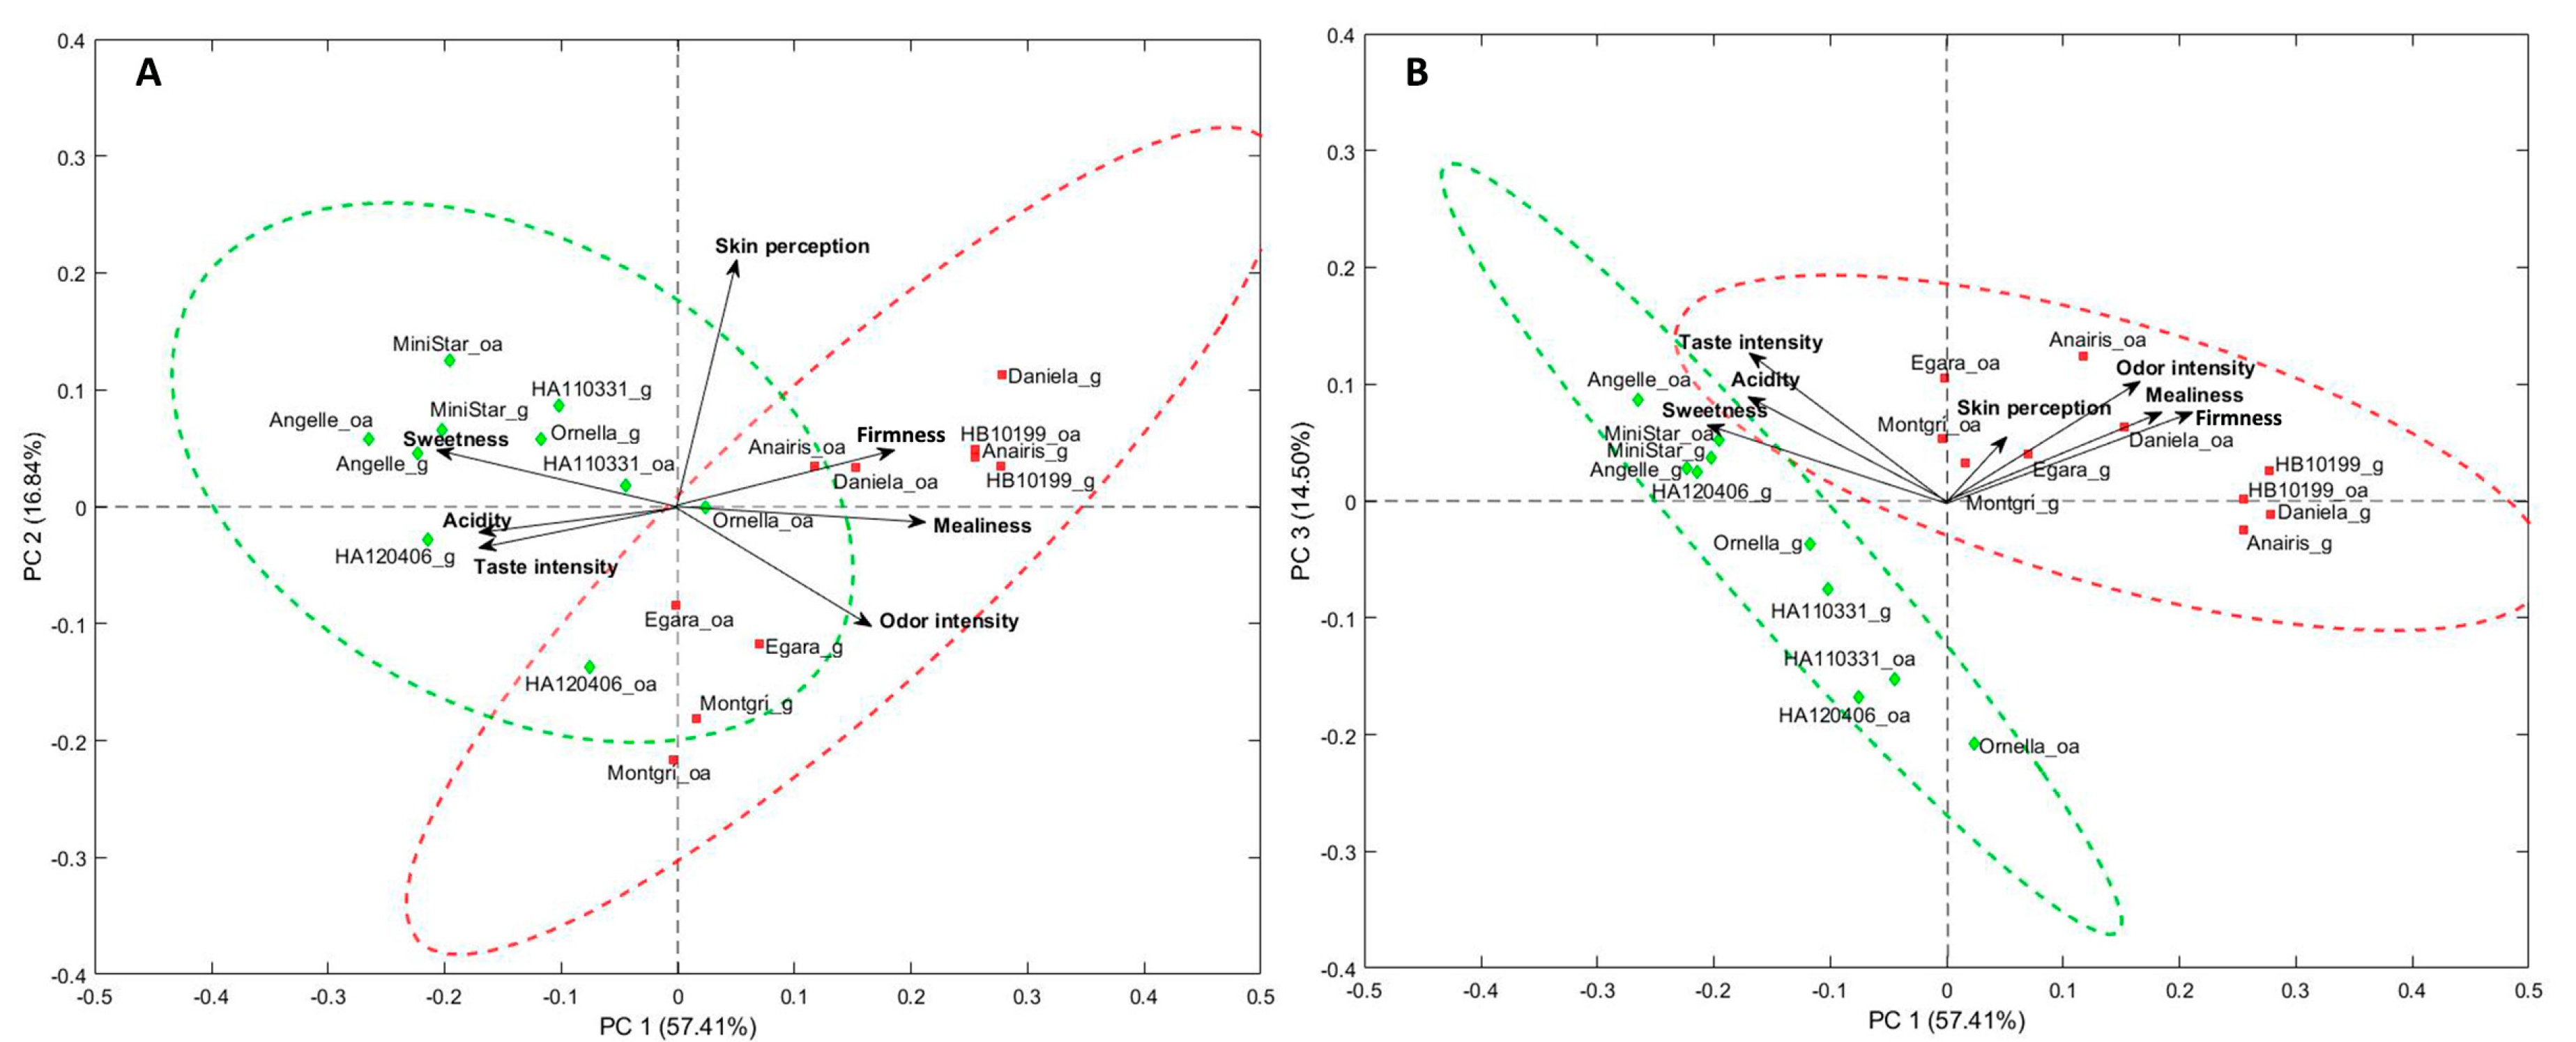
3.3. Sensory Profile
3.4. Cultivation Effect
3.5. Consumer Test
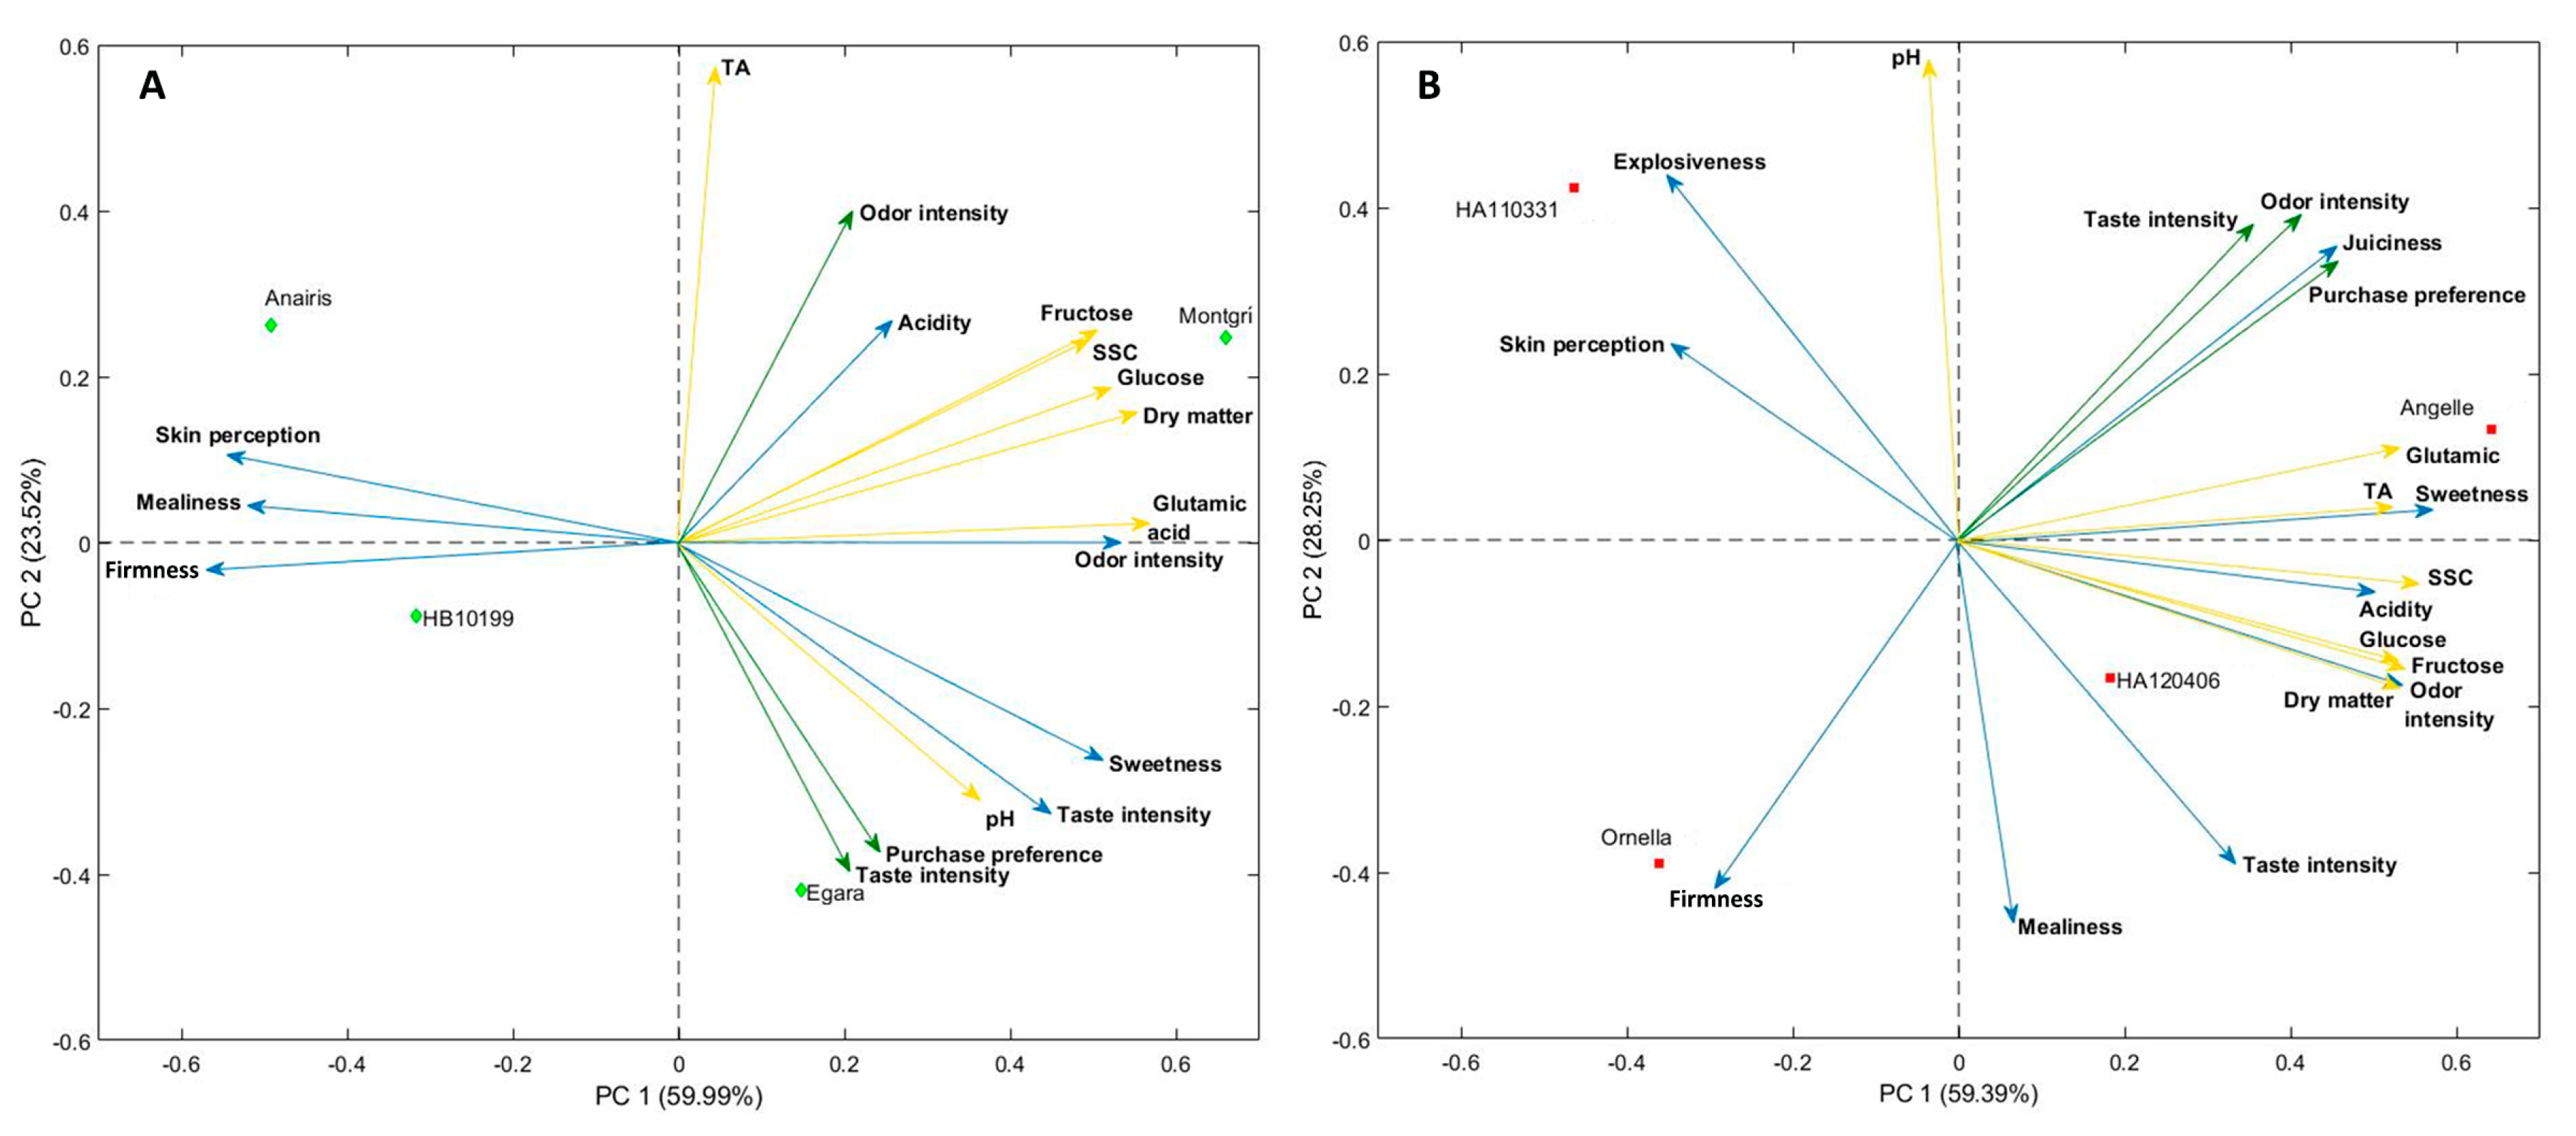
3.6. Correlations
4. Discussion
5. Conclusions
Supplementary Materials
Author Contributions
Funding
Acknowledgments
Conflicts of Interest
References
- FAOSTAT. Food and Agricultural Commodities Statistics. Available online: http://faostat.fao.org/ (accessed on 14 September 2018).
- Robertson, L.D.; Labate, J.A. Genetic resources of tomato (Lycopersicon esculentum Mill.) and wild relatives. In Genetic Improvement of Solanaceous Crops. Volume 2: Tomato; Razdan, M.K., Mattoo, A.K., Eds.; Science Publishers: Enfield, NH, USA, 2007; Volume 2, pp. 25–75. [Google Scholar]
- Stommel, J.R. Genetic enhancement of tomato fruit nutritive value. In Genetic Improvement of Solanaceous Crops. Volume 2: Tomato; Razdan, M.K., Mattoo, A.K., Eds.; Science Publishers: Enfield, NH, USA, 2007; pp. 193–238. [Google Scholar]
- Blanca, J.; Montero-Pau, J.; Sauvage, C.; Bauchet, G.; Illa, E.; Díez, M.J.; Francis, D.; Causse, M.; van der Knaap, E.; Cañizares, J. Genomic variation in tomato, from wild ancestors to contemporary breeding accessions. BMC Genom. 2015, 16, 1–19. [Google Scholar] [CrossRef] [PubMed]
- Schauer, N.; Zamir, D.; Fernie, A.R. Metabolic profiling of leaves and fruit of wild species tomato: A survey of the Solanum lycopersicum complex. J. Exp. Bot. 2005, 56, 297–307. [Google Scholar] [CrossRef] [PubMed]
- Robbins, M.D.; Sim, S.-C.; Yang, W.; Van Deynze, A.; van der Knaap, E.; Joobeur, T.; Francis, D.M. Mapping and linkage disequilibrium analysis with a genome-wide collection of SNPs that detect polymorphism in cultivated tomato. J. Exp. Bot. 2011, 62, 1831–1845. [Google Scholar] [CrossRef] [PubMed]
- van Berloo, R.; Zhu, A.G.; Ursem, R.; Verbakel, H.; Gort, G.; van Eeuwijk, F.A. Diversity and linkage disequilibrium analysis within a selected set of cultivated tomatoes. Theor. Appl. Genet. 2008, 117, 89–101. [Google Scholar] [CrossRef] [PubMed] [Green Version]
- Causse, M.; Stevens, R.; Amor, B.; Faurobert, M.; Muños, S. Breeding for fruit quality in tomato. In Breeding for Fruit Quality; Jenks, M.A., Bebeli, P.J., Eds.; John Wiley & Sons, Inc.: Hoboken, NJ, USA, 2011; pp. 279–305. [Google Scholar]
- Tanksley, S.D. The genetic, developmental, and molecular bases of fruit size and shape variation in tomato. Plant Cell 2004, 16, S181–S189. [Google Scholar] [CrossRef] [PubMed]
- Cebolla-Cornejo, J.; Roselló, S.; Nuez, F. Phenotypic and genetic diversity of Spanish tomato landraces. Sci. Hortic. 2013, 162, 150–164. [Google Scholar] [CrossRef] [Green Version]
- Causse, M.; Damidaux, R.; Rousselle, P. Traditional and enhanced breeding for quality traits in tomato. In Genetic Improvement of Solanaceous Crops. Volume 2: Tomato; Razdan, M.K., Mattoo, A.K., Eds.; Science Publishers: Enfield, NH, USA, 2007; Volume 2, pp. 153–192. [Google Scholar]
- Grandillo, S.; Zamir, D.; Tanksley, S.D. Genetic improvement of processing tomatoes: A 20 years perspective. Euphytica 1999, 110, 85–97. [Google Scholar] [CrossRef]
- Folta, K.M.; Klee, H.J. Sensory sacrifices when we mass-produce mass produce. Hortic. Res. 2016, 3, 16032. [Google Scholar] [CrossRef] [Green Version]
- Tieman, D.; Zhu, G.; Resende, M.F.R.; Lin, T.; Nguyen, C.; Bies, D.; Rambla, J.L.; Beltran, K.S.O.; Taylor, M.; Zhang, B.; et al. A chemical genetic roadmap to improved tomato flavor. Science 2017, 355, 391–394. [Google Scholar] [CrossRef]
- Hobson, G. How the tomato lost its taste. New Sci. 1988, 119, 46–50. [Google Scholar]
- Hobson, G.E.; Bedford, L. The composition of cherry tomatoes and its relation to consumer acceptability. J. Hortic. Sci. 1989, 64, 321–329. [Google Scholar] [CrossRef]
- Bucheli, P.; Voirol, E.; de la Torre, R.; Lopez, J.; Rytz, A.; Tanksley, S.D.; Petiard, V. Definition of nonvolatile markers for flavor of tomato (Lycopersicon esculentum Mill.) as tools in selection and breeding. J. Agric. Food Chem. 1999, 47, 659–664. [Google Scholar] [CrossRef] [PubMed]
- Causse, M.; Buret, M.; Robini, K.; Verschave, P. Inheritance of nutritional and sensory quality traits in fresh market tomato and relation to consumer preferences. J. Food Sci. 2003, 68, 2342–2350. [Google Scholar] [CrossRef]
- Tikunov, Y.; Lommen, A.; de Vos, C.H.R.; Verhoeven, H.A.; Bino, R.J.; Hall, R.D.; Bovy, A.G. A novel approach for nontargeted data analysis for metabolomics. Large-scale profiling of tomato fruit volatiles. Plant Physiol. 2005, 139, 1125–1137. [Google Scholar] [CrossRef]
- Krumbein, A.; Peters, P.; Bruckner, B. Flavour compounds and a quantitative descriptive analysis of tomatoes (Lycopersicon esculentum Mill.) of different cultivars in short-term storage. Postharvest Biol. Technol. 2004, 32, 15–28. [Google Scholar] [CrossRef]
- Georgelis, N.; Scott, J.W.; Baldwin, E.A. Relationship of tomato fruit sugar concentration with physical and chemical traits and linkage of RAPD markers. J. Am. Soc. Hortic. Sci. 2004, 129, 839–845. [Google Scholar]
- Lecomte, L.; Duffe, P.; Buret, M.; Servin, B.; Hospital, F.; Causse, M. Marker-assisted introgression of five QTLs controlling fruit quality traits into three tomato lines revealed interactions between QTLs and genetic backgrounds. Theor. Appl. Genet. 2004, 109, 658–668. [Google Scholar] [CrossRef]
- Chaïb, J.; Lecomte, L.; Buret, M.; Causse, M. Stability over genetic backgrounds, generations and years of quantitative trait locus (QTLs) for organoleptic quality in tomato. Theor. Appl. Genet. 2006, 112, 934–944. [Google Scholar] [CrossRef]
- Levin, I.; Schaffer, A.A. Mapping and tagging of simply inherited traits. In Genetics, Genomics and Breeding of Tomato; Liedl, B.E., Labate, J.A., Stommel, J.R., Slade, A., Kole, C., Eds.; CRC Press: Boca Raton, FL, USA, 2013; pp. 109–142. [Google Scholar]
- Ho, L.C. The mechanism of assimilate partitioning and carbohydrate compartmentation in fruit in relation Ito the quality and yield of tomato. J. Exp. Bot. 1996, 47, 1239–1243. [Google Scholar] [CrossRef]
- Panthee, D.R.; Cao, C.; Debenport, S.J.; Rodríguez, G.R.; Labate, J.A.; Robertson, L.D.; Breksa, A.P.; van der Knaap, E.; McSpadden Gardener, B.B. Magnitude of genotype × environment interactions affecting tomato fruit quality. HortScience 2012, 47, 721–726. [Google Scholar]
- Beckles, D.M. Factors affecting the postharvest soluble solids and sugar content of tomato (Solanum lycopersicum L.) fruit. Postharvest Biol. Technol. 2012, 63, 129–140. [Google Scholar] [CrossRef]
- Baldwin, E.A.; Goodner, K.; Plotto, A. Interaction of volatiles, sugars, and acids on perception of tomato aroma and flavor descriptors. J. Food Sci. 2008, 73, S294–S307. [Google Scholar] [CrossRef] [PubMed]
- Tandon, K.S.; Baldwin, E.A.; Scott, J.W.; Shewfelt, R.L. Linking sensory descriptors to volatile and nonvolatile components of fresh tomato flavor. J. Food Sci. 2003, 68, 2366–2371. [Google Scholar] [CrossRef]
- Baldwin, E.A.; Goodner, K.; Plotto, A.; Pritchett, K.; Einstein, M. Effect of volatiles and their concentration on perception of tomato descriptors. J. Food Sci. 2004, 69, S310–S318. [Google Scholar] [CrossRef]
- Serrano-Megías, M.; López-Nicolás, J.M. Application of agglomerative hierarchical clustering to identify consumer tomato preferences: Influence of physicochemical and sensory characteristics on consumer response. J. Sci. Food Agric. 2005, 86, 493–499. [Google Scholar] [CrossRef]
- Piombino, P.; Sinesio, F.; Moneta, E.; Cammareri, M.; Genovese, A.; Lisanti, M.T.; Mogno, M.R.; Peparaio, M.; Termolino, P.; Moio, L.; et al. Investigating physicochemical, volatile and sensory parameters playing a positive or a negative role on tomato liking. Food Res. Int. 2013, 50, 409–419. [Google Scholar] [CrossRef] [Green Version]
- Baldwin, E.A.; Scott, J.W.; Einstein, M.A.; Malundo, T.M.M.; Carr, B.T.; Shewfelt, R.L.; Tandon, K.S. Relationship between sensory and instrumental analysis for tomato flavor. J. Am. Soc. Hortic. Sci. 1998, 123, 906–915. [Google Scholar]
- Casals, J.; Pascual, L.; Canizares, J.; Cebolla-Cornejo, J.; Casanas, F.; Nuez, F. Genetic basis of long shelf life and variability into Penjar tomato. Genet. Resour. Crop Evol. 2012, 59, 219–229. [Google Scholar] [CrossRef]
- Vrebalov, J.; Ruezinsky, D.; Padmanabhan, V.; White, R.; Medrano, D.; Drake, R.; Schuch, W.; Giovannoni, J. A MADS-box gene necessary for fruit ripening at the tomato ripening-inhibitor (Rin) locus. Science 2002, 296, 343–346. [Google Scholar] [CrossRef]
- Visa, S.; Cao, C.; Gardener, B.M.; van der Knaap, E. Modeling of tomato fruits into nine shape categories using elliptic fourier shape modeling and Bayesian classification of contour morphometric data. Euphytica 2014, 200, 429–439. [Google Scholar] [CrossRef]
- Gonzalo, M.J.; Brewer, M.T.; Anderson, C.; Sullivan, D.; Gray, S.; van der Knaap, E. Tomato Fruit Shape Analysis Using Morphometric and Morphology Attributes Implemented in Tomato Analyzer Software Program. J. Am. Soc. Hortic. Sci. 2009, 134, 77–87. [Google Scholar]
- Casals, J.; Pascual, L.; Canizares, J.; Cebolla-Cornejo, J.; Casanas, F.; Nuez, F. The risks of success in quality vegetable markets: Possible genetic erosion in Marmande tomatoes (Solanum lycopersicum L.) and consumer dissatisfaction. Sci. Hortic. 2011, 130, 78–84. [Google Scholar] [CrossRef]
- Casals, J.; Rull, A.; Bernal, M.; González, R.; del Castillo, R.R.; Simó, J. Impact of grafting on sensory profile of tomato landraces in conventional and organic management systems. Hortic. Environ. Biotechnol. 2018, 59, 597–606. [Google Scholar] [CrossRef]
- ISO. Sensory Analysis—General Guidance for the Design of Test Rooms (ISO 8589:2007); ISO: Genova, Italy, 2017. [Google Scholar]
- Hongsoongnern, P.; Chambers, E. A lexicon for texture and flavor characteristics of fresh and processed tomatoes. J. Sens. Stud. 2008, 23, 583–599. [Google Scholar] [CrossRef]
- Causse, M.; Friguet, C.; Coiret, C.; LéPicier, M.; Navez, B.; Lee, M.; Holthuysen, N.; Sinesio, F.; Moneta, E.; Grandillo, S. Consumer preferences for fresh tomato at the European scale: A common segmentation on taste and firmness. J. Food Sci. 2010, 75, S531–S541. [Google Scholar] [CrossRef] [PubMed]
- Lawless, H.T.; Heymann, H. Sensory Evaluation of Food; Food Science Text Series; Springer: New York, NY, USA, 2010; ISBN 978-1-4419-6487-8. [Google Scholar]
- Sinesio, F.; Cammareri, M.; Moneta, E.; Navez, B.; Peparaio, M.; Causse, M.; Grandillo, S. Sensory quality of fresh French and Dutch market tomatoes: A preference mapping study with Italian consumers. J. Food Sci. 2010, 75, S55–S67. [Google Scholar] [CrossRef] [PubMed]
- Romano, R.; Brockhoff, P.B.; Hersleth, M.; Tomic, O.; Næs, T. Correcting for different use of the scale and the need for further analysis of individual differences in sensory analysis. Food Qual. Prefer. 2008, 19, 197–209. [Google Scholar] [CrossRef]
- Boggio, S.B.; Palatnik, J.F.; Heldt, H.W.; Valle, E.M. Changes in amino acid composition and nitrogen metabolizing enzymes in ripening fruits of Lycopersicon esculentum Mill. Plant Sci. 2000, 159, 125–133. [Google Scholar] [CrossRef]
- Oruna-Concha, M.-J.; Methven, L.; Blumenthal, H.; Young, C.; Mottram, D.S. Differences in glutamic acid and 5’-ribonucleotide contents between flesh and pulp of tomatoes and the relationship with umami taste. J. Agric. Food Chem. 2007, 55, 5776–5780. [Google Scholar] [CrossRef]
- Stevens, M.A.; Kader, A.A.; Albright, M. Intercultivar variation in composition of locular and pericarp portions of fresh market tomatoes. J. Am. Soc. Hortic. Sci. 1977, 102, 689–692. [Google Scholar]
- Panthee, D.; Labate, J.; McGrath, M.; Breksa, A., III; Robertson, L. Genotype and environmental interaction for fruit quality traits in vintage tomato varieties. Euphytica 2013, 193, 169–182. [Google Scholar] [CrossRef]
- Cebolla-Cornejo, J.; Rosello, S.; Valcarcel, M.; Serrano, E.; Beltran, J.; Nuez, F. Evaluation of genotype and environment effects on taste and aroma flavor components of Spanish fresh tomato varieties. J. Agric. Food Chem. 2011, 59, 2440–2450. [Google Scholar] [CrossRef] [PubMed]
- Stevens, M.A.; Kader, A.A.; Albrightholton, M.; Algazi, M. Genotypic variation for flavor and composition in fresh market tomatoes. J. Am. Soc. Hortic. Sci. 1977, 102, 680–689. [Google Scholar]
- Levin, I.; Gilboa, N.; Yeselson, E.; Shen, S.; Schaffer, A.A. Fgr, a major locus that modulates the fructose to glucose ratio in mature tomato fruits. Theor. Appl. Genet. 2000, 100, 256–262. [Google Scholar] [CrossRef]


| Genotype | Group | Origin | Year of Release | Genetic Constitution | Source 1 | Fruit Morphology 2 | Fruit Weight (g) |
|---|---|---|---|---|---|---|---|
| Akira | Cherry | Modern variety | 2010 | Hybrid | Syngenta | Ellipsoid | 30.7 ± 3.3 |
| Angelle ** | Cherry | Modern variety | 2010 | Hybrid | Syngenta | Ellipsoid | 15.2 ± 2.9 |
| CPEA01 | Cherry | Breeding inbred | - | Inbred | Fito | Long rect. | 17.9 ± 3.1 |
| CPEA02 | Cherry | Breeding inbred | - | Inbred | Fito | Long rect. | 11.5 ± 1.9 |
| CPEA03 | Cherry | Breeding inbred | - | Inbred | Fito | Long rect. | 17.6 ± 4.1 |
| CPEA04 | Cherry | Breeding inbred | - | Inbred | Fito | Long rect. | 16.6 ± 2.5 |
| EA01965 | Cherry | Landrace | - | Inbred | IPK | Round | 9.2 ± 2.5 |
| EA03306 | Cherry | Landrace | - | Inbred | IPK | Round | 4.8 ± 1.9 |
| HA110331 ** | Cherry | Modern variety | 2010 | Hybrid | Fito | Long rect. | 22.2 ± 3.4 |
| HA120406 ** | Cherry | Modern variety | 2010 | Hybrid | Fito | Long rect. | 19.7 ± 4.2 |
| Luciplus | Cherry | Modern variety | 2010 | Hybrid | Hazera | Long rect. | 23.5 ± 5.2 |
| MiniStar * | Cherry | Modern variety | 2000 | Hybrid | Sakata | Ellipsoid | 15.5 ± 4.3 |
| Ornella ** | Cherry | Modern variety | 2010 | Hybrid | Hazera | Long rect. | 19.0 ± 5.1 |
| Pixel | Cherry | Modern variety | 2000 | Hybrid | ISI Sem. | Long rect. | 50.5 ± 9.6 |
| Snack | Cherry | Modern variety | 2000 | Hybrid | Syngenta | Heart | 39.3 ± 4.0 |
| VESLB01 | Cherry | Breeding inbred | - | Inbred | Fito | Long | 17.9 ± 3.4 |
| 1201–861 | Fresh market | Modern variety | 2010 | Inbred | Fito | Flat | 254.2 ± 64.7 |
| Alisa Craig | Fresh market | Modern variety | - | Inbred | TGRC | Round | 54.4 ± 9.7 |
| Anairis ** | Fresh market | Modern variety | 2000 | Hybrid | Seminis | Flat | 313.1 ± 92.7 |
| BCVB01 | Fresh market | Modern variety | 2010 | Inbred | Fito | Flat | 172.1 ± 40.0 |
| BCVB02 | Fresh market | Modern variety | 2010 | Inbred | Fito | Round | 231.7 ± 66.5 |
| Byelsa | Fresh market | Modern variety | 2010 | Hybrid | Fito | Heart | 113.5 ± 22.7 |
| Caniles | Fresh market | Modern variety | 2010 | Hybrid | Zeraim Ib. | Ellipsoid | 95.9 ± 12.2 |
| Cartesio | Fresh market | Modern variety | 2010 | Hybrid | Clause | Round | 126.4 ± 20.6 |
| COLB02 | Fresh market | Modern variety | 2010 | Inbred | Fito | Round | 46.7 ± 10.8 |
| COLLB01 | Fresh market | Modern variety | 2010 | Inbred | Fito | Flat | 119.8 ± 28.7 |
| Daniela * | Fresh market | Modern variety | 1990 | Hybrid | Hazera | Round | 147.8 ± 34.8 |
| Danubio | Fresh market | Modern variety | 2000 | Hybrid | Clause | Round | 232.9 ± 33.7 |
| Delizia | Fresh market | Modern variety | 2000 | Hybrid | Clause | Round | 300.5 ± 126.2 |
| Egara ** | Fresh market | Modern variety | 2011 | Hybrid | Fito | Flat | 210.4 ± 58.1 |
| Flor de Baladre | Fresh market | Landrace | Inbred | COMAV | Flat | 219.5 ± 84.1 | |
| Garden Gem | Fresh market | Modern variety | 2010 | Hybrid | U. Florida | Heart | 61.1 ± 8.7 |
| Garden Tresure | Fresh market | Modern variety | 2010 | Hybrid | U. Florida | Oxheart | 347.4 ± 63.8 |
| HA120081 | Fresh market | Modern variety | 2010 | Hybrid | Fito | Flat | 198.9 ± 53.6 |
| HB10199 ** | Fresh market | Modern variety | 2010 | Hybrid | Fito | Round | 115.1 ± 25 |
| Ikram | Fresh market | Modern variety | 1990 | Hybrid | Syngenta | Round | 117.0 ± 34.6 |
| Jack | Fresh market | Modern variety | 1993 | Hybrid | Seminis | Round | 309.6 ± 103.7 |
| LA3179 | Fresh market | Genetic resource | - | Inbred | TGRC | Round | 68.8 ± 13.3 |
| LC430 | Fresh market | Landrace | - | Inbred | FMA | Flat | 305.2 ± 131.4 |
| LVAA03 | Fresh market | Breeding inbred | - | Inbred | Fito | Oxheart | 142.2 ± 51.9 |
| LVAA04 | Fresh market | Breeding inbred | - | Inbred | Fito | Round | 196.1 ± 72.3 |
| Montgrí ** | Fresh market | Landrace | 2005 | Inbred | FMA | Oxheart | 183.5 ± 66.9 |
| OBGB01 | Fresh market | Breeding inbred | - | Inbred | Fito | Flat | 119.3 ± 70.3 |
| Paladium | Fresh market | Modern variety | 2013 | Hybrid | Fito | Round | 124.4 ± 24.2 |
| Raf | Fresh market | Modern variety | 1980 | Inbred | Clause | Round | 181.0 ± 34.1 |
| Ramazur | Fresh market | Modern variety | 2010 | Hybrid | E. Zaden | Round | 61.4 ± 7.3 |
| Ramyle | Fresh market | Modern variety | 2000 | Hybrid | R. Zwaan | Round | 108.6 ± 11.8 |
| RCLA01 | Fresh market | Breeding inbred | - | Inbred | Fito | Round | 114.6 ± 32.4 |
| RCLA03 | Fresh market | Breeding inbred | - | Inbred | Fito | Round | 98.7 ± 25.5 |
| Retinto | Fresh market | Modern variety | 2000 | Hybrid | Seminis | Round | 123.7 ± 29.1 |
| Sant Jeroni | Fresh market | Landrace | - | Inbred | FMA | Flat | 219.9 ± 40.6 |
| Valencià | Fresh market | Landrace | - | Inbred | Fito | Flat | 196.5 ± 50.8 |
| Vernal | Fresh market | Modern variety | 2000 | Hybrid | E. Zaden | Flat | 209.9 ± 63.5 |
| VESLB02 | Fresh market | Breeding inbred | - | Inbred | Fito | Flat | 246.6 ± 86.0 |
| HB06545 | Rip. mut. (alc) | Modern variety | 2010 | Hybrid | Fito | Round | 71.5 ± 10.1 |
| LC269 | Rip. mut. (alc) | Landrace | - | Inbred | FMA | Round | 105 ± 31.7 |
| LC378 | Rip. mut. (alc) | Landrace | - | Inbred | FMA | Flat | 84.5 ± 33.7 |
| Punxa | Rip. mut. (alc) | Landrace | - | Inbred | FMA | Heart | 89.8 ± 18.1 |
| LVAA01 | Rip. mut. (rin) | Breeding inbred | - | Inbred | Fito | Flat | 112.4 ± 36.8 |
| LVAB02 | Rip. mut. (rin) | Breeding inbred | - | Inbred | Fito | Round | 193.4 ± 68.5 |
| RCLA02 | Rip. mut. (rin) | Breeding inbred | - | Inbred | Fito | Round | 62.4 ± 14.7 |
| RCLA04 | Rip. mut. (rin) | Breeding inbred | - | Inbred | Fito | Round | 128.1 ± 31.4 |
| LA2904 | Wild species | S. pimpinellifolium | - | Inbred | TGRC | Round | 1.4 ± 0.4 |
| Fructose (g/100 g fw) | Glucose (g/100 g fw) | Glutamic Acid (g/100 g fw) | pH | SSC (°Brix) | TA (g Citric Acid/100 g fw) | Dry Matter (%) | ||||||||
|---|---|---|---|---|---|---|---|---|---|---|---|---|---|---|
| Cherry | 2.75 | a | 2.72 | a | 0.27 | a | 4.20 | - | 7.88 | b | 0.38 | c | 9.44 | b |
| Fresh market | 1.60 | c | 1.52 | c | 0.16 | b | 4.40 | - | 5.18 | d | 0.33 | d | 6.19 | d |
| Ripening mutant (alc) | 1.69 | c | 1.52 | c | 0.19 | b | 4.29 | - | 5.76 | c | 0.46 | b | 6.98 | c |
| Ripening mutant (rin) | 1.61 | c | 1.55 | c | 0.09 | c | 4.34 | - | 4.99 | d | 0.39 | c | 6.31 | d |
| S. pimpinellifolium | 2.01 | b | 1.78 | b | 4.32 | - | 8.40 | a | 0.70 | a | 12.70 | a | ||
| Environment (E) | *** | *** | ns | ns | * | ns | ** | |||||||
| Group (G) | *** | *** | *** | ns | *** | *** | *** | |||||||
| G*accession (A) | *** | *** | *** | ns | *** | *** | *** | |||||||
| G*E | *** | *** | ns | ns | *** | *** | *** | |||||||
| G*E*A | *** | ** | ns | ns | * | *** | * | |||||||
| Group | Fruit Weight (g) | Fruit Shape Index External I | Shoulder Height | Relative Locular Content (%) | Relative Locular Area (%) | |||||
|---|---|---|---|---|---|---|---|---|---|---|
| Cherry | 19.6 | d | 1.43 | a | 0.01 | c | 16.2 | b | 44.8 | - |
| Fresh market | 184.2 | a | 0.82 | c | 0.06 | a | 16.8 | b | 45.8 | - |
| Ripening mutant (alc) | 90.3 | c | 0.83 | c | 0.05 | b | 17.7 | b | 45.7 | - |
| Ripening mutant (rin) | 148.3 | b | 0.81 | c | 0.07 | a | 17.3 | b | 45.5 | - |
| S. pimpinellifolium | 1.3 | e | 0.96 | b | 0.01 | c | 36.8 | a | 45.7 | - |
| Environment (E) | ns | ns | ns | ns | ns | |||||
| Group (G) | *** | *** | *** | *** | ns | |||||
| G*accession (A) | *** | *** | *** | *** | *** | |||||
| G*E | ns | ns | ns | ns | ns | |||||
| G*E*A | ns | ns | ns | ns | ns | |||||
| Sweetness | Acidity | Taste Intensity | Odor Intensity | Skin Perception | Mealiness | Firmness | Juiciness | Explosiveness | |
|---|---|---|---|---|---|---|---|---|---|
| Cherry | 6.8 a | 6.1 a | 5.3 a | 2.0 b | 7.2 - | 1.2 b | 2.3 b | 8.3 - | 6.7 - |
| Fresh market | 4.3 b | 5.3 b | 4.7 b | 5.6 a | 7.3 - | 3.8 a | 4.5 a | - | - |
| Sweetness | Acidity | Taste Intensity | Odor Intensity | Skin Perception | ||||||
| Fresh type | ||||||||||
| Open air | 4.6 & | a | 5.8 | a | 5.3 | a | 5.6 | ns | 7.3 | ns |
| Greenhouse | 4.0 & | b | 4.7 | b | 4.4 | b | 5.8 | ns | 7.4 | ns |
| Cherry | ||||||||||
| Open air | 6.2 & | b | 6.0 | ns | 4.8 & | b | 1.8 | ns | 7.1 | ns |
| Greenhouse | 7.6 & | a | 6.2 | ns | 5.6 & | a | 1.9 | ns | 7.5 | ns |
| Mealiness | Firmness | Juiciness | Explosiveness | |||||||
| Fresh type | ||||||||||
| Open air | 3.7 | ns | 4.6 | ns | ||||||
| Greenhouse | 3.9 | ns | 4.5 | ns | ||||||
| Cherry | ||||||||||
| Open air | 1.4 | ns | 2.4 | ns | 7.8 | b | 6.4 | ns | ||
| Greenhouse | 1.4 | ns | 2.2 | ns | 8.5 | a | 6.8 | ns | ||
© 2018 by the authors. Licensee MDPI, Basel, Switzerland. This article is an open access article distributed under the terms and conditions of the Creative Commons Attribution (CC BY) license (http://creativecommons.org/licenses/by/4.0/).
Share and Cite
Casals, J.; Rivera, A.; Sabaté, J.; Romero del Castillo, R.; Simó, J. Cherry and Fresh Market Tomatoes: Differences in Chemical, Morphological, and Sensory Traits and Their Implications for Consumer Acceptance. Agronomy 2019, 9, 9. https://doi.org/10.3390/agronomy9010009
Casals J, Rivera A, Sabaté J, Romero del Castillo R, Simó J. Cherry and Fresh Market Tomatoes: Differences in Chemical, Morphological, and Sensory Traits and Their Implications for Consumer Acceptance. Agronomy. 2019; 9(1):9. https://doi.org/10.3390/agronomy9010009
Chicago/Turabian StyleCasals, Joan, Ana Rivera, Josep Sabaté, Roser Romero del Castillo, and Joan Simó. 2019. "Cherry and Fresh Market Tomatoes: Differences in Chemical, Morphological, and Sensory Traits and Their Implications for Consumer Acceptance" Agronomy 9, no. 1: 9. https://doi.org/10.3390/agronomy9010009