Evaluating Remotely-Sensed Grapevine (Vitis vinifera L.) Water Stress Responses Across a Viticultural Region


1
School of Agriculture, Food and Wine, The University of Adelaide, PMB 1, Glen Osmond, SA 5064, Australia
2
Wynns Coonawarra Estate, Memorial Drive, Coonawarra, SA 5263, Australia
*
Author to whom correspondence should be addressed.
Agronomy 2019, 9(11), 682; https://doi.org/10.3390/agronomy9110682
Submission received: 20 September 2019
/
Revised: 18 October 2019
/
Accepted: 23 October 2019
/
Published: 25 October 2019
(This article belongs to the Special Issue Increasing Agricultural Water Productivity in a Changing Environment)
Abstract
:The evolving spatial and temporal knowledge about vineyard performance through the use of remote sensing offers new perspectives for vine water status studies. This paper describes the application of aerial thermal imaging to evaluate vine water status to improve irrigation scheduling decisions, water use efficiency, and overall winegrape quality in the Coonawarra viticultural region of South Australia. Airborne infrared images were acquired during the 2016 and 2017 growing seasons in the region of Coonawarra, South Australia. Several thermal indices of crop water status (CWSI, Ig, (Tc-Ta)) were calculated that correlated with conventional soil and vine water status measures (Ψpd, Ψs, gs). CWSI and Ig could discriminate between the two cultivars used in this study, Cabernet Sauvignon (CAS) and Shiraz (SHI), as did the conventional water stress measures. The relationship between conventional vine water status measures appeared stronger with CWSI in the warmer and drier season (2016) compared to the cooler and wetter season (2017), where Ig and (Tc-Ta) showed stronger correlations. The study identified CWSI, Ig and (Tc-Ta) to be reliable indicators of vine water status under a variety of environmental conditions. This is the first study to report on high resolution vine water status at a regional scale in Australia using a combination of remote and direct sensing methods. This methodology is promising for aerial surveillance of vine water status across multiple blocks and cultivars to inform irrigation scheduling.
1. Introduction
Water scarcities in irrigated agricultural regions globally are putting greater pressure on irrigators to maximize its productive use [1]. Extensive irrigation research on grapevines has shown that soil water deficits resulting in vine water stress can lead to reduced leaf gas exchange, accelerated ripening, losses of yield via lowered berry weight, and negatively impact grape composition and wine quality [2,3,4,5,6,7]. These responses are genotype (cultivar)-dependent within the Vitis vinifera L. species; for example, ‘Grenache’ vines regulated their hydraulic pathway more strongly than ‘Chardonnay’ in response to water stress [8]. In another study, ‘Syrah’ (‘Shiraz’) grapevines had a similar response as ‘Chardonnay’ when subjected to water stress in the field [9]. These intra-species differences, termed ‘isohydric’ and ‘anisohydric’ [10], are related to differences in stomatal behavior of the cultivars in response to soil moisture availability. Isohydric behaviour is characterised by stomatal closure under decreasing soil moisture to maintain homeostasis of leaf water potential. Under the same conditions of declining soil moisture, anisohydric stomatal behaviour results in declining leaf water potential as stomata remain relatively open compared to isohydric plants [9,11].
It is now well-known that stomatal conductance (gs), the flux of water vapour (H2O) and carbon dioxide (CO2) through the stomatal pores of the leaf, is sensitive to soil water deficit, therefore serving as a reliable indicator of plant water status [12]. Under water deficit, stomatal closure occurs resulting in reduced transpiration and consequently higher leaf temperatures compared to those under well-watered conditions [13,14]. In field-grown grapevines, Jones and co-workers monitored stomatal closure using infrared thermography as an indicator of vine water stress and found a strong correlation between specific thermal indices and stomatal conductance [15]. Thermal indices such as crop water stress index (CWSI; [16]) and linear thermal index (Ig; [17]) have been shown to be correlated to vine water status metrics such as leaf water potential (Ψl), stem water potential (Ψs), and gs [15,18,19], and therefore could be valuable to irrigators to improve management decisions on irrigation scheduling.
Given that vineyards are inherently variable [20], optimising irrigation in various sub-blocks of a vineyard requires the delineation of irrigation management zones based on vine water status. Recently, thermal remote sensing based on airborne platforms have been used for the spatial characterisation of vine water status [21,22,23,24]. The advantage of the remote sensing approach is that large areas can be rapidly profiled obviating the need for a large number of measurements of individual vines that are time- and labour-intensive [18,25,26]. With the advent of high-resolution thermal cameras, sub-meter spatial resolution is now feasible from airborne platforms [27] allowing for the characterisation of water status of sub-blocks and even individual vines. Using an Unmanned Aerial Vehicle (UAV), Zarco-Tejada and co-workers evaluated a multispectral and thermal index and found a strong correlation with both gs and Ψl in ‘Thompson Seedless’ grapevines in California [24]. Similar relationships were found in ‘Tempranillo’ grapevines in Spain between airborne thermal indices, CWSI and Ig, and Ψs and gs [21]. Bellvert and colleagues mapped CWSI across an 11-ha Pinot Noir vineyard in Spain, finding a stronger correlation between CWSI and Ψl at solar noon (1230 h) than in the morning (0930 h) [18]. Recently, Matese and co-workers determined CWSI and Ig values under various irrigation regimes in two Italian vineyards planted with CAS and ‘Cagnulari’ [27]. All of the above-mentioned studies were undertaken using UAV platforms, which are limited by range (flight time) and therefore not suited to characterising entire viticultural regions or even large vineyard blocks. The long flight times required to cover these large areas with a UAV mean that data capture occurs under different environmental conditions which makes it difficult to compare data between timepoints. Alternative approaches include: Satellite imagery, but current spatial resolutions of thermal cameras (ASTER satellite ~90 m) do not allow for individual vines to be resolved; and, manned fixed wing aircraft, which allow large area data capture and moderate to high spatial resolution.
The aim of the present study was to: (i) validate the performance of a commercially-available thermal imaging service to provide regional-scale vine water status in order to improve irrigation scheduling and irrigation efficiencies; (ii) compare the airborne thermal water stress indices CWSI and Ig with the traditional vine water status metrics gs and Ψs; and, (iii) determine whether the cultivars SHI and CAS can be discriminated based on remotely-sensed thermal indices of water stress. Irrigation scheduling targeted specifically to individual cultivars not only has the potential to improve vineyard water use efficiency (WUE), and grape and wine quality, but should also reduce the inherent variability within vineyards through greater understanding of the spatial and temporal patterns of vine performance [28,29,30]. To the best of our knowledge, a study into the ability to detect cultivar-specific responses to soil moisture availability and environmental demand with remotely-sensed thermal imaging is lacking under Australian conditions. This information would be valuable to viticulturists in order to develop cultivar-specific irrigation strategies for premium winegrape production. Here, we report on the first regional-scale characterisation of grapevine water status in an Australian wine producing region using direct, proximal, and remote sensing. This spatial scale information is of value to growers attempting to make decisions about irrigation at the regional scale for multiple vineyards simultaneously rather than single vineyards.
2. Materials and Methods
2.1. Site Data
The 11 experimental sites were located in Coonawarra, South Australia (37.29° S, 140.83° E) (Figure 1). The blue regions on the map indicate the vineyard blocks surveyed by aerial imagery while the red delineations indicate the blocks that were surveyed by remote sensing and ground-truthed.
In each block, two points within the vineyard were sampled based on differences in Normalised Difference Vegetation Index (NDVI) where high values were > 0.7 and low values were < 0.4. Within these two sub blocks, four vines were ground-truthed (total eight vines per block). To aid geolocation, large ( m) wooden crosses (ground control points; GCPs) were painted white and placed in the midrows next to the vines used for ground-truthing. These GCPs were useful in accurately identifying georeferenced points in the aerial imagery. Approx. 1,000 ha and 100 ha of vineyards of Vitis vinifera L. cvs. Shiraz (SHI) and CAS (CAS) were flown and ground-truthed, respectively, in this study. All vines selected were mature, fully cropping, and managed with conventional canopy management and integrated pest management (IPM) practices for the region.
2.2. Environmental Conditions
Regional environmental (weather) data was obtained from the Coonawarra automatic weather station maintained by the Australian Bureau of Meteorology (BOM), Station ID: 026091. The long-term (20-year) mean January temperature (MJT) for Coonawarra is 19.3 °C and the degree days (DD) (October–April) is 1511 [31]. Temperature, wind speed and relative humidity (RH) were captured from a Bureau of Meteorology (BOM) automatic weather station located near the vineyards assessed (BOM site number 026091). Daily maximum air vapour pressure deficit (VPD) was calculated using maximum temperature and minimum RH data on the days of the ground truthing and flights. In addition, a series of Tinytag data loggers (Model TGP-1840, Hastings Data Loggers, Port Maquarie, Australia) were placed within the canopy of sub-block of vines to record ambient air temperature. These canopy sensors were found to generally agree with the on-site BOM weather station temperature data.
The climate of the area is Mediterranean, with winter dominant rainfall and relative summer drought [32]. Annual rainfall for Coonawarra is 568.7 mm (Bureau of Meteorology: http://www.bom.gov.au/climate/averages/tables/cw_026091.shtml). Supplemental irrigation is typically required from December until March. The elevation of the region is between 57 m and 63 m above sea level.
The 2016 growing season was characterised by temperatures that were relative high and with moderately low rainfall. Based on the growing degree days (or thermal time), the growing season was warmer (1830-degree days (base 10 °C)) than the long term (20-year) average for the region (1511-degree days) as indicated by the growing degree days. Environmental conditions during the two airborne campaigns (S1-F1, S1-F2) were more demanding as indicated by the higher vapour pressure deficit (VPD) values: At the véraison timepoint (S1, F1), the VPD was 2.05 kPa (considered moderate) while at pre-harvest (S1, F2), the VPD was 3.34 kPa, which is relatively high for the region that is considered a cool-climate viticultural region in South Australia.
In comparison, the 2017 growing season was cooler and milder compared to 2016. The seasonal heat accumulation (1493-degree days) was similar to the long-term average (1511-degree days). Environmental conditions during the two measurement days (S2-F1, S2-F2) were also moderate: VPD and maximum daily temperatures were 2.94 kPa and 27 °C, respectively, for the véraison timepoint (S2, F1), while at pre-harvest (S2, F2), milder conditions prevailed (VPD −2.0 kPa; maximum daily temperature −28 °C) (Table 1).
As a result of the warmer conditions in 2016, higher irrigation levels were applied than in 2017: In 2016, a total of 1.8 ML ha−1 was applied on average across the blocks profiled, whereas in 2017 approx. 0.4 ML ha−1 was applied on average.
Average yields across the sentinel blocks were correspondingly lower in 2016 compared to 2017, while crop water use efficiency (WUE = yield/irrigation) was higher in 2017 (3.4 t ML−1) compared to 2016 (2.0 t ML−1), reflecting the proportionally higher yields of the wetter, second season.
2.3. Airborne Campaign
Airborne thermal images were obtained on two days for both seasons corresponding to approx. veraison and mid-maturity, ca. two weeks prior to harvest. A fixed-wing aircraft (CESSNA 172 S) commissioned by Ceres Imaging (Oakland, CA, USA) was equipped with a 5-band multispectral (three visible, one red edge, one near infrared) camera and a long wave infrared uncooled imaging sensor (FLIR A65, FLIR Systems, Wilsonville, OR, USA) at a frame rate of 30 Hz. The camera had a resolution of 640 512 pixels, yielding an angular field of view (FOV) of 25°. Radiometric calibration was done by Ceres Imaging using a blackbody radiation source. Based on the average flying altitude of approximately 700 m (above sea level), the effective spatial resolution was 38 cm for the longwave infrared (thermal) camera and 19 cm for the multispectral camera. The flying pattern was carried out for approximately. 1000 ha, which contained the 11 study plots. The flights were conducted between 1100 and 1400 h on February 4, 2016 (Season 1-S1, Flight 1-F1), March 2, 2016 (Season 1-S1, Flight 2-F2), February 21, 2017 (Season 2-S2, Flight 1-F1), and March 25, 2017 (Season 2-S2, Flight 2-F2).
2.4. Determination of Proximal and Remote Thermal Water Stress Indices
A handheld thermal infrared (IR) camera (Model B400, FLIR Systems, Wilsonville, OR, USA; IR resolution: 320 240 = 76,800 pixels; spectral range: 7.5–13 μm) was used to record data in the IR and red, blue, green (RGB) wavelengths simultaneously for each of the targeted vines’ canopies for the proximal view. Images were captured at a 45° angle to the canopy and at the same height as mid canopy (−1.5 m) in order to fit the entire canopy area into the camera’s FOV (25°). The IR camera’s microbolometer sensors had a thermal sensitivity of 0.05 °C across their full range of temperatures from −20 °C to +350 °C with an accuracy of ±2% as per the manufacturer’s specifications. Thermal images were processed using ‘FLIR Tools’ image processing software (v.5.4, FLIR Systems, Wilsonville, OR, USA). For the remotely-acquired raster data, vine only signals from six pixels per vine were extracted and averaged to give average canopy temperature (Tc). This value was used to calculate the CWSI as reported in [17], which is a modified version of the CWSI equation reported by Idso et al. [16] and Jackson et al. [13] where the non-water stressed baseline was represented by Twet and non-transpiring leaf was represented by Tdry (Equation (1)):
An alternative index was proposed by Jones, which is proportional to gs and reported to be more reliable under a range of environmental conditions (e.g. dry, humid) (Equation (2) [17]):
For the remotely-sensed data, Twet was taken as the lowest Tc observed on the day for a given cultivar, while Tdry was taken as the highest Tc obtained on the day for a given cultivar. For this approach, based on a modified approach of Baluja and co-workers [12], six pixels per vine from all sentinel vines in each block that represented either Tdry or Twet were averaged. This method of obtaining reference temperatures was necessary since it was unfeasible to set up numerous temperature targets in each vineyard that would reflect wet and dry leaf temperatures for the small-time window (2–3 h) of the airborne campaign. Values for CWSI range from 0 to 1, with 0 representing a well-watered crop and 1 representing a highly water-stressed or non-transpiring crop. Values of Ig range from 0 to any positive value, with higher numbers representing a well-watered canopy and 0 representing a water-stressed canopy. Detailed pixel information of canopy and midrow temperatures from a grid of 225 pixels was used at each location. Pixels of the non-vine (inter-row) signal were removed from the analysis by selecting only the coolest pixels in the thermal image; these cool pixels corresponded to the vine canopy whereas warm pixels, which were approximately. 15–20 °C higher in temperature than the cool pixels of the canopy, corresponded to the inter-row where there was no vegetation. Aerial thermal images were colour coded for relative water stress: Red showing highest water stress, yellow moderate water stress, green low water stress, and blue no water stress.
For the proximal data, Twet and Tdry were obtained using artificial wet leaves (spraying water and waiting 10 min before temperature measurement) and dry leaves (applying petroleum jelly on the abaxial side of the leaves and waiting 10 min before temperature measurement), respectively, obtained on the measurement day from all vineyards for the particular cultivar. In addition to the two indices mentioned above, a simplified index of crop water stress based on the difference between Tc and ambient temperature (Ta) temperatures (Tc-Ta) was evaluated [16]. The advantage of this simplified index is that it does not require the reference temperatures Twet and Tdry that other indices (e.g. CWSI, Ig) require. In general, negative (Tc-Ta) numbers represent low or no water stress, while positive values represent a degree of water stress.
2.5. Conventional Measures of Vine Water Status
In each block, pre-dawn leaf water potential (Ψpd) was measured between the hours of 0300–0600 on the same day as the flight (refer to the following section) using a Scholander pressure chamber (Soil Moisture Equipment Corp., Santa Barbara, CA, USA) in the 2017 season only. Measures of stem water potential (Ψs) were conducted between the hours of 1100–1400 using the same pressure chamber and concurrently with the airborne campaigns. Measures of Ψpd and Ψs were performed on one leaf per vine from four measurement vines in each sub-block. Stomatal conductance (gs) was also assessed at the time of the airborne campaigns using a portable porometer (Model AP3, Delta-T Devices, Cambridge, UK). The porometer was calibrated daily according to the manufacturer’s instructions. Microclimatic data within the canopy was collected using temperature sensors (Tinytag, Model TGP-1840, Gemini Data Loggers, Chichester, UK).
2.6. Statistical Data Analysis
A two-way Analysis of Variance (ANOVA) was performed using cultivar and vintage as factors. All ground-truthing data means were compared using a post-hoc test with Tukey’s Honestly Significant Difference (HSD) at P ≤ 0.05 (SPSS statistical software, v.24, IBM Corporation, Chicago, IL USA). Pearson correlation coefficients were calculated in the statistical language R (v.1.1.453, RStudio Inc, Boston, MA, USA) between remotely-sensed indices and ground-truthing data. Correlation maps were constructed with the R package corrplot [33]. Only correlations that were significant at P ≤ 0.05 are shown in the correlation maps. Principal component analysis (PCA) plots was performed in Microsoft Excel 2010 and XLSTAT (v.17.06, Addinsoft SARL, Paris, France) and presented as variable plots (cultivar-year, attribute).
3. Results
3.1. Cultivar and Phenology Specific Responses to Vine Water Status
In the first season, 2016, which was relatively warmer and drier, SHI vines were more water stressed (Ψs = −1.15 ± 0.05 MPa) than CAS vines (Ψs = −1.02 ± 0.03 MPa) (Table 2). SHI had a slightly, but not significantly, lower gs than CAS. Several thermal indices of crop water status were calculated: Crop water stress index (CWSI), conductance index (Ig) and (Tc-Ta). Of these indices, only CWSI detected a difference between cultivar, with a lower value for CAS (0.49 ± 0.04) than SHI (0.58 ± 0.06); this was consistent with the vine water status parameters (stem water potential, stomatal conductance). Comparison between veraison and pre-harvest timepoints, resulted in little difference of Ψs, while gs was lower at harvest, likely reflecting the higher VPD levels at that time. A cultivar × timepoint interaction was also observed for CWSI (Table 2). Of these indices, only CWSI was negatively correlated with Ψs and gs between the two cultivars.
In the second season, 2017, CAS blocks tended to have lower soil moisture, as estimated by the predawn leaf water potential (Ψpd), over the course of the season (average Ψpd −0.43 ± 0.12 MPa) compared to SHI, (average Ψpd −0.32 ± 0.08 MPa). In addition, soil moisture was lower during F1 than F2 (−0.40 ± 0.20 MPa and -0.35 ± 0.09 MPa, respectively). A lower gs in CAS than SHI reflected the Ψpd and Ψs values (Table 2). CWSI detected a difference between cultivars, with a lower value for CAS (0.50 ± 0.02) than SHI (0.64 ± 0.03), as did Ig, which also discriminated between the cultivars with higher values in CAS (4.79 ± 0.89) than SHI (1.23 ± 0.46). The thermal index (Tc-Ta) did not discriminate between cultivars viz. water stress. When comparing veraison and pre-harvest timepoints, Ψpd, Ψs and gs were all higher at pre-harvest compared to veraison, indicating lower water stress at the later timepoint.
3.2. Comparison of Vine Water Status Between Cultivars Within the Same Vineyard
Two cultivars, CAS and SHI, located within the same vineyard and planted within one year of each other over 45 years ago in the same soil type with similar soil depth were compared for differences between remotely-sensed thermal signatures. Soil moisture conditions, as reflected in Ψpd, were comparable between the two cultivars (Ψpd difference < 0.1 MPa, nsd) at the two timepoints, veraison and pre-harvest. Thermal water stress indices detected a difference in vine water status between the cultivars, with CAS being more stressed than SHI. This was also reflected through the measure of gs, being lower for CAS than SHI, thereby indicating a higher water stress in CAS. From a commercial imagery point of view, this was detected through a slight change in colour coding, from dark blue in the SHI section of the block, to a green-yellow colour spectrum in the CAS, identifying a change in the remotely-sensed thermal signature (Figure 2).
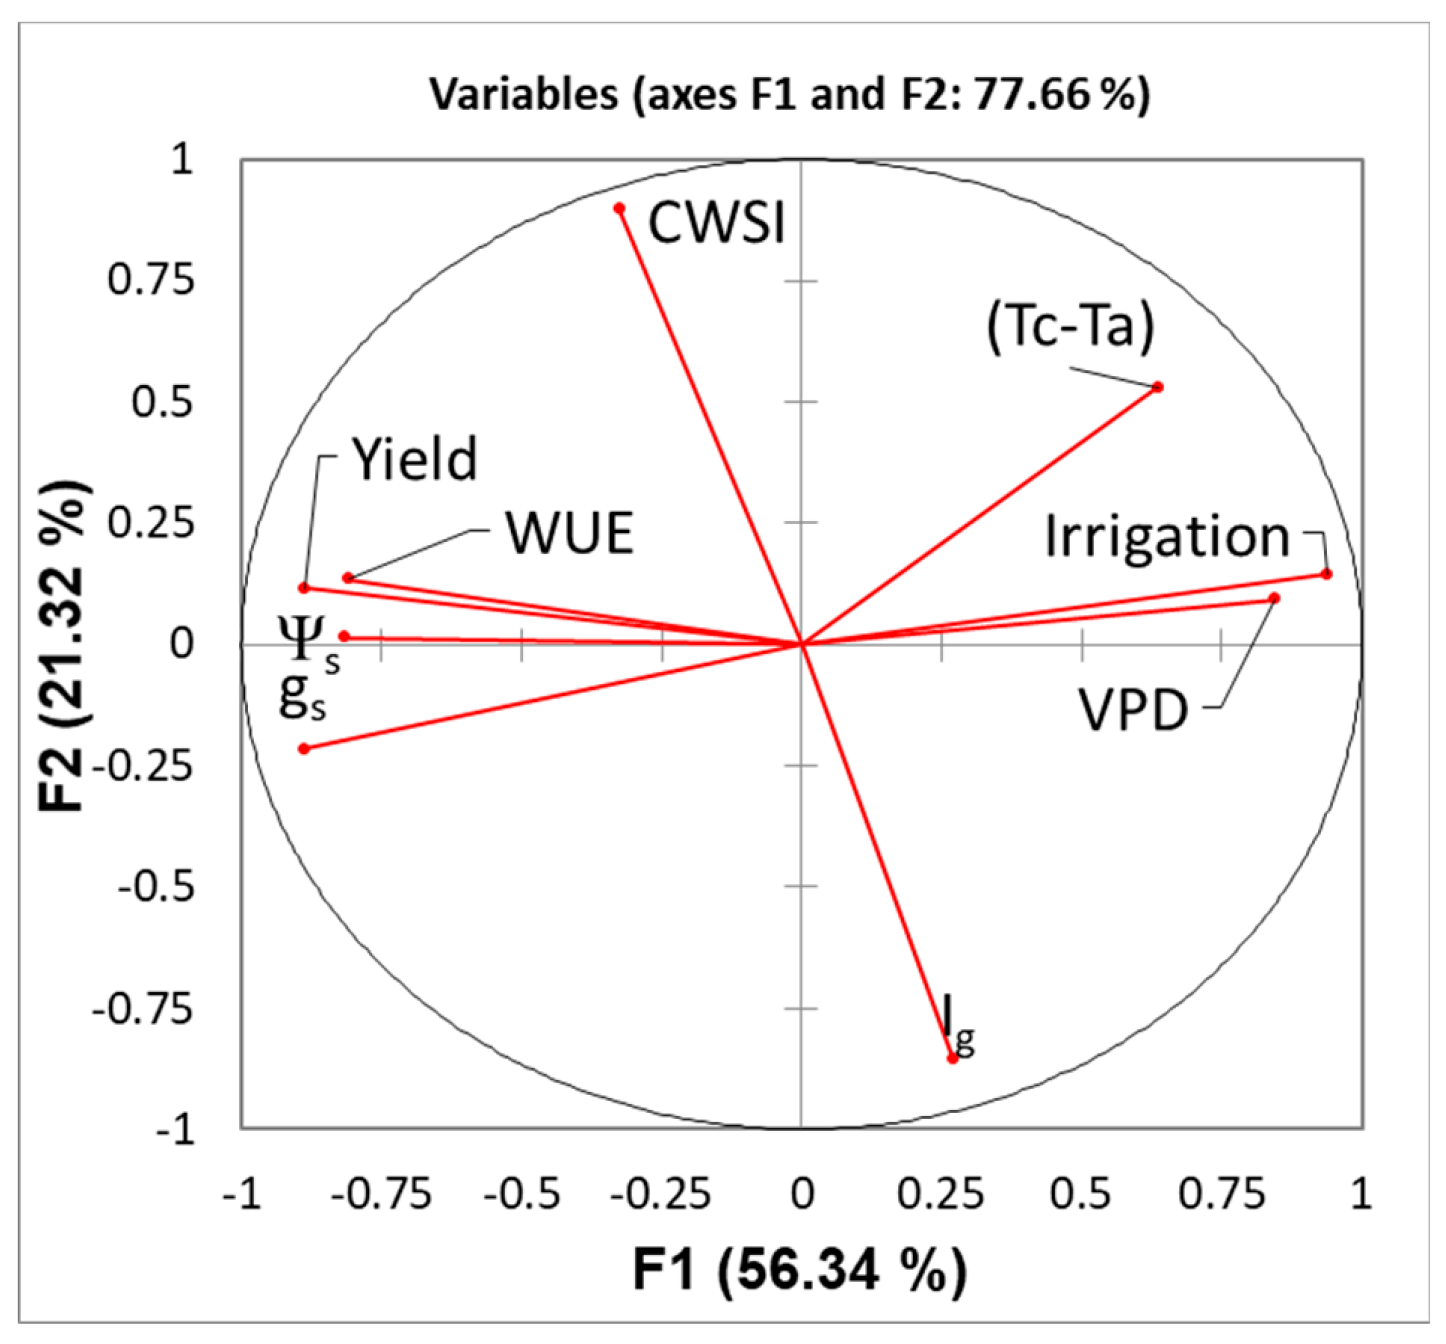
Principal component analysis (PCA) was used to assess the interaction between season and cultivar for the variables that were found to be significantly different. PCA involves deriving a linear combination of variables from the original variables, e.g. thermal indices, to maximize variance in the dataset, and the resulting orthogonal plots indicate a high level of uncorrelatedness [34]. PCA was performed on the aggregated data; principal component 1 (PC1) and principal component 2 (PC2) accounted for approx. 78% of the variation (Figure 3). The PC1 (or F1) axis primarily represented loadings of vine water status parameters related to irrigation as well as yield. In the second PC2 (F2) axis, thermal water status indices were represented as loadings. In PC1, irrigation was positively related to VPD and (Tc-Ta), and negatively related to yield, WUE, Ψs and gs. In PC2, CWSI was negatively related to Ig.
3.3. Comparison of Vine Water Status Between Vine Age
Two vineyard blocks of varying vine age, old (> 40 years) and young (< 10 years) for the cultivar CAS were studied with respect to the effect of vine age on vine water status during S2, F2. Soil moisture status (as reflected in Ψpd) was comparable between the two cultivars (Ψpd = −0.43). In this example, thermal indices failed to detect a difference in vine water status between the two age groups. This was also reflected in the ground-based measures (Table 3).
3.4. Correlations Between Remotely-Sensed Thermal Water Stress Indices and Conventional (Ground-Based) Measures of Vine Water Status
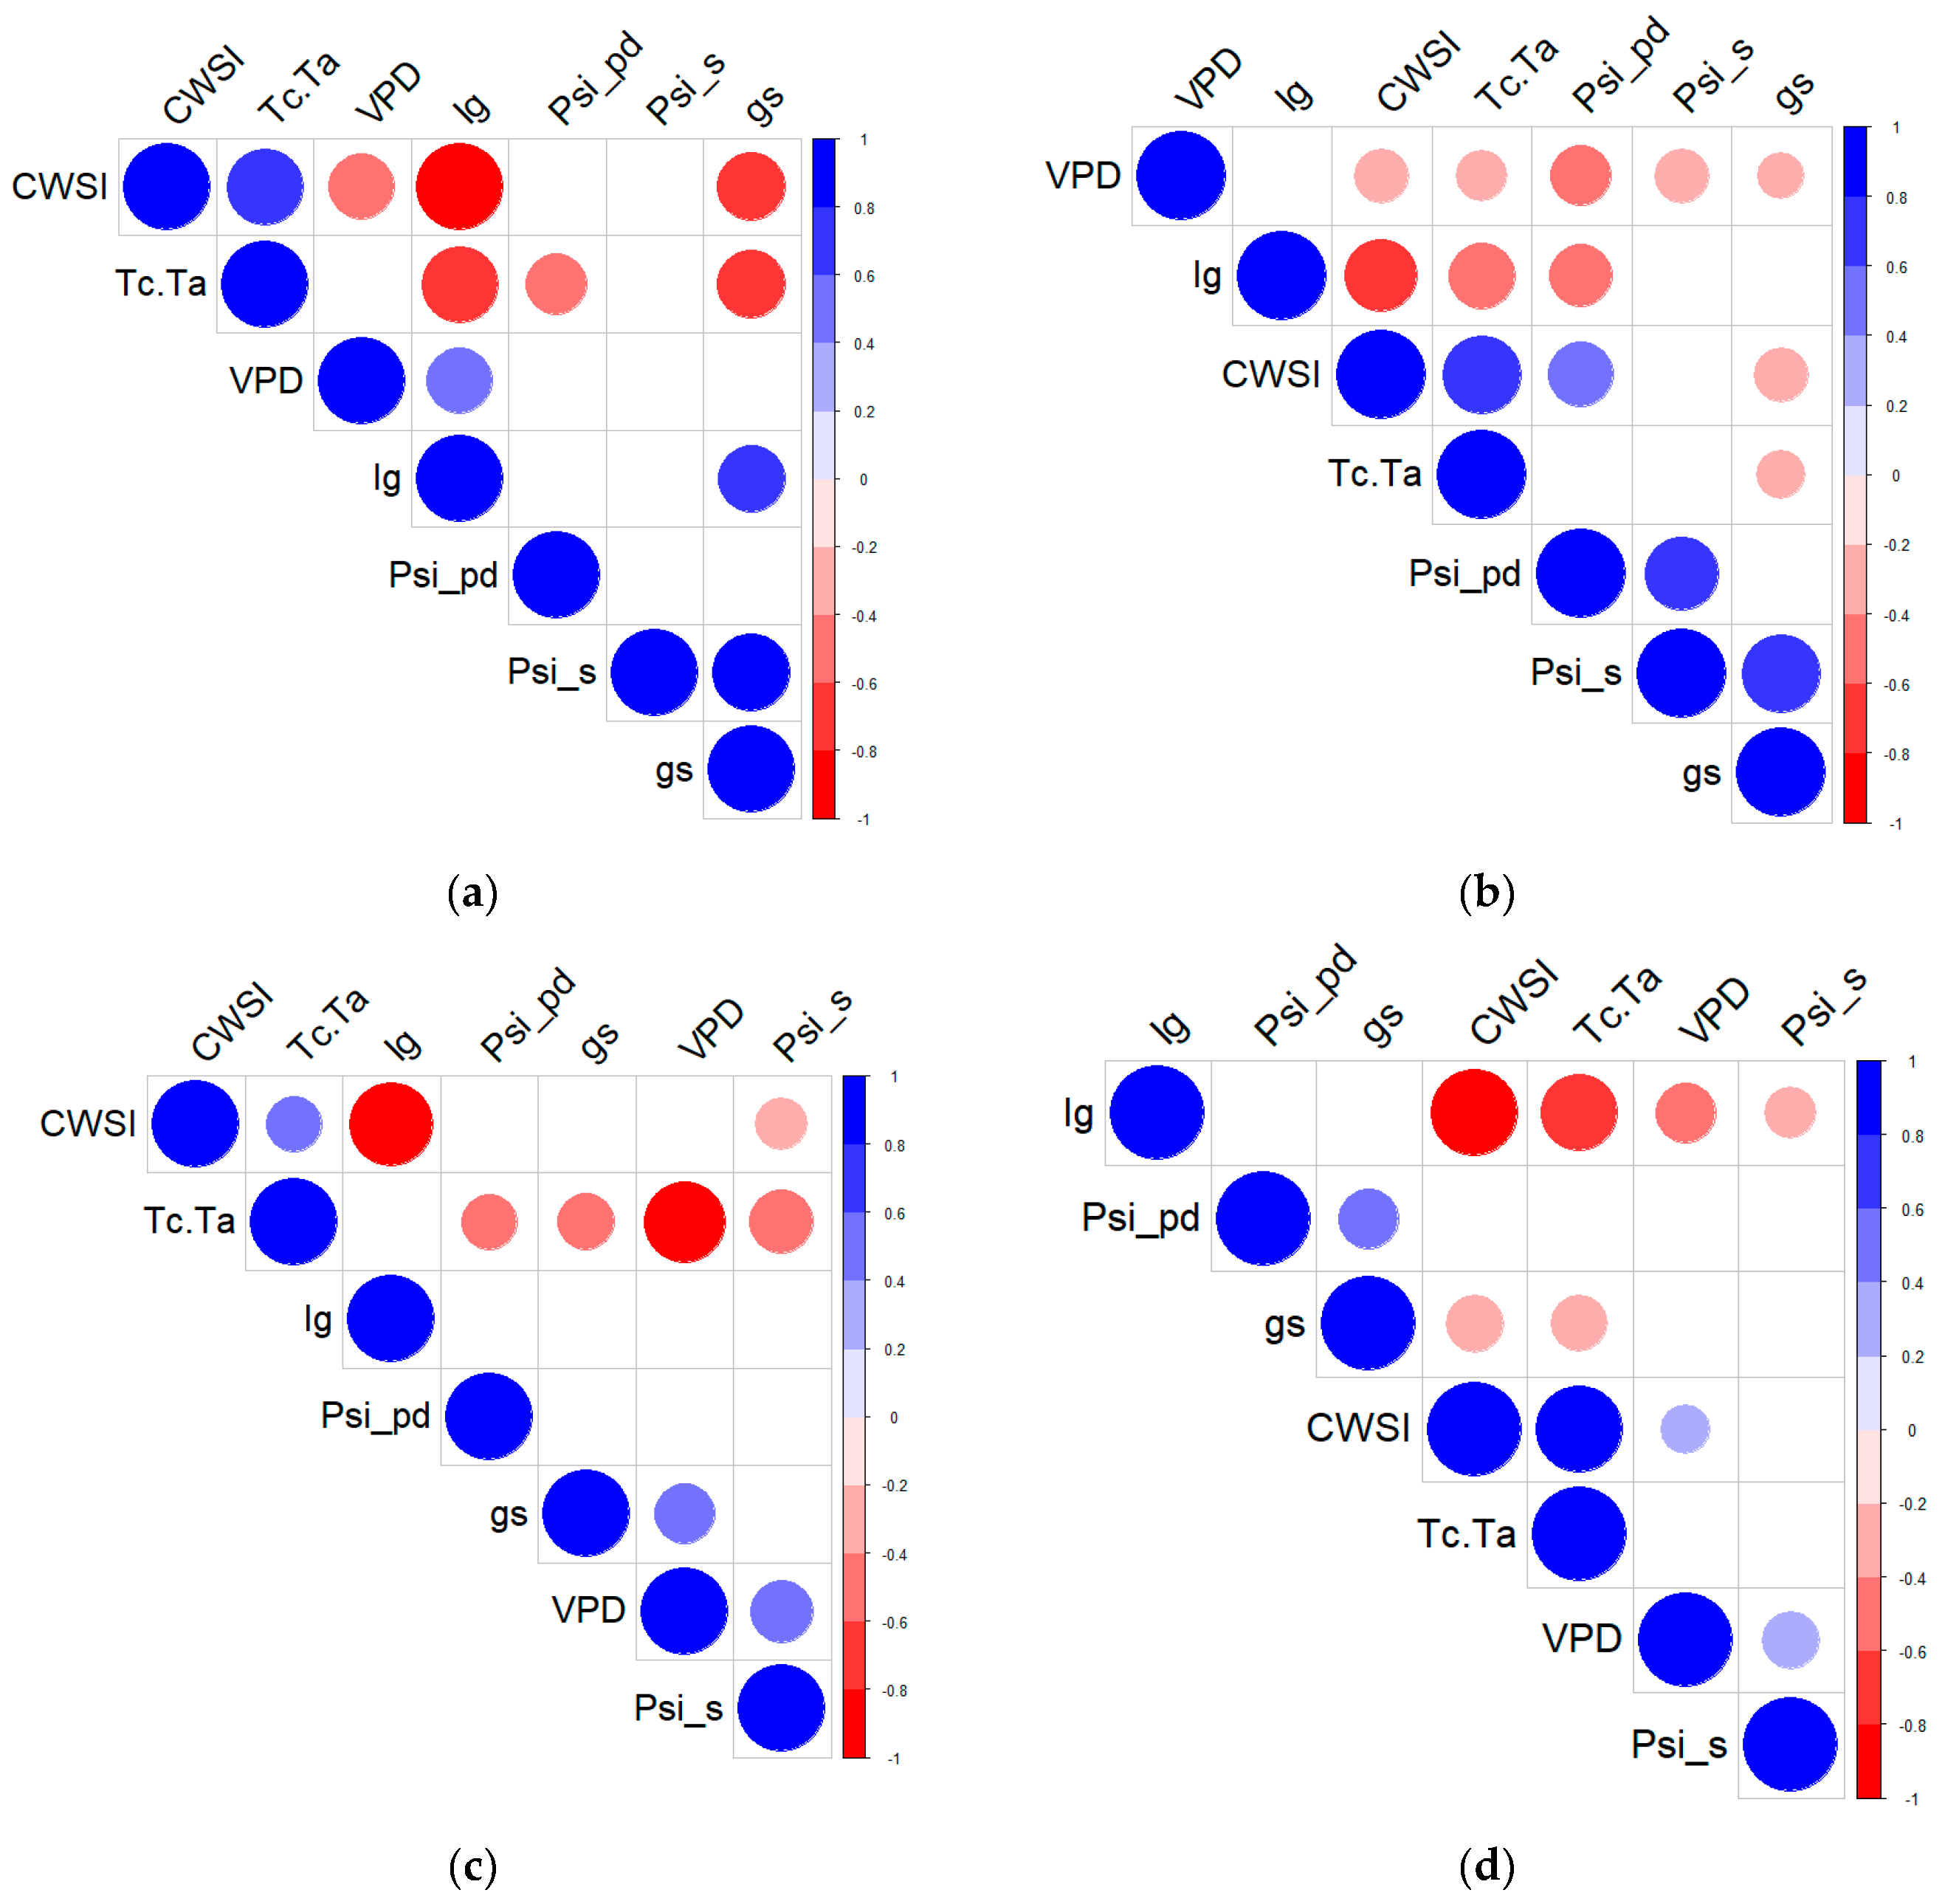
Correlations between remotely-sensed thermal water stress indices and conventional measures of vine water status were determined using correlograms, a graphical depiction of significant (p ≤ 0.05) relationships (Figure 4 and Figure 5). In general, CWSI was found to correlate positively with Ψs and gs, and negatively with Ig.
In 2016, vine water status (Ψs) of SHI at veraison was positively-correlated with Ig (R2 = 0.64 for Ψs, p = 0.0142) and negatively-correlated with CWSI (R2 = −0.69, p = 0.0062) (Figure 4a). For CAS at the same phenological stage, gs was negatively-correlated with CWSI (R2 = −0.14 for Ψs, p = 0.0437) (Figure 4b). For SHI at pre-harvest, Ψs and gs were negatively-correlated with CWSI (R2 = −0.54 for Ψs, p = 0.0297; R2 = −0.60 for gs, p = 0.0172) (Figure 4c). For CAS at pre-harvest, Ψs was positively-correlated with CWSI (R2 = 0.46, p = 0.0185) (Figure 4d).
In 2017, gs of SHI at veraison positively-correlated with Ig (R2=0.60, p=0.0244) and negatively-correlated with CWSI (R2 = −0.63, p = 0.0163) and (Tc-Ta) (R2 = −0.62, p = 0.0174) (Figure 5a). For CAS, gs negatively-correlated with CWSI (R2 = −0.38, p = 0.0170) and (Tc-Ta) (R 2= −0.31, p = 0.0481) (Figure 5b). At pre-harvest, SHI Ψs was negatively-correlated with CWSI (R2 = −0.37, p = 0.0254) and (Tc-Ta) (R 2= −0.54, p = 0.0001), while gs also negatively-correlated with (Tc-Ta) (R2 = −0.44, p = 0.0095) (Figure 5c). For CAS at pre-harvest, gs was negatively-correlated with CWSI and (Tc-Ta) (R2 = −0.39, p = 0.0027 for CWSI; R2 = −0.36, p = 0.0063 for (Tc-Ta)), and Ψs was negatively-correlated with Ig (R2 = −0.31, P = 0.0198) (Figure 5d). Overall, the relationships between the conventional vine water status parameters, Ψs and gs, appeared to be stronger with CWSI in the warmer, drier season (2016) compared to the cooler, wetter season (2017) when Ig and (Tc-Ta) showed stronger correlations.
4. Discussion
Reliable indicators of vine water status that are based on rapid and non-destructive measurements are becoming increasingly essential to improve irrigation scheduling. Our approach utilised a manned fixed wing aircraft; in contrast to other airborne platforms such as UAVs and satellites, this choice provided a wide spatial coverage within a short time frame to allow for regional-scale, inter-vineyard comparison of vine water status for decision making at the regional scale. Had similar data been collected using alternative platforms such as UAVs, inter-block comparisons across the same spatial scale (−1000 ha), long flight times would likely result in data collection under different environmental conditions, which may lead to erroneous conclusions of vine water status between blocks. UAV (or unmanned aerial systems, UAS) platforms offer a convenient method of acquiring similar data, however, are limited to smaller spatial scales due to battery power that limits typical flight times to 10–30 min [35]. This approach is feasible for small vineyards that could be flown within a few hours under similar environmental conditions. Similarly, remote sensing based on satellite imagery at present, offers high spatial coverage, but with the liability of low ground resolution and infrequent data collection [36].
4.1. Comparison of Remotely-Sensed Thermal Water Status Indices
Multivariate relationships between environmental conditions, vine water status and thermal water stress indices reflected contrasting seasonal differences and corresponded with differences between variables, cultivars and blocks. The effect of environment on crop water status has been well documented; VPD, a key environmental driver for transpiration, has been shown to be strongly (negatively) correlated with leaf and stem water potentials, and stomatal conductance [37]. In 2016, warmer and drier conditions influenced the response of vine water status to water availability and environmental demand. Higher VPD conditions resulted in lower Ψs and gs. These warmer than average climatic conditions had implications to vine physiological performance as well as irrigation requirements (Table 2) as demand for water would have been greater under the higher heat levels from both vine transpiration and soil moisture losses through surface evaporation (reference evapotranspiration, ET0 = 967 mm). In the cooler and wetter 2017 season, higher VPD conditions did not result in increased vine water stress, and, consequently, irrigation applications were considerably lower compared to the previous season. The lower irrigation requirement corresponded to above average rainfall throughout the growing season, lower ET0 (860 mm), and only eight days where temperatures exceed 35 °C, compared to 20 days in the previous season.
One of the primary objectives of the present study was to validate several published thermal indices of vine water status including CWSI, Ig, and (Tc-Ta) from airborne platforms. Thermal water stress indices that most accurately reflected vine water status in the warmer 2016 were (Tc-Ta) and CWSI, the latter which was only weakly correlated to the two-reference vine water status indicators, Ψs and gs. Several studies have characterised vine water status based on Ψl particularly to validate crop water status indices such as CWSI [18,38]. A recent study on the use of CWSI in irrigated vineyards in California found that CWSI values were higher in the morning than the afternoon for a given level of soil moisture [39]. Remote sensing provides a better indicator of the water status of individual vines as this approach integrates multiple leaves and shoots of the canopy, which is not the case with Ψs and gs measurements derived from ground-based measurements of individual leaves.
In the cooler 2017 season, the remotely-sensed thermal indices that best reflected vine water status were Ig and (Tc-Ta). Ig is linearly related to leaf conductance and is therefore more suitable under a wider range of environmental conditions (e.g. high and low VPD) [17], confirming the usefulness of this index in predicting vine water status in the cooler season. (Tc-Ta) was also a reliable indicator of vine water status in the same season; this result is consistent with the warmer 2016 season, reflecting the robustness and versatility of the index.
4.2. Cultivar Differences in Vine Water Status
The two predominant cultivars of Coonawarra, CAS and SHI, which combined, contribute approximately 84% of cultivars planted in the region (VHA 2018) were studied over two seasons. In the warmer and drier season of 2016, SHI was observed to be more water-stressed than CAS based on a lower Ψs, a well-established indicator of vine water status [40,41,42,43], lower gs, and higher CWSI. Stem water potential was used in this study as it is less variable than Ψl and therefore a more reliable indicator of vine water status [44]. Stomatal conductance is another reliable measure of plant water status; gs has shown to be highly correlated with Ψs in a variety of crops including grapevines [44,45,46,47]. The advantage of using gs over Ψs is that it captures the dynamic state of water fluxes within the leaf of the plant. This aspect is particularly important in capturing the true water status of certain grapevine cultivars previously reported as being near-isohydric, which under soil moisture deficits, decrease gs which in turn increases Ψs, therefore underestimating the true water stress of the plant [48]. The response in SHI across the region may reflect the relatively anisohydric behaviour of SHI compared to CAS [49], indicating that SHI tends to be a more “optimistic” cultivar vis-a-vis stomatal response to decreasing soil moisture availability or increased environmental demand (higher VPD). In the cooler conditions of 2017, CAS vines had a lower water status than SHI although both cultivars had relatively high gs values reflecting well-watered conditions. In 2017, the lower vine water status of CAS may have resulted from the lower soil moisture availability as indicated by Ψpd. However, both cultivars exhibited Ψs within a narrow range (> −1 MPa) indicating minimal water stress [47]. The associated high gs values of both cultivars also confirm that low water stress was observed throughout the cooler season and the gs difference between cultivars was small at high Ψs values. Comparing different grapevine cultivars in a warm climate, Rogiers et al. observed that SHI had a lower Ψs and daytime gs compared to CAS indicating that the former is relatively anisohydric (compared to CAS) [50], consistent with our observations. (Tc-Ta) was the only thermal index that reflected the lower water status in the cooler season.
4.3. Aerial Thermal Imaging as a Spatial Investigative Tool
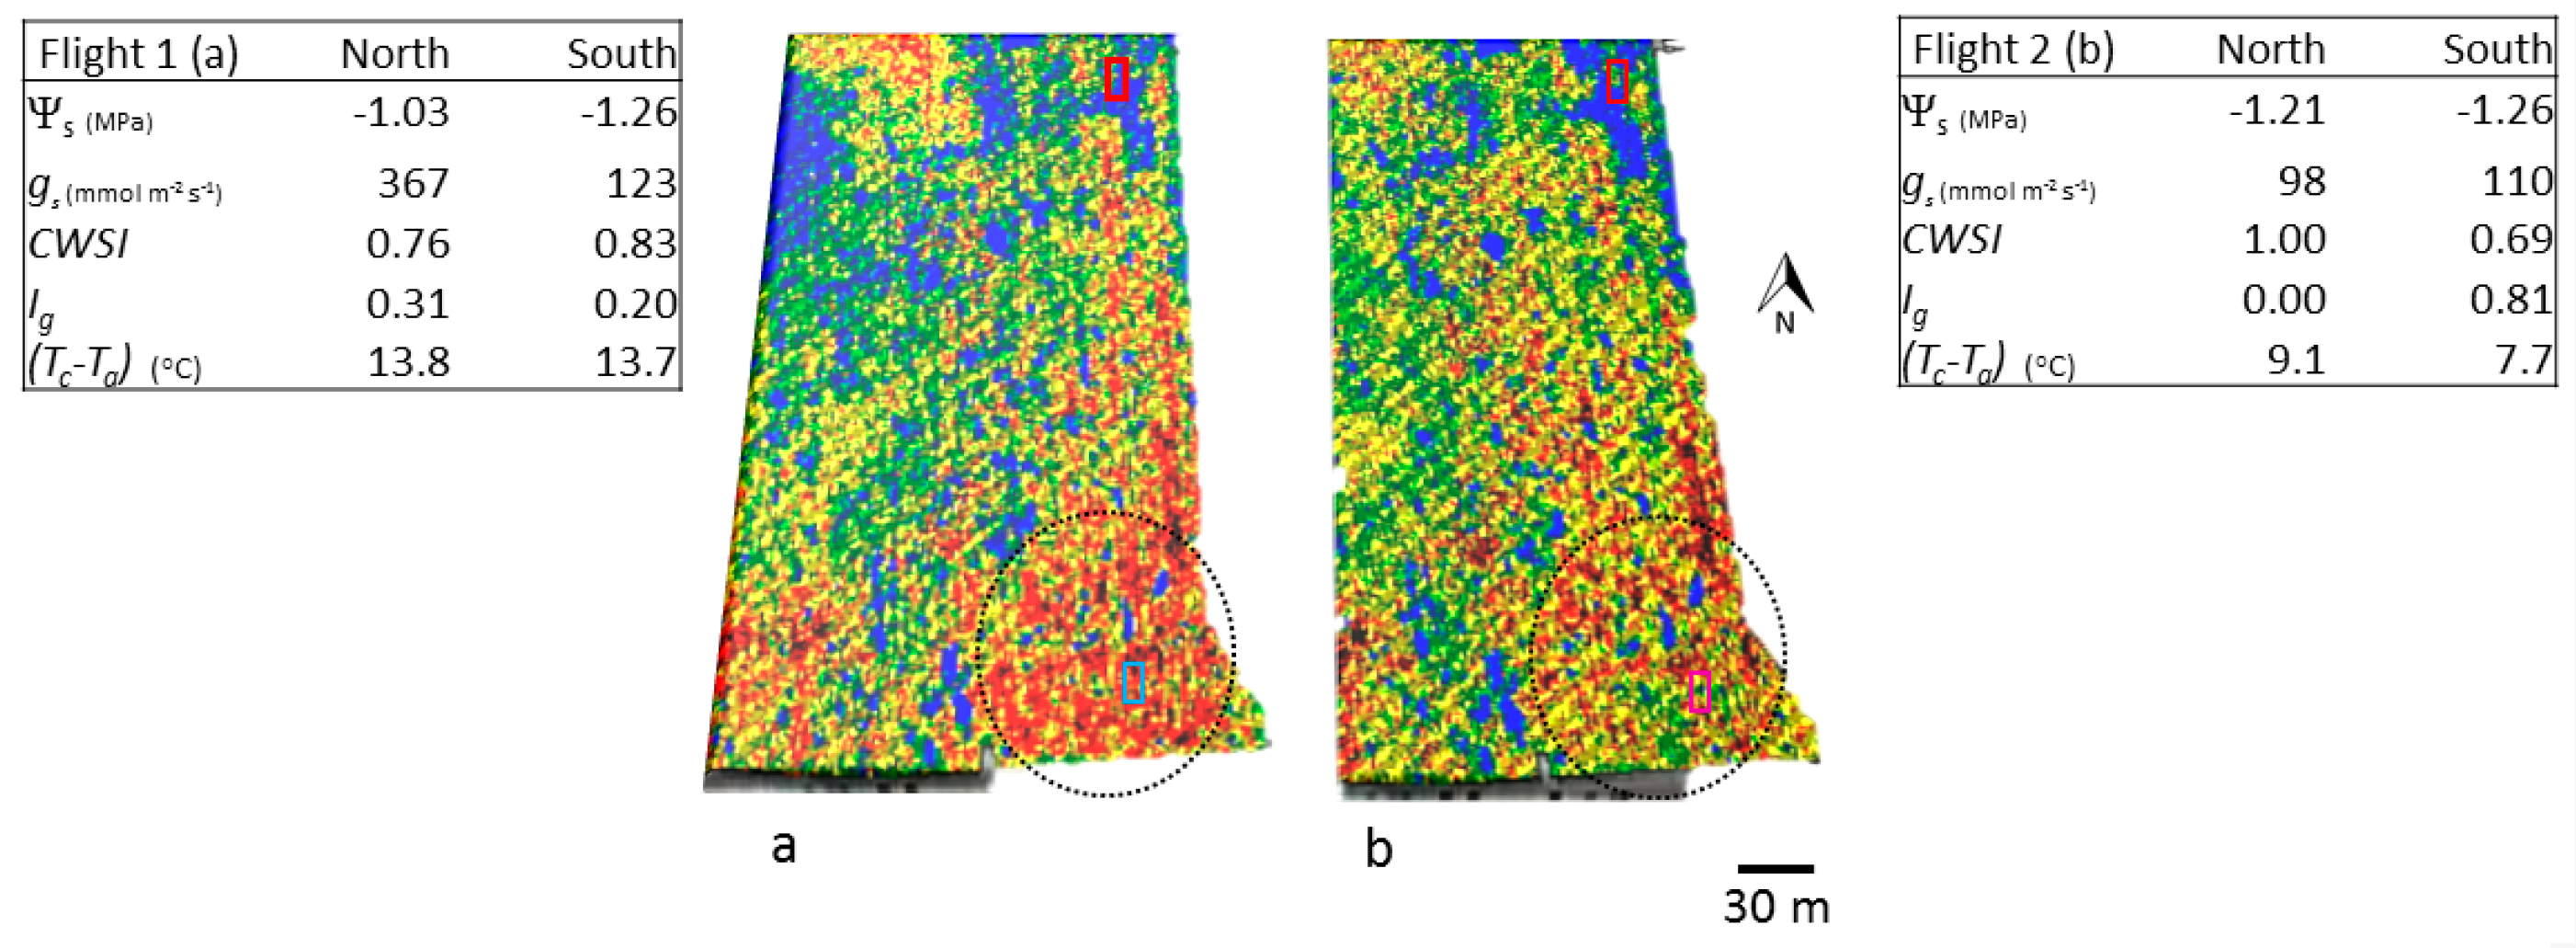
A key benefit of high spatial resolution data is the ability to detect variation in vine and soil characteristics across a vineyard block. Soil type variances within a block have been shown to have an influence on canopy temperature and therefore, gs [51]. In the absence of soil variation within one particular study block, a gradient of water status was observed between the northern and southern sections, where vines in the northern section shown in blue had relatively high-water status (average gs −367 mmol H2O m−2 s−1), whereas vines in the southern section shown in red were relatively water stressed (average gs −123 mmol H2O m−2 s−1) (Figure 6a).
Dripper uniformity was subsequently measured in the block and multiple (three of every four, on average) drip failures were observed and attributed to iron bacteria. The presence of iron bacteria and associated precipitates has been found to decrease bore productivity, block irrigation systems or render them inefficient, damage pumps and pumping equipment as well as lead to overall system deterioration [52]. Dripper replacement in the block increased the spatial uniformity of vine water status between the northern and southern sections of the block (Figure 6b). This example illustrates the potential benefits of high spatial resolution data to detect inefficiencies in irrigation supply within a vineyard which can be easily remedied to improve vine uniformity and productivity. Although the present study utilised thermal imaging to detect irrigation inefficiencies in the block via differences in vine water status, it should be noted that other measures such as vegetation indices (e.g. NDVI) obtained from aerial multispectral cameras could also indicate similar inefficiencies indirectly through differences in vine vigour and health.
From a practitioner’s standpoint, the value of obtaining remotely-sensed thermal indices is that they help to confirm whether supplemental irrigation is required for a given cultivar or area within a block. However, the feasibility of using CWSI and Ig as indicators of vine waters status in commercial scenarios is limited due to the need to obtain Twet and Tdry reference temperatures [17,51]. Therefore, (Tc-Ta) appears to be the most convenient of the thermal indices tested in this trial as it does not require these reference temperatures. In addition, Tc and Ta can be continuously measured using relatively inexpensive infrared cameras. New continuous systems of canopy temperature measurements will in the future allow for the automation of irrigation applications through the use of empirical calibrations by cultivar and block, taking into account environmental demands to establish irrigation schedules [53]. The present study validates the use of a commercial remote sensing service to inform vineyard irrigation at the regional scale, allowing for the simultaneous comparison of water status of individual vines across multiple vineyard blocks. Surveying vine water status in multiple vineyards across a region is constrained by the narrow time window required for accurate vine water status measurements. Remote sensing approaches such as that used in the present study can expedite data collection from large areas. The use of simple crop water status indices such as (Tc-Ta) obviate the need for reference temperaures, which are impractical to acquire, particularly at large spatial scales via remote sensing. Further work is required to establish the usefulness of this index at other phenological stages such as early in the growing season.
5. Conclusions
This study demonstrated the use of high resolution airborne thermal imaging to assess the vine water status across an entire viticultural region. The remotely-sensed thermal indices of vine water status were generally in agreement with ground-based measures of vine water status particularly when environmental conditions were conducive to encourage maximum leaf transpiration rate. The high spatial resolution offered by the thermal camera allowed for the clear separation of the non-vine (inter-row) signal from the vine (canopy) signal; this aspect is critical when using remote sensing data in heterogenous crops such as grapevines planted in rows. Our study also highlighted that irrigation inefficiencies could be identified using aerial thermal imagery that were not apparent from the ground. This allows grape growers to identify within-vineyard variability in vine water status that has the potential to save valuable water resources through precision irrigation as well as improve overall WUE.
Author Contributions
Conceptualization, C.M.K.; investigation, V.P. and C.M.K.; methodology, V.P.; writing–original draft, V.P. and C.M.K.; writing–review & editing, V.P.
Acknowledgments
The authors, on behalf of Coonawarra Grape and Wine Incorporated (CGWI), wish to thank Katnook Estate, Wynns Coonawarra Estate, Balnaves Coonawarra and Yalumba for access to their vineyards and for providing substantial material and in-kind support. In particular, we would like to thank the steering committee Allen Jenkins (Wynns Coonawarra Estate), Chris Brodie (Katnook Estate), Pete Balnaves (Balnaves Coonawarra), and James Freckleton (Yalumba) for their valued assistance and technical help with the delivery of the project and final report. We thank Kerry DeGaris, Cindy Hutchinson, Raquel Kallas and Xinhao Hu for their assistance with the field data collection. We thank Primary Industries and Regions SA (PIRSA), and South East Natural Resource Management Board for their financial support of this project. In particular, we would like to thank Scott Ashby, David Leach and Jack Langeberg, Tim Collins and Tahney Black for their interest and ongoing support. We would like to acknowledge Ceres Imaging, in particular, Ashwin Madgavkar and Dan Urban for their technical support and assistance throughout the trial. The authors would like to sincerely thank Tony Proffitt for his comments and suggestions to the manuscript. Finally, we thank the two anonymous reviewers who provided valuable suggestions to improve this manuscript. This project, part of the PIRSA cluster funding program, and a recipient of SENRM grant, has provided an opportunity for the Grapegrowers of Coonawarra to collaborate and share information targeted at improving water use efficiency and sustainability whilst improving fruit quality and input efficiencies.
Conflicts of Interest
There are no conflicts of interest arising from or relating to this work.
References
- Araus, J.L. The problems of sustainable water use in the Mediterranean and research requirements for agriculture. Ann. Appl. Biol. 2004, 144, 259–272. [Google Scholar]
- Chapman, D.M.; Roby, G.; Ebeler, S.E.; Guinard, J.X.; Matthews, M.A. Sensory attributes of Cabernet Sauvignon wines made from vines with different water status. Aust. J. Grape Wine Res. 2005, 11, 339–347. [Google Scholar] [CrossRef]
- Chaves, M.M.; Zarrouk, O.; Francisco, R.; Costa, J.M.; Santos, T.; Regalado, A.P.; Rodrigues, M.L.; Lopes, C.M. Grapevine under deficit irrigation: Hints from physiological and molecular data. Ann. Bot. 2010, 105, 661–676. [Google Scholar] [PubMed]
- Dry, P.R.; Loveys, B.R. Factors influencing grapevine vigour and the potential for control with partial rootzone drying. Aust. J. Grape Wine Res. 1998, 4, 140–148. [Google Scholar] [CrossRef]
- McCarthy, M.G. The effect of transient water deficit on berry development of cv. Shiraz (Vitis vinifera L.). Aust. J. Grape Wine Res. 1997, 3, 102–108. [Google Scholar]
- Ojeda, H.; Andary, C.; Kraeva, E.; Carbonneau, A.; Deloire, A. Influence of pre- and postveraison water deficit on synthesis and concentration of skin phenolic compounds during berry growth of Vitis vinifera cv Shiraz. Am. J. Enol. Vitic. 2002, 53, 261–267. [Google Scholar]
- Van Leeuwen, C.; Trégoat, O.; Choné, X.; Bois, B.; Pernet, D.; Gaudillère, J.P. Vine water status is a key factor in grape ripening and vintage quality for red Bordeaux wine. How can it be assessed for vineyard management purposes? J. Int. Sci. Vigne Vin 2009, 43, 121–134. [Google Scholar] [CrossRef]
- Vandeleur, R.K.; Mayo, G.; Shelden, M.C.; Gilliham, M.; Kaiser, B.N.; Tyerman, S.D. The role of plasma membrane intrinsic protein aquaporins in water transport through roots: Diurnal and drought stress responses reveal different strategies between isohydric and anisohydric cultivars of grapevine. Plant Physiol. 2009, 149, 445–460. [Google Scholar] [CrossRef]
- Schultz, H.R. Differences in hydraulic architecture account for near-isohydric and anisohydric behaviour of two field-grown Vitis vinifera L cultivars during drought. Plant Cell Environ. 2003, 26, 1393–1405. [Google Scholar] [CrossRef]
- Berger-Landefeldt, U. Der Wasserhaushalt der Alpenpflanzen; Schweizerbart: Stuttgart, Germany, 1936. [Google Scholar]
- Costa, J.M.; Ortuño, M.F.; Lopes, C.M.; Chaves, M.M. Grapevine varieties exhibiting differences in stomatal response to water deficit. Funct. Plant Biol. 2012, 39, 179–189. [Google Scholar] [CrossRef]
- Jones, H.G. Irrigation scheduling: Advantages and pitfalls of plant-based methods. J. Exp. Bot. 2004, 55, 2427–2436. [Google Scholar] [CrossRef] [PubMed]
- Jackson, R.D.; Idso, S.B.; Reginato, R.J.; Pinter, P.J., Jr. Canopy temperature as a crop water-stress indicator. Water Resour. Res. 1981, 17, 1133–1138. [Google Scholar] [CrossRef]
- Raschke, K. Heat Transfer between the Plant and the Environment. Annu. Rev. Plant Physiol. Plant Mol. Biol. 1960, 11, 111–126. [Google Scholar] [CrossRef]
- Jones, H.G.; Stoll, M.; Santos, T.; Sousa, C.D.; Chaves, M.M.; Grant, O.M. Use of infrared thermography for monitoring stomatal closure in the field: Application to grapevine. J. Exp. Bot. 2002, 53, 2249–2260. [Google Scholar] [CrossRef] [PubMed]
- Idso, S.B.; Jackson, R.D.; Pinter, P.J., Jr.; Reginato, R.J.; Hatfield, J.L. Normalizing the stress-degree-day parameter for environmental variability. Agric. Meteorol. 1981, 24, 45–55. [Google Scholar] [CrossRef]
- Jones, H.G. Use of thermography for quantitative studies of spatial and temporal variation of stomatal conductance over leaf surfaces. Plant Cell Environ. 1999, 22, 1043–1055. [Google Scholar] [CrossRef] [Green Version]
- Bellvert, J.; Zarco-Tejada, P.J.; Girona, J.; Fereres, E.J.P.A. Mapping crop water stress index in a ‘Pinot-noir’ vineyard: Comparing ground measurements with thermal remote sensing imagery from an unmanned aerial vehicle. Precis. Agric. 2014, 15, 361–376. [Google Scholar] [CrossRef]
- Möller, M.; Alchanatis, V.; Cohen, Y.; Meron, M.; Tsipris, J.; Naor, A.; Ostrovsky, V.; Sprintsin, M.; Cohen, S. Use of thermal and visible imagery for estimating crop water status of irrigated grapevine. J. Exp. Bot. 2007, 58, 827–838. [Google Scholar] [CrossRef]
- Bramley, R.G.V.; Hamilton, R.P. Understanding variability in winegrape production systems 1 within vineyard variation in yield over several vintages. Aust. J. Grape Wine Res. 2004, 10, 32–45. [Google Scholar] [CrossRef]
- Baluja, J.; Diago, M.P.; Balda, P.; Zorer, R.; Meggio, F.; Morales, F.; Tardaguila, J. Assessment of vineyard water status variability by thermal and multispectral imagery using an unmanned aerial vehicle (UAV). Irrig. Sci. 2012, 30, 511–522. [Google Scholar] [CrossRef]
- Gonzalez-Dugo, V.; Zarco-Tejada, P.; Berni, J.A.; Suárez, L.; Goldhamer, D.; Fereres, E. Almond tree canopy temperature reveals intra-crown variability that is water stress-dependent. Agric. For. Meteorol. 2012, 154–155, 156–165. [Google Scholar] [CrossRef]
- Zarco-Tejada, P.J.; Gonzalez-Dugo, V.; Berni, J.A.J. Fluorescence, temperature and narrow-band indices acquired from a UAV platform for water stress detection using a micro-hyperspectral imager and a thermal camera. Remote Sens. Environ. 2012, 117, 322–337. [Google Scholar] [CrossRef]
- Zarco-Tejada, P.J.; González-Dugo, V.; Williams, L.E.; Suárez, L.; Berni, J.A.; Goldhamer, D.; Fereres, E. A PRI-based water stress index combining structural and chlorophyll effects: Assessment using diurnal narrow-band airborne imagery and the CWSI thermal index. Remote Sens. Environ. 2013, 138, 38–50. [Google Scholar] [CrossRef]
- Romero, M.; Luo, Y.; Su, B.; Fuentes, S. Vineyard water status estimation using multispectral imagery from an UAV platform and machine learning algorithms for irrigation scheduling management. Comput. Electron. Agric. 2018, 147, 109–117. [Google Scholar] [CrossRef]
- Di Gennaro, S.F.; Matese, A.; Gioli, B.; Toscano, P.; Zaldei, A.; Palliotti, A.; Genesio, L. Multisensor approach to assess vineyard thermal dynamics combining high resolution unmanned aerial vehicle (UAV) remote sensing and wireless sensor network (WSN) proximal sensing. Sci. Hortic. 2017, 221, 83–87. [Google Scholar] [CrossRef]
- Matese, A.; Baraldi, R.; Berton, A.; Cesaraccio, C.; Di Gennaro, S.; Duce, P.; Facini, O.; Mameli, M.G.; Piga, A.; Zaldei, A. Estimation of water stress in grapevines using proximal and remote sensing methods. Remote Sens. 2018, 10, 114. [Google Scholar] [CrossRef]
- Hall, A.; Lamb, D.W.; Holzapfel, B.; Louis, J. Optical remote sensing applications in viticulture—A review. Aust. J. Grape Wine Res. 2002, 8, 36–47. [Google Scholar] [CrossRef]
- Taylor, J.A.; Coulouma, G.; Lagacherie, P.; Tisseyre, B. Mapping soil units within a vineyard using statistics associated with high-resolution apparent soil electrical conductivity data and factorial discriminant analysis. Geoderma 2009, 153, 278–284. [Google Scholar] [CrossRef]
- Trought, M.C.T.; Bramley, R.G.V. Vineyard variability in Marlborough, New Zealand: Characterising spatial and temporal changes in fruit composition and juice quality in the vineyard. Aust. J. Grape Wine Res. 2011, 17, 72–82. [Google Scholar] [CrossRef]
- Hall, A.; Jones, G.V. Spatial analysis of climate in winegrape-growing regions in Australia. Aust. J. Grape Wine Res. 2010, 16, 389–404. [Google Scholar] [CrossRef]
- Longbottom, M.L.; Maschmedt, D.; Pichler, M. Unearthing Viticulture in the Limestone Coast; Limestone Coast Grape and Wine Industry Council: Coonawarra, SA, Australia, 2011. [Google Scholar]
- Wei, T.; Simko, V. R Package “Corrplot”: Visualisation of a Correlation Matrix; (Version 0.84); GitHub, Inc.: San Francisco, CA, USA, 2011. [Google Scholar]
- Heymann, H.; Noble, A.C. Comparison of Canonical variate and principle component analyses of wine descriptive analysis data. J. Food Sci. 1989, 54, 1355–1358. [Google Scholar] [CrossRef]
- Hardin, P.J.; Lulla, V.; Jensen, R.R.; Jensen, J.R. Small Unmanned Aerial Systems (sUAS) for environmental remote sensing: Challenges and opportunities revisited. GISci. Remote Sens. 2019, 56, 309–322. [Google Scholar] [CrossRef]
- Matese, A.; di Gennaro, S.F. Technology in precision viticulture: A state of the art review. Int. J. Wine Res. 2015, 7, 69–81. [Google Scholar] [CrossRef]
- Jarvis, P.G. The interpretation of the variations in leaf water potential and stomatal conductance found in canopies in the field. Philos. Trans. R. Soc. Lond. B 1976, 273, 593–610. [Google Scholar] [CrossRef]
- Bellvert, J.; Marsal, J.; Girona, J.; Zarco-Tejada, P.J. Seasonal evolution of crop water stress index in grapevine varieties determined with high-resolution remote sensing thermal imagery. Irrig. Sci. 2015, 33, 81–93. [Google Scholar] [CrossRef]
- Prueger, J.H.; Parry, C.K.; Kustas, W.P.; Alfieri, J.G.; Alsina, M.M.; Nieto, H.; Wilson, T.G.; Hipps, L.E.; Anderson, M.C.; Hatfield, J.L.; et al. Crop Water Stress Index of an irrigated vineyard in the Central Valley of California. Irrig. Sci. 2019, 37, 297–313. [Google Scholar] [CrossRef]
- Chone, X.; Van Leeuwen, C.; Dubourdieu, D.; Gaudillère, J.P. Stem water potential is a sensitive indicator of grapevine water status. Ann. Bot. 2001, 87, 477–483. [Google Scholar] [CrossRef]
- Shackel, K.A. Water relations of woody perennial plant species. J. Int. Sci. Vigne Vin 2007, 41, 121–129. [Google Scholar] [CrossRef]
- Williams, L.E.; Araujo, F.J. Correlations among predawn leaf, midday leaf, and midday stem water potential and their correlations with other measures of soil and plant water status in Vitis vinifera. J. Am. Soc. Hortic. Sci. 2002, 127, 448–454. [Google Scholar] [CrossRef]
- Santesteban, L.G.; Miranda, C.; Royo, J.B. Suitability of pre-dawn and stem water potential as indicators of vineyard water status in cv Tempranillo. Aust. J. Grape Wine Res. 2011, 17, 43–51. [Google Scholar] [CrossRef]
- McCutchan, H.; Shackel, K.A. Stem water potential as a sensitive indicator of water-stress in prune trees (Prunus domestica L cv French). J. Am. Soc. Hortic. Sci. 1992, 117, 607–611. [Google Scholar] [CrossRef]
- Naor, A. Relations between leaf and stem water potentials and stomatal conductance in three field-grown woody species. J. Hortic. Sci. Biotechnol. 1998, 73, 431–436. [Google Scholar] [CrossRef]
- Naor, A.; Gal, Y.; Bravdo, B. Crop load affects assimilation rate, stomatal conductance, stem water potential and water relations of field-grown Sauvignon Blanc grapevines. J. Exp. Bot. 1997, 48, 1675–1680. [Google Scholar] [CrossRef]
- Shackel, K. A plant-based approach to deficit irrigation in trees and vines. HortScience 2011, 46, 173–177. [Google Scholar] [CrossRef]
- Spinelli, G.M.; Shackel, K.A.; Gilbert, M.E. A model exploring whether the coupled effects of plant water supply and demand affect the interpretation of water potentials and irrigation management. Agric. Water Manag. 2017, 192, 271–280. [Google Scholar] [CrossRef] [Green Version]
- Collins, M.; Loveys, B.R. Optimising Irrigation for Different Cultivars; Final report to the Australian Grape and Wine Research and Development Corporation; Project No. CSP 05/02; Australian Grape and Wine Research and Development Corporation: Adelaide, SA, Australia, 2010; 188p. [Google Scholar]
- Rogiers, S.Y.; Greer, D.H.; Hutton, R.J.; Landsberg, J.J. Does night-time transpiration contribute to anisohydric behaviour in a Vitis vinifera cultivar? J. Exp. Bot. 2009, 60, 3751–3763. [Google Scholar] [CrossRef] [PubMed]
- Gutierrez, S.; Diago, M.P.; Fernández-Novales, J.; Tardaguila, J. Vineyard water status assessment using on-the-go thermal imaging and machine learning. PLoS ONE 2018, 13, e0192037. [Google Scholar] [CrossRef] [PubMed]
- Harrington, N.M.; Harrington, G.A. Best Management Practices for Irrigation Water Quality Issues in the Limestone Coast Region of South Australia; A report prepared for the Limestone Coast Grape and Wine Council and the South East Natural Resources Management Board by Innovative Groundwater Solutions; Innovative Groundwater Solutions: Victor Harbor, SA, Australia, 2017. [Google Scholar]
- Pagay, V.; Kidman, C.; Jenkins, A. Proximal and remote sensing tools for regional-scale characterisation of grapevine water and nitrogen status in Coonawarra. Wine Vitic. J. 2016, 31, 42–47. [Google Scholar]
Figure 1.
Regional vineyards in Coonawarra, South Australia surveyed by airborne remote sensing (red and blue regions) and a subset of those that were ground-truthed (red regions). The distance from north to south of the map is approx. 20 km.
Figure 1.
Regional vineyards in Coonawarra, South Australia surveyed by airborne remote sensing (red and blue regions) and a subset of those that were ground-truthed (red regions). The distance from north to south of the map is approx. 20 km.

Figure 2.
Comparison of vine water status between cultivars SHI (a) and CAS (b) using remotely-sensed thermal images colour-coded to temperature. Colour codes of relative values: Blue/green=low/no water stress, yellow/red=moderate water stress. Data presented in the table above is for the position marked by red box/arrow head on the maps and indicates the proximity of the vines used for ground-truthing.

Figure 3.
Principal component analysis (PCA) plot presenting variables involved in determining vine water status: Remotely-sensed thermal indices (CWSI, Ig, (Tc-Ta)), environmental conditions (VPD), vine water status (gs, Ψs) irrigation applied, yield, and water use efficiency (WUE) for the 2016 (S1) and 2017 (S2) growing seasons.

Figure 4.
Correlation map (correlogram) of remotely-sensed thermal indices (CWSI, Ig, (Tc-Ta)) along with environmental conditions (VPD) and vine water status (gs, Psi_s or Ψs) for two cultivars and timepoints for the 2016 (S1) growing season: SHI veraison (a), CAS veraison (b), SHI pre-harvest (c), and CAS pre-harvest (d). Only significant Pearson correlation coefficients (p ≤ 0.05) are shown. Blue circles correspond to significant positive correlations and red circles to significant negative correlations. The size of the circle reflects the magnitude of the Pearson correlation coefficient.

Figure 5.
Correlation map (correlogram) of remotely-sensed thermal indices (CWSI, Ig, (Tc-Ta)) along with environmental conditions (VPD) and vine water status (gs, Psi_s or Ψs) for two cultivars and timepoints for the 2017 (S2) growing season: SHI veraison (a), CAS veraison (b), SHI pre-harvest (c) and CAS pre-harvest (d). Only significant Pearson correlation coefficients (p ≤ 0.05) are shown. Blue circles correspond to significant positive correlations and red circles to significant negative correlations. The size of the circle reflects the magnitude of the Pearson correlation coefficient.

Figure 6.
Comparison of vine water status of SHI at veraison (a) and pre-harvest (b) in 2016 using remotely sensed thermal images colour coded to temperature. Colour codes of relative values: Blue/green=low/no water stress, yellow/red = moderate water stress. Data presented in the tables above is for the positions marked on the maps and indicates the proximity of the vines used for ground-truthing. Flight 1: Vine water status differed between northern and southern sections of the block, which was the consequence of blocked irrigation lines in the southern section of the block (a). Flight 2: Remediation of irrigation lines before the pre-harvest flight resulted in a more uniform application of water and consequent reduction in vine water status variability (b).


Table 1.
Climatic conditions associated with four flights as referenced from Bureau of Meteorology in Coonawarra (weather station ID: 026091).
Table 1.
Climatic conditions associated with four flights as referenced from Bureau of Meteorology in Coonawarra (weather station ID: 026091).
| Season 1 (S1) | Season 2 (S2) | |||
|---|---|---|---|---|
| Veraison (F1) | Pre-Harvest (F2) | Veraison (F1) | Pre-Harvest (F2) | |
| Environmental Parameter | 4 February 2016 | 2 March 2016 | 21 February 2017 | 25 March 2017 |
| GDD * from October 1 (base 10 °C) | 1131 | 1393 | 966 | 1316 |
| Daily maximum VPD (kPa) | 2.05 | 3.34 | 2.94 | 2.00 |
| Daily maximum temperature (°C) | 25.2 | 30.4 | 27.3 | 28.3 |
| Daily minimum temperature (°C) | 14.2 | 12.1 | 2.2 | 15.9 |
| Minimum relative humidity (%) | 36 | 23 | 19 | 48 |
| Daily total solar radiation (MJ m−2) | 30 | 23.5 | 25.6 | 17.9 |
| Daily reference evapotranspiration, ET0 (mm) | 6.7 | 6.1 | 5.4 | 4.2 |
| Seasonal ET0, October 1–March 31 (mm) | 967 | 860 | ||
| Seasonal precipitation October 1–March 31 (mm) | 127.6 | 291.2 | ||
* Cumulative or Growing Degree Days
Table 2.
Vine water status measures of CAS and SHI grapevines at véraison (F1) and pre-harvest (F2) during the 2016 (S1) and 2017 (S2) seasons.
Table 2.
Vine water status measures of CAS and SHI grapevines at véraison (F1) and pre-harvest (F2) during the 2016 (S1) and 2017 (S2) seasons.
| Variable | Cultivar | Timepoint | CxT | Cultivar | Timepoint | CxT | |||||
|---|---|---|---|---|---|---|---|---|---|---|---|
| CAS | SHI | F1 | F2 | CAS | SHI | F1 | F2 | ||||
| 2016 (S1) | 2017 (S2) | ||||||||||
| Ψpd (MPa) | n/c | n/c | n/c | n/c | − | −0.43 | −0.32 | −0.40 | −0.35 | ** | |
| Significance | − | − | *** | ** | |||||||
| Ψs (MPa) | −1.02 | −1.15 | −1.03 | −1.09 | nsd | −0.94 | −0.82 | −1.11 | −0.65 | nsd | |
| Significance | ** | nsd | *** | *** | |||||||
| gs (mmol m−2 s−1) | 199 | 184 | 236 | 149 | nsd | 249 | 303 | 172 | 381 | * | |
| Significance | nsd | *** | *** | *** | |||||||
| CWSI | 0.49 | 0.58 | 0.55 | 0.48 | ** | 0.50 | 0.64 | 0.60 | 0.54 | nsd | |
| Significance | * | nsd | *** | nsd | |||||||
| Ig | 3.58 | 3.82 | 3.37 | 3.98 | nsd | 4.79 | 1.23 | 2.98 | 3.10 | nsd | |
| Significance | nsd | nsd | *** | nsd | |||||||
| (Tc-Ta) (°C) | 4.81 | 4.61 | 5.37 | 3.89 | *** | −2.62 | −2.67 | −2.05 | −3.25 | nsd | |
| Significance | nsd | *** | nsd | *** | |||||||
Statistical significance of the effects of cultivar, timepoint on measures of vine water status are given by p < 0.05 (*), p< 0.01 (**), p < 0.001 (***) and not significant (nsd). Each value represents the mean of four replicate samples for each group (n = 56 for CAS, n = 32 for SHI). n/c is data not collected for the season.
Table 3.
Comparison of CAS vine water status of old (> 40 years old) versus young (< 10 years old) vines for the 2017 season at pre-harvest (S2, F2).
Table 3.
Comparison of CAS vine water status of old (> 40 years old) versus young (< 10 years old) vines for the 2017 season at pre-harvest (S2, F2).
| Variable | Young Vines | Old Vines | Significance (P<0.05) |
|---|---|---|---|
| Ψpd (MPa) | −0.43 | −0.43 | nsd |
| Ψs (MPa) | −0.67 | −0.69 | nsd |
| gs (mmol m−2 s−1) | 266 | 324 | nsd |
| CWSI | 0.54 | 0.56 | nsd |
| Ig | 0.86 | 0.80 | nsd |
| (Tc-Ta) (°C) | −3.23 | −3.32 | nsd |
Statistical significance of the effects of cultivar, timepoint on measures of vine water status are given by p < 0.05 (*), p < 0.01 (**), p < 0.001 (***) and not significant (nsd). Each value represents the mean of four replicate samples for each group.
© 2019 by the authors. Licensee MDPI, Basel, Switzerland. This article is an open access article distributed under the terms and conditions of the Creative Commons Attribution (CC BY) license (http://creativecommons.org/licenses/by/4.0/).
Share and Cite
MDPI and ACS Style
Pagay, V.; Kidman, C.M. Evaluating Remotely-Sensed Grapevine (Vitis vinifera L.) Water Stress Responses Across a Viticultural Region. Agronomy 2019, 9, 682. https://doi.org/10.3390/agronomy9110682
AMA Style
Pagay V, Kidman CM. Evaluating Remotely-Sensed Grapevine (Vitis vinifera L.) Water Stress Responses Across a Viticultural Region. Agronomy. 2019; 9(11):682. https://doi.org/10.3390/agronomy9110682
Chicago/Turabian StylePagay, Vinay, and Catherine M. Kidman. 2019. "Evaluating Remotely-Sensed Grapevine (Vitis vinifera L.) Water Stress Responses Across a Viticultural Region" Agronomy 9, no. 11: 682. https://doi.org/10.3390/agronomy9110682
Note that from the first issue of 2016, this journal uses article numbers instead of page numbers. See further details here.