Biochar Type and Ratio as a Peat Additive/Partial Peat Replacement in Growing Media for Cabbage Seedling Production


1
Department of Agricultural Sciences, Biotechnology and Food Science, Cyprus University of Technology, 3603 Lemesos, Cyprus
2
Compost/AD Research & Advisory (IE/CY), Naas, W91 TYH3 Kildare, Ireland
3
Bord na Mona Horticulture Ltd. Research Centre, Main Street, Newbridge, W12 XR59 Kildare, Ireland
*
Author to whom correspondence should be addressed.
Agronomy 2019, 9(11), 693; https://doi.org/10.3390/agronomy9110693
Submission received: 20 September 2019
/
Revised: 20 October 2019
/
Accepted: 23 October 2019
/
Published: 29 October 2019
(This article belongs to the Special Issue Soilless Culture, Growing Media and Horticultural Plants)
Abstract
:Biochar has been proposed mainly as a soil amendment, positively affecting plant growth/yield, and to a lesser degree for growing media. In this study, four commercial grade biochars (A-forest wood; B-husks and paper fiber; C-bamboo and D-fresh wood screening), mostly wood-based materials, were selected. Initial mixtures of peat (P) with different Biochar type and ratios (0-5-10-15-20%) were selected for cabbage seedling production. Biochar material had high K content and pH ≥ 8.64 which resulted in increased pH of the growing media. Biochar A and C at 20% reduced cabbage seed emergence. Biochar A, B and D maintained or improved plant growth at low ratio (i.e., 5–10%) while all Biochars increased N, K and P content in leaves. Biochars A and D were further examined at 7.5% and 15% with the addition of two doses of minerals (1-fold and 1.5-fold). Biochar A and D, initially stimulated seed emergence when compared to the control. High dose of fertilizer favored plant growth in Biochar A at 7.5% and Biochar D at 15%. Leaf stomatal conductance was decreased at Biochar A+Fert at 7.5% and Chlorophyll b content was decreased at Biochar A+Fert at 15%. The presence of Biochar A increased the antioxidant activity (as assayed by 2,2-diphenyl-1-picrylhydrazyl-DPPH). Lipid peroxidation was higher in plants grown with fertilized peat and Biochar A at 15%, activating antioxidant enzymatic metabolisms. Potassium, phosphorous and copper accumulation and magnesium deficiency in cabbage leaves were related to the Biochar presence. Wooden biochar of beech, spruce and pine species (Biochar A) at 7.5% and fertilized biochar of fruit trees and hedges (Biochar D) were more promising for peat replacement for cabbage seedling production.
1. Introduction
Biochar production is a process of dry pyrolysis of organic matter, whereby plant or animal-based organic materials are treated under high temperatures ranging from 450 to 600 °C, under the absence of oxygen or low oxygen conditions [1,2], while lower temperature (300 °C) for biochar production has been reported [3]. Primary material for biochar production is mainly wastes derived from intensive sectors such as agriculture, food, forest residues and wood industries with significant contribution to environmental management and recycling, decreasing the greenhouse gas (GHG) emission and sequester carbon [4,5,6,7]. Biochar (i.e., 70%) use in agriculture as an alternative container substrate adds value to the bioenergy process with significant reduction (up to 54%) of the cost for the use of peat-based substrates [8]. Moreover, biochar can substantially improve the soil adsorption capacity for heavy metals like Cd [9] and alleviate salinity stress in crops with significant protection of the environment [10]. Nowadays, attention has been focused on the potential biochar use in growing media formulation, attracting research interest [3].
Biochar is constantly receiving increasing attention through its usage for soil modifications, as it increases crop yields and retains or improves soil fertility [11]. At the same time, effective applications are questionable, as farmers need to combine biochar application with sustainable fertilizers and water input [5]. Biochar efficacy on yield increase was attributed to the application of the material in unfertile/barren lands, rather than to fertile soils [12] and the biochar co-application with fertilizers has been suggested [13].
Compared to the commonly used peat for growing media, biochar has high pH, increased surface area, excellent water and nutrient retention properties [14] and contains different forms of N and P (i.e., ammonium, orthophosphoric), considerable amount of K [2,15]. Moreover, biochar is highly resistant to biological degradation and preserve great longevity in soil [16]. Adding biochar in soil, it can assist to maintain nutrients, release and regulate contaminants, reduce the CO2 emission to the atmosphere, boost soil physical, chemical, and biological characteristics, and enhance microbial biomass and diversity [16,17,18,19]. Biochar particle size can affect various growing media physicochemical properties, including bulk density, total pore space and available water and air for the roots [20]. However, biochar efficacy and quality (particularly surface chemical properties and the size of the pores) relies on the feedstock and the production process [21]. Substrates with low biochar rates, i.e., 10% sewage sludge biochar in lettuce [22] and 10% wood-derived biochar in pepper and tomato [23], promoted plant growth. However, higher biochar ratio had contradicting effects with either increased plant biomass and height i.e., 60–80% conifer wood biochar in Euphorbia × lomi [24] or suppress growth i.e., 60–100% pinewood biochar in poinsettia [25] and 80–100% pinewood biochar in tomato and basil [26].
The section of seedling and potting horticultural plant production has been improved enormously over the last few years [27,28,29]. The ability of handling the mixtures of growing media by choosing the mineral levels and the raw or composted material is driven to a final substrate formation with desirable physicochemical properties. Biochar has shown the potential to be added in growing media, combined with various materials such as peat [3,30], compost [8,31], coir [3] and vermicomport [32]. Little information is accessible for the physiological responses of plants following biochar applications, as biochar is mainly acting as a soil conditioner and thus mitigating the effects of climate change [33].
Peat has traditionally been used as the major growing media component in Europe, followed by coir, perlite, bark, and compost [34]. Widely used for its well-known properties (high cation exchange capacity-CEC, low nutrient levels, low pH, suitable water holding capacity and air capacity), peat production in Europe exceeds 40 million m3 [30,35]. However, on top of the high cost of the energy used for the extraction and transportation of peat to long distances (mainly produced at northern Europe), all these procedures are adding much to carbon footprint and increase environmental constrains. Thus, there is an increased ecological concern arising from the peat extraction, including conservation policies and identification of alternative components that could be appropriate for nursery enterprises [34,36].
Based on the favorable outcomes derived from the preliminary studies with different biochars and peat mixtures, the aim of this research was: (a) to assess the impact of biochar substitution in peat on extractable nutrients, (b) to assess four commercial biochar products as a peat diluent (growing medium) as demonstrated by plant growth, physiology and nutrient content, and (c) to evaluate the fertilizer dose and biochar ratio in peat on plant metabolism and nutrient content.
2. Materials and Methods
2.1. Biochars and Plant Material
In the current study, seeds of cabbage (Brassica oleracea L. var. capitata) were used for seedling production. Four commercial grade biochars were selected, three from Europe and one from China. They were of the following feedstocks: Forest wood e.g., beech, spruce and pine from Germany (Biochar A), husks and paper fiber wood screenings from tree branches at a ratio of 1:1 (v/v) from Germany (Biochar B), a three-year old wild high mountain bamboo (Biochar C), and fresh wood screenings (0–20 mm) from tree and shrub cuttings mainly from urban areas and farms (fruit trees, hedges, hedgerow management) from Switzerland (Biochar D). Biochars were generated using either the Pyreg equipment for Biochar B and C at 400–600 °C, and Biochar D at 500–600 °C, or Schotteredorf process for Biochar A at 700 °C with retention time of 15–30 min. However, owing to business sensitivity, additional data about Biochar production details is not known. A high-quality professional grade H4-H5 on von Post scale peat (P) was used as a control and as basic material to which the biochar was added. The selected biochars were assessed for their chemical characteristics [28], as for pH [37], Electrical Conductivity (EC) in water extract at 1:5 (v:v) ratio [38], and calcium chloride/DTPA (CAT) extractable (1:5 v:v) potassium (K) and phosphorus (P), ammonium (NH4-N), nitrate (NO3-N), and total extractable N (NH4-N+NO3-N) [39]. In brief, Biochar A had pH of 9.57; EC of 0.613 mS cm−1; P of 2 mg L−1 and K of 1087 mg L−1; Biochar B had pH of 8.83; EC of 0.420 mS cm−1; P of 2 mg L−1 and K of 376 mg L−1; Biochar C had pH of 8.64; EC of 0.450 mS cm−1; P of 21 mg L−1, K of 755 mg L−1, and NH4-N of 1 mg L−1; and Biochar D had pH of 9.55; EC of 0.410 mS cm−1; P of 3 mg L−1 and K of 745 mg L−1. Biochars had negligible amount of NO3-N. Peat physicochemical characteristics have been reported previously [30]. In brief, peat had pH of 3.13; EC of 0.034 mS cm−1; NH4-N of 17 mg L−1; NO3-N of 3 mg L−1; K of 8 mg L−1 and Oxygen Uptake Rate of 5.5 mmol O2 kg−1 organic matter per hour.
2.2. Preparation of Growing Media
Two individual experiments were implemented in the present study. In the first experiment (Exp. I), the examined biochars mixed into the peat in different ratio. Therefore, the four biochars (A, B, C and D) were added at the rates of 0%, 5%, 10%, 15% and 20% to the peat resulting to 17 mixtures (treatments) including control treatment of peat (100% P). Then mixtures were brought to N, P and K levels (with standard fertilizers; 1-fold) to 170 mg N L−1 as ammonium nitrate, 70 mg P L−1 as triple superphosphate and 100 mg K L−1 as potassium sulphate respectively for the peat-biochar mixtures and limed peat (dolomitic lime at 4 g L−1) and adequate amount of trace elements. The CAT extractable N, P and K that derived from the biochars were considered and the levels of fertilizers have been adjusted accordingly. There were almost insignificant amounts of N, some P and excess of K in most cases. No K was added into the mixture in case of K excess.
In the second experiment (Exp. II), the two more promising biochars and ratios were further selected for investigation with the application of additional fertilizers (1.5-fold). Therefore, the A and D biochars were selected at the rates of 0%, 7.5%, and 15% to the peat under 1-fold (N of 170 mg L−1, P of 70 mg L−1, and K of 100 mg L−1) or 1.5-fold (N of 255 mg L−1, P of 105 mg L−1, and K of 150 mg L−1) of fertilizers, resulting to 10 mixtures (treatments) including control (100% peat). Then mixtures were brought to adequate N, P and K levels, as described in Exp. I. The examined treatments and chemical analysis for both experiments are presented in Table 1 and Table 2.
2.3. Seed Emergence
Cabbage seeds were sown (1 cm depth) in plastic seedling trays. Each treatment had 9 and 18 modules for Exp. I and II, respectively, of 40 cm3 volume capacity each. Three seeds were placed in each module. Irrigation was performed daily with equal amount of water for all growing media, in order to cover the watering needs of the young seedlings. During seedling growth in the nursery, no fertilizers were applied. Max and min temperatures were 25 ± 2 °C and 20 ± 2 °C, respectively. Day light hours was L:D 16:8 with light flux density 300 μmol PAR m−2 s−1 ± 20.
A daily observation on seed emergence took place and seeds were recorded emerged when the hypocotyls were appeared. Mean emergence time (MET) was calculated as described previously [40].
2.4. Vegetative Growth and Mineral Content
Following a growing period of four to six weeks, seedlings growth-related parameters were recorded in six seedlings/treatment. Plant height and leaf number of the seedlings were measured. Leaf stomatal conductance was measured by using a ΔT-Porometer AP4 (Delta-T Devices-Cambridge, Burwell, Cambridge, UK). Leaf chlorophyll fluorescence (chlorophyll fluorometer, opti-sciences ΟS-30p, UK) was measured on two fully developed, light-exposed leaves per seedling. Leaves were incubated in the dark for 20 min prior to Fv/Fm measurements. Leaf chlorophyll content was assayed in six replicates/treatment either by SPAD meter or photometrically. Chlorophylls were extracted with dimethyl sulfoxide (DMSO) and Chlorophyll a (Chl a), Chlorophyll b (Chl b) and total Chlorophylls (total Chl) content was determined [28]. Seedlings were sampled above substrate surface, upper plant part was weighed (g), dried at 85 °C and then dry weight (g) was measured.
Mineral content in the upper part of the seedlings (including leaves and shoots) was determined on four replicates/treatment (two pooled plants/replicate). Plant tissue was dried to constant weight (at 65 °C for 3 day) and sub samples (~0.5 g) were ashed (at 500 °C for 5 h) and acid (2 N HCl) digested [41]. Nitrogen (N) content was determined with Kjeldahl (BUCHI, Digest automat K-439 and Distillation Kjeldahl K-360) digestion method. Phosphorus content was determined with spectrophotometer (Multiskan GO, Thermo Fisher Scientific, Waltham, MA, USA), and K, Mg, Ca, Na, Fe, Cu, Zn, and B by an atomic absorption spectrophotometer (PG Instruments AA500FG, Leicestershire, UK) for plant tissue analysis or by inductively coupled plasma atomic emission spectrometry (ICP-AES; PSFO 2.0 (Leeman Labs Inc., Mason, OH, USA) for growing media analysis. Plant mineral content were expressed in g kg−1 and mg kg−1 of dry weight, for macronutrients and micronutrients, respectively. Biochar-based media minerals were expressed in mg L−1.
2.5. Total Phenolics and Antioxidant Capacity
In the Exp. II, methanolic extracts of four replicates (two pooled plants/replicate) of cabbage grown in different biochar types and ratio used for the determination of total phenolics and total antioxidant activity. The Folin–Ciocalteu method was used for the total phenolics content as described in Tzortzakis et al. [42] and results were expressed as gallic acid equivalents (mg GAE per g of fresh weight). For antioxidant capacity, two assays were used, the ferric reducing antioxidant power (FRAP) and the 2,2-diphenyl-1-picrylhydrazyl (DPPH), as described previously [43]. Results were expressed as trolox equivalents (mg trolox per g of fresh weight).
2.6. Lipid Peroxidation, Hydrogen Peroxide, and Enzymes Antioxidant Activity
Four replicates (each replicate was a poll of two plants) for each treatment were used for damage index and antioxidant enzymes activity. Lipid peroxidation and hydrogen peroxide (H2O2) content were assessed according to Loreto and Velikova [44] and De Azecedo Neto et al. [45]. The results were expressed as μmol H2O2 per g of fresh weight, while lipid peroxidation was calculated through the malondialdeyde (MDA) content (nmol of MDA per g of fresh weight).
The enzymes antioxidant activity for superoxide dismutase (SOD), for catalase (CAT) and for peroxidase activity (POD) was assayed as described previously [43]. Results were expressed as enzyme units per mg of protein. The protein content was determined by using bovine serum albumin (BSA) as a standard.
2.7. Statistical Analysis
Data were tested for normality and then statistically analyzed using analysis of variance (ANOVA) by SPSS v21.0 (SPSS Inc., Chicago, IL, USA) program. The significance of the differences between average values was based on Duncan’s Multiple Range test (DMRT) at p ≤ 0.05, following one-way ANOVA. Values are means ± standard error (SE).
3. Results
3.1. Growing Media Properties
The biochar raw material had, in general, very high pH (ranging from 8.64 to 9.57) and considerable levels of EC (ranging from 0.410 to 0.613 mS cm−1). Therefore, adding biochars in ratios from 5% to 20% (Exp. I) increased the pH value of the acidic (pH of 4.97) peat-based material (Table 1). Moreover, biochar-based media had lower EC compared to the control (fertilized peat). The examined Biochars (A, B, C and D) had limited amounts of NH4-N and NO3-N, and this reflected the decreased levels found on the biochar-based growing media. Similar to ammonium and nitrate levels, the low (~2 mg L−1) P amounts of Biochar A, B and D reflected the decreased levels of P content in the growing media. However, Biochar C had P of 21 mg L−1, and as such, the P levels in the growing media increased for the ≥15% Biochar C. Interestingly, K levels of raw Biochars ranged from 376 to 1087 mg L−1 affected the K content in the examined biochar-based growing media, and the values increased as the Biochar ratio increased from 5% to 20% (Table 1).
Following the selection of Biochars for the Exp. II, a detailed mineral composition of the examined Biochars (A and D), ratios (7.5% and 15%) and fertilizers dose (1-fold and 1.5 fold) presented in Table 2. The additional fertilizer (1.5-fold) increased, as expected, the levels of N, K, and P at the 100% fertilized peat compared with the control (P100). Growing media containing Biochar A at 15% and Biochar D at 7.5% and 15% at both fertilizers (1-fold and 1.5-fold) levels had decreased NO3-N compared to the control treatment (100% peat). The level of NH4-N increased with the presence of Biochars A and D except for the Biochar A at 7.5%, with more pronounced content at the fertilized media (Table 2). Potassium levels were increased at Biochar A-based growing media and at fertilized Biochar D media (i.e., Biochar D+Fert at 7.5% and 15%) compared to 100% peat media. Increased Ca levels were found at Biochar A-based media while Biochar D-media had reduced Ca levels. Magnesium levels were decreased in both Biochars-based media. Boron, Zn, Na and Cu levels increased in case of Biochar D presence and reduced (for Cu) in case of Biochar A. Phosphorous and Mn levels increased at the Biochar-based media, while increased P levels were found also at the 100% fertilized peat. Iron content decreased in general with the presence of Biochars A and D, with exception the Biochar D+Fert at 15% media (Table 2).
3.2. Experiment I
3.2.1. Seed Emergence
In Exp. I, four biochars in four ratios were primary evaluated for cabbage seedling production. Biochar A and C at 20% reduced cabbage seed emergence compared to 100% peat (P100) as control treatment after 8 day (Figure 1A,C). Biochar B did not affect seed emergence (Figure 1B), and Biochar D (10–20%) decreased seed emergence at the first 3 day but no differences were obtained thereafter comparing with the control (Figure 1D). In general, low biochar ratios (5–10%) stimulated seed emergence for Biochar A and D compared to the control treatment for the first 3rd days. Mean germination time is shown in Figure 1E, and it was found that Biochar C and Biochar D at ≥10% delayed the seed emergence as they had higher MET comparing to control treatment (P100). Biochar A and B did not affect the MET (Figure 1E).
3.2.2. Plant Development
Biochar A and B at 5% increased but Biochar B at 20% decreased cabbage height compared to plants grown in 100% peat (Table 3). Biochar A (at 10%), Biochar B (at 5–10%), and Biochar D (at 5–10%) increased seedling fresh weight, while 20% of Biochars B and D and 10% of Biochar C decreased seedling fresh weight. Increasing Biochar ratio into the growing media, resulted in decreased plant dry weight compared to the control. The number of leaves produced did not differ among types and ratio of biochar. Biochars C and D at high levels affected negatively the cabbage root length (Table 3). Leaf chlorophyll fluorescence and content (SPAD units) were differently affected by the biochar type and ratio, with often more pronounced decreases at the higher biochars levels.
The use of biochars in the growing media significantly increased N, K and P content in cabbage leaves. Nitrogen increased (up to 80.7%, 91.3%, 103.2% and 116.7%), potassium increased (up to 284.4%, 276.5%, 459.0% and 234.8%) and phosphorus increased (up to 42.4%, 59.7%, 65.4% and 68.3%) for Biochars A, B, C and D, respectively, in relation to control (Table 3).
3.3. Experiment II
3.3.1. Seed Emergence
Following the Exp. I evaluation, two Biochars (A and D) under two ratio (7.5% and 15%) were further selected, including two mineral doses (1-fold and 1.5-fold). Biochar A and D improved seed emergence initially when compared to the control, while no differences were found after 4 day (Figure S1). Neither the biochar type nor the biochar ratio and applied fertilizers affected the mean emergence time for cabbage seeds.
3.3.2. Plant Growth and Physiology
Biochar A+Fert at 15% and Biochar D at 7.5% decreased plant height, comparing with the control treatment, while the greater plant height was found at the Biochar D+Fert at 15% (Table 4). Biochar A+Fert at 7.5% and Biochar D at 15% (independently of the fertilizers dose) increased seedling fresh weight, while Biochar A+Fert at 7.5% and Biochar D at 15% revealed increased dry weight. No differences were found on leaf number produced on biochar-based media and control (Figure S2), while the higher leaf number was found at the Biochar A+Fert at 7.5% and Biochar D+Fert at 15%.
Leaf stomatal conductance decreased at Biochar A+Fert at 7.5% and Chlorophyll b content decreased at Biochar A+Fert at 15%. No major differences were found on leaf SPAD measurements, the content of Chlorophyll a and total Chlorophylls in cabbage seedling subjected to different biochar types, ratios and fertilizer application (Table 5).
3.3.3. Total Phenolics and Antioxidant Activity
Total phenolic content did not change much among the different treatments with the exception of Biochar D at 7.5% which revealed the highest content of phenolics (Figure 2A). Biochar A presence increased the antioxidant activity (as assayed by DPPH) of cabbage, while in case of Biochar D, DPPH increased at Biochar D at 7.5% and at Biochar D+Fert at 15% (Figure 2B). FRAP antioxidant activity revealed increased values in Biochar A at 15% and Biochar D at 7.5% (Figure 2C).
3.3.4. Lipid Peroxidation, Hydrogen Peroxide, and Enzymes Antioxidant Activity
Lipid peroxidation (MDA) increased at 100% fertilized peat compared to the non-fertilized (control) treatment (Figure 3A). Additionally, MDA increased at 7.5% of Biochar D and for Biochar A+Fert at 15% when compared to the relevant control treatments. This increase indicates cellular damage and increased stress of the plants due to the applied treatment. The production of hydrogen peroxide increased in Biochar A and D (at 7.5% and 15%), and this increase was maintained in fertilized Biochar A, but not in fertilized Biochar D (Figure 3B). In order for the plants to detoxify the increased stress, CAT antioxidant enzymatic activity was increased for Biochar A treatments (Figure 3D). SOD activity decreased for Biochar A at 15%, Biochar D at 7.5%, Biochar D+Fert at 7.5% and Biochar D+Fert at 15%, compared to the control (Figure 3C). POD activity at the fertilized peat (PFert 100) and Biochar A+Fert at 15% maintained a similar levels as the 100% peat but decreased in all other treatments (Figure 3E).
3.3.5. Mineral Content
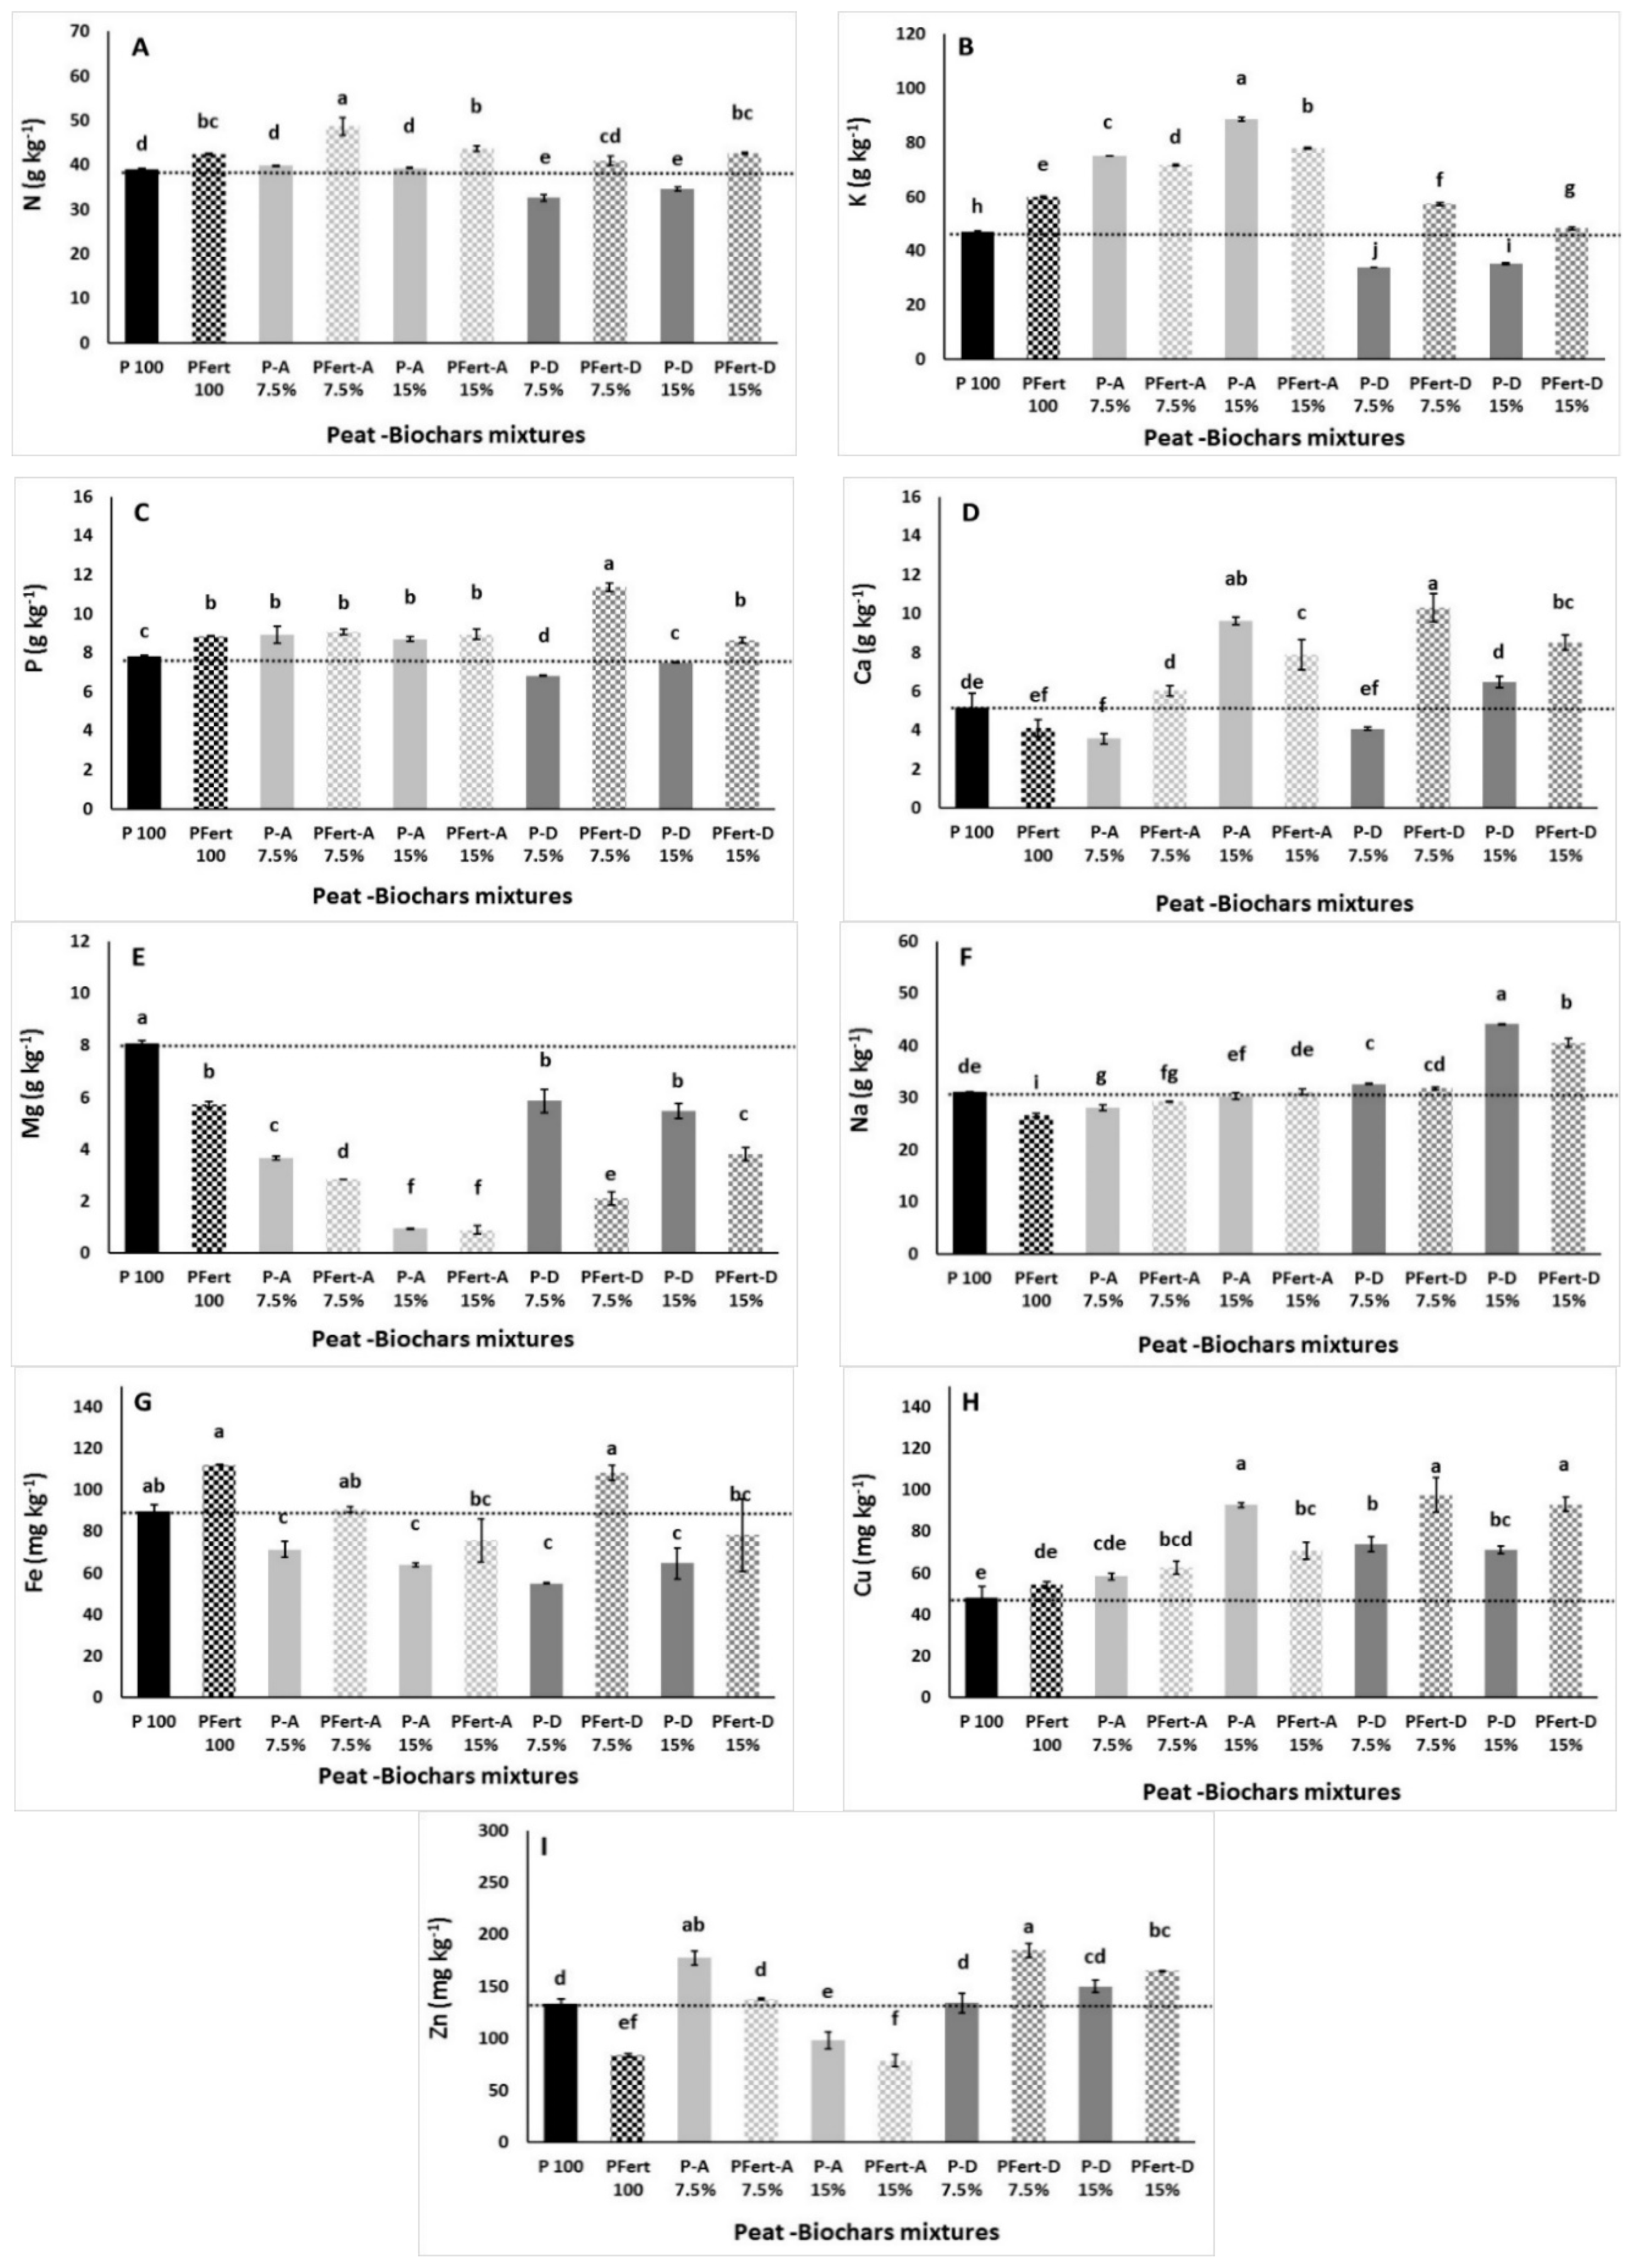
The addition of Biochar A with fertilizers, as expected, increased the N accumulation in cabbage seedlings and the effects were more pronounced with 7.5% of Biochar A+Fert (Figure 4A). However, the low fertilized Biochar D reduced the N content in cabbage, while plants grown with Biochar D+Fert at 15% had increased N accumulation compared to the relevant plants grown in 100% peat. Interestingly, Biochar A increased the K accumulation in seedlings, while both Biochar ratios and fertilizer addition, increased the K accumulation. However, Biochar D needed to be fertilized and used at 15% into the mixture in order to increase the K accumulation in cabbage seedling to levels similar to the control (P-100) (Figure 4B). A similar trend to K was found for the P accumulation in the plant tissue (Figure 4C). Calcium content in cabbage increased with Biochar A at 15% (independently of the fertilizers dose) and Biochar D+Fert at 7.5% and at 15%, but was reduced with Biochar A at 7.5% (Figure 4D). Magnesium content decreased with Biochar and the effects were more pronounced in high ratio of 15% (Figure 4E). Sodium accumulation was higher with Biochar D at 15% (independent of the fertilizers dose) and lower for Biochar A at 7.5% (independent of the fertilizers dose) and 100% fertilized peat (Figure 4F). Biochar presence decreased the Fe content in cabbage while the fertilizer alleviated this effect, as Fe content was in similar levels to peat-based substrates (absence of Biochar) (Figure 4G). Copper increased with the presence of Biochar and/or fertilizers while Zn was fluctuated among the examined treatments (Figure 4H,I).
4. Discussion
Biochar can actively restore carbon to the soil, affecting environmental parameters such as carbon footprint, and therefore, is attracting research interest for a wide range of applications in the environment, agriculture and horticulture fields [46]. In the current work, biochar application was evaluated as a growth medium amendment, as different types of biochar can have different properties and cause various effects on plants. Biochar from woody feedstock with higher lignin content and higher surface area showed different sorption abilities on metals [47]; Biochar A had the best performance in the present study, and that could be a possible explanation. However, further studies are needed before final conclusions are made. Therefore, the successful application is related to the biochar type (raw material), the ratios and to the levels of fertilizers. It is known that biochar has been effectively produced from various organic materials including municipal solid wastes (garden pruning waste), agricultural (straw, greenhouse crop residues, olive-mill waste, vineyard by-products), food waste, digestate and even sewage sludge [46,48,49]. Additionally, according to reports ″not all biochars are produced in the same way″. Even biochars from the same source (wood-based materials), as examined in the present study, can have different impacts on plant growth and cultivation strategies, and present biochar-specific and site-specific effects on plants [50].
Biochar has mainly been studied in applications in soil but recently, during the last 10 years, there has been a big increase in research studies and publications in the area of peat substitution by biochar [22,23,36,46,51]. Biochar addition in different ratios, as presented in Exp. I, improved growing media properties, with pH increases to more adequate levels, compared to the acidic peat-based materials, for vegetables seedling production and provided considerable amount of basic nutrients, including K and P. The increased pH in the current study is in agreement with previous reports on Biochar-based material from forest waste [6], tomato crop green and wood waste [30,52], wheat straw [53], and hardwood waste [54]. Increasing the pH due to the biochar addition is an advantage for acidic soil or growing media (as it is for peat in the current work) applications, with biochar acting as a liming material and possibly replacing the calcium oxide which is used for pH increment [55,56]. However, the low biochar ratio used in the present study, maintained pH values between 5.0 and 7.0, as the ideal substrate pH for the majority of vegetables is between 5.8 and 6.8. Additionally, biochar-based media had lower EC compared to the standard fertilized peat (control), in accordance with previous studies [30]. This outcome has very significant consequences, as materials that are commonly used for peat dilution often have elevated EC levels, such as composted green waste. Those materials could be used at a higher ratio, in combination with biochar, as high EC is very often the limiting factor for these materials to be added. The EC value is an important variable for growing media preparation and stability ranged between 1.5 and 2.0 dS m−1 [57]. The EC can either represent efficient nutrient support or saline conditions with adversely effects on seed germination and seedling growth [58]. However, lower initial EC values are not of consideration as substrates are commonly fertilized after plants transplanting [53]. Tailor-made fertilization is important for sustainable and successful plant growth. Therefore, increasing the fertilizers 1.5 times increased levels of minerals (i.e., K, N, P) available for the plant’s growth needs. However, such nutrient enrichment can possibly create antagonistic impacts on cations such as Ca and Mg, or other effects such as increased Ca levels in Biochar A-based media and decreased Ca levels in Biochar D-media. In that case, periodical fertigation of a supplementary (hydroponic) nutrient solutions to balance the deficient levels of specific minerals could be examined. A successful case was mentioned in pot ornamental production growing in paper-waste as a substrate, supported by a hydroponic nutrient solution [29]. Previously, we had addressed the possible explanation for the decreased/low levels in nitrate and in P [30], whereas Altland and Locke [59] reported P release from biochar made from rice husks, with additional studies to be needed to explain the mechanism involved.
Seed emergence and MET in low biochar ratios (5–10%) growing media remained at similar levels with the control treatment (100% peat), while Biochars at 20% decreased seed emergence. Moreover, cabbage growing in low biochar-based media improved growth (i.e., height, fresh weight) for Biochars A, B and D. Chlorophyll fluorescence revealed low values in <15% Biochar C and in >10% in Biochars B and D, impacting the chlorophyll production, efficiency of PSII photochemistry and photosynthetic rate [28]. Increased biochar rates (i.e., 50%) resulted in decreased seed germination in myrtle and mastic seeds [6] and in tomato [30]. Solaiman et al. [1] who studied the impact of five different chars under five levels, on three plant species (wheat, mung bean, subterranean clover) indicated the early seed germination and seedling growth and this was depended on the char material and ratio. The use of biochar considerably improves seedlings’ early growth [60] but some biochar may have substances that could adversely influence seed germination and early growth [1]. Seed emergence decrease was found in Biochars A and C at the rates of 20% in the present study.
Following the Exp. I, the examined Biochar ratios and types were further selected for evaluation. Biochar A and D improved seed emergence initially compared to the control. Fast and consistent seed emergence is an important issue for increased crop production, product quality, and eventually elevated profits.
In general, additional fertilizers could support plant growth with increased fresh weight at 7.5% for Biochar A and at 15% for Biochar D, observing also greater dry weight. Leaf number did not change among treatments and the decreased seedling height in case of Biochar A+Fert at 15% and Biochar D at 7.5% is not necessarily negative, as shorter (dwarf) plants are often desirable due to easy handling, transport and storage under nursery enterprises. Similar to our findings, Kim et al. [61] reported a 150% increase in shoot dry weight of kale (Brassica olereaseae L. var. acephala) when Biochar from rice husk was added at 5% to coir dust, perlite and verlmiculite. Vaughn et al. [62] and Steiner and Harttung [63] researched biochars for horticultural production as a substitute for peat and found no impacts on dry weight of plants. Tian et al. [51] and Mendez et al. [3] mixed biochar with compost to grow calathea and biochar with peat to grow lettuce, respectively, and revealed greater plant quality compared to those cultivated in single substrates, while Belda et al. [6] reported that the plant’s response to biochar is affected by the plant species itself. No major changes were observed in plant physiology attributes in general in the present study. Leaf stomatal conductance decreased at Biochar A+Fert at 7.5% and chlorophyll b content decreased at Biochar A+Fert at 15%. The decrease in stomatal conductance and the greater water use efficiency after application of biochar shows the ability of biochar to mitigate stress from the water deficit [5].
Total phenolic content did not change much among the different treatments with the exception of the increased phenolic content in case of Biochar D at 7.5%. However, antioxidant activity increased in several cases. Interestingly, DPPH decreased when fertilizer was added with Biochar D at 7.5% but increased in case of 15% Biochar D with fertilizers, indicating the induced stress of the added minerals in the high biochar content, following MDA increment. Total phenolics and antioxidant activities increases were also found in biochar-treated Andrographis paniculata (kalmegh) [5]. Plants have restricted protective processes, including the production of stress response proteins and synthesis of antioxidant enzymes (includes SOD, POD and CAT) in order to overcome reactive oxygen species (ROS) accumulation [64]. The increase of MDA observed with the additionally fertilized peat (PFert 100), with Biochar A+Fert at 15% and Biochar D at 7.5% indicates cellular damage and increased stress of the plants. This was further supported with hydrogen peroxide increases and the activation of CAT antioxidant enzymes activity to detoxify the ROS accumulation [43]. The high ROS accumulation is related to intensive damage of cellular proteins, nucleic acids and lipids [65].
Although K has no direct toxicity impacts on plants, elevated K concentrations can trigger deficiencies in Mg and Ca, and plant growth reduction [66], whereas this was evident with the Biochar A mixtures that caused substantial Mg content decrease, but plant growth decrease was not observed in cabbage seedling production. Therefore, K content was increased in cabbage grown in Biochar A-based media with more pronounce effects at high ratio and/or fertilizer, while Biochar D needed to be fertilized and used in 15% into the mixture in order to obtain K levels like the control. Phosphorus accumulation followed the K trend for the examined growing media. Kim et al. [61] also reported increase of N, P and K content in kale shoots when Biochar was mixed at various ratios with the growing media. Similarly, increased K and P contents were found when Syngonium podophyllum was grown in different Biochar-based media, and this was related to the higher levels of these elements in the growing media [53]. Calcium content was found to be reduced with Biochar A at 7.5% indicating antagonistic effect with the K presence. However, Ca content with 7.5% Biochar A treatment was maintained to similar levels with the control, only when fertilizers at 1.5-fold were used. The high Biochar A ratio (i.e., 15%) increased the Ca content and this reduced Mg levels. In general, Mg and Fe contents were decreased with Biochar addition and the effects were more pronounced at a high ratio of 15%. The decrease SPAD units in Biochars C and D at high ratios, reflected the leaf discoloration and the decreased Mg and Fe levels, both involved in chlorophyll metabolism.
5. Conclusions
In conclusion, Biochar at a low ratio (5–10%) increased plant growth (fresh weight, height), while at 20%, it reduced cabbage seed emergence and plant height. The addition of Biochars supported the mineral accumulation in seedlings, as more available minerals could be absorbed by the plants. The production of seedlings with low height could be of benefit for nurseries, when they want to produce draft plants and where irrigation is overhead. This helps transportation and storage conditions. An increased stress occurred when a high ratio of Biochar was used (i.e., 20%), while lower ratios (5–10%) benefited plant growth-related parameters. Seeding at 20% of Biochar should be avoided as the seed emergence is decreased with higher MET. Biochars from forest wood (A) and woody feedstock (D) are quite promising materials. Finally, it seems to be preferable to use a wooden biochar of beech, spruce and pine species manufactured at 700 °C with the Schotteredorf process, and the produced Biochar (A) to be utilized at 7.5% ratio for cabbage seedling production. If fresh wooden biochar (D) of fruit trees and hedges are used, manufactured at 500–600 °C with the Pyreg equipment, then additional fertilizer is needed. However, different species need to be evaluated accordingly.
Supplementary Materials
The following are available online at https://www.mdpi.com/2073-4395/9/11/693/s1, Figure S1: Cabbage cumulative seedling emergence in peat with different biochar types (A, D) and ratio (7.5%, 15%) and mineral doses, Figure S2: Cabbage seedling production in peat with different biochar types (A, D) and ratio (7.5%, 15%) and mineral doses.
Author Contributions
Conceptualization, M.P. and N.T.; methodology, M.P. and N.T.; software, N.T.; validation, A.C., M.P. and N.T.; formal analysis, A.C. and M.P.; investigation, A.C. and A.K.; resources, A.K. and N.T.; data curation, A.C. and M.P.; writing—original draft preparation, A.C.; writing—review and editing, M.P. and N.T.; visualization, A.K.; supervision, M.P. and N.T.; project administration, M.P. and N.T.; funding acquisition, A.K. and N.T.
Funding
This research was funded by Bord na Mona Horticulture Ltd. and Cyprus University of Technology under the project OPTIBIOCHAR and Cyprus University of Technology Open Access Author Fund.
Acknowledgments
The authors are grateful to the project OPTIBIOCHAR that has been developed under the Cooperation Programme Cyprus-Ireland, co-funded by the Bord na Mona LtD and Cyprus University of Technology.
Conflicts of Interest
The authors declare no conflict of interest.
References
- Solaiman, Z.M.; Murphy, D.V.; Abbott, L.K. Biochars influence seed germination and early growth of seedlings. Plant Soil 2012, 353, 273–287. [Google Scholar] [CrossRef]
- Laghari, M.; Hu, Z.; Mirjat, M.S.; Xiao, B.; Tagar, A.A.; Hu, M. Fast pyrolysis biochar from sawdust improves the quality of desert soils and enhances plant growth. J. Sci. Food Agric. 2016, 96, 199–206. [Google Scholar] [CrossRef] [PubMed]
- Méndez, A.; Paz-Ferreiro, J.; Gil, E.; Gascó, G. The effect of paper sludge and biochar addition on brown peat and coir based growing media properties. Sci. Hortic. 2015, 193, 225–230. [Google Scholar] [CrossRef]
- Agegnehu, G.; Bass, A.M.A.M.; Nelson, P.N.P.N.; Bird, M.I.M.I. Benefits of biochar, compost and biochar-compost for soil quality, maize yield and greenhouse gas emissions in a tropical agricultural soil. Sci. Total Environ. 2016, 543, 295–306. [Google Scholar] [CrossRef] [PubMed]
- Saha, A.; Basak, B.B.; Gajbhiye, N.A.; Kalariya, K.A.; Manivel, P. Sustainable fertilization through co-application of biochar and chemical fertilizers improves yield, quality of Andrographis paniculata and soil health. Ind. Crops Prod. 2019, 140, 111607. [Google Scholar] [CrossRef]
- Belda, R.M.; Lidón, A.; Fornes, F. Biochars and hydrochars as substrate constituents for soilless growth of myrtle and mastic. Ind. Crops Prod. 2016, 94, 132–142. [Google Scholar] [CrossRef]
- Calamai, A.; Palchetti, E.; Masoni, A.; Marini, L.; Chiaramonti, D.; Dibari, C.; Brilli, L. The influence of biochar and solid digestate on rose-scented geranium (Pelargonium graveolens L’Hér.) productivity and essential oil quality. Agronomy 2019, 9, 260. [Google Scholar] [CrossRef]
- Huang, L.; Niu, G.; Feagley, S.E.; Gu, M. Evaluation of a hardwood biochar and two composts mixes as replacements for a peat-based commercial substrate. Ind. Crops Prod. 2019, 129, 549–560. [Google Scholar] [CrossRef]
- Zhao, B.; Xu, R.; Ma, F.; Li, Y.; Wang, L. Effects of biochars derived from chicken manure and rape straw on speciation and phytoavailability of Cd to maize in artificially contaminated loess soil. J. Environ. Manag. 2016, 184, 569–574. [Google Scholar] [CrossRef]
- Lashari, M.S.; Ye, Y.; Ji, H.; Li, L.; Kibue, G.W.; Lu, H.; Zheng, J.; Pan, G. Biochar-manure compost in conjunction with pyroligneous solution alleviated salt stress and improved leaf bioactivity of maize in a saline soil from central China: A 2-year field experiment. J. Sci. Food Agric. 2015, 95, 1321–1327. [Google Scholar] [CrossRef]
- Lehmann, J.; Kern, D.C.; German, L.A.; McCann, J.; Martins, G.C.; Moreira, A. Soil fertility and production potential. In Amazonian Dark Earths: Origin, Properties, Management; Lehmann, J., Kern, D.C., Glaser, B., Woods, W.I., Eds.; Kluwer Academic Publishers: Dordrecht, The Netherlands, 2003; pp. 105–124. [Google Scholar]
- Hussain, M.; Farooq, M.; Nawaz, A.; Al-Sadi, A.M.; Solaiman, Z.M.; Alghamdi, S.S.; Ammara, U.; Ok, Y.S.; Siddique, K.H.M. Biochar for crop production: Potential benefits and risks. J. Soils Sediments 2017, 17, 685–716. [Google Scholar] [CrossRef]
- Sadaf, J.; Shah, G.A.; Shahzad, K.; Ali, N.; Shahid, M.; Ali, S.; Hussain, R.A.; Ahmed, Z.I.; Traore, B.; Ismail, I.M.I.; et al. Improvements in wheat productivity and soil quality can accomplish by co-application of biochars and chemical fertilizers. Sci. Total Environ. 2017, 607–608, 715–724. [Google Scholar] [CrossRef] [PubMed]
- Vaughn, S.F.; Kenar, J.A.; Tisserat, B.; Jackson, M.A.; Joshee, N.; Vaidya, B.N.; Peterson, S.C. Chemical and physical properties of Paulownia elongata biochar modified with oxidants for horticultural applications. Ind. Crops Prod. 2017, 97, 260–267. [Google Scholar] [CrossRef]
- Gul, S.; Whalen, J.K. Biochemical cycling of nitrogen and phosphorus in biochar-amended soils. Soil Biol. Biochem. 2016, 103, 1–15. [Google Scholar] [CrossRef]
- Sohi, S.P. Carbon storage with benefits. Science 2012, 338, 1034–1035. [Google Scholar] [CrossRef]
- Gregory, S.J.; Anderson, C.W.N.; Camps Arbestain, M.; McManus, M.T. Response of plant and soil microbes to biochar amendment of an arsenic-contaminated soil. Agric. Ecosyst. Environ. 2014, 191, 133–141. [Google Scholar] [CrossRef]
- Jaiswal, A.K.; Frenkel, O.; Tsechansky, L.; Elad, Y.; Graber, E.R. Immobilization and deactivation of pathogenic enzymes and toxic metabolites by biochar: A possible mechanism involved in soilborne disease suppression. Soil Biol. Biochem. 2018, 121, 59–66. [Google Scholar] [CrossRef]
- Oleszczuk, P.; Jośko, I.; Futa, B.; Pasieczna-Patkowska, S.; Pałys, E.; Kraska, P. Effect of pesticides on microorganisms, enzymatic activity and plant in biochar-amended soil. Geoderma 2014, 214–215, 10–18. [Google Scholar] [CrossRef]
- Nieto, A.; Gascó, G.; Paz-Ferreiro, J.; Fernández, J.M.; Plaza, C.; Méndez, A. The effect of pruning waste and biochar addition on brown peat based growing media properties. Sci. Hortic. 2016, 199, 142–148. [Google Scholar] [CrossRef]
- Wagner, A.; Kaupenjohann, M. Suitability of biochars (pyro- and hydrochars) for metal immobilization on former sewage-field soils. Eur. J. Soil Sci. 2014, 65, 139–148. [Google Scholar] [CrossRef]
- Méndez, A.; Cárdenas-Aguiar, E.; Paz-Ferreiro, J.; Plaza, C.; Gascó, G. The effect of sewage sludge biochar on peat-based growing media. Biol. Agric. Hortic. 2017, 33, 40–51. [Google Scholar] [CrossRef]
- Graber, E.R.; Harel, Y.M.; Kolton, M.; Cytryn, E.; Silber, A.; David, D.R.; Tsechansky, L.; Borenshtein, M.; Elad, Y. Biochar impact on development and productivity of pepper and tomato grown in fertigated soilless media. Plant Soil 2010, 337, 481–496. [Google Scholar] [CrossRef]
- Dispenza, V.; De Pasquale, C.; Fascella, G.; Mammano, M.M.; Alonzo, G. Use of biochar as peat substitute for growing substrates of Euphorbia × lomi potted plants. Span. J. Agric. Res. 2016, 14, 21. [Google Scholar] [CrossRef]
- Guo, Y.; Niu, G.; Starman, T.; Volder, A.; Gu, M. Poinsettia growth and development response to container root substrate with Biochar. Horticulturae 2018, 4, 1. [Google Scholar] [CrossRef]
- Choi, H.; Son, H.; Kim, C. Predicting financial distress of contractors in the construction industry using ensemble learning. Expert Syst. Appl. 2018, 110, 1–10. [Google Scholar] [CrossRef]
- Judd, L.A.; Jackson, B.E.; Fonteno, W.C. Advancements in root growth measurement technologies and observation capabilities for container-grown plants. Plants 2015, 4, 369–392. [Google Scholar] [CrossRef]
- Chrysargyris, A.; Antoniou, O.; Athinodorou, F.; Vassiliou, R.; Papadaki, A.; Tzortzakis, N. Deployment of olive-stone waste as a substitute growing medium component for Brassica seedling production in nurseries. Environ. Sci. Pollut. Res. 2019. [Google Scholar] [CrossRef]
- Chrysargyris, A.; Stavrinides, M.; Moustakas, K.; Tzortzakis, N. Utilization of paper waste as growing media for potted ornamental plants. Clean Technol. Environ. Policy 2018. [Google Scholar] [CrossRef]
- Prasad, M.; Tzortzakis, N.; McDaniel, N. Chemical characterization of biochar and assessment of the nutrient dynamics by means of preliminary plant growth tests. J. Environ. Manag. 2018, 216, 89–95. [Google Scholar] [CrossRef]
- Nadeem, S.M.; Imran, M.; Naveed, M.; Khan, M.Y.; Ahmad, M.; Zahir, Z.A.; Crowley, D.E. Synergistic use of biochar, compost and plant growth-promoting rhizobacteria for enhancing cucumber growth under water deficit conditions. J. Sci. Food Agric. 2017, 97, 5139–5145. [Google Scholar] [CrossRef]
- Alvarez, J.M.; Pasian, C.; Lal, R.; Lopez, R.; Fernandez, M. Vermicompost and Biochar as growing media replacement for ornamental plant production. J. Appl. Hortic. 2017, 19, 205–214. [Google Scholar]
- Álvarez, J.M.; Pasian, C.; Lal, R.; López, R.; Díaz, M.J.; Fernández, M. Morpho-physiological plant quality when biochar and vermicompost are used as growing media replacement in urban horticulture. Urban For. Urban Green. 2018, 34, 175–180. [Google Scholar] [CrossRef]
- Landis, T.D.; Morgan, N. Growing media alternatives for forest and native plant nurseries. Natl. Proc. For. Conserv. Nurs. Assoc. 2008 2009, 5814, 26–31. [Google Scholar]
- Li, Q.; Chen, J.; Caldwell, R.D.; Deng, M. Cowpeat as a substitute for peat in container substrates for foliage plant propagation. Horttechnology 2009, 19, 340–345. [Google Scholar] [CrossRef]
- Gruda, N.S. Increasing sustainability of growing media constituents and stand-alone substrates in soilless culture systems. Agronomy 2019, 9, 298. [Google Scholar] [CrossRef]
- British Standards Institution (BSI). EN 13037, Soil Improvers and Growing Media-Determination of pH; BSI: London, UK, 2002. [Google Scholar]
- British Standards Institution (BSI). EN 13038, Soil Improvers and Growing Media-Determination of Electrical Conductivity; BSI: London, UK, 2002. [Google Scholar]
- British Standards Institution (BSI). EN 13651, Soil Improvers and Growing Media-Extraction of Calcium Chloride/DTPA (CAT); BSI: London, UK, 2002. [Google Scholar]
- Kelepesi, S.; Tzortzakis, N.G. Olive mill wastes: A growing medium component for seedling and crop production of lettuce and chicory. Int. J. Veg. Sci. 2009, 15, 325–339. [Google Scholar] [CrossRef]
- Chrysargyris, A.; Panayiotou, C.; Tzortzakis, N. Nitrogen and phosphorus levels affected plant growth, essential oil composition and antioxidant status of lavender plant (Lavandula angustifolia Mill.). Ind. Crops Prod. 2016, 83, 577–586. [Google Scholar] [CrossRef]
- Tzortzakis, N.; Tzanakaki, K.; Conomakis, C.D. Effect of origanum oil and vinegar on the maintenance of postharvest quality of tomato. Food Nutr. Sci. 2011, 2, 974–982. [Google Scholar] [CrossRef]
- Chrysargyris, A.; Xylia, P.; Botsaris, G.; Tzortzakis, N. Antioxidant and antibacterial activities, mineral and essential oil composition of spearmint (Mentha spicata L.) affected by the potassium levels. Ind. Crops Prod. 2017, 103, 202–212. [Google Scholar] [CrossRef]
- Loreto, F.; Velikova, V. Isoprene produced by leaves protects the photosynthetic apparatus against ozone damage, quenches ozone products, and reduces lipid peroxidation of cellular membranes. Plant Physiol. 2001, 127, 1781–1787. [Google Scholar] [CrossRef]
- De Azevedo Neto, A.D.; Prisco, J.T.; Enéas-Filho, J.; De Abreu, C.E.B.; Gomes-Filho, E. Effect of salt stress on antioxidative enzymes and lipid peroxidation in leaves and roots of salt-tolerant and salt-sensitive maize genotypes. Environ. Exp. Bot. 2006, 56, 87–94. [Google Scholar] [CrossRef]
- Fornes, F.; Belda, R.M.; Fernández de Córdova, P.; Cebolla-Cornejo, J. Assessment of biochar and hydrochar as minor to major constituents of growing media for containerized tomato production. J. Sci. Food Agric. 2017, 97, 3675–3684. [Google Scholar] [CrossRef] [PubMed]
- Wang, S.; Gao, B.; Zimmerman, A.R.; Li, Y.; Ma, L.; Harris, W.G.; Migliaccio, K.W. Physicochemical and sorptive properties of biochars derived from woody and herbaceous biomass. Chemosphere 2015, 134, 257–262. [Google Scholar] [CrossRef] [PubMed]
- Shackley, S.; Ruysschaert, G.; Zwart, K.; Glaser, B. Biochar in European Soils and Agriculture: Science and Practice; Routledge: Oxon, UK, 2016; p. 324. [Google Scholar]
- Ronga, D.; Francia, E.; Allesina, G.; Pedrazzi, S.; Zaccardelli, M.; Pane, C.; Tava, A.; Bignami, C. Valorization of vineyard by-products to obtain composted digestate and biochar suitable for nursery grapevine (Vitis vinifera L.) production. Agronomy 2019, 9, 420. [Google Scholar] [CrossRef]
- Mukherjee, A.; Lal, R. The biochar dilemma. Soil Res. 2014, 52, 217–230. [Google Scholar] [CrossRef]
- Tian, Y.; Sun, X.; Li, S.; Wang, H.; Wang, L.; Cao, J.; Zhang, L. Biochar made from green waste as peat substitute in growth media for Calathea rotundifola cv. Fasciata. Sci. Hortic. 2012, 143, 15–18. [Google Scholar] [CrossRef]
- Dunlop, S.J.; Arbestain, M.C.; Bishop, P.A.; Wargent, J.J. Closing the loop: Use of biochar produced from tomato crop green waste as a substrate for soilless, hydroponic tomato production. HortScience 2015, 50, 1572–1581. [Google Scholar] [CrossRef]
- Zulfiqar, F.; Younis, A.; Chen, J. Biochar or biochar-compost amendment to a peat-based substrate improves growth of Syngonium podophyllum. Agronomy 2019, 9, 460. [Google Scholar] [CrossRef]
- Nair, A.; Carpenter, B. Biochar rate and transplant tray cell number have implications on pepper growth during transplant production. Horttechnology 2016, 26, 713–719. [Google Scholar] [CrossRef]
- Sun, L.; Li, L.; Chen, Z.; Wang, J.; Xiong, Z. Combined effects of nitrogen deposition and biochar application on emissions of N2O, CO2 and NH3 from agricultural and forest soils. Soil Sci. Plant Nutr. 2014, 60, 254–265. [Google Scholar] [CrossRef]
- Bedussi, F.; Zaccheo, P.; Crippa, L. Pattern of pore water nutrients in planted and non-planted soilless substrates as affected by the addition of biochars from wood gasification. Biol. Fertil. Soils 2015, 51, 625–635. [Google Scholar] [CrossRef]
- Abad, M.; Noguera, P.; Puchades, R.; Maquieira, A.; Noguera, V. Physico-chemical and chemical properties of some coconut coir dusts for use as a peat substitute for containerised ornamental plants. Bioresour. Technol. 2002, 82, 241–245. [Google Scholar] [CrossRef]
- Bustamante, M.A.; Moral, R.; Paredes, C.; Pérez-Espinosa, A.; Moreno-Caselles, J.; Pérez-Murcia, M.D. Agrochemical characterisation of the solid by-products and residues from the winery and distillery industry. Waste Manag. 2008, 28, 372–380. [Google Scholar] [CrossRef] [PubMed]
- Altland, J.E.; Locke, J.C. Effect of biochar type on macronutrient retention and release from soilless substrate. HortScience 2013, 48, 1397–1402. [Google Scholar] [CrossRef]
- Thomas, S.C.; Gale, N. Biochar and forest restoration: A review and meta-analysis of tree growth responses. New For. 2015, 46, 931–946. [Google Scholar] [CrossRef]
- Kim, H.S.; Kim, K.R.; Yang, J.E.; Ok, Y.S.; Kim, W.I.; Kunhikrishnan, A.; Kim, K.H. Amelioration of horticultural growing media properties through rice hull biochar incorporation. Waste Biomass Valoriz. 2017, 8, 483–492. [Google Scholar] [CrossRef]
- Vaughn, S.F.; Kenar, J.A.; Thompson, A.R.; Peterson, S.C. Comparison of biochars derived from wood pellets and pelletized wheat straw as replacements for peat in potting substrates. Ind. Crops Prod. 2013, 51, 437–443. [Google Scholar] [CrossRef]
- Steiner, C.; Harttung, T. Biochar as a growing media additive and peat substitute. Solid Earth 2014, 5, 995–999. [Google Scholar] [CrossRef]
- Gupta, D.D.; Palma, J.M.; Corpas, F.J. Reactive Oxygen Species and Oxidative Damage in Plants under Stress; Springer International Publishing Switzerland: Cham, Switzerland, 2015; ISBN 9783319204208. [Google Scholar]
- Sies, H.; Berndt, C.; Jones, D.P.; Sies, H.; Berndt, C.; Jones, D.P. Oxidative stress. Annu. Rev. Biochem. 2017, 86, 715–748. [Google Scholar] [CrossRef]
- Savvas, D.; Gruda, N. Application of soilless culture technologies in the modern greenhouse industry-A review. Eur. J. Hortic. Sci. 2018, 83, 280–293. [Google Scholar] [CrossRef]
Figure 1.
Cabbage cumulative seedling emergence and mean emergence time (MET) in peat with different biochar types (A, B, C, D) and ratio (0-5-10-15-20%). Biochar type is distinguished by different pattern at MET. Significant differences (p < 0.05) among treatments are indicated by different letters. Error bars show SE (n = 4). Dotted line present the levels of control treatment (100% peat). (A) is referring to Biochar A, (B) is Biochar B, (C) is Biochar C, (D) is Biochar D, (E) is mean emergence time for all biochars.

Figure 2.
Effects of peat (P 100) with different biochar types (A, D) and ratio (7.5%, 15%) and mineral doses (with standard or with additional Fertilizers-Fert.) on cabbage total phenols and antioxidant activity. (A) total phenols, (B) DPPH, (C) FRAP. Significant differences (p < 0.05) among treatments are indicated by different letters. Error bars show SE (n = 4). Dotted line present the levels of control treatment (100% peat).
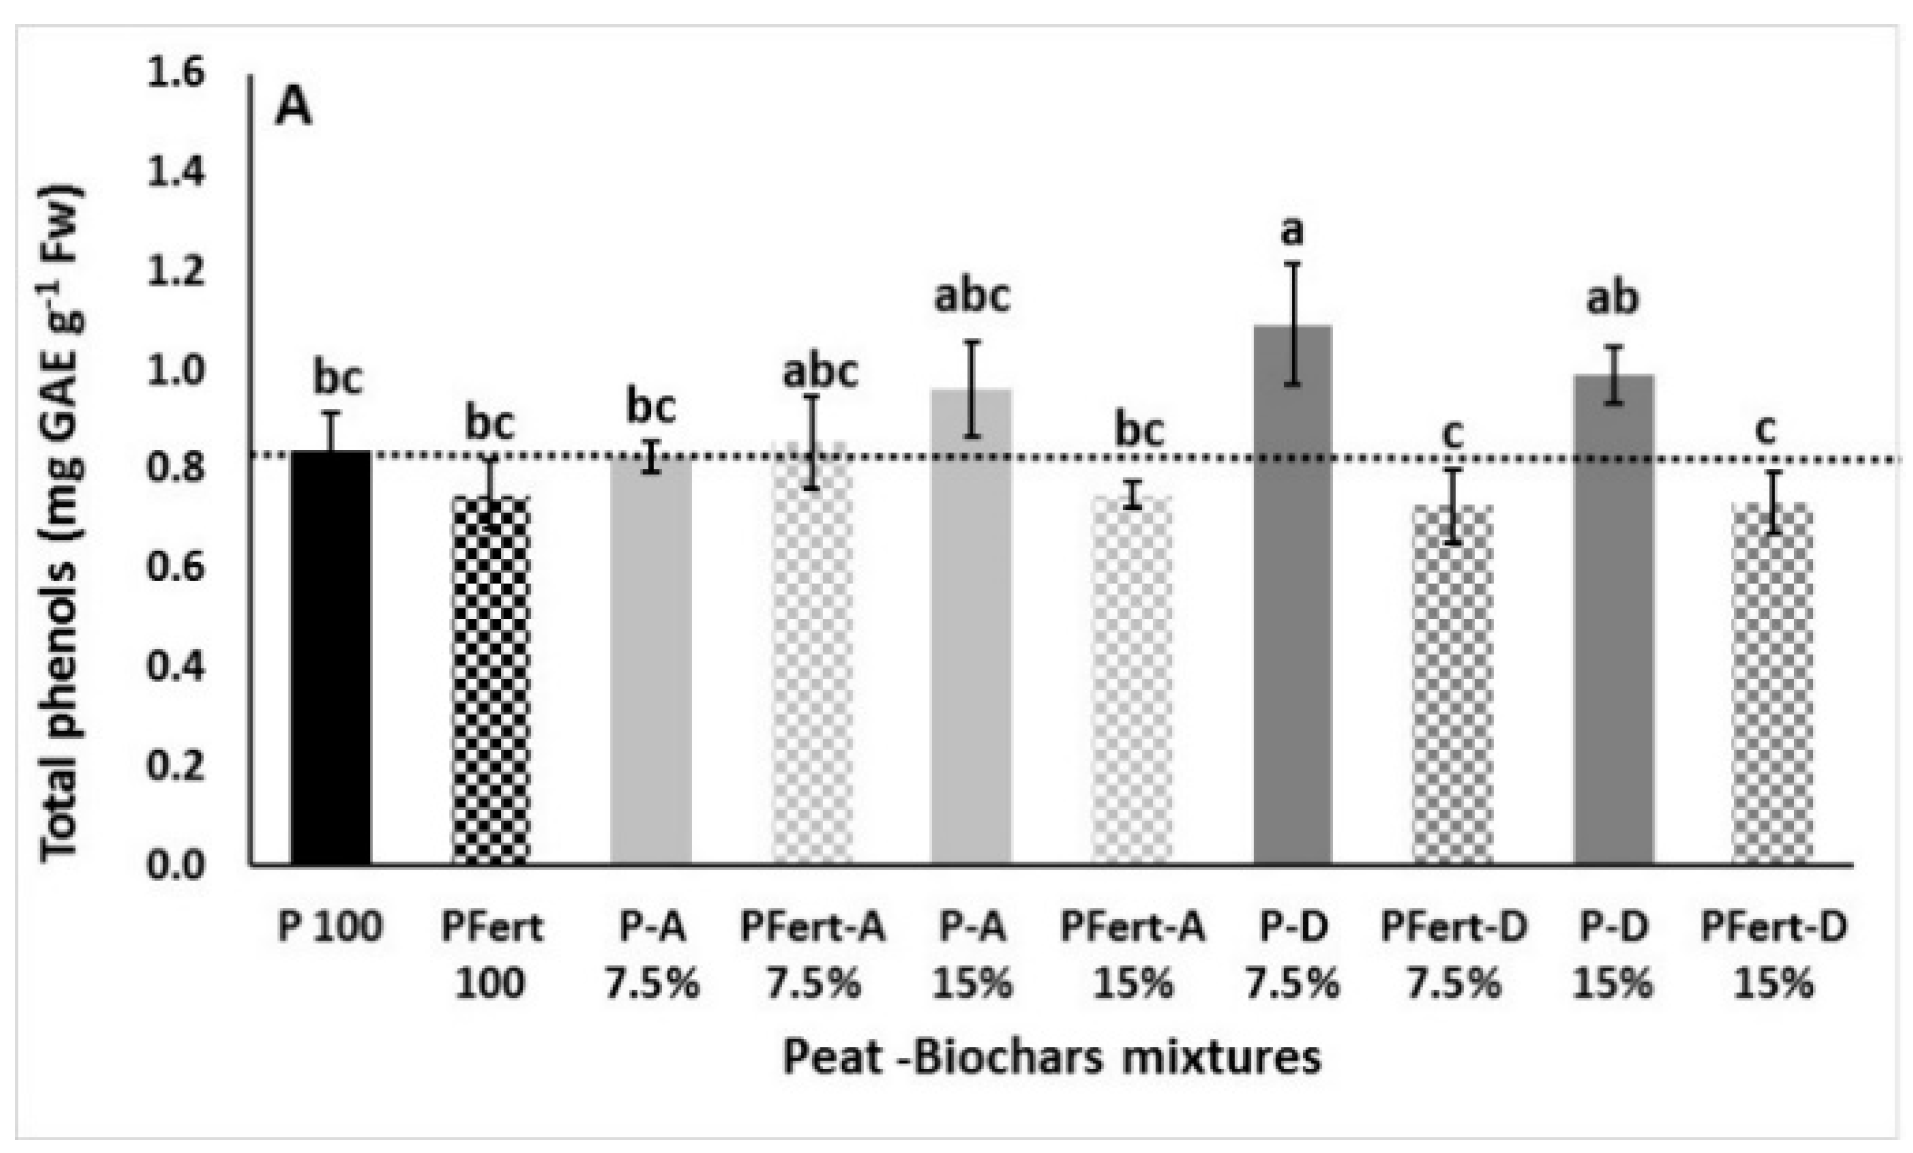
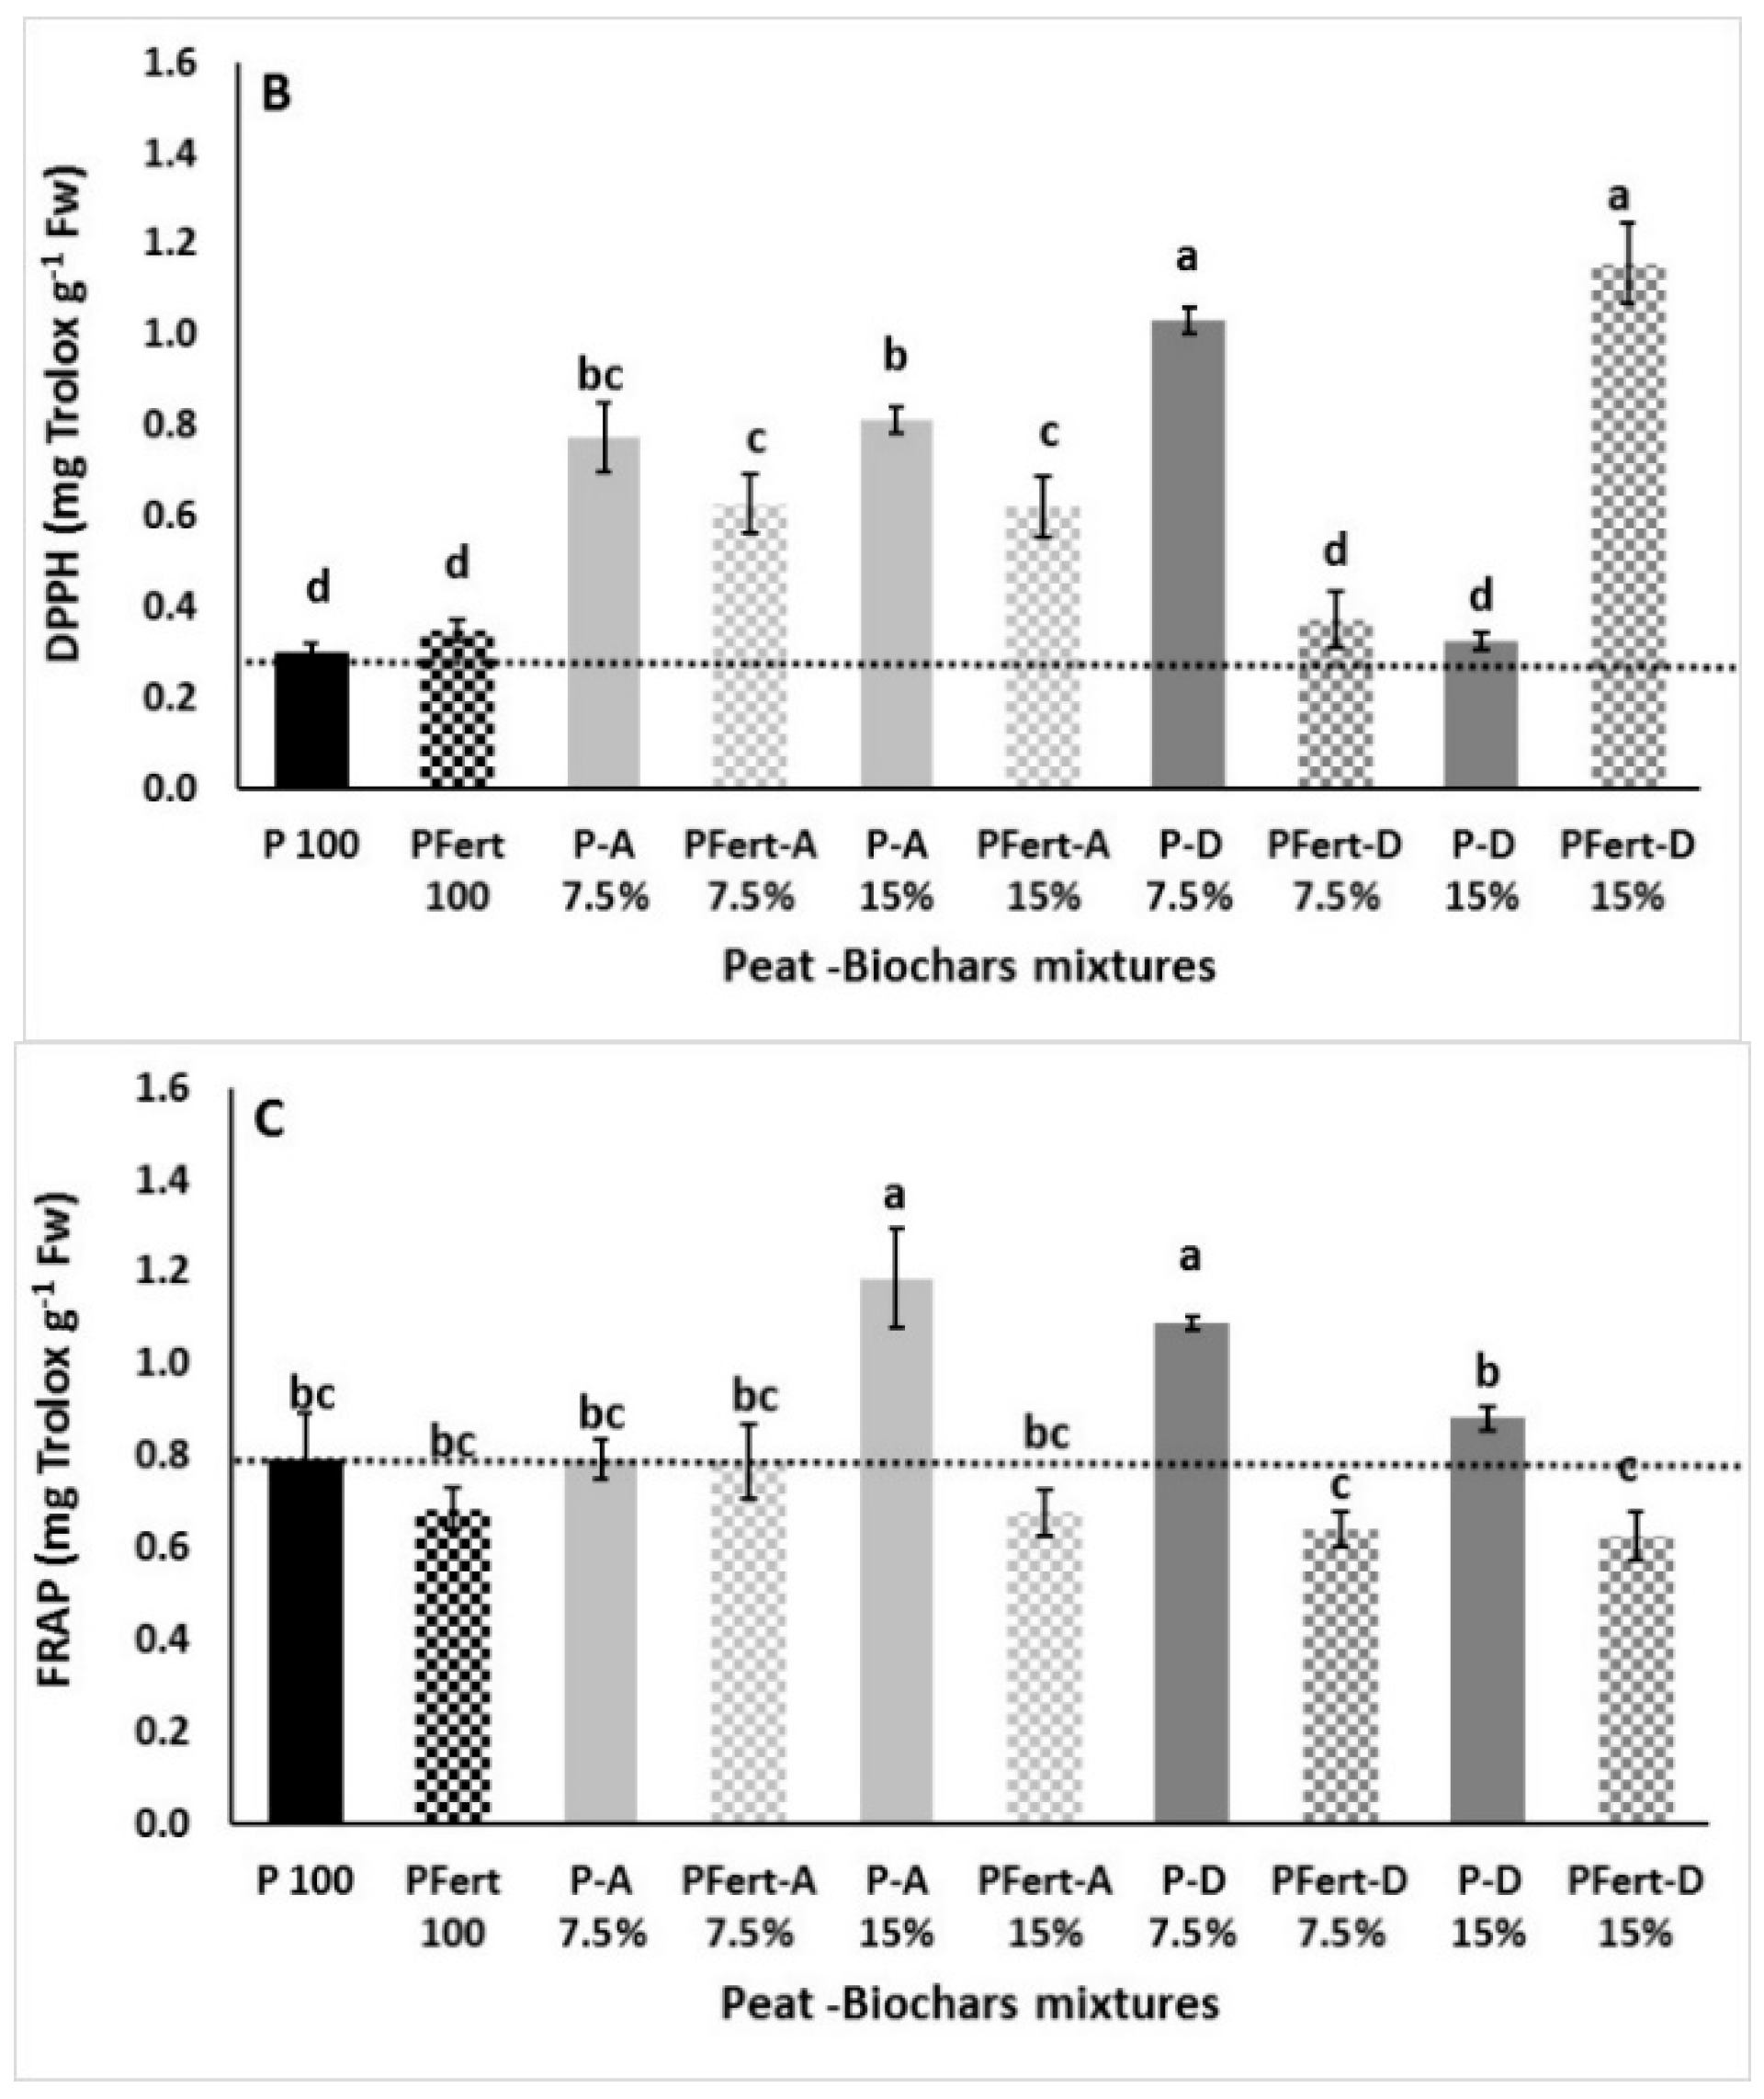
Figure 3.
Effects of peat (P 100) with different biochar types (A, D) and ratio (7.5%, 15%) and mineral doses (with standard or with additional Fertilizers-Fert.) on cabbage lipid peroxidation, hydrogen peroxide and antioxidant enzymes activity. (A) H2O2, (B) Lipid peroxidation (MDA), (C) SOD, (D) CAT, and (E) POD. Significant differences (p < 0.05) among treatments are indicated by different letters. Error bars show SE (n = 4). Dotted line present the levels of control treatment (100% peat).
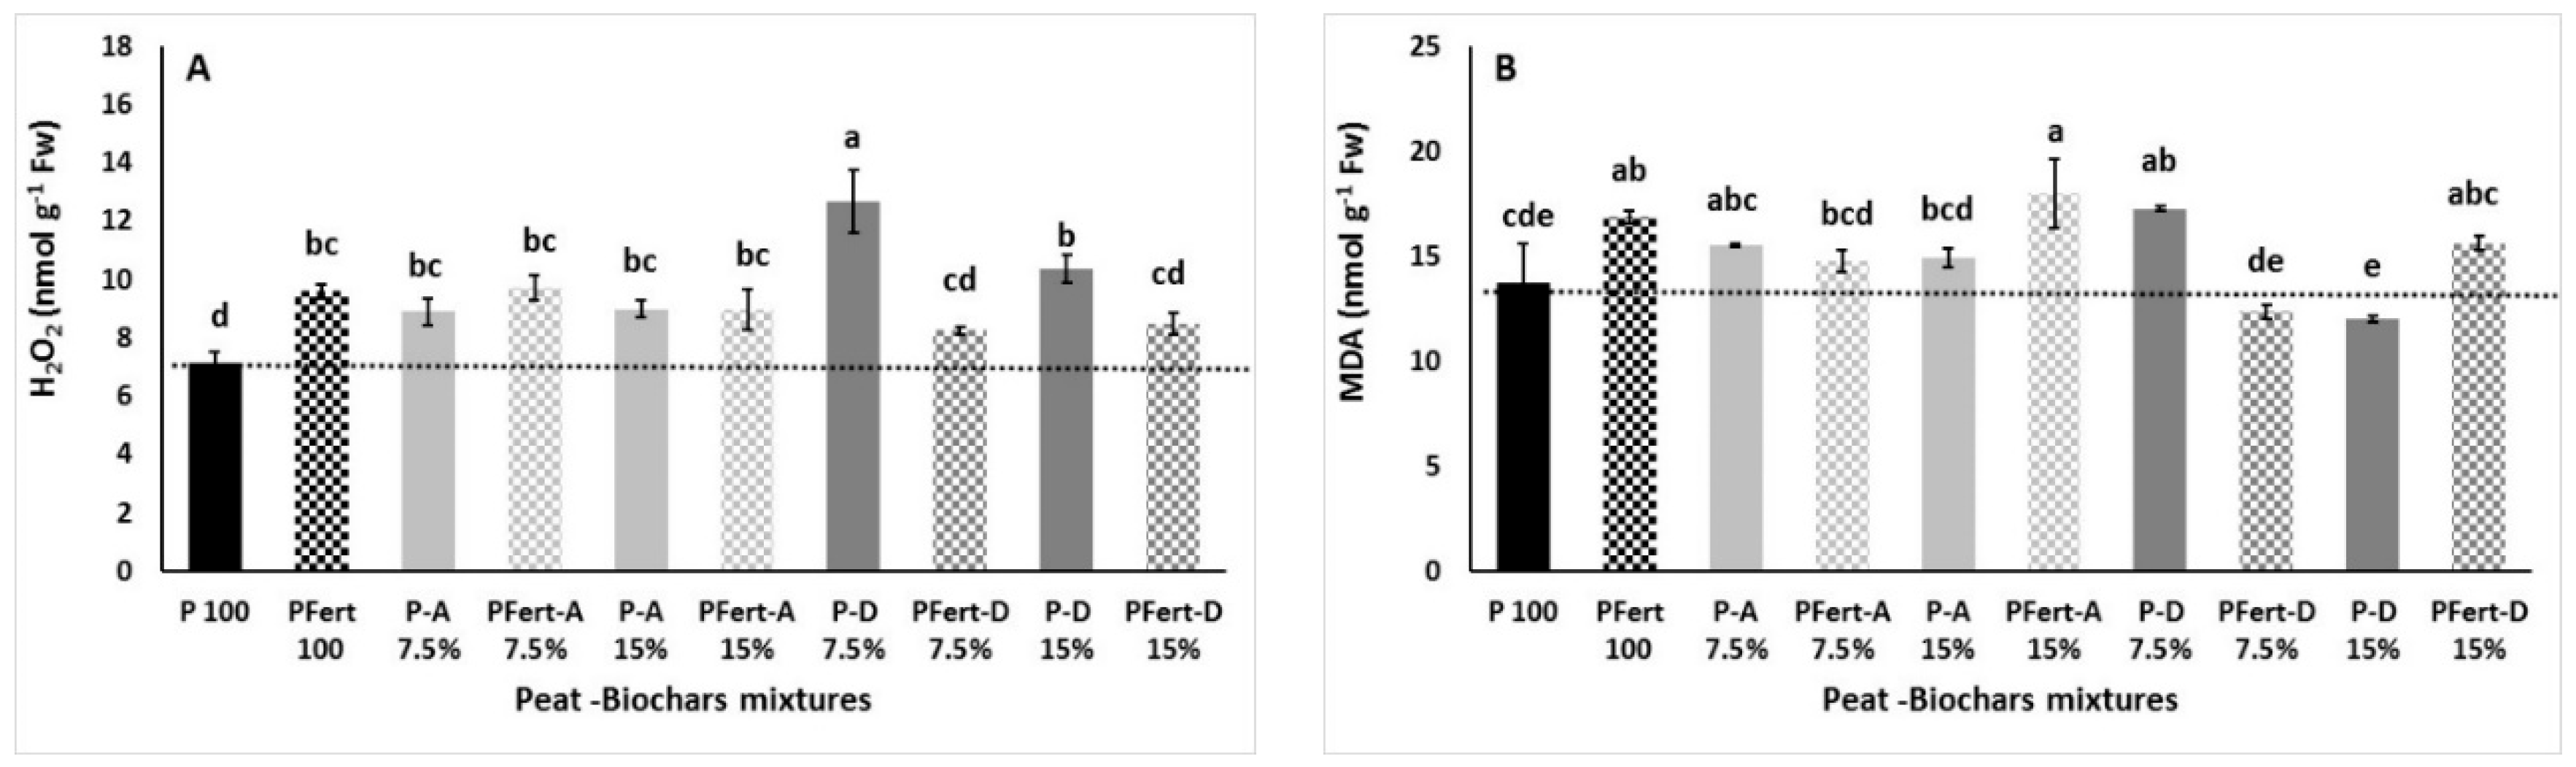
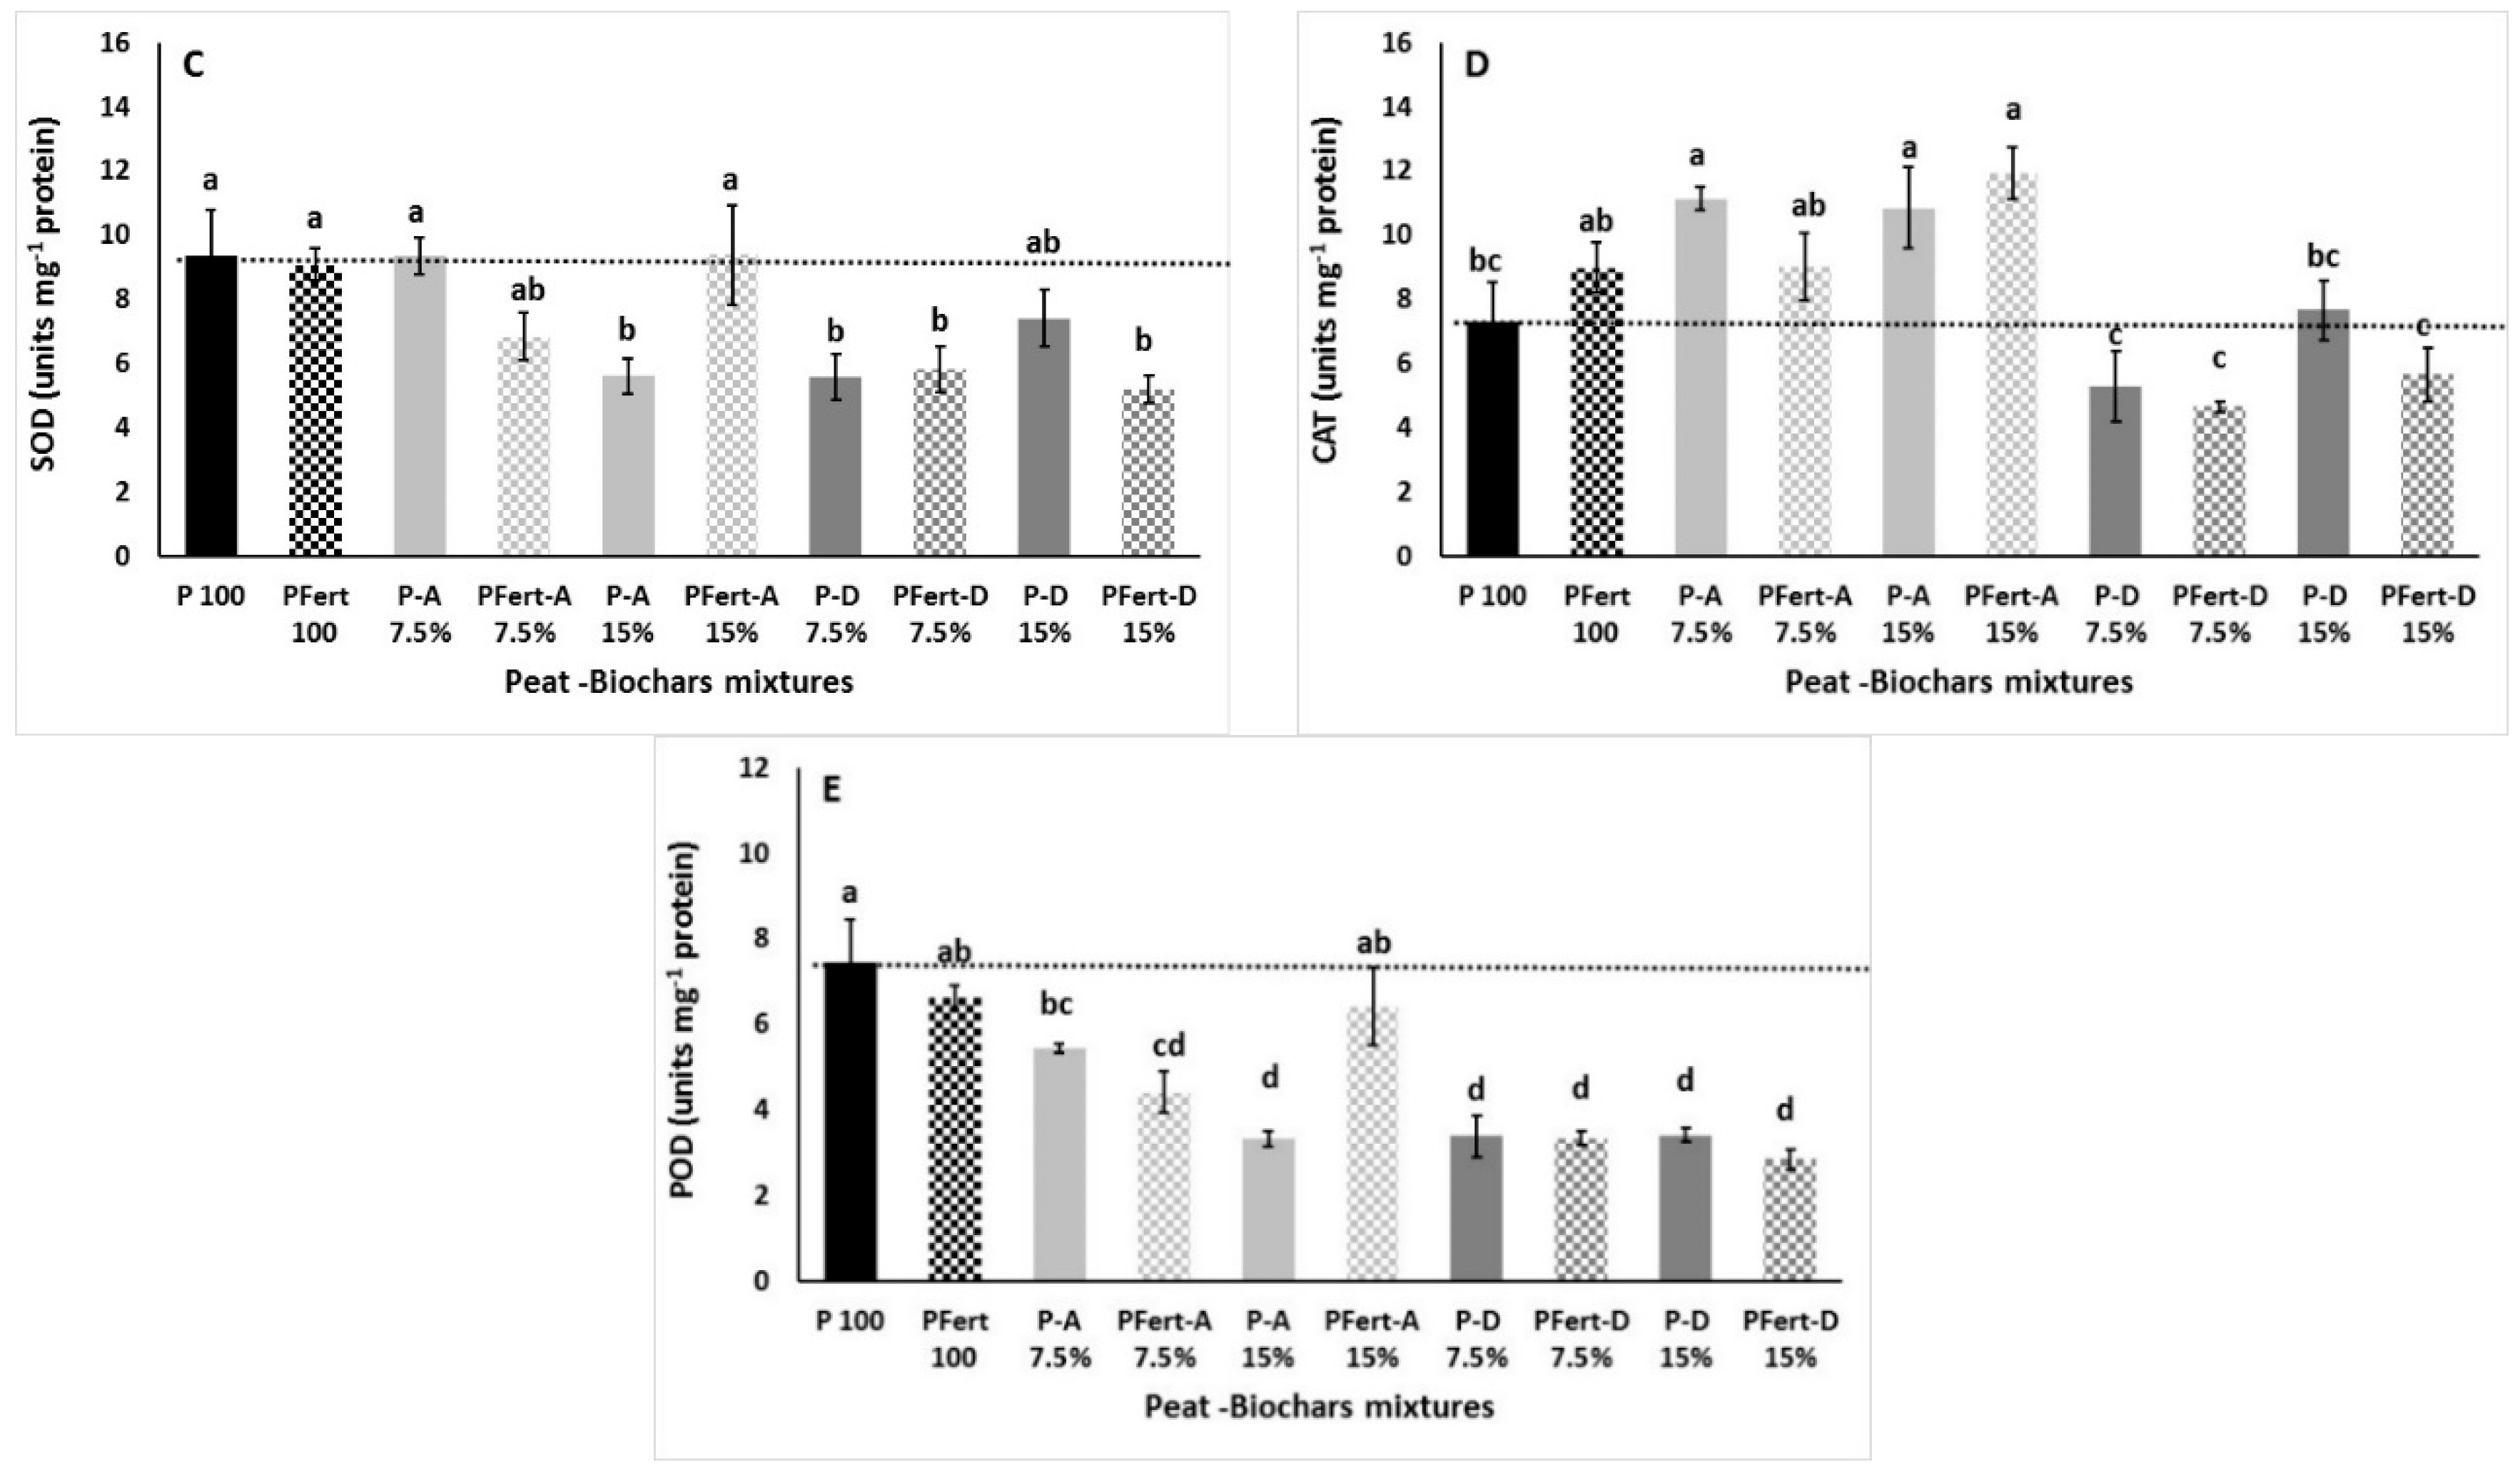
Figure 4.
Effects of peat (P 100) with different biochar types (A, D) and ratio (7.5%, 15%) and mineral doses (with standard or with additional Fertilizers-Fert.) on cabbage macro (A–F) and micronutrient (G–I) content. Significant differences (p < 0.05) among treatments are indicated by different letters. Error bars show SE (n = 4). Dotted line present the levels of control treatment (100% peat).

Table 1.
Effects of peat (P 100) with different biochar types (A, B, C, D) and ratio (0-5-10-15-20%) on substrate chemical properties.
Table 1.
Effects of peat (P 100) with different biochar types (A, B, C, D) and ratio (0-5-10-15-20%) on substrate chemical properties.
| pH | EC (μS cm−1) | NO3-N (mg kg−1) | NH4-N (mg kg−1) | K (mg kg−1) | P (mg kg−1) | |
|---|---|---|---|---|---|---|
| P 100 | 4.97 ± 0.06 ijk | 203.37 ± 2.37 a | 50.13 ± 0.58 a | 47.35 ± 0.55 bc | 53.40 ± 1.62 k | 49.71 ± 0.58 c |
| P-A 5% | 5.01 ± 0.06 hij | 143.67 ± 1.67 g | 21.51 ± 1.25 e | 42.37 ± 0.49 efg | 84.33 ± 2.98 h | 41.04 ± 1.48 f |
| P-A 10% | 5.19 ± 0.07 gh | 96.12 ± 1.12 j | 16.63 ± 0.19 g | 44.12 ± 1.11 de | 110.85 ± 2.39 g | 46.53 ± 0.54 d |
| P-A 15% | 5.53 ± 0.11 de | 96.15 ± 2.14 j | 14.65 ± 0.17 i | 43.82 ± 0.51 de | 147.58 ± 3.57 e | 38.25 ± 1.44 g |
| P-A 20% | 5.89 ± 0.09 c | 93.08 ± 1.09 j | 13.84 ± 0.21 j | 43.91 ± 0.53 de | 213.67 ± 4.49 d | 44.36 ± 1.23 e |
| P-B 5% | 5.16 ± 0.06 ghi | 167.95 ± 1.95 c | 30.38 ± 1.35 b | 44.28 ± 0.65 d | 65.52 ± 0.76 j | 44 ± 39 ± 0.51 e |
| P-B 10% | 5.70 ± 0.05 cd | 141.65 ± 1.65 gh | 17.85 ± 0.26 f | 41.03 ± 0.48 g | 78.09 ± 1.90 i | 39.89 ± 1.14 f |
| P-B 15% | 6.46 ± 0.11 b | 137.61 ± 1.60 h | 17.42 ± 0.20 f | 29.35 ± 0.34 h | 77.63 ± 1.94 i | 31.49 ± 1.45 i |
| P-B 20% | 7.06 ± 0.13 a | 149.74 ± 1.74 f | 12.85 ± 0.15 k | 20.45 ± 0.24 i | 78.57 ± 1.35 hi | 18.57 ± 0.21 j |
| P-C 5% | 4.77 ± 0.05 k | 201.34 ± 2.34 a | 31.88 ± 0.37 b | 48.61 ± 1.56 b | 132.21 ± 2.98 f | 50.49 ± 1.59 c |
| P-C 10% | 4.92 ± 0.05 jk | 181.11 ± 2.11 b | 15.52 ± 0.18 h | 43.04 ± 1.52 def | 221.07 ± 4.57 c | 43.44 ± 1.78 e |
| P-C 15% | 5.16 ± 0.08 ghi | 148.73 ± 1.73 f | 10.50 ± 0.12 l | 46.78 ± 0.63 c | 317.57 ± 5.78 b | 56.38 ± 1.65 b |
| P-C 20% | 5.40 ± 0.07 ef | 160.87 ± 1.87 d | 29.06 ± 0.34 d | 72.82 ± 2.82 a | 367.38 ± 4.28 a | 86.35 ± 3.15 a |
| P-D 5% | 4.76 ± 0.05 k | 155.87 ± 2.65 e | 22.22 ± 0.26 e | 43.28 ± 1.51 def | 54.98 ± 1.64 k | 46.26 ± 0.54 d |
| P-D 10% | 4.87 ± 0.05 jk | 121.41 ± 1.59 i | 11.03 ± 0.13 l | 44.71 ± 0.52 d | 54.46 ± 1.21 k | 43.17 ± 0.89 e |
| P-D 15% | 5.06 ± 0.08 hij | 93.08 ± 1.08 j | 6.85 ± 0.28 m | 43.07 ± 063 def | 55.24 ± 1.76 k | 37.45 ± 1.23 g |
| P-D 20% | 5.32 ± 0.09 fg | 98.14 ± 1.14 j | 6.02 ± 0.07 m | 41.87 ± 0.49 fg | 79.97 ± 2.81 hi | 34.09 ± 0.89 h |
Values (n = 2) in columns followed by the same letter are not significantly different, p ≤ 0.05.
Table 2.
Effects of peat (P 100) with different biochar types (A, D) and ratio (7.5%, 15%) and mineral doses (with standard or with additional Fertilizers-Fert.) on substrate minerals content.
Table 2.
Effects of peat (P 100) with different biochar types (A, D) and ratio (7.5%, 15%) and mineral doses (with standard or with additional Fertilizers-Fert.) on substrate minerals content.
| P 100 | PFert 100 | P-A 7.5% | PFert-A 7.5% | P-A 15% | PFert-A 15% | P-D 7.5% | PFert-D 7.5% | P-D 15% | PFert-D 15% | |
|---|---|---|---|---|---|---|---|---|---|---|
| NO3-N (mg kg−1) | 63.38 ± 1.38 c | 88.42 ± 1.92 a | 78.20 ± 1.71 b | 81.26 ± 1.76 b | 37.82 ± 0.82 f | 48.04 ± 1.04 e | 47.53 ± 1.03 e | 58.78 ± 1.28 d | 36.29 ± 0.89 f | 31.69 ± 0.69 g |
| NH4-N (mg kg−1) | 20.95 ± 0.45 g | 67.98 ± 1.48 b | 18.51 ± 2.03 i | 43.95 ± 0.95 d | 33.22 ± 0.72 f | 64.16 ± 1.40 c | 36.80 ± 0.85 e | 71.55 ± 1.55 a | 32.12 ± 1.56 h | 68.49 ± 1.49 ab |
| K (mg kg−1) | 117.55 ± 3.55 f | 178.89 ± 3.89 d | 230.01 ± 5.02 c | 301.55 ± 6.55 b | 378.22 ± 8.23 a | 373.10 ± 8.24 a | 102.25 ± 2.26 f | 153.34 ± 3.38 e | 102.26 ± 2.21 f | 148.27 ± 3.25 e |
| P (mg kg−1) | 35.78 ± 0.78 g | 65.93 ± 1.43 c | 44.46 ± 1.96 e | 71.04 ± 1.63 ab | 40.38 ± 0.88 f | 57.75 ± 1.82 d | 44.46 ± 1.32 e | 68.79 ± 1.49 bc | 36.81 ± 0.98 fg | 74.11 ± 1.61 a |
| Ca (mg kg−1) | 695.11 ± 15.11 a | 710.95 ± 15.45 a | 695.12 ± 15.12 a | 721.17 ± 15.67 a | 718.62 ± 16.51 a | 712.48 ± 15.48 a | 516.73 ± 11.23 c | 519.80 ± 11.35 c | 481.46 ± 10.46 c | 609.24 ± 13.24 b |
| Mg (mg kg−1) | 482.13 ± 10.48 a | 474.82 ± 12.36 a | 326 ± 55 ± 7.10 b | 327.72 ± 7.12 b | 237.71 ± 5.16 d | 234.19 ± 5.09 d | 307.79 ± 6.69 b | 314.64 ± 6.84 b | 239.21 ± 5.23 d | 274.72 ± 5.97 c |
| Na (mg kg−1) | 45.49 ± 0.99 cd | 46.03 ± 1.02 c | 41.40 ± 0.90 de | 45.49 ± 0.99 cd | 42.42 ± 0.92 cde | 40.89 ± 0.89 e | 63.89 ± 1.39 b | 62.86 ± 1.36 b | 88.42 ± 1.92 a | 84.85 ± 1.86 a |
| Fe (mg kg−1) | 9.15 ± 0.22 bc | 8.18 ± 0.18 ef | 9.45 ± 0.21 b | 8.43 ± 0.18 de | 8.07 ± 0.17 ef | 7.72 ± 0.17 f | 8.28 ± 0.18 def | 8.58 ± 0.18 cde | 8.94 ± 0.19 bcd | 14.26 ± 0.31 a |
| Cu (mg kg−1) | 0.10 ± 0.00 e | 0.10 ± 0.00 e | 0.05 ± 0.00 f | 0.05 ± 0.00 f | 0.05 ± 0.00 f | 0.05 ± 0.00 f | 0.20 ± 0.01 c | 0.25 ± 0.01 b | 0.16 ± 0.01 d | 0.31 ± 0.01 a |
| Zn (mg kg−1) | 1.07 ± 0.02 e | 0.97 ± 0.02 e | 1.02 ± 0.02 e | 1.17 ± 0.02 d | 1.02 ± 0.02 e | 0.97 ± 0.02 e | 1.53 ± 0.03 c | 1.58 ± 0.04 c | 2.09 ± 0.05 b | 2.21 ± 0.05 a |
| Mn (mg kg−1) | 2.40 ± 0.05 e | 2.40 ± 0.05 e | 8.89 ± 0.19 b | 8.88 ± 0.019 b | 12.83 ± 0.28 a | 12.62 ± 0.27 a | 2.60 ± 0.05 de | 2.66 ± 0.06 de | 2.96 ± 0.07 cd | 3.37 ± 0.07 c |
| B (mg kg−1) | 0.61 ± 0.01 c | 0.61 ± 0.01 c | 0.66 ± 0.01 c | 0.66 ± 0.01 c | 0.68 ± 0.01 c | 0.67 ± 0.01 c | 0.82 ± 0.02 b | 0.83 ± 0.02 b | 0.97 ± 0.02 a | 0.87 ± 0.02 b |
Values (n = 3) in rows followed by the same letter are not significantly different, p ≤ 0.05.
Table 3.
Effects of peat (P 100) with different biochar types (A, B, C, D) and ratio (0-5-10-15-20%) on plant growth (height in cm, upper fresh weight in g, upper dry weight in g, root length in cm), chlorophyll fluorescence (Fv/Fm), chlorophyll content (SPAD units), and minerals content (N, K, P in g kg−1).
| Height | Upper Fresh Weight | Upper Dry Weight | Root Length | Chlorophyll Fluorescence | SPAD | N | K | P | |
|---|---|---|---|---|---|---|---|---|---|
| P 100 | 2.46 ± 0.11 bcd | 2.62 ± 0.10 ef | 0.261 ± 0.011 a | 6.15 ± 0.23 abc | 0.832 ± 0.042 a | 27.92 ± 2.84 a | 22.19 ± 0.90 g | 14.70 ± 1.74 k | 7.03 ± 0.19 f |
| P-A 5% | 2.91 ± 0.07 a | 3.59 ± 0.12 a | 0.181 ± 0.005 cd | 5.38 ± 0.41 bcd | 0.701 ± 0.103 ab | 24.82 ± 1.95 abc | 39.11 ± 0.86 de | 35.58 ± 1.19 hi | 9.43 ± 0.10 de |
| P-A 10% | 2.76 ± 0.13 ab | 3.45 ± 0.11 a | 0.170 ± 0.009 de | 4.88 ± 0.21 bcd | 0.773 ± 0.022 a | 15.75 ± 1.12 ef | 39.83 ± 0.28 cde | 49.60 ± 0.18 de | 10.01 ± 0.02 cd |
| P-A 15% | 2.65 ± 0.11 abc | 2.95 ± 0.06 cdef | 0.147 ± 0.009 ef | 6.13 ± 0.25 abc | 0.753 ± 0.046 a | 21.87 ± 2.88 abcde | 34.09 ± 0.09 f | 45.07 ± 2.07 efg | 9.02 ± 0.11 e |
| P-A 20% | 2.26 ± 0.08 cde | 2.70 ± 0.17 ef | 0.165 ± 0.012 de | 6.03 ± 0.32 abcd | 0.559 ± 0.049 b | 27.77 ± 1.63 a | 40.10 ± 1.13 cde | 56.51 ± 1.09 c | 9.87 ± 0.25 cde |
| P-B 5% | 2.96 ± 0.15 a | 3.35 ± 0.13 ab | 0.208 ± 0.013 bc | 5.75 ± 0.81 abcd | 0.701 ± 0.033 ab | 25.95 ± 2.36 ab | 32.37 ± 0.23 f | 26.45 ± 1.88 j | 9.42 ± 0.32 de |
| P-B 10% | 2.71 ± 0.16 ab | 3.30 ± 0.14 abc | 0.170 ± 0.013 de | 5.53 ± 0.70 abcd | 0.551 ± 0.074 b | 18.30 ± 0.78 def | 37.44 ± 2.28 e | 41.22 ± 2.33 gh | 10.57 ± 0.42 bc |
| P-B 15% | 2.41 ± 0.11 bcd | 2.99 ± 0.10 bcde | 0.144 ± 0.007 efg | 6.13 ± 0.63 abc | 0.541 ± 0.077 b | 18.62 ± 1.38 cdef | 42.45 ± 1.87 bcd | 48.15 ± 1.59 ef | 10.19 ± 0.30 cd |
| P-B 20% | 1.96 ± 0.11 e | 2.14 ± 0.17 g | 0.113 ± 0.009 ghi | 6.36 ± 0.26 abc | 0.492 ± 0.065 b | 22.72 ± 1.55 abcd | 38.88 ± 1.19 de | 55.35 ± 2.16 cd | 11.23 ± 0.05 ab |
| P-C 5% | 2.20 ± 0.14 de | 2.66 ± 0.08 ef | 0.131 ± 0.005 fgh | 5.30 ± 0.45 bcd | 0.529 ± 0.024 b | 14.47 ± 1.53 f | 39.95 ± 0.49 cde | 60.15 ± 5.13 c | 10.63 ± 0.16 bc |
| P-C 10% | 2.28 ± 0.11 cde | 1.74 ± 0.12 h | 0.091 ± 0.006 i | 4.84 ± 0.75 cd | 0.569 ± 0.021 b | 16.97 ± 1.09 def | 43.31 ± 0.67 bc | 75.95 ± 1.44 b | 11.63 ± 0.34 a |
| P-C 15% | 2.65 ± 0.15 abc | 2.96 ± 0.17 bcdef | 0.156 ± 0.010 def | 4.42 ± 0.69 d | 0.561 ± 0.098 b | 19.42 ± 1.97 cdef | 41.37 ± 0.06 cd | 74.89 ± 0.86 b | 9.39 ± 0.15d e |
| P-C 20% | 2.40 ± 0.13 bcd | 2.83 ± 0.13 def | 0.152 ± 0.009 def | 4.50 ± 0.15 d | 0.725 ± 0.070 ab | 19.62 ± 1.49 cdef | 45.08 ± 1.29 ab | 82.17 ± 1.10 a | 10.64 ± 0.66 bc |
| P-D 5% | 2.20 ± 0.09 de | 3.22 ± 0.07 abcd | 0.215 ± 0.005 b | 7.01 ± 0.22 a | 0.751 ± 0.084 a | 23.30 ± 2.03 abcd | 33.21 ± 0.46 f | 33.17 ± 1.42 i | 9.55 ± 0.26 de |
| P-D 10% | 2.50 ± 0.13 bcd | 3.14 ± 0.04 abcd | 0.164 ± 0.013 de | 5.10 ± 0.50 bcd | 0.584 ± 0.062 ab | 17.35 ± 1.16 def | 41.08 ± 1.35 cd | 35.68 ± 2.01 hi | 10.65 ± 0.02 bc |
| P-D 15% | 2.65 ± 0.08 abc | 2.55 ± 0.15 f | 0.141 ± 0.007 efg | 4.76 ± 0.31 cd | 0.509 ± 0.076 b | 20.35 ± 3.62 bcdef | 42.74 ± 0.07 bc | 42.51 ± 0.64 fg | 11.83 ± 0.12 a |
| P-D 20% | 2.73 ± 0.07 ab | 2.11 ± 0.08 g | 0.104 ± 0.002 hi | 4.45 ± 0.29 d | 0.429 ± 0.016 c | 17.45 ± 1.09 def | 48.09 ± 1.35 a | 49.21 ± 2.21 e | 10.60 ± 0.18 bc |
Values (n = 4) in columns followed by the same letter are not significantly different, p ≤ 0.05.
Table 4.
Effects of peat (P 100) with different biochar types (A, D) and ratio (7.5%, 15%) and mineral doses (with standard or with additional Fertilizers-Fert.) on cabbage plant growth (height in cm, upper fresh weight in g, upper dry weight in g, root length in cm).
Table 4.
Effects of peat (P 100) with different biochar types (A, D) and ratio (7.5%, 15%) and mineral doses (with standard or with additional Fertilizers-Fert.) on cabbage plant growth (height in cm, upper fresh weight in g, upper dry weight in g, root length in cm).
| Height | Leaf Number | Upper Fresh Weight | Upper Dry Weight | |
|---|---|---|---|---|
| P 100 | 5.40 ± 0.32 abc | 3.33 ± 0.21 ab | 1.962 ± 0.065 de | 0.098 ± 0.005 c |
| PFert 100 | 4.98 ± 0.25 bcd | 3.00 ± 0.00 b | 2.230 ± 0.218 bcde | 0.098 ± 0.014 c |
| P-A 7.5% | 4.83 ± 0.31 bcd | 3.00 ± 0.00 b | 2.210 ± 0.074 bcde | 0.124 ± 0.012 bc |
| PFert-A 7.5% | 4.83 ± 0.23 bcd | 3.50 ± 0.22 a | 2.834 ± 0.147 a | 0.177 ± 0.006 a |
| P-A 15% | 4.77 ± 0.26 bcd | 3.00 ± 0.00 b | 2.033 ± 0.240 cde | 0.107 ± 0.012 c |
| PFert-A 15% | 4.15 ± 0.32 d | 3.17 ± 0.17 ab | 1.724 ± 0.180 e | 0.095 ± 0.008 c |
| P-D 7.5% | 4.20 ± 0.19 d | 3.00 ± 0.00 b | 2.091 ± 0.201 bcde | 0.121 ± 0.009 bc |
| PFert-D 7.5% | 4.40 ± 0.26 cd | 3.00 ± 0.00 b | 2.387 ± 0.301 abcd | 0.110 ± 0.008 c |
| P-D 15% | 5.52 ± 0.14 ab | 3.00 ± 0.00 b | 2.633 ± 0.218 abc | 0.144 ± 0.007 b |
| PFert-D 15% | 6.15 ± 0.64 a | 3.50 ± 0.22 a | 2.681 ± 0.0.091 ab | 0.121 ± 0.005 bc |
Values (n = 6) in columns followed by the same letter are not significantly different, p < 0.05.
Table 5.
Effects of peat (P 100) with different biochar types (A, D) and ratio (7.5%, 15%) and mineral doses (with standard or with additional Fertilizers-Fert.) on leaf chlorophyll content (SPAD units), leaf stomatal conductance (cm s−1) and chlorophylls (Chl a, Chl b, total Chls) content (mg g−1).
| Stomatal Conductance | SPAD | Chl a | Chl b | Total Chls | |
|---|---|---|---|---|---|
| P 100 | 2.69 ± 0.29 ab | 18.02 ± 1.99 ab | 0.322 ± 0.025 abcd | 0.177 ± 0.010 ab | 0.439 ± 0.035 abcd |
| PFert 100 | 3.08 ± 0.65 a | 18.75 ± 1.96 ab | 0.311 ± 0.003 bcd | 0.112 ± 0.003 b | 0.422 ± 0.003 bcd |
| P-A 7.5% | 2.08 ± 0.29 abc | 15.05 ± 1.00 b | 0.362 ± 0.020 ab | 0.125 ± 0.006 ab | 0.487 ± 0.026 ab |
| PFert-A 7.5% | 1.11 ± 0.23 c | 18.50 ± 2.55 ab | 0.359 ± 0.034 ab | 0.114 ± 0.009 ab | 0.474 ± 0.043 abc |
| P-A 15% | 2.07 ± 0.42 abc | 15.43 ± 1.26 ab | 0.274 ± 0.024 cd | 0.097 ± 0.011 bc | 0.371 ± 0.035 cd |
| PFert-A 15% | 2.73 ± 0.47 ab | 15.25 ± 0.53 ab | 0.260 ± 0.006 d | 0.081 ± 0.002 c | 0.342 ± 0.008 d |
| P-D 7.5% | 1.89 ± 0.06 bc | 20.02 ± 1.25 ab | 0.345 ± 0.049 abc | 0.117 ± 0.015 ab | 0.461 ± 0.063 abc |
| PFert-D 7.5% | 2.00 ± 0.11 abc | 18.68 ± 1.78 ab | 0.319 ± 0.016 abcd | 0.116 ± 0.008 ab | 0.435 ± 0.025 abcd |
| P-D 15% | 2.04 ± 0.37 abc | 20.37 ± 1.21 a | 0.340 ± 0.018 abcd | 0.110 ± 0.004 b | 0.450 ± 0.022 abcd |
| PFert-D 15% | 1.60 ± 0.22 bc | 18.18 ± 0.75 ab | 0.397 ± 0.029 a | 0.142 ± 0.012 a | 0.539 ± 0.041 a |
Values (n = 6) in columns followed by the same letter are not significantly different, p < 0.05.
© 2019 by the authors. Licensee MDPI, Basel, Switzerland. This article is an open access article distributed under the terms and conditions of the Creative Commons Attribution (CC BY) license (http://creativecommons.org/licenses/by/4.0/).
Share and Cite
MDPI and ACS Style
Chrysargyris, A.; Prasad, M.; Kavanagh, A.; Tzortzakis, N. Biochar Type and Ratio as a Peat Additive/Partial Peat Replacement in Growing Media for Cabbage Seedling Production. Agronomy 2019, 9, 693. https://doi.org/10.3390/agronomy9110693
AMA Style
Chrysargyris A, Prasad M, Kavanagh A, Tzortzakis N. Biochar Type and Ratio as a Peat Additive/Partial Peat Replacement in Growing Media for Cabbage Seedling Production. Agronomy. 2019; 9(11):693. https://doi.org/10.3390/agronomy9110693
Chicago/Turabian StyleChrysargyris, Antonios, Munoo Prasad, Anna Kavanagh, and Nikos Tzortzakis. 2019. "Biochar Type and Ratio as a Peat Additive/Partial Peat Replacement in Growing Media for Cabbage Seedling Production" Agronomy 9, no. 11: 693. https://doi.org/10.3390/agronomy9110693
Note that from the first issue of 2016, this journal uses article numbers instead of page numbers. See further details here.