Article

Screening of Provitamin-A Maize Inbred Lines for Drought Tolerance: Beta-Carotene Content and Secondary Traits

School of Agriculture, Earth and Environmental Sciences, University of KwaZulu-Natal, Private Bag X01, Scottsville 3209, Pietermaritzburg, South Africa
*
Author to whom correspondence should be addressed.
Agronomy 2019, 9(11), 692; https://doi.org/10.3390/agronomy9110692
Submission received: 17 September 2019 / Revised: 17 October 2019 / Accepted: 21 October 2019 / Published: 29 October 2019

Abstract

:
Provitamin A maize (Zea mays L.) biofortification is an ideal complementary means of combating vitamin A deficiency (VAD) in sub-Saharan Africa where maize consumption is high coupled by high VAD incidences. However, drought remains a major abiotic constraint to maize productivity in this region. Comprehensive drought screening of initial breeding materials before advancing them is important to achieve genetic gain. In this study, 46 provitamin-A inbred lines were screened for drought tolerance in the greenhouse and field under drought and optimum conditions using β-carotene content (BCC), grain yield (GY), and selected morphophysiological and biochemical traits. The results revealed that BCC, morphophysiological and biochemical traits were effective in discriminating among genotypes. Number of ears per plant (EPP), stomatal conductance (Gs), delayed leaf senescence (SEN), leaf rolling (RL), chlorophyll content (CC) and free proline content (PC) proved to be ideal traits to use when indirectly selecting for GY by virtue of having relative efficiency of indirect selection values that are greater than unity and considerable genetic variances under either or both conditions. The findings of this study form the basis of initial germplasm selection when improving provitamin A maize for drought tolerance.

1. Introduction

Provitamin A maize has orange or yellow endosperm, which contains precursors of vitamin A in the form of carotenoids, hence the name “provitamin A maize”. Provitamin A carotenoids include β-carotene, α-carotene and β-cryptoxanthin. Beta-carotene is the most important of the three carotenoids because it has higher provitamin A activity owing to its unique double ring molecular structure [1]. However, the ordinary (not improved) yellow maize grown and consumed throughout the world has β-carotene content of less than 1.5 μg g−1 [2], which is too low given that the required target of total provitamin A carotenoid is 15 μg g−1 [3]. Developing provitamin A maize cultivars with higher levels of provitamin A carotenoids through biofortification is a sustainable, cheap and effective complementary solution to VAD challenges faced by many developing nations [4].
An online Biofortification Priority Index (BPI) tool, developed and managed by HarvestPlus, shows that maize provitamin A biofortification as VAD intervention is most suitable for maize consuming developing countries, particularly the Southern Africa region (www.harvestplus.org/knowledge-market/BPI). However, maize production in this region is vulnerable to drought due to recurring low annual precipitation coupled by poor coping capacity of most farmers. For instance, in 1992 and 2002, most of the southern African countries experienced the worst droughts resulting in over 60% maize yield loss in the whole region [5]. In 2013, 770 million people in the Southern African Development Community (SADC) were at risk of food insecurity due to severe mid-season dry spells [6]. In 2016, eight of South Africa’s nine provinces were declared food-insecure due to drought [7].
Drought stress affects maize at almost all growth stages, but the flowering and grain filling stages are the most susceptible, with yield losses of over 90% reported when drought coincides with these growth stages [8]. Genetic improvement of maize for drought tolerance through breeding is a sustainable solution to reduce the impacts of drought. However, breeding for drought tolerance is a complex task because the trait is controlled by many genes, and is highly affected by genotype and environment interaction. Furthermore, grain yield, which is the trait of interest, has very low variation and heritability under drought conditions, which makes selection difficult [9]. Comprehensive screening forms the foundation of any successful drought tolerance breeding program [10]. Additionally, screening materials for drought tolerance at the initial stages of breeding often imparts tolerance to other related stresses such as low nitrogen stress [11].
To increase the chances of selecting the appropriate genotypes, breeders should meticulously consider all the available information at screening phase. Screening maize for drought tolerance entails the selection of high yielding genotypes under water deficit stress and/or optimum conditions. Indirect selection for grain yield via related secondary traits helps to circumvent the challenge of poor grain yield variation and low heritability under drought conditions [12]. Stress-tolerant indices and multivariate statistics are often useful when selecting best genotypes.
Indirect selection for drought tolerance involves selecting for multi-secondary traits that are highly correlated to grain yield and have high heritability values. Furthermore, an ideal secondary trait should have efficiency of indirect selection relative to direct selection of greater than a unity [13]. Morphological and physiological (morphophysiological) traits that are associated with maize drought tolerance include anthesis-silking interval (ASI), leaf rolling (RL), chlorophyll content (CC), leaf senescence (SEN), and number of ears per plant (EPP) [12,14]. Stomatal conductance (Gs) analysis as a physiological response to drought stress has not been widely applied as a screening criterion for drought tolerance in maize and therefore, information about its correlation with grain yield and heritability under drought stress and optimum conditions is not well established.
Biochemical changes that are drought-induced in plants include increase in stress signaling hormones and proteins regulators such as proline and abscisic acid (ABA) among others [15,16]. Proline is an amino acid, which plays an osmoregulatory role in plants under drought conditions [17]. Despite the presence of genetic variation of proline content in plants under drought stress and wide application of proline analysis in understanding drought tolerance of other crops such as wheat [18], cowpea [19], and peanut [20], it has not been applied in large-scale maize drought tolerance screening.
Given the importance of maize provitamin A biofortification in maize-consuming developing countries and the prevailing devastating impacts of drought to maize productivity, it is important to investigate the effectiveness of integrated application of morphophysiological and biochemical traits in screening provitamin A maize inbred lines for drought tolerance. The objectives of the study were to: (i) determine the level of genotypic variation for drought tolerance among tropical provitamin A maize inbred lines in regards to secondary traits, (ii) screen candidate lines for drought tolerance based on grain yield and β-carotene content, and (iii) identify secondary traits that can be effectively used for indirect selection of grain yield under drought stressed and non-stressed conditions. The study forms the basis of germplasm selection for use in provitamin A maize drought tolerance breeding programs.

2. Materials and Methods

2.1. Plant Materials and Study Sites

Fifty inbred lines were screened for drought stress tolerance under managed drought conditions. Inbred lines consisted of 46 provitamin A (orange endosperm) and four drought tolerant white endosperm (non-provitamin A) checks. The 46 provitamin-A inbred lines were sourced from the provitamin A biofortification nurseries of International Maize and Wheat Improvement Center (CIMMYT) (33) and International Institute of Tropical Agriculture (IITA) (13). The four drought tolerant checks were obtained from the Agricultural Research Council (ARC), Grain Crops Institute, Potchefstroom, South Africa. Names, codes and other information about the inbred lines are given in supplementary Table S1. The respective institutions could not provide pedigree information. The study was carried out across four environments (Env), which were two greenhouse and two field in KwaZulu-Natal Province of South Africa. Greenhouse trials were carried out at the University of KwaZulu-Natal (UKZN), Agriculture Pietermaritzburg campus (29°46′ S, 30°58′ E) from January to April 2017 (Env1) and May to September 2017 (Env2). The field trials were carried out at Ukulinga Research Farm in Pietermaritzburg (29°40′ S, 30°24′ E) from April to August 2017 (Env3) and at Makhathini Research station, Jozini, South Africa (27°39′ S, 32°17′ E) from May to September 2018 (Env4). Supplementary Table S2 shows monthly weather data for the four environments during the respective growing periods.

2.2. Experimental Design and Crop Establishment

An alpha lattice design was used to screen the 50 genotypes with two replications containing five incomplete blocks with ten genotypes each and two water regimes (water stress, S and optimum conditions, W) across all the four environments. In the field, the plot size was two rows of 5 m with 0.75 m between the rows and intra row spacing of 0.30 m. Plots were planted with two seeds per station and thinned to one plant 2 weeks after crop emergence. In the greenhouse, a plot was made of four 5 L perforated plastic pots with two plants in each pot, which were thinned to one plant per pot 2 weeks after crop emergence. Pine-bark growing media mixed with loam soil at a ratio of 3:1 was used in the greenhouse. In the field, the soil was predominantly black clay loam soil at both sites. The water stress treatment (S) for all the experiments was implemented in accordance with CIMMYT protocols of withholding irrigation at two weeks prior to expected anthesis date [21]. The water stress condition was maintained until 5 weeks after the flowering of 50% of the genotypes then a single irrigation was applied at grain filling stage. In the field, the optimum treatment (W) involved a 10-day interval sprinkler irrigation throughout the growing period. In the greenhouse, W consisted of drip irrigation for 3 min, four times per day. Across all the environments, compound fertilizer was applied at the rate of 150 kg N, 65 kg P and 65 kg K ha−1 at the time of planting and top-dressing fertilizer was applied at five weeks after emergence at a rate of 60 kg N ha−1. In the field, weeds were controlled using Gramoxone® (Syngenta, Greensboro, NC, USA) at a rate of 5 L ha−1 and manual weeding whilst hand weeding was done in the greenhouse. Coragen® (Dupont, Washington, DC, USA) and Karate® (Syngenta, Greensboro, NC, USA) insecticides were used to control insects at a rate of 1 L ha−1 across all environments when it was necessary.

2.3. Plant Characteristics

2.3.1. Morphophysiological Traits

Data for the following morphophysiological and biochemical traits were collected under both water regimes across all the four environments. Most traits were measured following a CIMMYT protocol described by [21]. Both field and greenhouse grain yield (GY) was estimated per plot area bases and converted to tonnes per hectare. The plot area in the greenhouse was determined by multiplying the cylinder-shaped pot area by 4 since a plot was made up of four pots. Similarly, the plot area for the field experiments was determined by calculating the area of a rectangular shaped plot. Number of ears per plant (EPP) was computed as the number of ears with at least one fully developed grain divided by the number of harvested plants. Days to anthesis (DA) is the number of days after planting to when 50% of the plants in a plot start to shed pollen. Days to silking (DS) is the number of days after planting when 50% of plant in a plot produces silks. Anthesis-silking interval (ASI) was calculated as DS minus DA. Leaf rolling (RL) was scored using a scale of 0 to 10 where 0 = unrolled leaf and 10 = leaf rolled like an onion and scores were converted to percentage (%) with measurements taken twice after imposing drought treatment. Leaf senescence (SEN) was scored using a scale from 1 to 10 (1 = 10%; 2 = 20%; 3 = 30%; 4 = 40%; 5 = 50%; 6 = 60%; 7 = 70%; 8 = 80%; 9 = 90%; and 10 = 100% dead leaf area) at 3, 5 and 7 weeks after 50% of the plants reached anthesis. Chlorophyll content (CC) was measured from the adaxial surface of the second top fully expanded leaf of five plants per plot at 3, 5 and 7 weeks after 50% of the plants reached anthesis using SPAD-502-Plus chlorophyll meter (Konica Minolta, Osaka, Japan). Stomatal conductance (Gs) was measured from the abaxial surface of the second top fully expanded leaf using a SC–1 leaf porometer (Decagon Devices®, Pullman, WA, USA) at 3, 5 and 7 weeks after 50% of the plants reached anthesis. Chlorophyll content (CC) and stomatal conductance were measured at midday periods (1200–1400 h). Beta carotene content (BCC) and proline (PC) content were determined and measured as described in the following section.

2.3.2. Biochemical Traits

Beta-carotene content was measured from kernels harvested from the self pollinated plants of each of the 46 provitamin inbred lines. A sample of 20 g, which contained about 30 to 50 kernels, was randomly collected from each of the 46 provitamin-A inbred lines and dispatched to Agricultural Research Council (ARC), Science Analytical Laboratory, Pretoria, South Africa (http://www.arc.agric.za) for β-carotene analysis. High-performance liquid chromatography (HPLC) was used for analysis following a protocol for dried maize kernels as described by [22]. The β-carotene analysis was done three times per sample, giving three data points per each genotype.
Proline analysis was performed at UKZN, Crop Science laboratory following a protocol by [23]. Fresh leaf samples were collected from the second top fully expanded leaves for the S and W treatments of both field and greenhouse experiments at 3 weeks after imposing the S treatment. The leaf samples were freeze-dried at very low temperature (−74 °C) using liquid nitrogen before grinding them into fine powder. A 0.5 g ground leaf sample was homogenized in 10 mL of 3% aqueous sulfosalicylic acid and the homogenate was filtered. Two ml of filtrate was mixed with 2 mL acid-ninhydrin and 2 mL of glacial acetic acid for 1 h in a water bath at 100 °C. After cooling, 4 mL of toluene were added and then mixed vigorously using a rotor. The top mixture containing proline within toluene was decanted from the aqueous phase then taken for UV visible spectrophotometer analysis for the absorbance measurement at a wavelength of 520 nm using a model UV-1800 spectrophotometer (Shimadzu Corporation, Kyoto, Japan). The proline concentration was calculated using the formula shown in Equation (1) [23].
Proline   Content ( μ g   per   gram   of   dry   leaf   tissue ) = [ ( μ gproline / mL )   ×   mL   toluene ) / 115.5   μ g / μ mole ] / [ ( g   sample ) / 5 ]
where 115.5 is the molecular weight of proline.

2.4. Data Analysis

2.4.1. Analysis of Variance, Mean Performance and Stress-Tolerant Index

Analysis of variance (ANOVA) for all morphophysiological and biochemical traits was done after carrying out a test of homogeneity of variances. A lattice procedure of R software version 3.5.1 [24] was used to carry out the ANOVA following a mixed model (Equation (2)). Genotypes were considered as fixed effects and environments as random:
Y i j k l m = μ + R e i +   B ( R e ) i j + G k + E l + W m + G E k l + G W k m + E W l m + G E W k l m + i j k l m
where Y i j k l m is the trait of interest, μ is the mean effect, R e i is the effect of the i th replicate, B ( R e ) i j is the effect of the j th incomplete block within the i th replicate, G k is the effect of the k th genotype, E l is the effect of the l th environment, W m is effect of the m th water regime while G E k l ,   G W k m ,   E W l m   and   G E W k l m are the respective interactions and i j k l m is the residual error term.
Beta-carotene was analysed separately using the general linear model given in Equation (3).
Y i j = μ   + G j + S ( G ) i j
where Yij—the performance of ith sample of the jth genotype; Gj—the effect of jth genotype; S(G)ij—sample within genotype, which is the error term.
Least significant difference (LSD) test was carried out at 0.5 α level to separate the means.
Stress tolerance index (STI) described by [25] was used to select high yielding genotypes under both conditions as shown in Equation (4):
S T I = Y p i × Y s i Y p 2
where Y s —grain yield of a genotype i under drought-stressed condition; Y p —grain yield of i genotype under non-stressed condition, and X p —mean yield of genotypes under non-stressed condition. Genotypes with high STI value and β-carotene content greater than 1.5 μg g−1 were selected.

2.4.2. Variance Components and Heritability

Variance components and broad sense heritability (H) were computed for morphophysiological and biochemical traits in R software following a procedure described by [26] as shown in Equations (5) and (6).
δ 2 p =   δ 2 g + δ 2 g e e + δ 2   r e
H =   δ 2 g δ 2 p
where δ 2 p —phenotypic variance, δ 2 g —genotypic variances, δ 2 g e —genotype by environment interaction variance, δ 2 —error variance, r—number of replications, e—number of environments and H —broad sense heritability.
Heritability classifications guidelines described by [27] were used to describe the heritability levels exhibited by the measured traits in this study in which values from 0 to 0.3 was low, 0.3 to 0.6 was moderate and >0.6 was high.

2.4.3. Principal Component Biplot, Trait Correlations and Relative Selection Efficiency

Phenotypic and genotypic correlations among morphophysiological and biochemical traits were computed separately for each water regime using the META-R software version 6.04 [28]. Correlation classifications guidelines described by [29] were used to explain the correlations among the traits in this study in which correlation coefficients values from ±0.9 to ±1.00 were considered very high correlations, ±0.7 to ±0.9 were high, ±0.5 to ±0.7 were moderate, ±0.3 to ±0.5 were low and ±0.00 to ±0.3 were negligible. A combined principal component PCA biplot was computed to graphically show the traits associated with each water regime. Equation (7) was used to test the efficiency of indirect selection of grain yield via secondary traits relative to direct selection as outlined by [13].
Relative   efficiency   of   indirect   selection = | r g | h X h G Y
where | r g | is the value of the genotypic correlation between GY and a secondary trait, h X is the square root of the broad sense heritability of trait, and h G Y is the square root of the broad sense heritability of grain yield. According to [13] the most desirable secondary traits should have an efficiency of indirect selection relative to direct selection of greater than unity.

3. Results

3.1. Analysis of Variance, Mean Performances and Stress-Tolerant Index

A combined ANOVA was carried out after separate ANOVA had shown significant (p < 0.05) effects of genotype, water regime and their interaction for the studied traits (Table 1). The combined ANOVA revealed that the genotype, water regime, environment and their respective interactions had significant (p < 0.001 and p < 0.05) effects on GY and other traits except DA, EPP and PC, which were not significantly affected by the interaction of the environment and water regime. Genotypes exhibited significantly (p < 0.001) different mean BCC (Table 1).
Mean performance of the top ten and bottom five genotypes with >1.5 μg g−1 BCC and ranked in descending order of STI values are presented in Table 2. Thirty-one genotypes had >1.5 μg g−1 BCC. Mean BCC was 2.05 μg g−1 with genotype 24 (CLHP0022) ranked first in the STI ranking of genotypes with >1.5 μg g−1 BCC. Genotypes 1 (CLHP00306) and 11 (CLHP00378) had the highest BCC of 4.22 μg g−1 whilst 14 (CLHP0343) had the lowest value of 0.64 μg g−1. The mean performance of all the 50 genotypes under the two water regimes are given in supplementary Table S3. Mean STI was 0.53. Fifty percent of genotypes surpassed the mean STI value. The highest STI value was 0.94 exhibited by entry 27 (CLHP0005) whilst entry 20 (CLHP0364) had the least STI value of 0.23. Genotype 50 (CML569) had the highest STI value of 0.71 among the four drought tolerant checks. The proportion of test genotypes that were ranked higher than the best check on the STI ranking was 10.86%.
The mean GY under optimum and stress conditions were 1.72 t ha−1 and 0.88 t ha−1, respectively. This resulted in 51.2% mean yield loss due to drought stress with the highest and lowest percentage yield losses of 64.17% and 29.21%, respectively. Genotype 50 (CML569) was the best yielding check under both drought-stressed and non-stressed conditions with 0.94 t ha−1 and 2.26 t ha−1, respectively. The proportion of test genotypes that yielded higher than the best check was 45.57% and 8.70% under drought stressed and non-stressed conditions, respectively. Mean DA was reduced from 75.03 days under optimum conditions to 69.40 days under water stress conditions. Mean ASI increased from a mean of 1.97 days under optimum conditions to a mean of 8.56 days under drought stress conditions. Mean EPP was reduced by drought stress from 2.24 under optimum to 1.68 under drought stress conditions.
Mean RL increased from 3.04% under optimum conditions to 49.78% under water stress. Stomatal conductance was severely reduced from a mean of 368.94 mmol m−2 s−1 under optimum conditions to a mean of 49.78 mmol m−2 s−1 under drought stress conditions. Leaf senescence increased due to drought stress from a mean of 11.60% under optimum conditions to 50.18% under water stress conditions. Proline content increased from a mean of 31.83 μg g−1 under optimum conditions to a mean of 149.23 μg g−1 under water stress conditions with genotype 31 (CML486) having the highest PC of 230.63 μg g−1 under water stress conditions.

3.2. Heritability and Variance Components

Grain yield, DA, EPP, Gs and CC exhibited high heritability and genotypic variance values under non-stressed conditions whilst ASI, RL, SEN and PC had high values under drought conditions (Table 3). Heritability estimates ranged from 0.250 to 0.998 under non-drought conditions and 0.127 to 0.987 under drought conditions. Most traits, except Gs, were characterized by sharp differences in heritability values between the two water regimes. For instance, heritability estimates for GY yield dropped from 0.621 under non-stressed conditions to 0.398 under drought conditions whilst PC had heritability values of 0.263 and 0.777 under non-stressed and drought conditions, respectively. Generally, variance due to genotype by environment interaction was higher under drought conditions than under non-drought conditions.

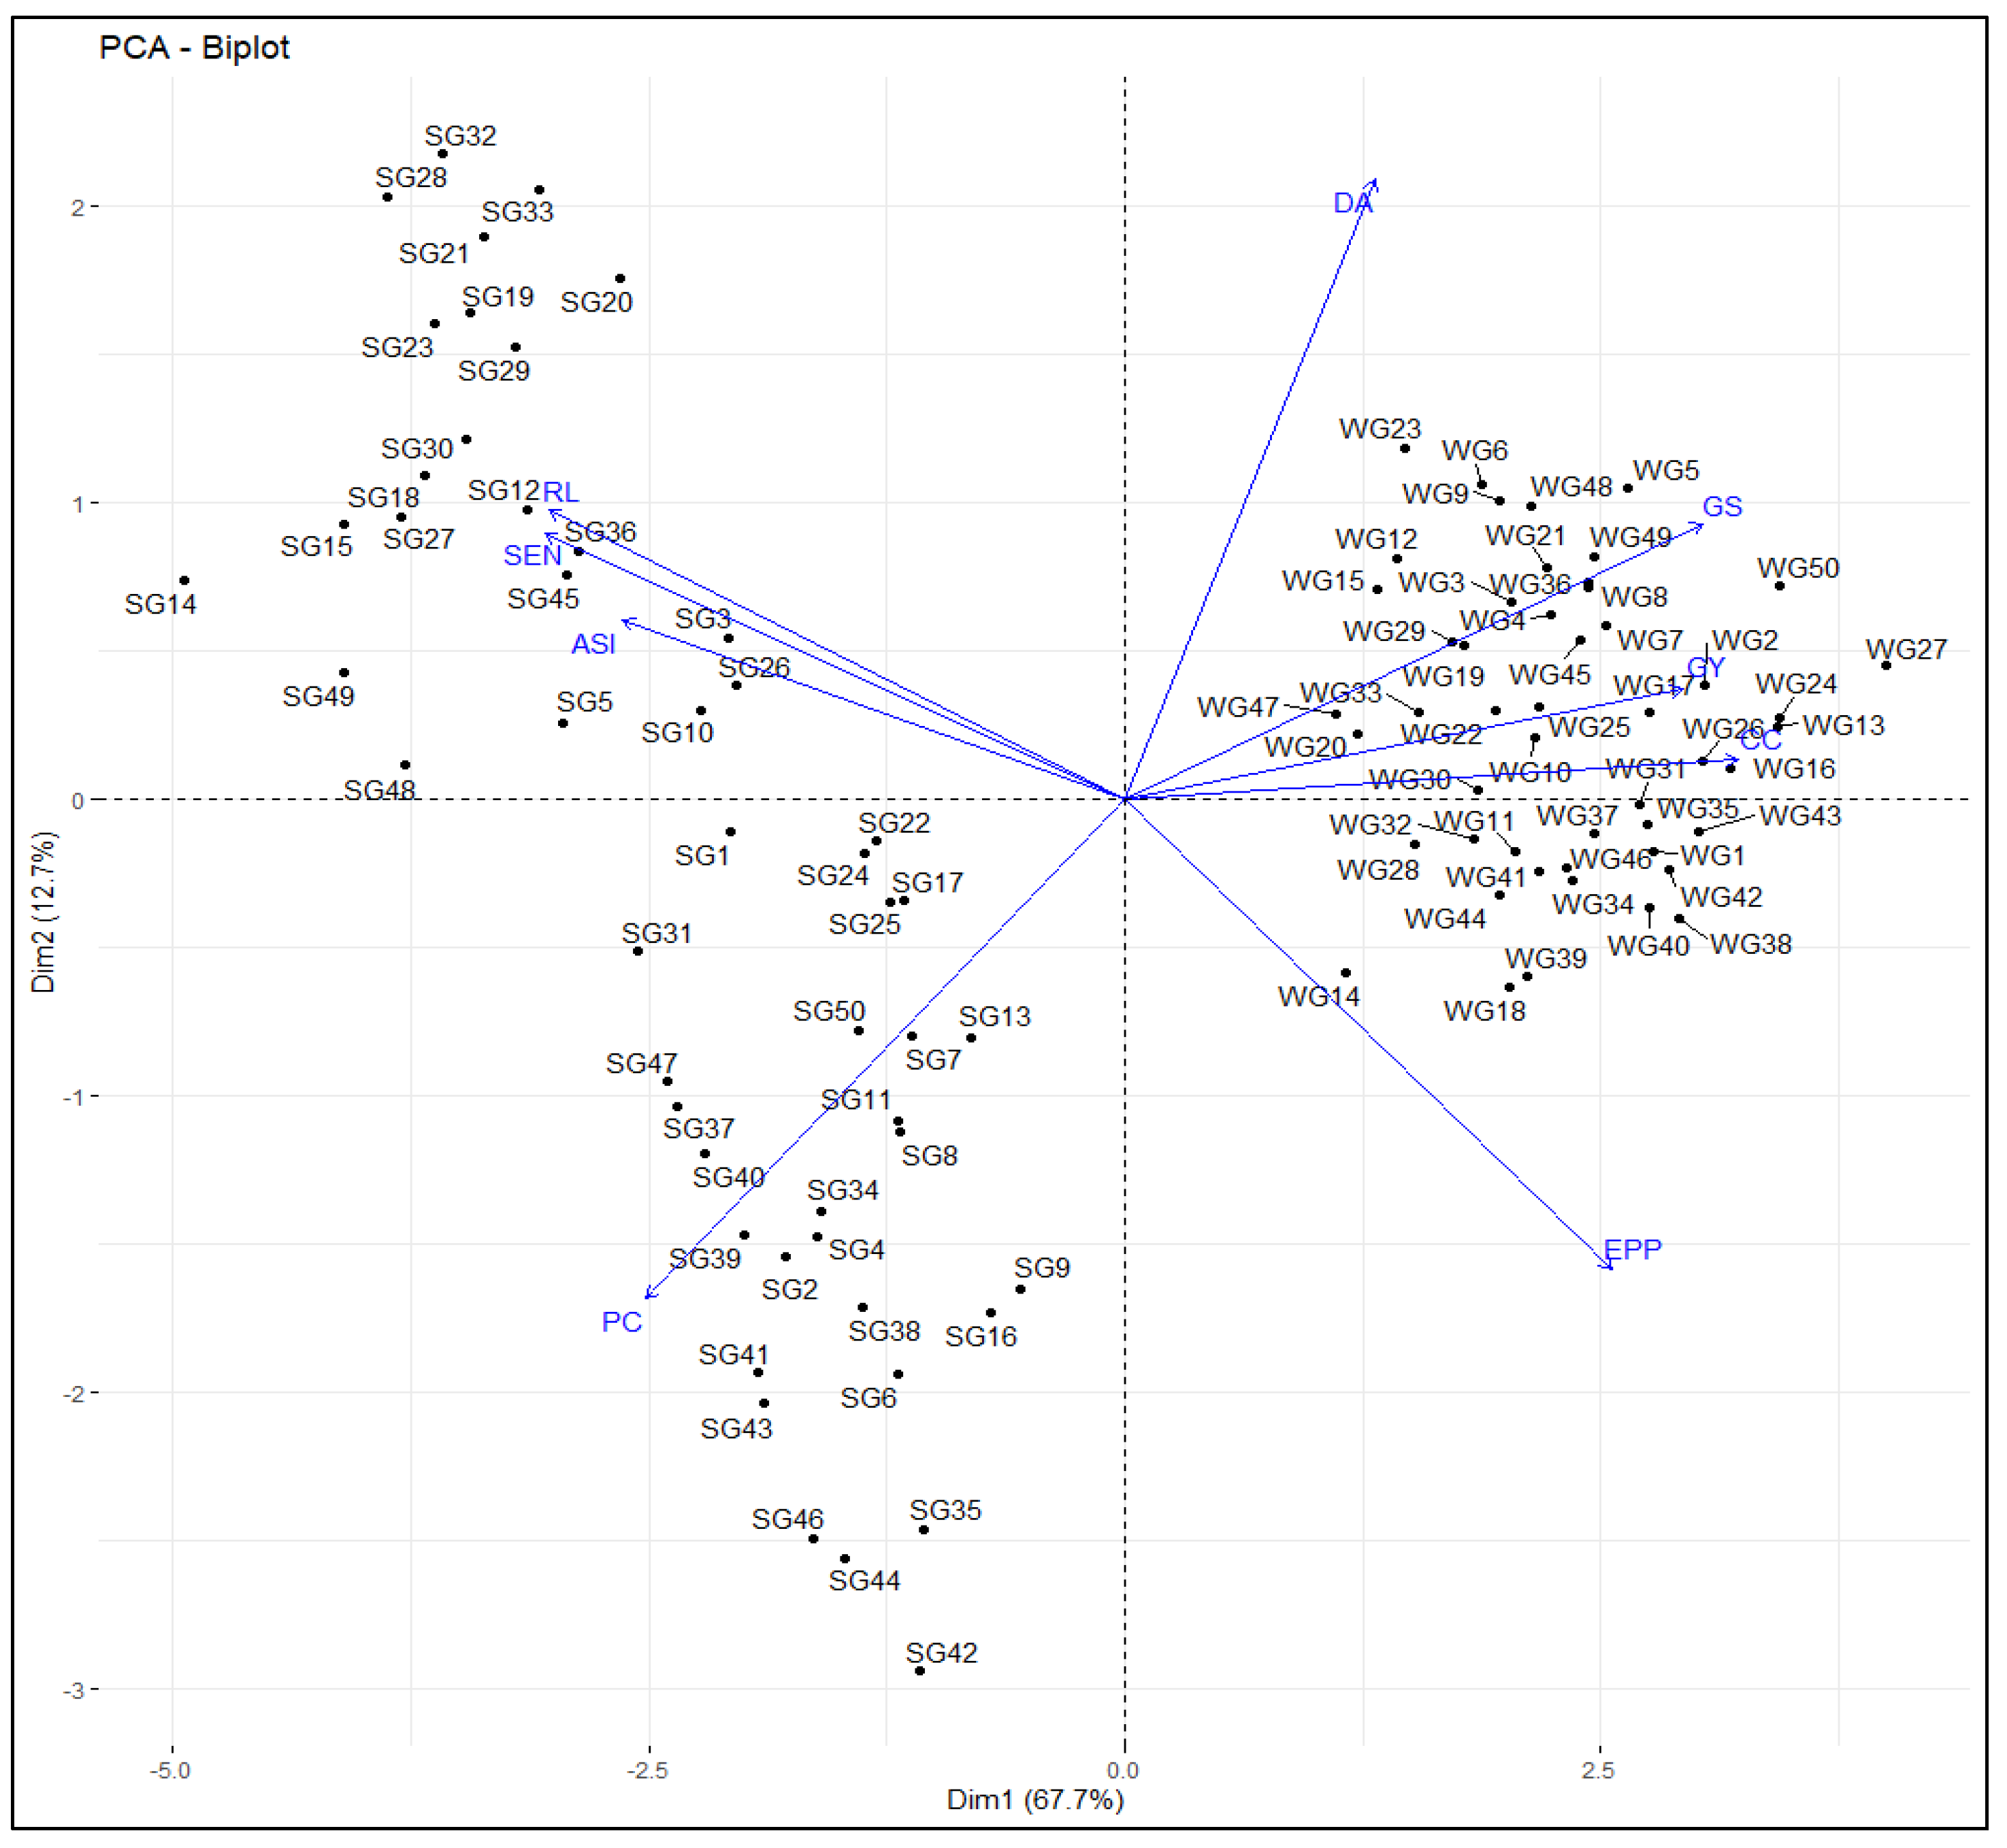
3.3. Principal Component Biplot Analysis

A combined principal components biplot was constructed to show traits that were more outstanding in discriminating among genotypes per each water regime (Figure 1). First and second principal components explained 80.4% of the total variation. Performance of genotypes with respect to the measured nine traits under water-stressed conditions (prefixed with SG) were located on the negative side of the biplot whilst majority of genotypes under optimum conditions (prefixed with WG) were on the positive side of the biplot. Traits ASI, RL, SEN and PC were more discriminating among genotypes under drought conditions whilst GY, Gs, CC, DA and EPP were more discriminating among genotypes under non-stressed conditions. Vector length is relative to the discriminating power of the respective trait. Hence, the trait discriminating power within the non-stressed condition in descending order was EPP, DA, GS, CC and GY. On the other hand, PC, RL, SEN and ASI, was the respective order of discriminating under drought stress conditions. Genotypes positioned at or close to a vector of a traits are more associated with that trait. Also genotypes that are located at the tip end of trait vector excelled in the respective trait. For instance, genotype 39 (TZM1224) excelled in proline content (PC) under drought conditions whilst genotypes 2 (CLHP00306) and 25 (CLHP0113) were further on the GY vector under well-watered conditions. Very few genotypes were associated and excelled in EPP and DA under non-stress conditions.

3.4. Phenotypic Correlation Analysis

Phenotypic correlation coefficients (r) among measured morphophysiological and biochemical traits under non-stressed conditions (upper diagonal) and drought conditions (lower diagonal) (Table 4). Under drought stress, GY had significant (p < 0.001) and positive correlations that were high with EPP, and low with RL, CC and PC. It also had a significant and negative correlation that was moderate with ASI and Gs, and low with DA, and SEN. Number of ears per plant had significant (p < 0.001) and negative correlations which were high with ASI, moderate with DA and Gs, and low with SEN, CC and PC. Stomatal conductance had significant (p < 0.001) and moderate positive correlations with RL and SEN. In addition, PC had a significant (p < 0.001,) low positive correlation with RL and SEN. It also had a significant (p < 0.05), low negative correlation with CC. Under non-stressed conditions, GY had significant (p < 0.001) and positive correlation, which was moderate with CC and EPP, low with Gs and DA, and negligible with RL. It also had significant and negative correlation, which was moderate with ASI, low with SEN and negligible with PC. Number of ears per plant had a significant (p < 0.001) negative correlation which was moderate with ASI and low with SEN. On the other hand, EPP had a significant (p < 0.001) positive correlation, which was moderate with Gs and low with CC. Proline content had negligible correlation with SEN and CC under non-stressed conditions.
Across environments phenotypic correlation coefficients for grain yield only were computed in order to compare greenhouse and field environments (supplementary Table S4). Environments were further subdivided into greenhouse non-stressed, greenhouse-stressed, field-non-stressed and field-stressed. Correlations among all the four environmental subdivisions ranged from moderate to high (r = 0.456 to r = 0.751). Significant (p < 0.001) and high correlation (r = 0.751) was observed between greenhouse and field-non-stressed whilst greenhouse and field-stressed had moderate correlations (r = 0.643). Significant (p < 0.001) moderate correlations were also observed between greenhouse non-stressed and stressed (r = 0.553), and field-stressed and non-stressed (r = 0.585). Greenhouse non-stressed and field-stressed had a significant (p < 0.05) moderate correlation (r = 0.502) whilst greenhouse stressed and field-non-stressed had a significant (p < 0.05) moderate correlation (r = 0.456).

3.5. Relative Efficiency of Indirect Selection

Relative efficiency of indirect selection through secondary traits for grain yield ranged from 0.142 for DA to 1.370 for Gs under drought conditions and from 0.012 for PC under to 1.235 for Gs under non-drought conditions (Table 5). Traits that exhibited relative selection efficiency of greater than unity are EPP, RL, Gs, SEN and PC under drought conditions, and EPP, Gs and CC under optimum conditions. All the genetic correlations coefficients used in calculating the relative efficiency of indirect selection are given in supplementary Table S5.

4. Discussion

Comprehensive screening of germplasm forms the basis of selecting the right materials, which in turn increases the chances of achieving genetic gain in plant breeding. In this study, the ANOVA showed highly significant genotypic differences with respect to all the studied traits. This indicates the feasibility of genetic improvement for drought tolerance and β-carotene content given that genetic variation is a prerequisite for genetic advance [30]. In a related study, [31] also reported a significant genetic variation among inbred lines obtained from CIMMYT and IITA stress-tolerant breeding programs. The significance of the water regime and its interaction with the genotype for all the traits indicate that the imposed drought stress was effective in discriminating among the genotypes. Furthermore, the highly significant genotype by environment interaction effects observed for most of the traits showed that there were performance differences by inbred lines across the environments. This confirms the complexity of drought tolerance breeding as this makes performance ranking difficult [12]. However, the significant high and moderate positive correlations observed between greenhouse and field environments after subdividing them along water regimes suggest that the two screening environments had almost similar discriminating abilities. This validates the ranking of genotypes within water regimes across the four environments.
Trait performance inconsistence was observed between the two water regimes. That is, combined principal component biplot revealed that RL, SEN, PC and ASI were more discriminating under drought conditions while EPP, GY, CC, Gs and DA were more discriminating under non-stressed conditions. Similarly, variables Gs, GY, EPP, DA and CC had higher heritability and genotypic variance estimates under optimum conditions than under drought conditions whilst the opposite pattern was observed for ASI, SEN, PC and RL (Table 2). In this regard, our findings concur with [32], who reported a decline in the genotypic variances for GY and EPP whilst that of ASI increased under drought conditions. This inconsistency justifies the importance of using a combination of multi-traits when screening germplasm for contrasting growing conditions [33]. This also suggests the need of separating the breeding programs to target different growing conditions in which different secondary traits would be utilized for selection. South Africa, like most SSA countries, has mixed growing conditions; therefore, separating the breeding target environments would be ideal.
The low heritability and genotypic variance estimates exhibited by GY under drought stress agree with findings by some of the previous researchers [34,35]. The observed yield loss (51.2%) due to drought stress was lower than the 81% reported by [36] who attributed greater variation under drought stress to kernel number. In this study, greater variation can be attributed to EPP, RL, Gs, SEN and PC under drought conditions, and EPP, Gs and CC under non-stressed conditions. Stomatal conductance was one of the traits that consistently accounted for greater variation under both conditions. This coupled with having a relative efficiency greater than unity suggests that Gs can be effectively used as selection proxy for GY [13]. This concurs with [37], who reported Gs as the major physiological trait that can effectively discriminate among genotypes between drought tolerant and susceptible plant genotypes. However, its low correlation with GY under non-stressed conditions reduces its effective utilization as an indirect selection criterion for production under optimum conditions.
The EPP and ASI are by far the most applied traits in maize drought tolerance studies [21,33,38]. In the current study, EPP was one of the largest contributors to the total genetic variation as demonstrated by high heritability and genotypic variance estimates under both drought stress and optimum conditions. Furthermore, by having higher discriminatory power as indicated by a longer PCA vector and high correlation with GY under both conditions confirms that EPP is an important trait in maize drought tolerance studies as reported by other researchers [9,36]. This, in addition to having a relative efficiency value greater than a unity justifies the use of EPP in indirect selection for GY. Despite having a moderate correlation with GY and moderate to high heritability estimates under both conditions, the effective use of ASI in indirect selection for GY would be limited by having a relative efficiency value of less than a unity. This is contrary to the findings by [32,39], who reported a relative efficiency of indirect selection for ASI, which was greater than a unity. However, it should be noted that although ASI did not demonstrate to be an ideal trait for indirect selection for GY, it could still be utilized in drought tolerant maize breeding by virtue of having moderate correlation with GY and moderate to high heritability estimates.
The observed significant correlations between GY and photosynthesis related traits such as SEN, RL, CC and Gs confirms the importance of photosynthesis for maize yield [40,41]. Leaf senescence and RL had relative efficiency values of greater than unity under drought and therefore can be used in indirect selection for GY. This concurs with [42] who found delayed leaf senescence to be useful in indirectly selecting for GY in maize under drought conditions. Moderate correlation between PC and GY coupled with high heritability estimate and relative efficiency of greater than unity under drought conditions, infers that genotypes that exhibited high PC under drought stress can be selected as drought tolerant. This supports the claim that under drought conditions proline is released to effect plant cell osmotic adjustments which helps to conserve cell turgor [17,43]. In a related study, [44] reported an increase in PC of 47% and 114% after exposing wheat genotypes to reproductive and grain filling drought stresses, respectively. However, lack of high correlation between PC and GY under non-stressed conditions hinders its effective use as a selection proxy for GY for optimum production.
Although this study did not investigate the effects of water regime, environment and the interaction of genotype and environment on BCC, there is enough evidence in literature that provitamin A content cannot be influenced by genotype and environment interaction but can be affected by the environment [45,46,47]. This makes selection for provitamin A an easy task. Furthermore, in their studies, [47] and [48] reported no significant correlation between GY and BCC, indicating that the two key traits can be improved simultaneously. The maximum BCC of 4.22 μg g−1 observed in this study was lower than 13.22 μg g−1 reported by [2]. This difference could be attributed to the natural superiority of temperate maize, which was studied by the later, over the its tropical counterpart [49].

5. Conclusions

This study showed that BCC, and the morphophysiological and biochemical traits applied in the screening of provitamin-A inbred lines for drought tolerance were effective in discriminating among the evaluated genotypes. There was considerably high genetic variation among the provitamin A genotypes under study that can be utilized when breeding for drought tolerance. The study also demonstrated that EPP, Gs, RL, SEN and PC can be effectively used in indirect selection of GY under drought-stressed conditions whilst EPP, Gs, and CC were ideal traits for GY indirect selection under non-stressed conditions. By having more secondary traits with a relative efficiency greater than unity under drought stress than under non-stressed, the study confirmed that indirect selection would be more useful than direct selection under drought conditions where GY exhibited low heritability and genotypic variance estimates. Consequently, based on BCC >1.5 μg g−1, which was greater than that of ordinary maize and the ranking for STI values, 30 inbred lines were selected to be utilized in developing drought tolerant provitamin A maize varieties.

Supplementary Materials

The following are available online at https://www.mdpi.com/2073-4395/9/11/692/s1, Table S1: List of maize inbred lines used in the study, Table S2: Monthly weather data during the greenhouse trials (Env & Env2) at UKZN and field trials (Env3 and Env4) at Ukulinga and Makhatini research stations in South Africa, Table S3: Mean performance of all the genotypes evaluated under drought (S) and non-stressed (W) conditions across four environments ranked by the selection index (SI) values, Table S4: Pearson’s correlation coefficients (r) describing association of four environments grouped according to water regimes, Table S5: Genetic correlation describing association of traits under S (lower diagonal) and W (upper diagonal) conditions.

Author Contributions

Conceptualization, A.K. and J.S.; Data curation, A.K. and C.M.; Formal analysis, A.K., C.M., and S.T.; Funding acquisition, J.S.; Investigation, A.K.; Methodology, A.K., J.S., C.M. and S.T.; Project administration, J.S.; Supervision, J.S. and R.Z.; Validation, A.K., J.S., R.Z., C.M. and S.T.; Writing—original draft, A.K. Writing—review & editing, A.K., J.S., R.Z., C.M. and S.T.

Funding

This research was funded by Alliance for a Green Revolution in Africa (AGRA) grant number 2014 PASS 013, The World Academy of Science (TWAS) and the National Research Foundation (NRF) of South Africa grant number SFH150914142525.

Acknowledgments

The authors would like to thank Andile Mshengu for administrative duties. CIMMYT and IITA are also acknowledged for providing the germplasm.

Conflicts of Interest

The authors declare no conflict of interest.

References

  1. Thurnham, D. Vitamin A and carotenoids. In Essentials of Human Nutrition; Mann, J., Truswell, A.S., Eds.; Oxfrd University Press: Oxford, UK, 2012; pp. 191–216. [Google Scholar]
  2. Harjes, C.E.; Rocheford, T.R.; Bai, L.; Brutnell, T.P.; Kandianis, C.B.; Sowinski, S.G.; Stapleton, A.E.; Vallabhaneni, R.; Williams, M.; Wurtzel, E.T.; et al. Natural Genetic Variation in Lycopene Epsilon Cyclase Tapped for Maize Biofortification. Science 2008, 319, 330–333. [Google Scholar] [CrossRef]
  3. Andersson, M.; Saltzman, A.; Singh Virk, P.; Pfeiffer, W. Progress update: Crop development of biofortified staple food crops under HarvestPlus. Afr. J. Food Agric. Nutr. Dev. 2017, 17, 11905–11935. [Google Scholar] [CrossRef]
  4. Bouis, H.E.; Saltzman, A. Improving nutrition through biofortification: A review of evidence from HarvestPlus, 2003 through 2016. Glob. Food Secur. 2017, 12, 49–58. [Google Scholar] [CrossRef]
  5. Magorokosho, C.; Tongooona, P. Selection for Drought Tolerance in Two Tropical Maize Populations. Afr. Crop Sci. J. 2003, 11, 151–161. [Google Scholar] [CrossRef]
  6. DAFF. Trends in the Agricultural Sector; Department of Agriculture, Forestry and Fisheries: Pretoria, South Africa, 2013. [Google Scholar]
  7. FAO. Southern Africa el Niño Response Plan (2016/2017); Food and Agriculture Organization of the United Nations: Rome, Italy, 2017. [Google Scholar]
  8. Lu, Y.; Hao, Z.; Xie, C.; Crossa, J.; Araus, J.-L.; Gao, S.; Vivek, B.S.; Magorokosho, C.; Mugo, S.; Makumbi, D.; et al. Large-scale screening for maize drought resistance using multiple selection criteria evaluated under water-stressed and well-watered environments. Field Crop. Res. 2011, 124, 37–45. [Google Scholar] [CrossRef]
  9. Almeida, G.D.; Nair, S.; Borém, A.; Cairns, J.; Trachsel, S.; Ribaut, J.-M.; Bänziger, M.; Prasanna, B.M.; Crossa, J.; Babu, R. Molecular mapping across three populations reveals a QTL hotspot region on chromosome 3 for secondary traits associated with drought tolerance in tropical maize. Mol. Breed. 2014, 34, 701–715. [Google Scholar] [CrossRef] [PubMed] [Green Version]
  10. Blum, A. Phenotyping and Selection. In Plant Breeding for Water-Limited Environments; Springer: New York, NY, USA, 2011; pp. 153–216. [Google Scholar]
  11. Bänziger, M.; Edmeades, G.; Lafitte, H. Selection for drought tolerance increases maize yields across a range of nitrogen levels. Crop Sci. 1999, 39, 1035–1040. [Google Scholar] [CrossRef]
  12. Betrán, F.J.; Beck, D.; Bänziger, M.; Edmeades, G.O. Secondary traits in parental inbreds and hybrids under stress and non-stress environments in tropical maize. Field Crop. Res. 2003, 83, 51–65. [Google Scholar] [CrossRef]
  13. Falconer, D.S. Introduction to Quantitative Genetics, 2nd edn London; Longman: London, UK, 1981. [Google Scholar]
  14. Edmeades, G. Progress in Achieving and Delivering Drought Tolerance in Maize—An Update; ISAAA: Ithaca, NY, USA, 2013; p. 130. [Google Scholar]
  15. Yang, S.; Vanderbeld, B.; Wan, J.; Huang, Y. Narrowing Down the Targets: Towards Successful Genetic Engineering of Drought-Tolerant Crops. Mol. Plant 2010, 3, 469–490. [Google Scholar] [CrossRef] [PubMed]
  16. Helander, J.D.M.; Vaidya, A.S.; Cutler, S.R. Chemical manipulation of plant water use. Bioorganic Med. Chem. 2016, 24, 493–500. [Google Scholar] [CrossRef] [Green Version]
  17. Shao, H.-B.; Chen, X.-Y.; Chu, L.-Y.; Zhao, X.-N.; Wu, G.; Yuan, Y.-B.; Zhao, C.-X.; Hu, Z.-M. Investigation on the relationship of proline with wheat anti-drought under soil water deficits. Colloids Surf. B Biointerfaces 2006, 53, 113–119. [Google Scholar] [CrossRef]
  18. Vendruscolo, E.C.G.; Schuster, I.; Pileggi, M.; Scapim, C.A.; Molinari, H.B.C.; Marur, C.J.; Vieira, L.G.E. Stress-induced synthesis of proline confers tolerance to water deficit in transgenic wheat. J. Plant Physiol. 2007, 164, 1367–1376. [Google Scholar] [CrossRef] [PubMed]
  19. Zegaoui, Z.; Planchais, S.; Cabassa, C.; Djebbar, R.; Belbachir, O.A.; Carol, P. Variation in relative water content, proline accumulation and stress gene expression in two cowpea landraces under drought. J. Plant Physiol. 2017, 218, 26–34. [Google Scholar] [CrossRef] [PubMed]
  20. Zhang, M.; Wang, L.-F.; Zhang, K.; Liu, F.-Z.; Wan, Y.-S. Drought-induced responses of organic osmolytes and proline metabolism during pre-flowering stage in leaves of peanut (Arachis hypogaea L.). J. Integr. Agric. 2017, 16, 2197–2205. [Google Scholar] [CrossRef]
  21. Bänzinger, M.; Edmeades, G.O.; Beck, D.; Bellon, M. Breeding for Drought and Nitrogen Stress Tolerance in Maize: From Theory to Practice; CIMMYT: Mexico City, Mexico, 2000. [Google Scholar]
  22. Menkir, A.; Liu, W.; White, W.S.; Maziya-Dixon, B.; Rocheford, T. Carotenoid diversity in tropical-adapted yellow maize inbred lines. Food Chem. 2008, 109, 521–529. [Google Scholar] [CrossRef]
  23. Bates, L.S.; Waldren, R.P.; Teare, I.D. Rapid determination of free proline for water-stress studies. Plant Soil 1973, 39, 205–207. [Google Scholar] [CrossRef]
  24. R Development Core Team. R: A Language and Environment for Statistical Computing; R Foundation for Statistical Computing: Vienna, Austria, 2018. [Google Scholar]
  25. Fernandez, G.C. Effective Selection Criteria for Assessing Plant Stress Tolerance. In Proceedings of the International Symposium on Adaptation of Vegetables and Other Food Crops in Temperature and Water Stress, Shanhua, Taiwan, 13–16 August 1992; pp. 257–270. [Google Scholar]
  26. Allard, R. Principles of Plant Breeding; Wiley: New York, NY, USA, 1999. [Google Scholar]
  27. Robinson, H.F.; Comstock, R.E.; Harvey, P.H. Estimates of heritability and the degree of dominance in corn. Agron. J. 1949, 41, 353–359. [Google Scholar] [CrossRef]
  28. Alvarado, G.; López, M.; Vargas, M.; Pacheco, Á; Rodríguez, F.; Burgueño, J.; Crossa, J. META-R (Multi Environment Trail Analysis with R for Windows) Version 6.04 CIMMYT Research Data & Software Repository Network: 2019. Available online: https://data.cimmyt.org/dataset.xhtml?persistentId=hdl:11529/10201 (accessed on 20 August 2019).
  29. Mukaka, M.M. Statistics Corner: A guide to appropriate use of Correlation coefficient in medical research. Malawi Med. J. 2012, 24, 69–71. [Google Scholar]
  30. Pixley, K.; Rojas, N.P.; Babu, R.; Mutale, R.; Surles, R.; Simpungwe, E. Biofortification of maize with provitamin A carotenoids. In Carotenoids in Human Nutrition and Health; Tanumihardjo, S.A., Ed.; Springer Science and Business Media: New York, NY, USA, 2013. [Google Scholar]
  31. Wen, W.; Araus, J.L.; Shah, T.; Cairns, J.; Mahuku, G.; Bänziger, M.; Torres, J.L.; Sánchez, C.; Yan, J. Molecular Characterization of a Diverse Maize Inbred Line Collection and its Potential Utilization for Stress Tolerance Improvement. Crop Sci. 2011, 51, 2569. [Google Scholar] [CrossRef]
  32. Bolaños, J.; Edmeades, G.O. The importance of the anthesis-silking interval in breeding for drought tolerance in tropical maize. Field Crop. Res. 1996, 48, 65–80. [Google Scholar] [CrossRef]
  33. Araus, J.L.; Serret, M.D.; Edmeades, G. Phenotyping maize for adaptation to drought. Front. Physiol. 2012, 3. [Google Scholar] [CrossRef] [PubMed]
  34. Bänziger, M.; Cooper, M. Breeding for low input conditions and consequences for participatory plant breeding examples from tropical maize and wheat. Euphytica 2001, 122, 503–519. [Google Scholar] [CrossRef]
  35. Betrán, F.J.; Beck, D.; Bänziger, M.; Edmeades, G.O. Genetic Analysis of Inbred and Hybrid Grain Yield under Stress and Nonstress Environments in Tropical Maize. Crop Sci. 2003, 43, 807–817. [Google Scholar] [CrossRef]
  36. Cairns, J.E.; Sanchez, C.; Vargas, M.; Ordoñez, R.; Araus, J.L. Dissecting Maize Productivity: Ideotypes Associated with Grain Yield under Drought Stress and Well-watered Conditions. J. Integr. Plant Biol. 2012, 54, 1007–1020. [Google Scholar] [CrossRef] [PubMed]
  37. Grzesiak, M.T.; Grzesiak, S.; Skoczowski, A. Changes of leaf water potential and gas exchange during and after drought in triticale and maize genotypes differing in drought tolerance. Photosynthetica 2006, 44, 561–568. [Google Scholar] [CrossRef]
  38. Campos, H.; Cooper, M.; Edmeades, G.O.; Löffler, C.; Schussler, J.R.; Ibañez, M. Changes in drought tolerance in maize associated with fifty years of breeding for yield in the U.S. corn belt. Maydica 2006, 51, 369–381. [Google Scholar]
  39. Ziyomo, C.; Bernardo, R. Drought tolerance in maize: Indirect selection through secondary traits versus genomewide selection. Crop Sci. 2013, 53, 1269–1275. [Google Scholar] [CrossRef]
  40. Cabrera-Bosquet, L.; Molero, G.; Nogués, S.; Araus, J.L. Water and nitrogen conditions affect the relationships of Δ13C and Δ18O to gas exchange and growth in durum wheat. J. Exp. Bot. 2009, 60, 1633–1644. [Google Scholar] [CrossRef]
  41. Vadez, V. Root hydraulics: The forgotten side of roots in drought adaptation. Field Crop. Res. 2014, 165, 15–24. [Google Scholar] [CrossRef] [Green Version]
  42. Zheng, H.J.; Wu, A.Z.; Zheng, C.C.; Wang, Y.F.; Cai, R.; Shen, X.F.; Xu, R.R.; Liu, P.; Kong, L.J.; Dong, S.T. QTL mapping of maize (Zea mays) stay-green traits and their relationship to yield. Plant Breed. 2009, 128, 54–62. [Google Scholar] [CrossRef]
  43. Marcińska, I.; Czyczyło-Mysza, I.; Skrzypek, E.; Filek, M.; Grzesiak, S.; Grzesiak, M.T.; Janowiak, F.; Hura, T.; Dziurka, M.; Dziurka, K.; et al. Impact of osmotic stress on physiological and biochemical characteristics in drought-susceptible and drought-resistant wheat genotypes. Acta Physiol. Plant. 2013, 35, 451–461. [Google Scholar] [CrossRef]
  44. Moayedi, A.A.; Nasrulhaq-Boyce, A.; Tavakoli, H. Application of physiological and biochemical indices for screening and assessment of drought tolerance in durum wheat genotypes. Aust. J. Crop Sci. 2011, 5, 1014–1018. [Google Scholar]
  45. Menkir, A.; Maziya-Dixon, B. Influence of genotype and environment on beta-carotene content of tropical yellow-endosperm maize genotypes [Zea mays L.; Nigeria]. Maydica 2004, 49, 313–318. [Google Scholar]
  46. Pfeiffer, W.H.; McClafferty, B. HarvestPlus: Breeding Crops for Better Nutrition. Crop Sci. 2007, 47, S-88–S-105. [Google Scholar] [CrossRef]
  47. Suwarno, W.B.; Pixley, K.V.; Palacios-Rojas, N.; Kaeppler, S.M.; Babu, R. Formation of Heterotic Groups and Understanding Genetic Effects in a Provitamin A Biofortified Maize Breeding Program. Crop Sci. 2014, 54, 14. [Google Scholar] [CrossRef]
  48. Egesel, C.O.; Wong, J.C.; Lambert, R.J.; Rocheford, T.R. Combining Ability of Maize Inbreds for Carotenoids and Tocopherols. Crop Sci. 2003, 43, 818–823. [Google Scholar] [CrossRef]
  49. Menkir, A.; Rocheford, O.; Maziya-Dixon, B.; Tanumihardjo, S. Exploiting natural variation in exotic germplasm for increasing provitamin-A carotenoids in tropical maize. Euphytica 2015, 205, 203–217. [Google Scholar] [CrossRef]
Figure 1. A combined principal component biplot showing genotypes clustering under stress conditions and well-watered conditions. ASI—anthesis-silking interval, CC—chlorophyll content, DA—days to anthesis, EPP—ears per plant, GY—grain yield, Gs—stomatal conductance, RL—leaf rolling, SEN—leaf senescence, PC—proline content, SG—genotypes under water stress conditions, WG -genotypes grown under optimum conditions.
Agronomy 09 00692 g001
Table 1. Mean squares and significant tests after combined analysis of variance for nine morphophysiological traits of 50 inbred lines.
SOVDFGYASIDAEPPRLGsSENCCPCSOVDFBCC
Rep10.33 ***0.02 *1.620.245.283370.5128.1311.05570.12Gen452.758 ***
Rep.Bloc80.37 ***9.20 ns156.74 ***0.19346.60 ***10,845.54 ***239.00 ***35.05 **2076.57Error920.006
Gen491.70 ***124.35 ***487.55 ***2.23 ***1737.56 ***17,231.90 ***1993.14 ***131.57 ***6212.13 ***
Env324.22 ***10.71 ***54.82 ***5.04 ***516.00 ***13,750.30 *1472.46 ***495.93 ***889.32
WR1142.85 ***8685.62 ***6339.38 ***63.85 ***287,471.53 ***20,372,674.06 ***297,606.12 ***88,914.06 ***2,756,772.93 ***
Gen.Env1470.53 ***23.21 ***117.80 ***0.48 ***357.14 ***10,469.86 ***231.03 ***31.12 ***1517.61 ***
Gen.WR490.28 ***102.51 ***281.83 ***0.92 ***1715.20 ***21,625.12 ***1847.35 ***94.69 ***6224.34 ***
Env.WR313.07 ***97.87 ***89.210.47670.90 ***11,839.37 ***1964.46 ***284.66 ***106.78
Gen.Env.WR1470.22 ***18.13 ***119.03 ***0.43 ***341.42 ***10,995.21 ***215.09 ***33.01 ***1506.32 ***
Error3910.011.999.360.2010.231789.4429.286.92468.59
SOV—Source of Variation, Rep—Replication, Bloc—incomplete block, Gen—genotype, Env—environment, WR—water regime, DF—degrees of freedom, GY—grain yield, ASI—anthesis-silking interval, DA—days to anthesis, EPP—ears per plant, RL—leaf rolling, SEN—leaf senescence, Gs—stomatal conductance, CCI—chlorophyll content index, PC—proline content, BCC—β-carotene content, * p < 0.05, ** p < 0.01, *** p < 0.001 and ns, not significant.
Table 2. Mean performance of the top 15 and bottom 5 provitamin A maize inbred lines with >1.5 μg g−1 BCC and ranked in descending order of STI values.
GYASIDAEPPRLGsSGCCPC
GenSTIBCCSWSWSWSWSWSWSWSWSW
Top 10
240.772.731.002.276.880.7577.6379.001.882.7527.502.0026.03420.6331.2511.2519.1844.45148.9333.20
10.754.221.002.2312.752.3874.8871.251.632.5027.501.6326.60330.1137.5010.0022.2141.93175.8224.88
80.702.261.002.084.752.1373.6378.382.002.1312.501.8835.53353.6633.7513.7520.9937.17193.5325.57
170.691.590.992.074.002.2580.1374.501.882.2526.253.2540.64413.5826.2510.0019.2344.53178.1140.96
420.682.640.952.125.250.2553.8871.752.502.6313.753.5024.12406.8527.5013.7524.3339.06165.5134.52
380.642.760.912.080.501.3863.5071.382.382.7530.002.5020.14347.0147.5012.5016.7343.74140.9828.30
440.602.530.941.885.501.3858.0064.882.132.0016.253.0037.85361.0230.0010.0025.1935.24213.1525.96
70.582.611.001.734.632.2579.2580.752.002.3818.753.8834.79376.4325.0010.0019.7940.66205.9835.33
390.581.690.911.906.881.7562.0064.631.752.2521.254.0017.52292.6043.7510.0021.7339.95175.9723.09
250.581.670.852.014.752.6379.5075.131.752.1322.502.8844.85273.2727.5011.2523.0138.75184.8928.27
Bottom 5
210.341.970.751.3211.381.1378.6381.251.252.1378.754.0066.66384.1371.2512.5016.3241.94103.2131.60
320.312.920.811.1512.132.8877.5074.131.002.5066.253.8892.69376.4085.0012.5012.1936.6289.5635.81
190.311.810.751.2112.383.5074.8878.001.132.1358.752.5073.76349.2981.2511.2515.1438.61100.7727.59
120.272.880.701.1610.631.6375.6377.881.381.6358.752.1366.85314.5566.2513.7516.0438.04139.4728.92
200.233.390.690.97-9.880.8880.8872.001.131.7587.503.5068.86338.5188.7512.5010.0734.2095.9828.24
Mean 2.050.881.728.561.9769.4075.031.682.2440.953.0449.78368.9450.1811.6018.8039.88149.2331.83
CV 3.657.875.3317.9663.751.935.5120.6923.4010.8527.361.3816.1113.2626.784.289.0920.2413.45
LSD 0.120.070.091.521.241.324.080.340.524.380.820.6858.606.563.060.793.5829.794.22
Gen—Genotype/inbred line, STI—Stress-Tolerant Index, GY—grain yield, BCC—β-carotene content; ASI—anthesis-silking interval, DA—days to anthesis, EPP—number of ears per plant, SEN—leaf senescence, RL—leaf rolling, Gs—stomatal conductance, CC—chlorophyll content, PC—proline content, CV—coefficient of variation, LSD—least significant difference, S—Water stress conditions and W—well-watered condition.
Table 3. Variance components and heritability of measured morphophysiological traits.
Variance ComponentsTraits
GYASIDAEPPRLGsSENCCPC
Non-stressed conditions (W)
Gen ( δ 2 g )0.0980.18973.1220.1890.074506.7780.65618.2357.753
Env ( δ 2 e )0.2380.0250.0000.0250.2140.3850.3231.4710.000
Gen.Env ( δ 2 g e )0.2321.05251.8080.1380.9103.8873.09416.00878.695
Error ( δ 2 )0.0120.6832.5800.1231.6180.5259.5000.71416.873
Phenotypic ( δ 2 p )0.1570.53786.3960.2390.504507.8152.61722.32629.536
Heritability (H)0.6210.3520.8460.7920.1470.9980.2510.8170.263
Stressed conditions (S)
Gen ( δ 2 g )0.09123.48712.8520.055345.544405.282424.3322.2651200.237
Env ( δ 2 e ) 0.0210.4632.2440.1274.7480.03629.5105.6850.000
Gen.Env ( δ 2 g e ) 0.41717.57869.4550.143343.6667.164194.5679.653977.106
Error ( δ 2   ) 0.2732.32830.5520.00519.50026.97148.75112.963917.053
Phenotypic ( δ 2 p )0.19328.17334.0340.091433.898410.444479.0676.2981559.145
Heritability (H)0.3980.8340.3780.6020.7960.9870.8860.3600.770
Table 4. Phenotypic correlation coefficients describing association of traits under S (lower diagonal) and W (upper diagonal) conditions.
Non-Stressed Condition (W)
Water Stressed (S) GYASIDAEPPRLGsSENCCPC
GY1−0.593 ***0.462 ***0.502 ***0.187 ***0.496 ***−0.205 **0.612 ***0.109 *
ASI−0.694 ***10.446 ***−0.520 ***−0.013−0.3070.166−0.004−0.067
DA−0.444 **0.510 **10.363 ***−0.3080.0460.1060.2670.068
EPP0.774 ***−0.711 ***−0.563 ***10.096 ***0.626 ***−0.338 ***0.324 ***0.088
RL0.446 *0.4580.2070.513 **10.1520.128−0.0610.262
Gs−0.566 *0.333 *0.232−0.573 ***0.538***1−0.120 ***0.246 *0.492
SEN−0.423 ***0.3650.041−0.486 **0.334 **0.584 **1−0.250 **0.038 *
CC0.406 ***−0.209−0.240.455 ***−0.466 *−0.390 *−0.396 ***1−0.188 *
PC0.317 ***0.374−0.0760.415 ***0.472 ***−0.2350.489 ***−0.356 *1
GY—grain yield, ASI—anthesis-silking interval, CC—chlorophyll content, DA—days to anthesis, EPP—ears per plant, Gs—stomatal conductance, RL—leaf rolling, PC -proline content, SEN—leaf senescence, *,**,*** indicate level of significance of the correlation at p < 0.05, p < 0.01 and p < 0.001, respectively.
Table 5. Genetic correlations and the relative efficiency of indirect selection through secondary traits for grain yield improvement under drought stress and optimum conditions.
Secondary TraitsGenetic Correlation (rg) with GYRelative Efficiency of Indirect Selection
StressedNon-StressedStressedNon-Stressed
Anthesis silking interval 0.352 *0.19 ns0.5100.143
Days to anthesis 0.146 ***0.163 ns0.1420.190
Ears per plant 0.909 ***0.912 ***1.1181.030
Leaf Rolling 0.934 ***0.334 ns1.3210.163
Stomatal conductance 0.715 ***0.974 ***1.1261.235
Leaf senescence0.918 ***0.842 ***1.3700.535
Chlorophyll content 0.738 ***0.996 ***0.7021.142
Proline content0.829 ***0.018 ns1.1530.012
* p < 0.05, *** p < 0.001, ns, not significant.

