Assessment of Heterosis Based on Genetic Distance Estimated Using SNP in Common Wheat


Abstract
:1. Introduction
2. Materials and Methods
2.1. Experimental Material
2.2. Field Trial
2.3. Character Investigation and Data Collection
2.4. DNA Extraction and SNP Genotyping
2.5. Quality Control of SNP Data
2.6. Statistical Analysis
3. Results and Analysis
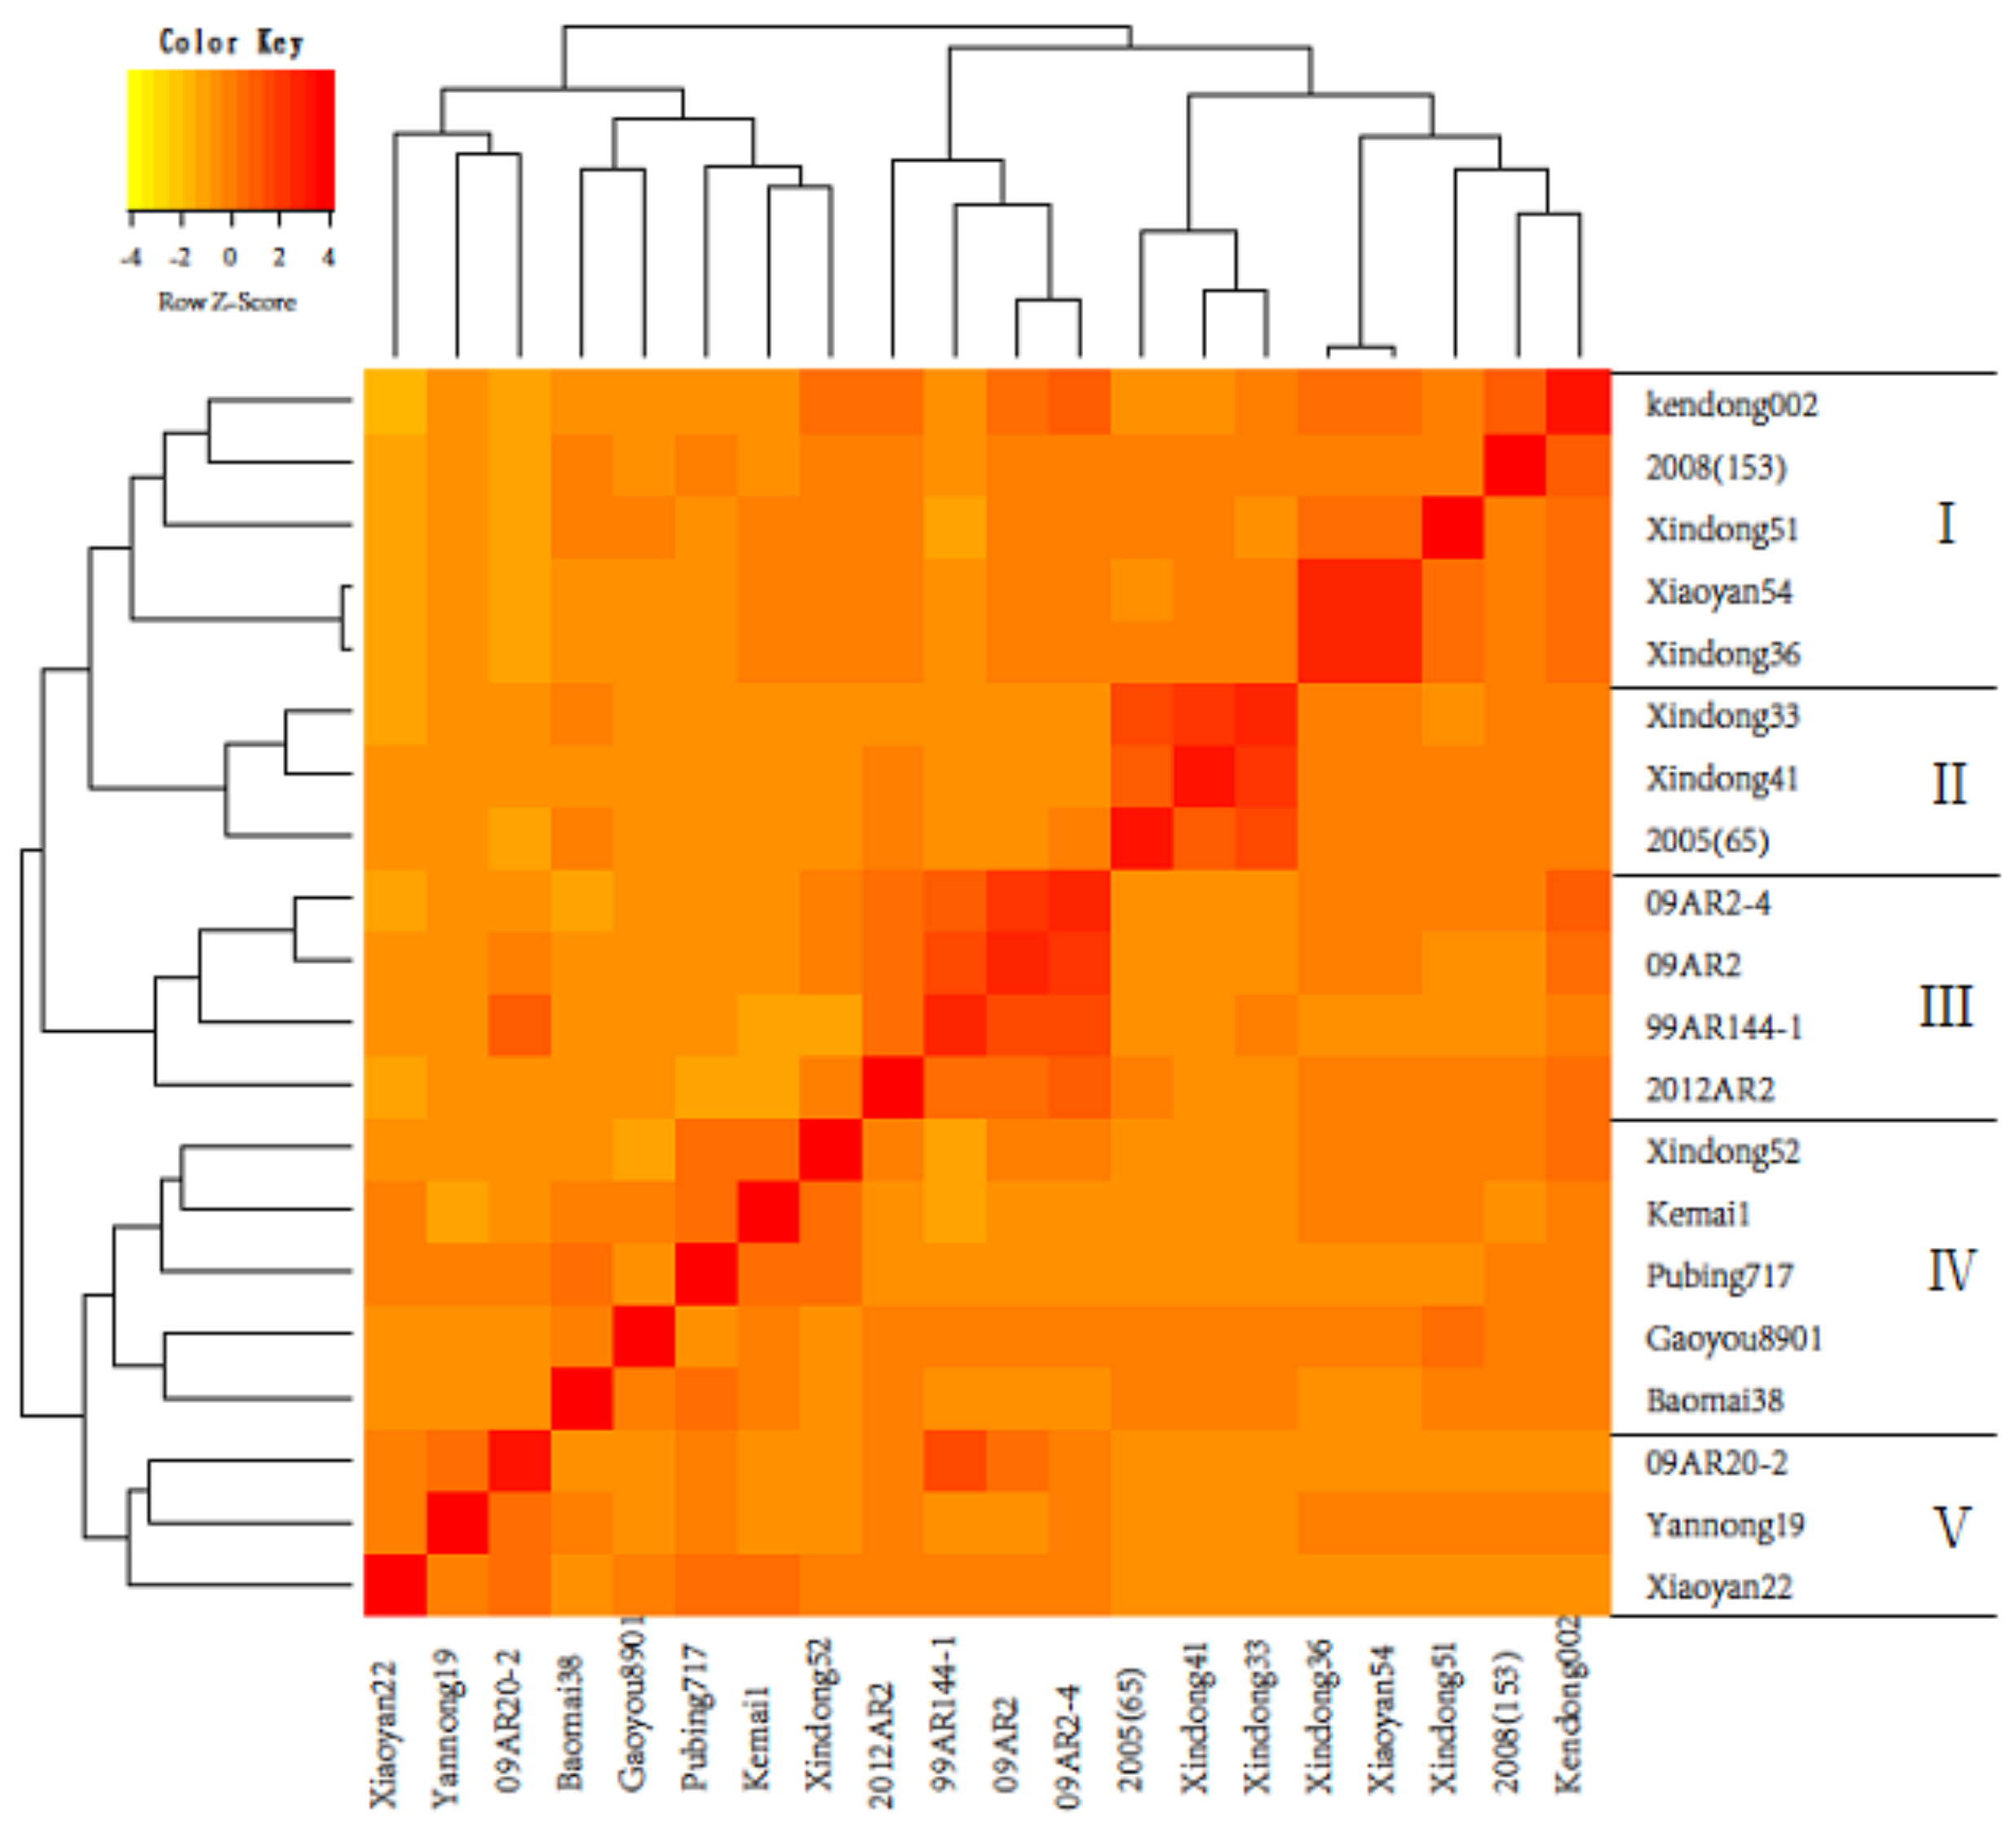
3.1. Estimation of Genetic Distance and Clustering of Parents
3.2. Yield Performance of Parents and F1 Hybrids
3.3. Correlation of Yield-Related Traits between Parents and F1 Hybrids
3.4. Analysis of Mid-Parent and High-Parent Heterosis of Yield in F1 Generation
3.5. Correlation between Genetic Distance and Hybrid Performance
4. Discussion
5. Conclusions
Author Contributions
Funding
Conflicts of Interest
References
- Singh, S.P.; Srivastava, R.; Kumar, J. Male sterility systems in wheat and opportunities for hybrid wheat development. Acta. Physiol. Plant. 2015, 37, 1713. [Google Scholar] [CrossRef]
- Freeman, G.F. The heredity of quantitative characters in wheat. Genetics 1919, 4, 1–93. [Google Scholar] [PubMed]
- Liu, H.; Peng, C.; Zhan, K.; Qiang, L.; Zhuo, G.; Guo, X.; Feng, D.; Yang, W.; Liu, D.; Hu, S. Comparative analysis of mitochondrial genomes between a wheat K-type cytoplasmic male sterility (CMS) line and its maintainer line. BMC Genomics 2011, 12, 1–14. [Google Scholar] [CrossRef] [PubMed]
- Song, Y.; Wang, J.; Zhang, G.; Zhao, X.; Zhang, P.; Niu, N.; Ma, S. Isolation and characterization of a wheat F8-1 homolog required for physiological male sterility induced by a chemical hybridizing agent (CHA) SQ-1. Euphytica 2015, 205, 707–720. [Google Scholar] [CrossRef]
- Kempe, K.; Gils, M. Pollination control technologies for hybrid breeding. Mol. Breeding. 2011, 27, 417–437. [Google Scholar] [CrossRef]
- Whitford, R.; Fleury, D.; Reif, J.C.; Garcia, M.; Okada, T.; Korzun, V.; Langridge, P. Hybrid breeding in wheat: Technologies to improve hybrid wheat seed production. J. Exp. Bot. 2013, 64, 5411–5428. [Google Scholar] [CrossRef] [PubMed]
- Zhang, A.M.; Liu, D.C.; Nie, X.l.; Guo, X.l.; Huang, T.C. Hybrid wheat breeding strategy. Rev. China Agr. Sci. Tech. 2002, 4, 42–48. [Google Scholar]
- Zhao, C.P. Status and trends of hybrid wheat research in China. J. Agr. Sci. Tech. 2010, 12, 5–8. [Google Scholar]
- Bhullar, G.S.; Gill, K.S.; Khehra, A.S. Combining ability analysis over F1 -F5 generations in diallel crosses of bread wheat. Theor. Appl. Genet. 1979, 55, 77–80. [Google Scholar] [CrossRef] [PubMed]
- Kalhoro, F.A.; Rajpar, A.A.; Kalhoro, S.A.; Mahar, A.; Ali, A.; Otho, S.A.; Soomro, R.N.; Ali, F.; Baloch, Z.A. Heterosis and combing ability in f1 population of hexaploid wheat (L.). AM J. Plant Sci. 2015, 6, 1011–1026. [Google Scholar] [CrossRef]
- Borghi, B.; Perenzin, M. Diallel analysis to predict heterosis and combining ability for grain yield, yield components and bread-making quality in bread wheat (T. aestivum). Theor. Appl. Genet. 1994, 89, 975–981. [Google Scholar] [CrossRef] [PubMed]
- Sharma, R.C.; Smith, E.L.; Mcnew, R.W. Combining ability analysis for harvest index in winter wheat. Euphytica 1991, 55, 229–234. [Google Scholar] [CrossRef]
- Shieh, G.J.; Thseng, F.S. Genetic diversity of Tainan-white maize inbred lines and prediction of single cross hybrid performance using RAPD markers. Euphytica 2002, 124, 307–313. [Google Scholar] [CrossRef] [Green Version]
- Liu, Z.Q.; Pei, Y.; Pu, Z.J. Relationship between hybrid performance and genetic diversity based on RAPD markers in wheat, Triticum aestivum L. Plant Breeding 1999, 118, 119–123. [Google Scholar] [CrossRef]
- Eivazi, A.R.; Naghavi, M.R.; Hajheidari, M.; Pirseyedi, S.M.; Ghaffari, M.R.; Mohammadi, S.A.; Majidi, I.; Salekdeh, G.H.; Mardi, M. Assessing wheat (Triticum aestivum L.) genetic diversity using quality traits, amplified fragment length polymorphisms, simple sequence repeats and proteome analysis. Ann. Appl Biol. 2008, 152, 81–91. [Google Scholar] [CrossRef] [Green Version]
- Huang, X.; Börner, A.; Röder, M.; Ganal, M. Assessing genetic diversity of wheat (Triticum aestivum L.) germplasm using microsatellite markers. Theor. Appl. Genet. 2002, 105, 699–707. [Google Scholar] [CrossRef] [PubMed]
- Salem, K.F.M.; Röder, M.S.; Börner, A. Assessing genetic diversity of Egyptian hexaploid wheat (Triticum aestivum L.) using microsatellite markers. Genet. Resour. Crop Ev. 2014, 62, 1–9. [Google Scholar] [CrossRef]
- Lander, E.S. The new genomics: Global views of biology. Science 1996, 274, 536–539. [Google Scholar] [CrossRef]
- Khlestkina, E.K.; Salina, E.A. SNP markers: Methods of analysis, ways of development, and comparison on an example of common wheat. Russ. J. Genet. 2006, 42, 585–594. [Google Scholar] [CrossRef]
- Wang, S.; Wong, D.; Forrest, K.; Allen, A.; Chao, S.; Huang, B.E.; Maccaferri, M.; Salvi, S.; Milner, S.G.; Cattivelli, L. Characterization of polyploid wheat genomic diversity using a high-density 90,000 single nucleotide polymorphism array. Plant Biotechnol. J. 2014, 12, 787–796. [Google Scholar] [CrossRef]
- Cavanagh, C.R.; Chao, S.; Wang, S.; Huang, B.E.; Stephen, S.; Kiani, S.; Forrest, K.; Saintenac, C.; Brownguedira, G.L.; Akhunova, A. Genome-wide comparative diversity uncovers multiple targets of selection for improvement in hexaploid wheat landraces and cultivars. PNAS 2013, 110, 8057–8062. [Google Scholar] [CrossRef] [PubMed] [Green Version]
- Wu, X.; Li, Y.; Shi, Y.; Song, Y.; Wang, T.; Huang, Y.; Li, Y. Fine genetic characterization of elite maize germplasm using high-throughput SNP genotyping. Theor. Appl. Genet. 2014, 127, 621–631. [Google Scholar] [CrossRef] [PubMed]
- Sang, S.F.; Wang, H.; Mei, D.S.; Liu, J.; Fu, L.; Wang, J.; Wang, W.X.; Hu, Q. Correlation analysis between heterosis and genetic distance evaluated by genome-wide snp chip in brassica napus. Sci. Agr. Sin. 2015, 48, 2469–2478. [Google Scholar]
- Riedelsheimer, C.; Czedik-Eysenberg, A.; Grieder, C.; Lisec, J.; Technow, F.; Sulpice, R.; Altmann, T.; Stitt, M.; Willmitzer, L.; Melchinger, A.E. Genomic and metabolic prediction of complex heterotic traits in hybrid maize. Nat. Genet. 2012, 44, 217–220. [Google Scholar] [CrossRef] [PubMed]
- Zhao, Y.; Zeng, J.; Fernando, R.; Reif, J.C. Genomic prediction of hybrid wheat performance. Crop Sci. 2013, 53, 802–810. [Google Scholar] [CrossRef]
- Corbellini, M.; Perenzin, M.; Accerbi, M.; Vaccino, P.; Borghi, B. Genetic diversity in bread wheat, as revealed by coefficient of parentage and molecular markers, and its relationship to hybrid performance. Euphytica 2002, 123, 273–285. [Google Scholar] [CrossRef]
- Inghelandt, D.V.; Melchinger, A.E.; Lebreton, C.; Stich, B. Population structure and genetic diversity in a commercial maize breeding program assessed with SSR and SNP markers. Theor. Appl. Genet. 2010, 120, 1289–1299. [Google Scholar] [CrossRef] [Green Version]
- Griffing, B.; Lindstrom, E.W. A study of the combining abilities of corn inbreds having varying proportions of corn belt and non-corn belt germ plasm1. Agron. J. 1954, 46, 545–552. [Google Scholar] [CrossRef]
- Chao, S.; Zhang, W.; Akhunov, E.; Sherman, J.; Ma, Y.; Luo, M.C.; Dubcovsky, J. Analysis of gene-derived SNP marker polymorphism in US wheat (Triticum aestivum L.) cultivars. Mol. Breed. 2009, 23, 23–33. [Google Scholar] [CrossRef]
- Somers, D.J.; Kirkpatrick, R.; Moniwa, M.; Walsh, A. Mining single-nucleotide polymorphisms from hexaploid wheat ESTs. Génome 2003, 46, 431–437. [Google Scholar] [CrossRef]
- Ren, J.; Sun, D.; Chen, L.; You, F.M.; Wang, J.; Peng, Y.; Nevo, E.; Sun, D.; Luo, M.C.; Peng, J. Genetic diversity revealed by single nucleotide polymorphism markers in a worldwide germplasm collection of durum wheat. Int. J. Mol. Sci. 2013, 14, 7061–7088. [Google Scholar] [CrossRef] [PubMed]
- Oliveira, H.R.; Hagenblad, J.; Leino, M.W.; Leigh, F.J.; Lister, D.L.; Penã-Chocarro, L.; Jones, M.K. Wheat in the Mediterranean revisited—tetraploid wheat landraces assessed with elite bread wheat Single Nucleotide Polymorphism markers. BMC Genet. 2014, 15, 54. [Google Scholar] [CrossRef] [PubMed]
- Krystkowiak, K.; Adamski, T.; Surma, M.; Kaczmarek, Z. Relationship between phenotypic and genetic diversity of parental genotypes and the specific combining ability and heterosis effects in wheat (Triticum aestivum L.). Euphytica 2009, 165, 419–434. [Google Scholar] [CrossRef]
- Martin, J.M. Hybrid performance in wheat as related to parental diversity. Crop Sci. 1995, 35, 104–108. [Google Scholar] [CrossRef]
- Zhang, Q.; Zhou, Z.Q.; Yang, G.P.; Xu, C.G.; Liu, K.D.; Saghai Maroof, M.A. Molecular marker heterozygosity and hybrid performance in indica and japonica rice. Theor. Appl. Genet. 1996, 93, 1218–1224. [Google Scholar] [CrossRef] [PubMed]
- Dreisigacker, S.; Melchinger, A.E.; Zhang, P.; Ammar, K.; Flachenecker, C.; Hoisington, D.; Warburton, M.L. Hybrid performance and heterosis in spring bread wheat, and their relations to SSR-based genetic distances and coefficients of parentage. Euphytica 2005, 144, 51–59. [Google Scholar] [CrossRef]


| GD | XD33 | XD36 | KD002 | XD41 | BM38 | KM1 | GY8901 | XY54 | XD51 | 08(153) | XD52 | AR144-1 | AR2-4 | 09AR2 | 12AR2 | AR20-2 | 05(65) | XY22 | PB717 |
|---|---|---|---|---|---|---|---|---|---|---|---|---|---|---|---|---|---|---|---|
| XD36 | 0.061 | ||||||||||||||||||
| KD002 | 0.059 | 0.047 | |||||||||||||||||
| XD41 | 0.019 | 0.059 | 0.062 | ||||||||||||||||
| BM38 | 0.066 | 0.074 | 0.067 | 0.069 | |||||||||||||||
| KM1 | 0.073 | 0.058 | 0.064 | 0.071 | 0.067 | ||||||||||||||
| GY8901 | 0.070 | 0.070 | 0.067 | 0.072 | 0.065 | 0.069 | |||||||||||||
| XY54 | 0.060 | 0.002 | 0.046 | 0.059 | 0.073 | 0.057 | 0.069 | ||||||||||||
| XD51 | 0.067 | 0.052 | 0.055 | 0.063 | 0.067 | 0.063 | 0.064 | 0.051 | |||||||||||
| 08(153) | 0.058 | 0.057 | 0.038 | 0.058 | 0.063 | 0.068 | 0.067 | 0.056 | 0.060 | ||||||||||
| XD52 | 0.069 | 0.055 | 0.049 | 0.067 | 0.072 | 0.050 | 0.077 | 0.054 | 0.058 | 0.059 | |||||||||
| AR144-1 | 0.064 | 0.070 | 0.060 | 0.068 | 0.073 | 0.076 | 0.070 | 0.069 | 0.074 | 0.067 | 0.076 | ||||||||
| AR2-4 | 0.064 | 0.053 | 0.035 | 0.067 | 0.072 | 0.066 | 0.068 | 0.052 | 0.059 | 0.056 | 0.053 | 0.030 | |||||||
| 09AR2 | 0.064 | 0.056 | 0.043 | 0.067 | 0.071 | 0.070 | 0.068 | 0.055 | 0.063 | 0.059 | 0.058 | 0.025 | 0.013 | ||||||
| 12AR2 | 0.066 | 0.061 | 0.048 | 0.065 | 0.070 | 0.072 | 0.070 | 0.059 | 0.064 | 0.060 | 0.056 | 0.053 | 0.042 | 0.047 | |||||
| AR20-2 | 0.073 | 0.075 | 0.075 | 0.075 | 0.076 | 0.071 | 0.079 | 0.074 | 0.080 | 0.078 | 0.070 | 0.036 | 0.060 | 0.053 | 0.066 | ||||
| 05(65) | 0.029 | 0.064 | 0.061 | 0.043 | 0.068 | 0.071 | 0.071 | 0.064 | 0.066 | 0.058 | 0.071 | 0.068 | 0.064 | 0.067 | 0.065 | 0.080 | |||
| XY22 | 0.079 | 0.084 | 0.082 | 0.079 | 0.079 | 0.065 | 0.078 | 0.083 | 0.083 | 0.077 | 0.070 | 0.072 | 0.074 | 0.073 | 0.075 | 0.065 | 0.079 | ||
| PB717 | 0.071 | 0.073 | 0.068 | 0.071 | 0.061 | 0.055 | 0.080 | 0.072 | 0.074 | 0.062 | 0.056 | 0.075 | 0.068 | 0.071 | 0.074 | 0.066 | 0.073 | 0.067 | |
| YN19 | 0.075 | 0.072 | 0.069 | 0.076 | 0.074 | 0.080 | 0.080 | 0.071 | 0.071 | 0.067 | 0.074 | 0.073 | 0.070 | 0.071 | 0.071 | 0.059 | 0.076 | 0.074 | 0.070 |
| Yield | XD52 | XD41 | AR144-1 | 08(153) | GY8901 | 05(65) | AR20-2 | YN19 | BM38 | XY22 | Female GCA |
|---|---|---|---|---|---|---|---|---|---|---|---|
| PB717 | 981.00 | 1279.50 | 1030.00 | 953.30 | 1142.00 | 1069.50 | 1147.00 | 1073.70 | 900.00 | 1000.50 | 148.69 |
| KD002 | 1184.00 | 1161.00 | 1163.50 | 953.00 | 882.00 | 1120.00 | 985.00 | 785.00 | 1005.50 | 1079.30 | 122.87 |
| KM1 | 1220.00 | 1066.00 | 866.30 | 1019.30 | 958.00 | 933.00 | 1152.70 | 880.00 | 981.30 | 1048.50 | 103.55 |
| XY54 | 1036.00 | 874.00 | 875.00 | 872.00 | 995.70 | 911.00 | 927.00 | 946.30 | 988.70 | 1035.00 | 37.11 |
| XD36 | 1020.70 | 887.30 | 913.30 | 968.70 | 892.30 | 898.70 | 1097.00 | 884.00 | 776.30 | 1003.00 | 25.17 |
| XD33 | 948.00 | 1029.00 | 974.50 | 1068.00 | 931.00 | 1002.70 | 696.00 | 1113.50 | 899.00 | 652.00 | 22.41 |
| XD51 | 837.00 | 878.00 | 1026.50 | 894.50 | 984.00 | 782.50 | 729.00 | 866.50 | 977.00 | 977.00 | −13.76 |
| 12AR2 | 978.70 | 967.70 | 895.30 | 861.30 | 766.00 | 777.70 | 934.00 | 890.50 | 835.70 | 483.70 | −69.90 |
| AR2-4 | 860.70 | 812.50 | 849.50 | 638.00 | 830.00 | 870.70 | 687.00 | 787.00 | 689.30 | 471.70 | −159.32 |
| 09AR2 | 911.70 | 854.70 | 746.30 | 773.30 | 565.30 | 530.00 | 468.00 | 574.70 | 635.00 | 862.00 | −216.86 |
| Male GCA | 89.23 | 72.42 | 25.47 | −8.41 | −17.96 | −18.97 | −26.28 | −28.43 | −39.77 | −47.28 |
| Harvest of Spikelets | Grain Number per Spike | Grain Weight per Spike | 1000-Grain Weight | Yield | |
|---|---|---|---|---|---|
| Harvest of spikelets | 1.00 | −0.16 | −0.43 | −0.36 | 0.42 |
| Grain number per spike | 1.00 | 0.78 | −0.50 | 0.63 | |
| Grain weight per spike | 1.00 | 0.14 | 0.63 | ||
| 1000-grain weight | 1.00 | −0.15 | |||
| Yield | 1.00 |
| Cultivars (Lines) | XD52 | XD41 | AR144-1 | 08(153) | GY8901 | 05(65) | AR20-2 | YN19 | BM38 | XY22 | |
|---|---|---|---|---|---|---|---|---|---|---|---|
| PB717 | MPH | −5.00 | 30.36 | 7.14 | −12.35 | 25.24 | 17.16 | 15.55 | 19.34 | −0.89 | 19.63 |
| HPH | −9.72 | 23.82 | −0.30 | −16.52 | 10.52 | 3.50 | 11.00 | 3.87 | −12.90 | −3.18 | |
| KD002 | MPH | 22.59 | 30.84 | 34.17 | −4.07 | 7.87 | 36.81 | 9.63 | −2.54 | 23.52 | 45.43 |
| HPH | 8.96 | 24.88 | 30.83 | −16.50 | 4.38 | 32.54 | 3.47 | −7.10 | 18.99 | 27.73 | |
| KM1 | MPH | 22.26 | 15.98 | −1.43 | −0.60 | 12.75 | 9.68 | 23.88 | 5.07 | 15.94 | 35.44 |
| HPH | 12.27 | 14.66 | −4.69 | −10.74 | 5.39 | 2.64 | 21.34 | −3.20 | 7.95 | 15.35 | |
| XY54 | MPH | 7.89 | −0.87 | 1.57 | −11.72 | 22.62 | 12.05 | 3.83 | 18.31 | 22.31 | 40.53 |
| HPH | −4.67 | −0.59 | −1.61 | −23.64 | 19.43 | 9.27 | −2.60 | 13.51 | 18.59 | 24.15 | |
| XD36 | MPH | 4.29 | −1.43 | 3.78 | −3.74 | 7.44 | 8.08 | 20.37 | 8.02 | −6.11 | 32.84 |
| HPH | −6.07 | −4.56 | 2.69 | −15.17 | 2.48 | 3.22 | 15.23 | 1.53 | −10.83 | 15.19 | |
| XD33 | MPH | −3.20 | 14.23 | 10.65 | 6.06 | 12.01 | 20.49 | −23.68 | 35.96 | 8.64 | −13.72 |
| HPH | −12.76 | 10.68 | 9.52 | −6.48 | 6.77 | 14.98 | −26.89 | 27.69 | 3.09 | −25.23 | |
| XD51 | MPH | −15.32 | −3.51 | 15.36 | −11.97 | 8.13 | −6.99 | −20.86 | 4.63 | 16.77 | 27.74 |
| HPH | −22.97 | −1.38 | 15.29 | −21.67 | 5.84 | −12.11 | −23.42 | −2.67 | 15.29 | 9.73 | |
| 12AR2 | MPH | −3.05 | 3.94 | −1.70 | −16.95 | −11.07 | −9.91 | −0.87 | 4.87 | −2.56 | −38.45 |
| HPH | −9.93 | 3.79 | −3.97 | −24.58 | −17.84 | −16.58 | −1.89 | −4.48 | −10.36 | −0.48 | |
| AR 2-4 | MPH | −8.01 | −5.21 | 1.49 | −33.77 | 5.39 | 10.42 | −20.88 | 1.51 | −12.06 | −33.75 |
| HPH | −20.79 | −12.60 | −4.47 | −44.13 | 5.02 | 9.89 | −27.84 | −5.18 | −12.15 | −39.88 | |
| 09AR2 | MPH | −4.86 | −2.85 | −13.15 | −21.57 | −30.22 | −34.66 | −47.47 | −27.98 | −21.26 | 17.33 |
| HPH | −16.10 | −8.06 | −16.08 | −32.28 | −31.89 | −36.14 | −50.84 | −30.76 | −23.49 | 3.85 |
| Plot Yield (g) | MPH (%) | GCA (♀), (♂) | SCA | SNP Clustering Combination Type | |
|---|---|---|---|---|---|
| Pubing717 × Xindong41 | 1279.5 | 30.36 | 148.69, 72.42 | 149.66 | IV × III |
| Pubing717 × Gaoyou8901 | 1142.0 | 25.24 | 148.69, −17.96 | 102.26 | IV ×V |
| Pubing717 × 09AR20-2 | 1149.0 | 20.69 | 148.69, −26.28 | 115.58 | IV × II |
| Kemai1 × Xindong52 | 1220.0 | 22.26 | 103.55, 89.23 | 118.26 | IV × I |
| Kemai1 × 09AR20-2 | 1152.7 | 23.88 | 103.55, −26.28 | 166.47 | IV × II |
| Kendong002 × 99AR144-1 | 1163.5 | 34.17 | 122.87, 25.47 | 106.20 | I × II |
| Kendong002 × Xindong41 | 1161.0 | 30.84 | 122.87, 72.42 | 56.75 | I × III |
| Kendong002 × 2005 (65) | 1120.0 | 36.81 | 122.87, −18.97 | 107.14 | I × III |
| Kendong002 × Xindong52 | 1184.0 | 22.59 | 122.87, 89.23 | 62.94 | I × I |
| Xindong33 × Yannong19 | 1113.5 | 35.96 | 22.41, −28.43 | 210.52 | III × V |
| Trait | Correlation Coefficient | Trait | Correlation Coefficient |
|---|---|---|---|
| Kernels per spike MPH | −0.012 | Spike number per acreage MPH | −0.257 |
| Kernels per spike HPH | −0.198 | Spike number per acreage HPH | −0.203 |
| Thousand seed weight MPH | 0.399 * | Yield per acreage MPH | 0.371 |
| Thousand seed weight HPH | 0.365 | Yield per acreage HPH | 0.208 |
© 2019 by the authors. Licensee MDPI, Basel, Switzerland. This article is an open access article distributed under the terms and conditions of the Creative Commons Attribution (CC BY) license (http://creativecommons.org/licenses/by/4.0/).
Share and Cite
Nie, Y.; Ji, W.; Ma, S. Assessment of Heterosis Based on Genetic Distance Estimated Using SNP in Common Wheat. Agronomy 2019, 9, 66. https://doi.org/10.3390/agronomy9020066
Nie Y, Ji W, Ma S. Assessment of Heterosis Based on Genetic Distance Estimated Using SNP in Common Wheat. Agronomy. 2019; 9(2):66. https://doi.org/10.3390/agronomy9020066
Chicago/Turabian StyleNie, Yingbin, Wanquan Ji, and Songmei Ma. 2019. "Assessment of Heterosis Based on Genetic Distance Estimated Using SNP in Common Wheat" Agronomy 9, no. 2: 66. https://doi.org/10.3390/agronomy9020066
APA StyleNie, Y., Ji, W., & Ma, S. (2019). Assessment of Heterosis Based on Genetic Distance Estimated Using SNP in Common Wheat. Agronomy, 9(2), 66. https://doi.org/10.3390/agronomy9020066