2.1.1. Odontogenesis of Emtg-2 Cells Was Improved by Embryonic Dental Epithelial Cells (in Vivo)
Clonal epithelial cell lines (emtg-1 to -5) were established from a mouse molar tooth germ. Germs reconstructed with cells of lines and molar mesenchymal tissues developed teeth when transplanted under kidney capsule, although tooth construction rate was below 100% [
18].
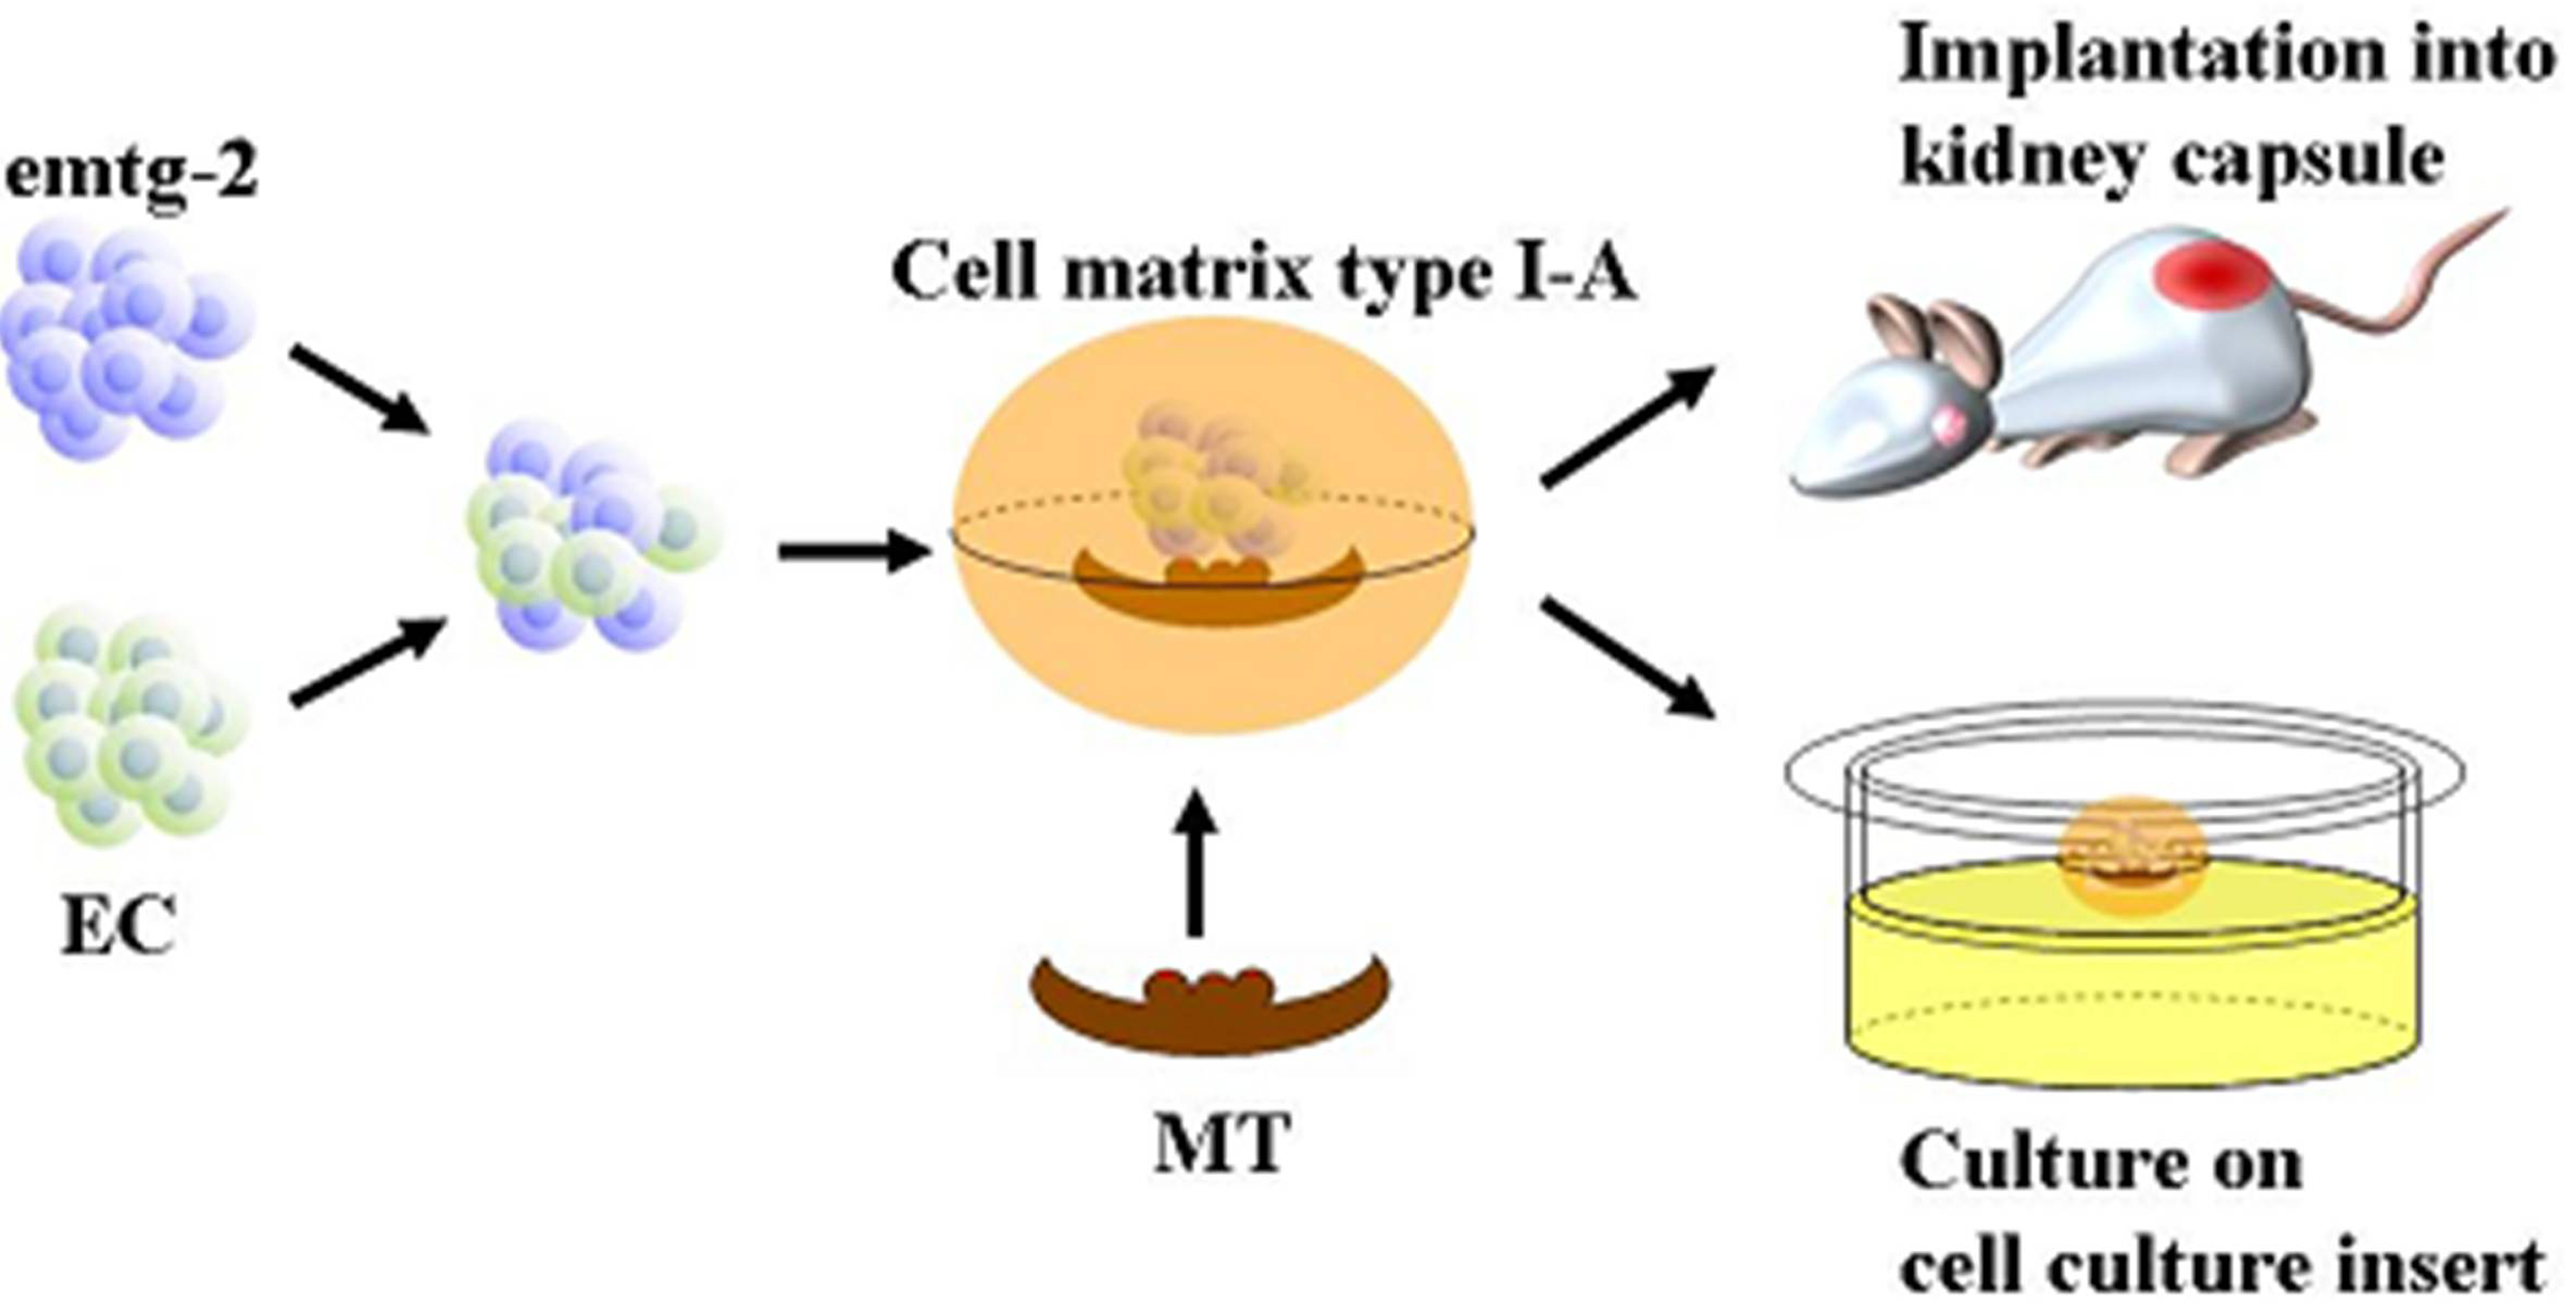
The previous study has raised the question of whether or not the microenvironment in the reconstructed germs is poorly created. In a reconstructed tooth germ, a pellet of epithelial cells (emtg cells) is sitting on a mesenchymal tissue (MT) prepared from a lower first molar germ (E16.5). To improve the microenvironment, germs were reconstructed with a mixture of emtg-2 cells and epithelial cells prepared from a lower first molar germ (EC, E16.5) (mixing ratio; emtg-2 cells: EC = 1:1) and with MT, and implanted under kidney capsule for 7 days. The germs developed teeth at 100% (
Figure 1a and
Table 1), as observed in positive controls (mixing ratio; emtg-2 cells: EC = 0:1, with MT) (
Figure 1b, and
Table 1). No tooth structures developed from germs reconstructed without epithelial cells (negative control) (
Figure 1c,
Table 1). Active involvement of emtg-2 cells in the odontogenesis is shown in 2.1.5
Figure 1.
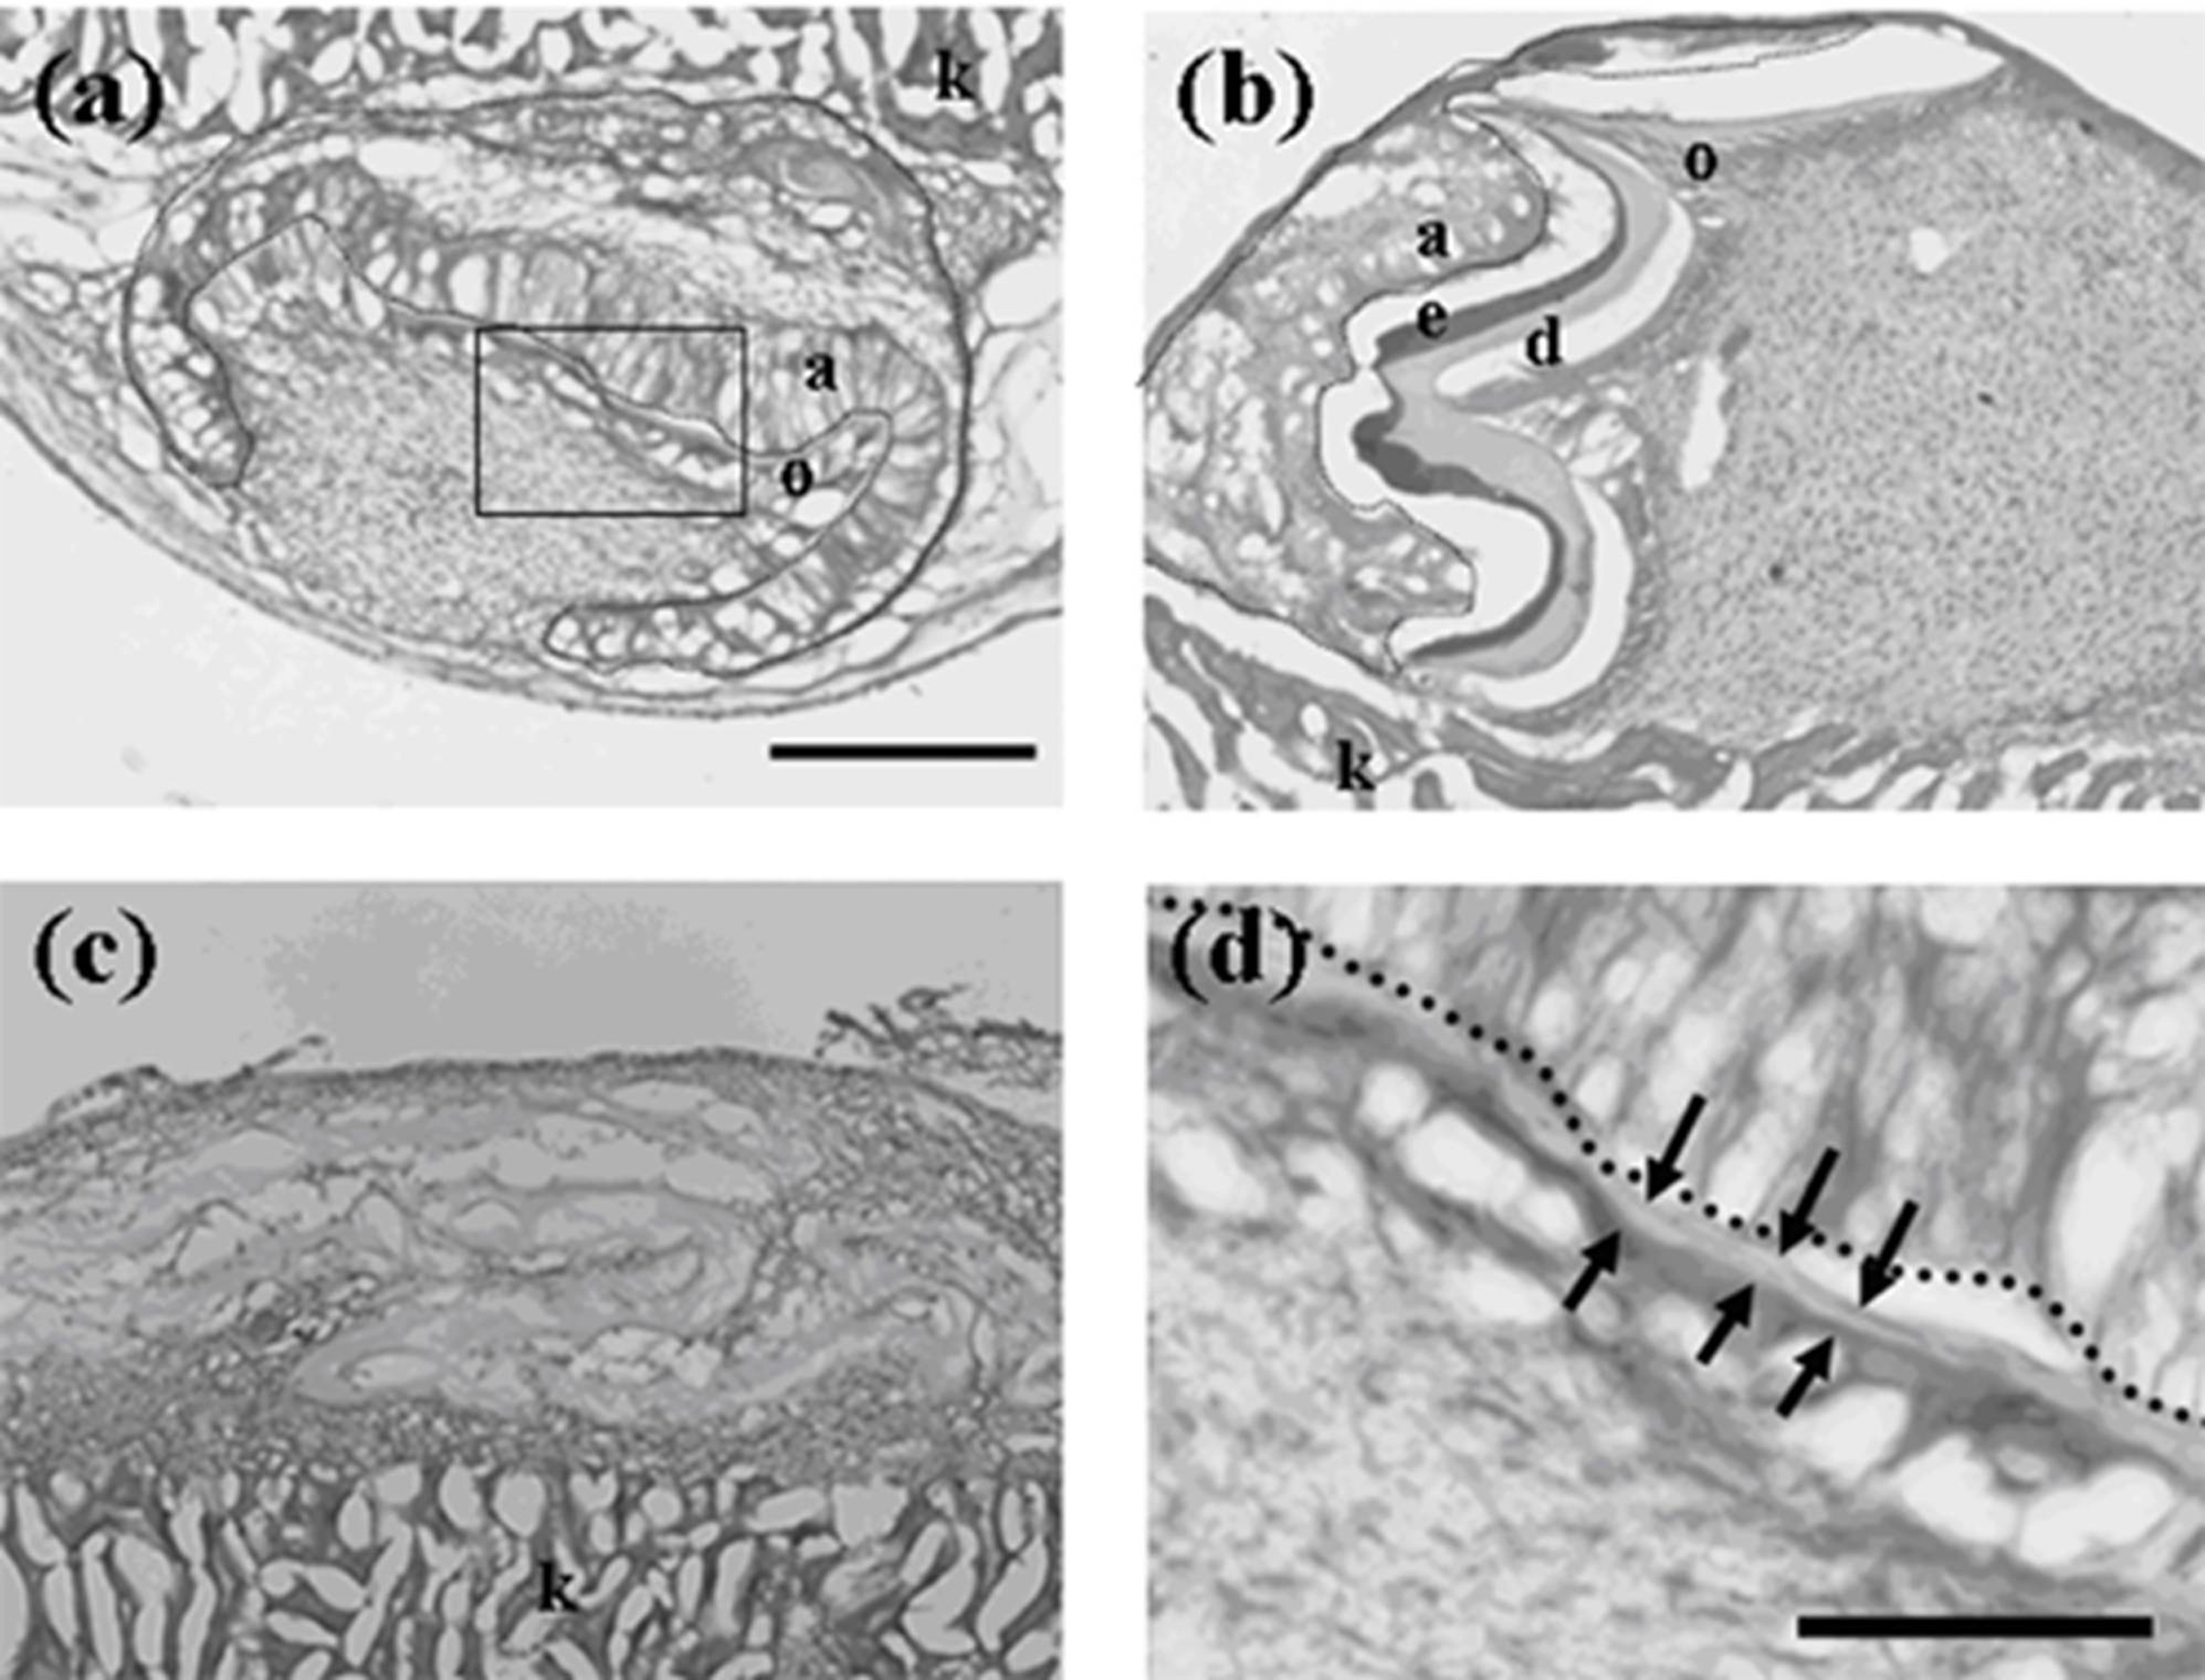
Histology of constructed teeth from germs implanted under kidney capsule. (a) A tooth developed from a germ reconstructed with mixed epithelial cells (emtg-2 cells: dental epithelial cells = 1:1) and a dental mesenchymal tissue (MT). (b) A constructed tooth with dental epithelial cells (EC) and MT prepared from a first molar (E16.5) (positive control). (c) Bone-like tissues were developed from a germ reconstructed with only MT (negative control). (d) High magnification of the enclosed area in (a). The development of the tooth (a) was delayed because it had a thinner calcified layer than that of (b). Nuclei were stained with DAPI (blue). a: elongated inner enamel epithelium (ameloblast-lineage), d: dentin, e: enamel, o; odontoblast, dot line; dental epithelium, arrows; thin dentin layer, k; kidney. Scale bar is 200 μm in (a, b and c), 50 μm in (d).
Figure 1.
Histology of constructed teeth from germs implanted under kidney capsule. (a) A tooth developed from a germ reconstructed with mixed epithelial cells (emtg-2 cells: dental epithelial cells = 1:1) and a dental mesenchymal tissue (MT). (b) A constructed tooth with dental epithelial cells (EC) and MT prepared from a first molar (E16.5) (positive control). (c) Bone-like tissues were developed from a germ reconstructed with only MT (negative control). (d) High magnification of the enclosed area in (a). The development of the tooth (a) was delayed because it had a thinner calcified layer than that of (b). Nuclei were stained with DAPI (blue). a: elongated inner enamel epithelium (ameloblast-lineage), d: dentin, e: enamel, o; odontoblast, dot line; dental epithelium, arrows; thin dentin layer, k; kidney. Scale bar is 200 μm in (a, b and c), 50 μm in (d).
Table 1.
Tissues grown from implanted tooth germs (emtg-2: dental epithelial cells [EC] = 1:1).
Table 1.
Tissues grown from implanted tooth germs (emtg-2: dental epithelial cells [EC] = 1:1).
| | Tooth | Non-Tooth | Total |
|---|
| Positive control | 7 | − | 7 |
| Negative control | | 9 | 9 |
| emtg-2:EC = 1:1 | 6 | − | 6 |
2.1.2. Odontogenesis of Emtg-2 Cells on Culture Inserts
Germs reconstructed with EC and MT developed teeth when cultured on cell culture inserts [
22]. Therefore, germs were reconstructed with mixed epithelial cells (emtg-2 cells: EC = 1:1) and with MT, and were cultured on inserts. It was confirmed that all germs developed teeth on inserts (
Figure 2 and
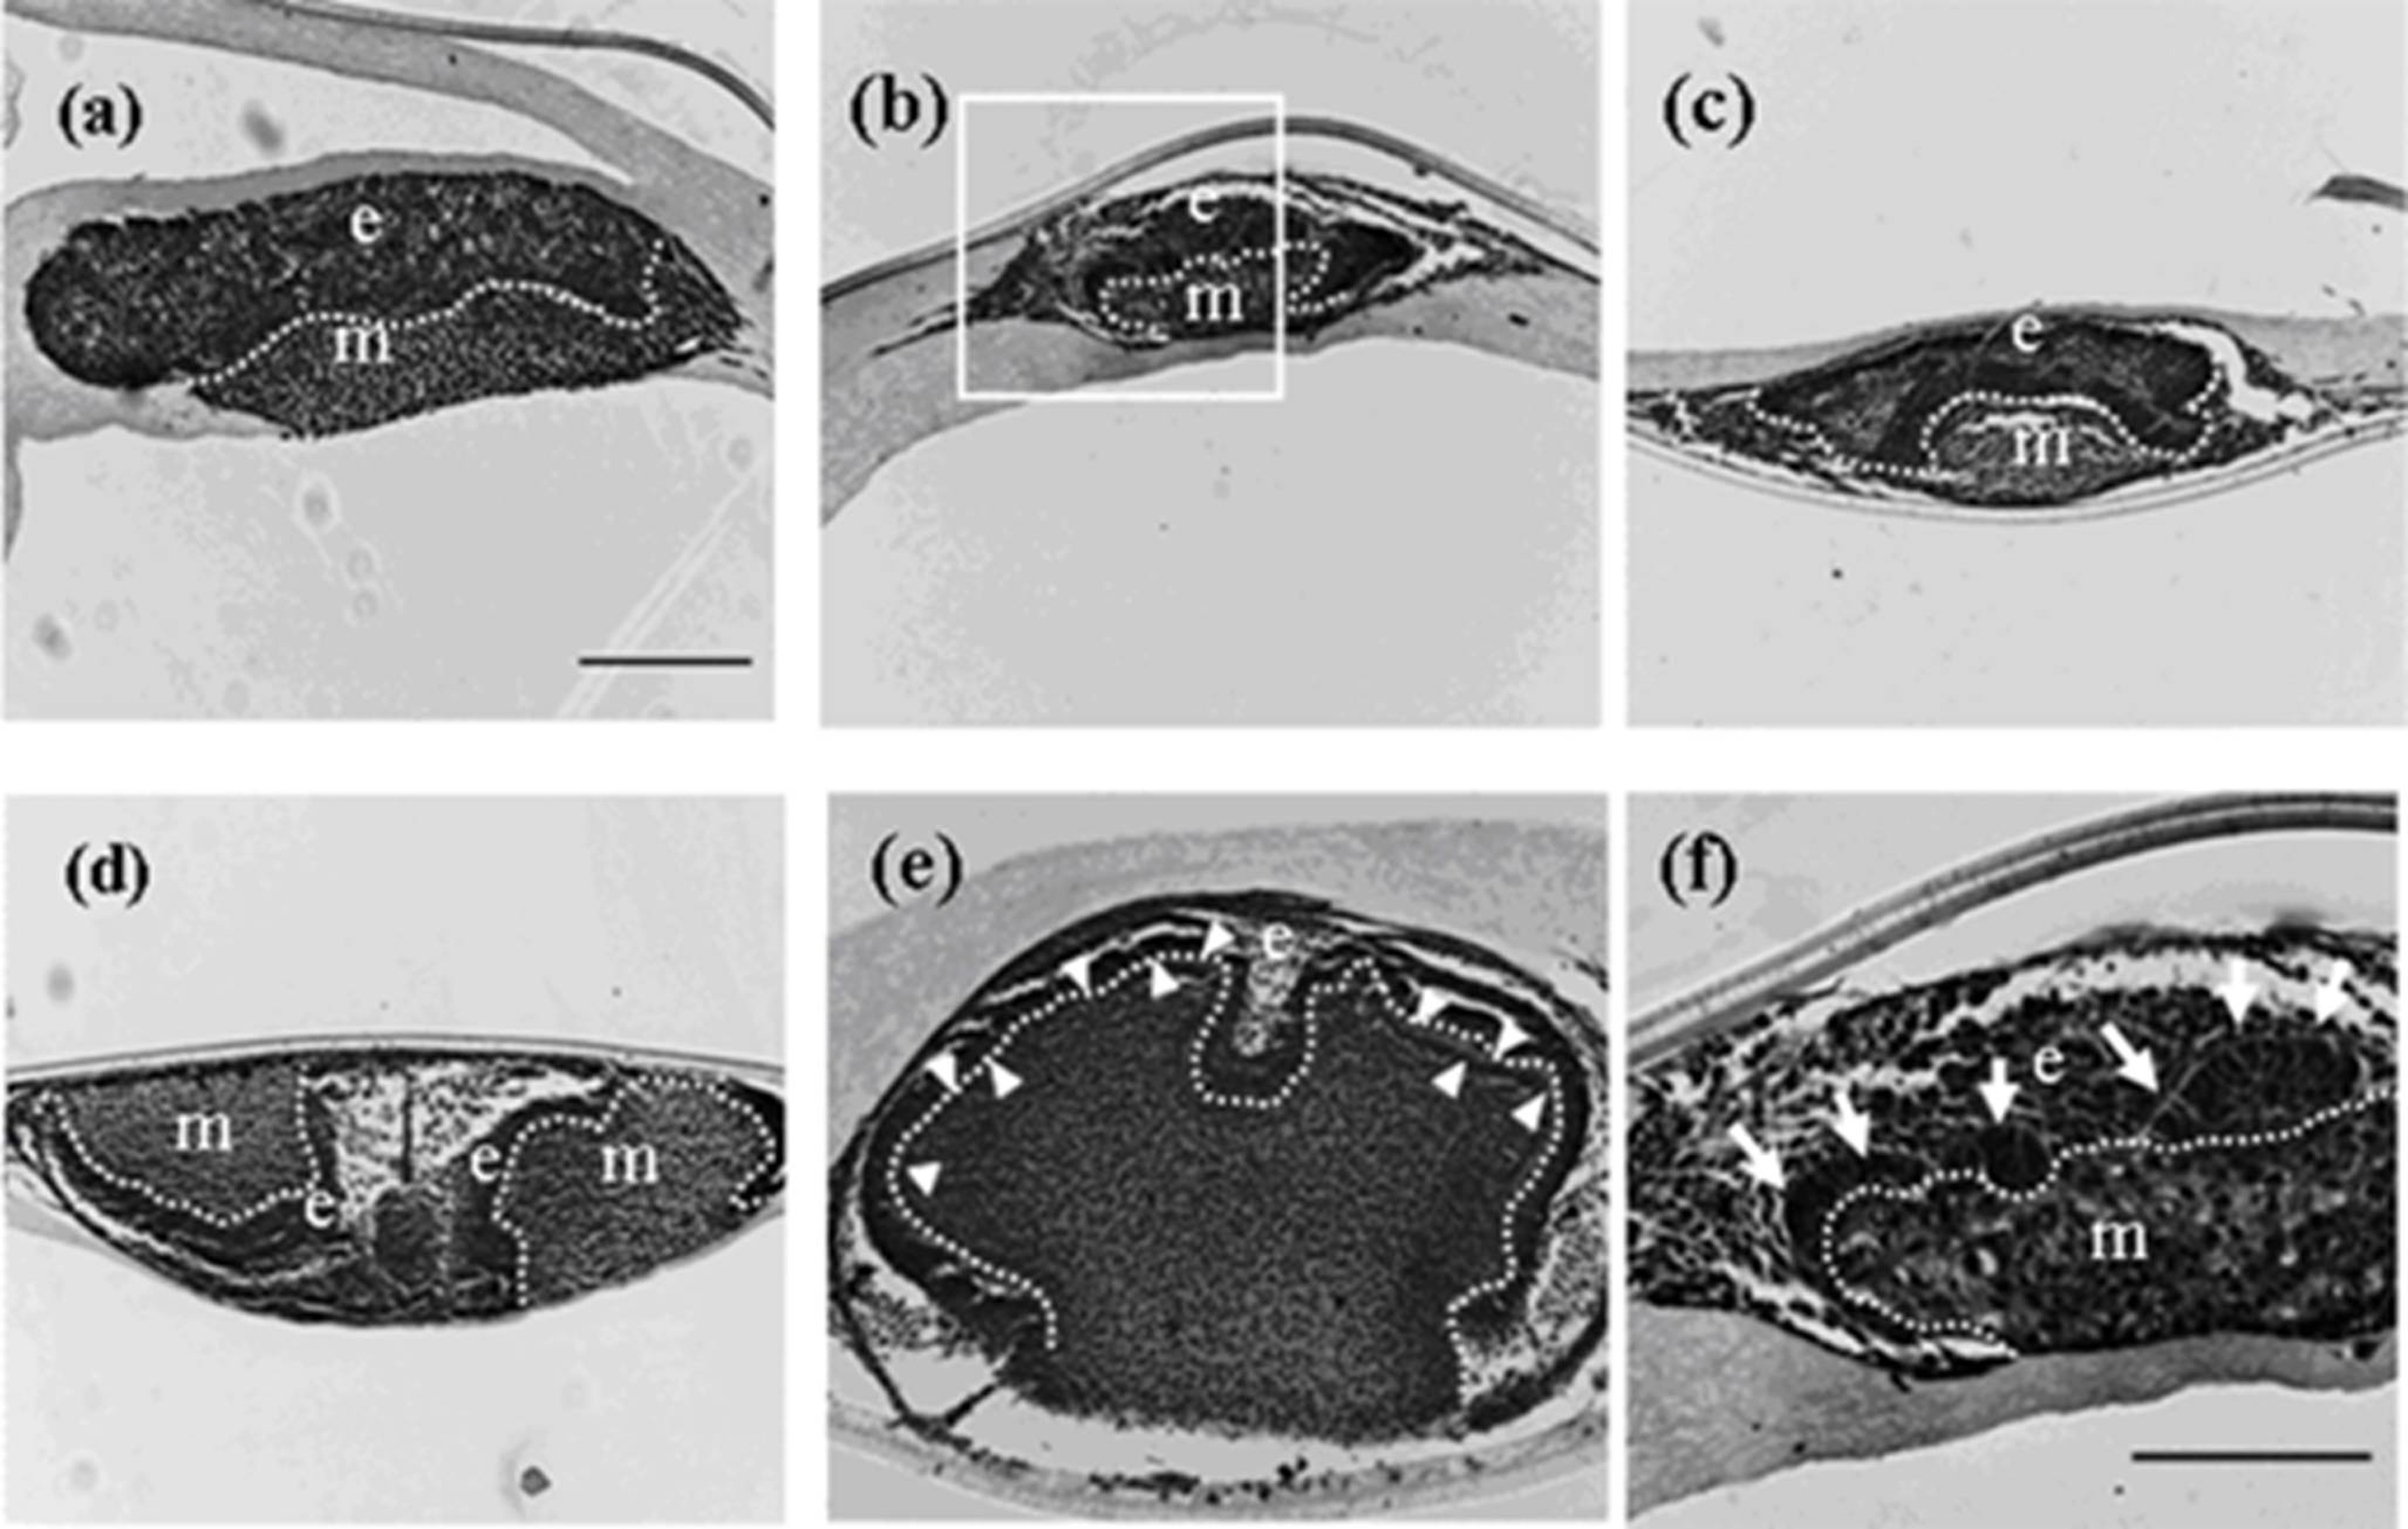
Table 2) as observed in positive controls (emtg-2 cells: EC = 0:1, data not shown). Elongated epithelial cells like those in the inner enamel epithelium (IEE) were detected after two days in culture (
Figure 2b,f) and a very thin dentin-like structure was detected after seven days in culture (
Figure 2e). Immunohistochemistry confirmed amelogenin expression in the elongated epithelial cells adjacent to the mesenchyme in germs after seven days in culture (
Figure 3e). In the following experiments, tooth development was analyzed in germs cultured on inserts.
Figure 2.
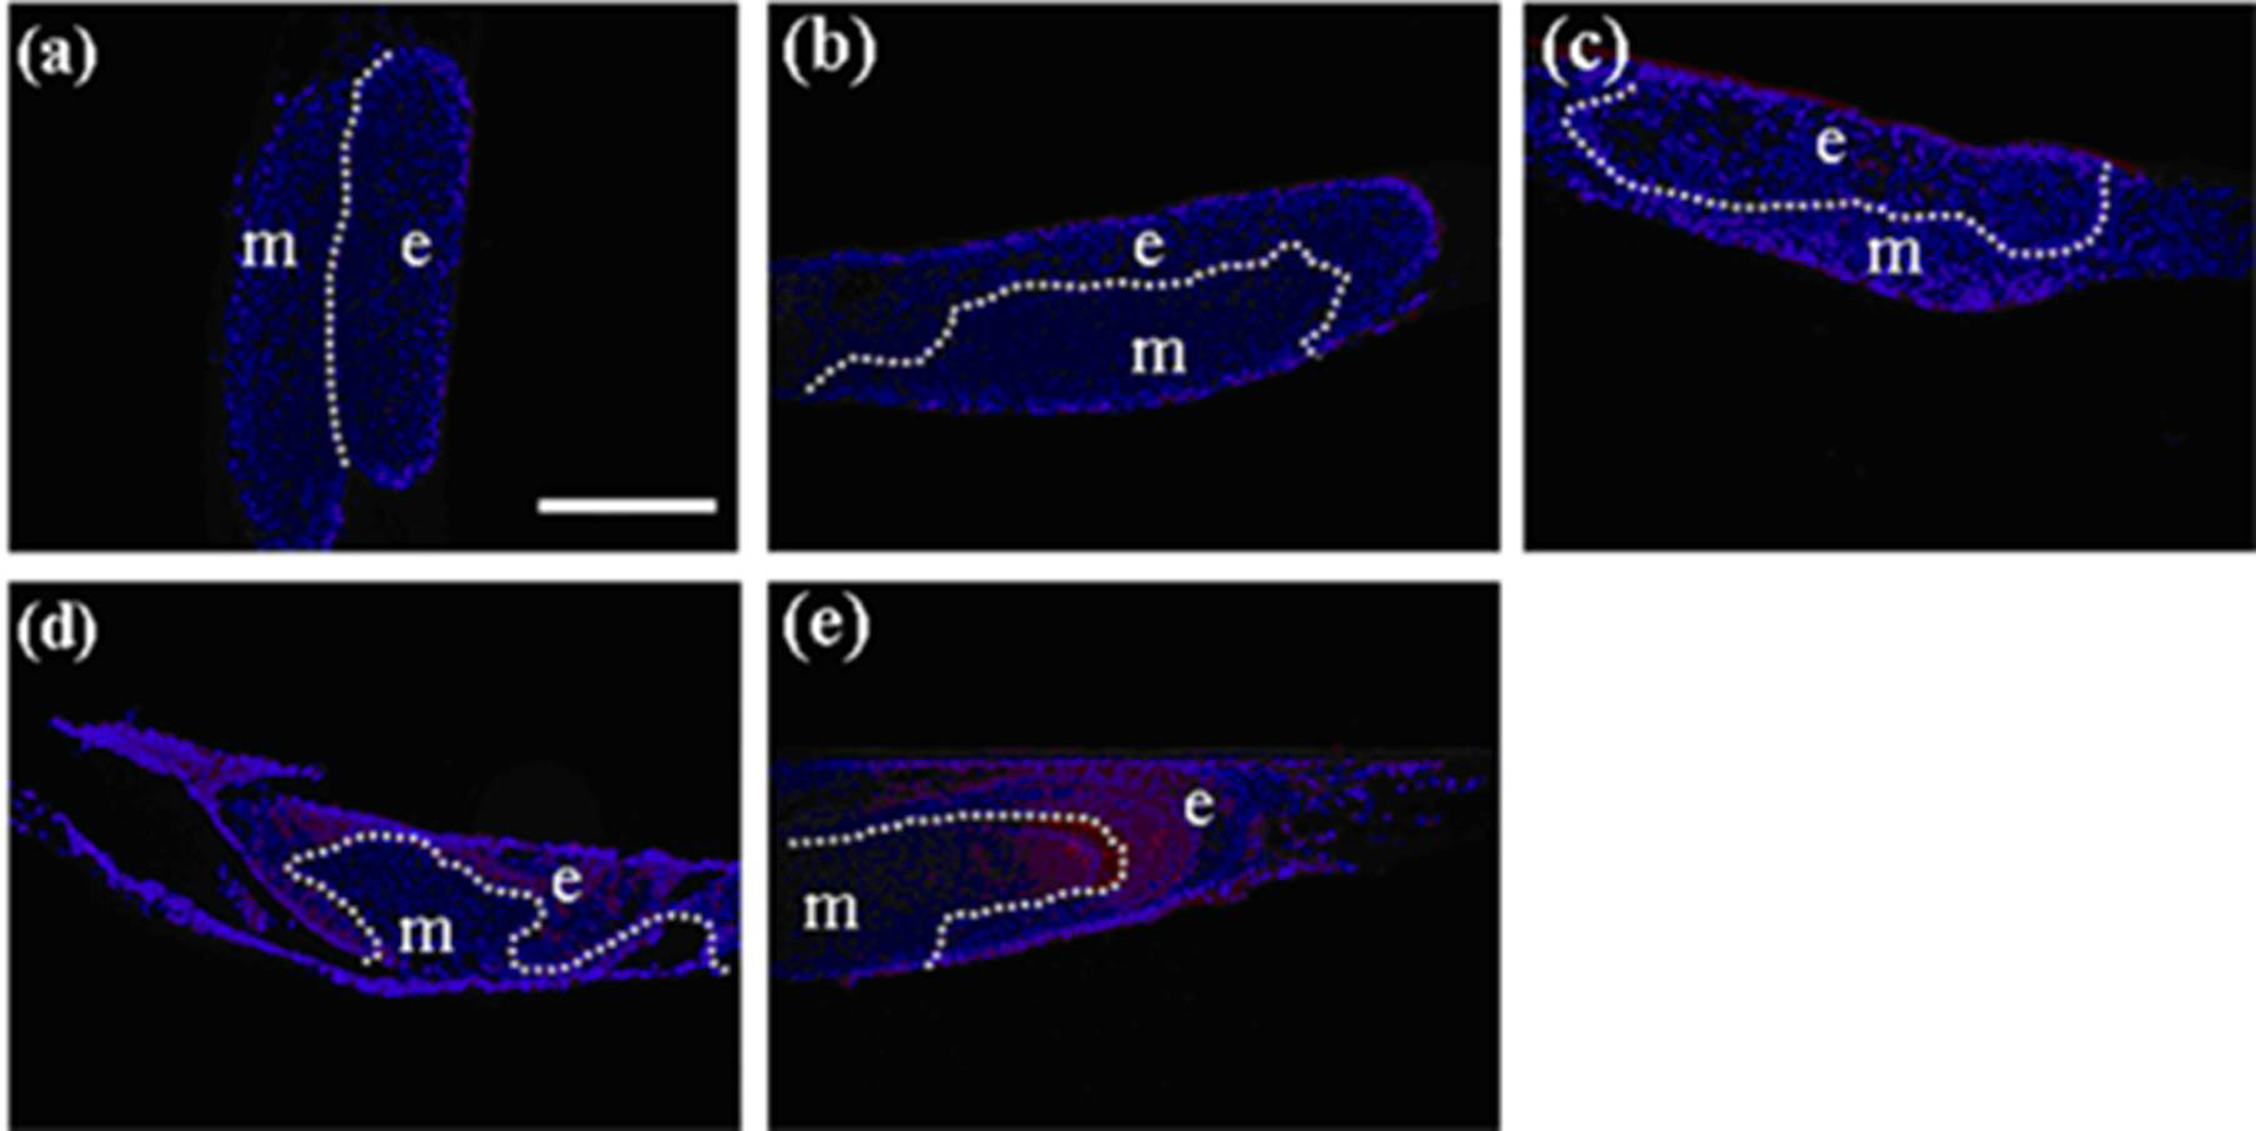
Histology of developing germs reconstructed with mixed epithelial cells (emtg-2 cells: EC = 1:1) and MT on culture inserts. Germs cultured for 1 (a), 2 (b), 3 (c), 5 (d) and 7 days (e). (f) High magnification of the enclosed area in (b). Elongated epithelial cells (arrows in f) were detected after two days in culture. A developing tooth had a very thin dentin-like structure after seven days in culture (e: arrow heads). E: epithelium, m; mesenchyme, dot line; epithelial-mesenchymal interface. Scale bar in (a) is 200 μm and figure b–e are at the same magnification. Scale bar in (f) is 100 μm.
Figure 2.
Histology of developing germs reconstructed with mixed epithelial cells (emtg-2 cells: EC = 1:1) and MT on culture inserts. Germs cultured for 1 (a), 2 (b), 3 (c), 5 (d) and 7 days (e). (f) High magnification of the enclosed area in (b). Elongated epithelial cells (arrows in f) were detected after two days in culture. A developing tooth had a very thin dentin-like structure after seven days in culture (e: arrow heads). E: epithelium, m; mesenchyme, dot line; epithelial-mesenchymal interface. Scale bar in (a) is 200 μm and figure b–e are at the same magnification. Scale bar in (f) is 100 μm.
Table 2.
Tissues grown from tooth germs reconstructed with emtg-2 cells and EC (1:1~0) and MT on culture inserts
Table 2.
Tissues grown from tooth germs reconstructed with emtg-2 cells and EC (1:1~0) and MT on culture inserts
| | Tooth | Non-tooth | Total |
|---|
| Positive Control *1 | 13 | − | 13 |
| Negative Control *2 | − | 10 | 10 |
| Emtg-2:EC = 1:1 | 44 | − | 44 |
| Emtg-2:EC = 1:0.75 | 6 | − | 6 |
| Emtg-2:EC = 1:0.5 | 26 | − | 26 |
| Emtg-2:EC = 1:0.25 | 3 | 3 | 6 |
| Emtg-2:EC = 1:0 | − | 16 | 16 |
Figure 3.
Immunohistochemistry of developing teeth from germs reconstructed with mixed epithelial cells (emtg-2 cells: EC = 1:1) and MT on culture inserts. Germs were cultured for 1 (a), 2 (b), 3 (c), 5 (d) and 7 days (e). Amelogenin protein (red) became detectable after seven days in culture (e). Nuclei were stained with DAPI (blue). E: epithelium, m; mesenchyme, dot line; epithelial-mesenhymal interface. Scale bar is 200 μm in (a) and all figures are at the same magnification.
2.1.4. Developmental Stage of EC had Influence on Tooth Construction
EC were regularly prepared from dental germs at E16.5. To examine the effect of EC age, EC were prepared from embryos at E14.5, 15.5 and 16.5 and mixed with emtg-2 cells at 1:0.5. Germs reconstructed with the mixed epithelial cells and MT (E16.5) were cultured on inserts for seven days. Germs prepared with EC at different ages gave rise to varied rates of tooth development; 50% (E14.5), 86% (E15.5) and 100% (E16.5) (
Table 3).
Table 3.
Tissues grown from tooth germs reconstructed with emtg-2 cells and EC (E14.5~16.5) and MT (E16.5) on culture inserts; emtg-2 cell: EC = 1:0.5
Table 3.
Tissues grown from tooth germs reconstructed with emtg-2 cells and EC (E14.5~16.5) and MT (E16.5) on culture inserts; emtg-2 cell: EC = 1:0.5
| | Tooth | Non-tooth | Total |
|---|
| Positive Control *1 | 4 | − | 4 |
| Negative Control *2 | − | 5 | 5 |
| E14.5 | 3 | 3 | 6 |
| E15.5 | 19 | 3 | 22 |
| E16.5 | 6 | − | 6 |
Figure 4.
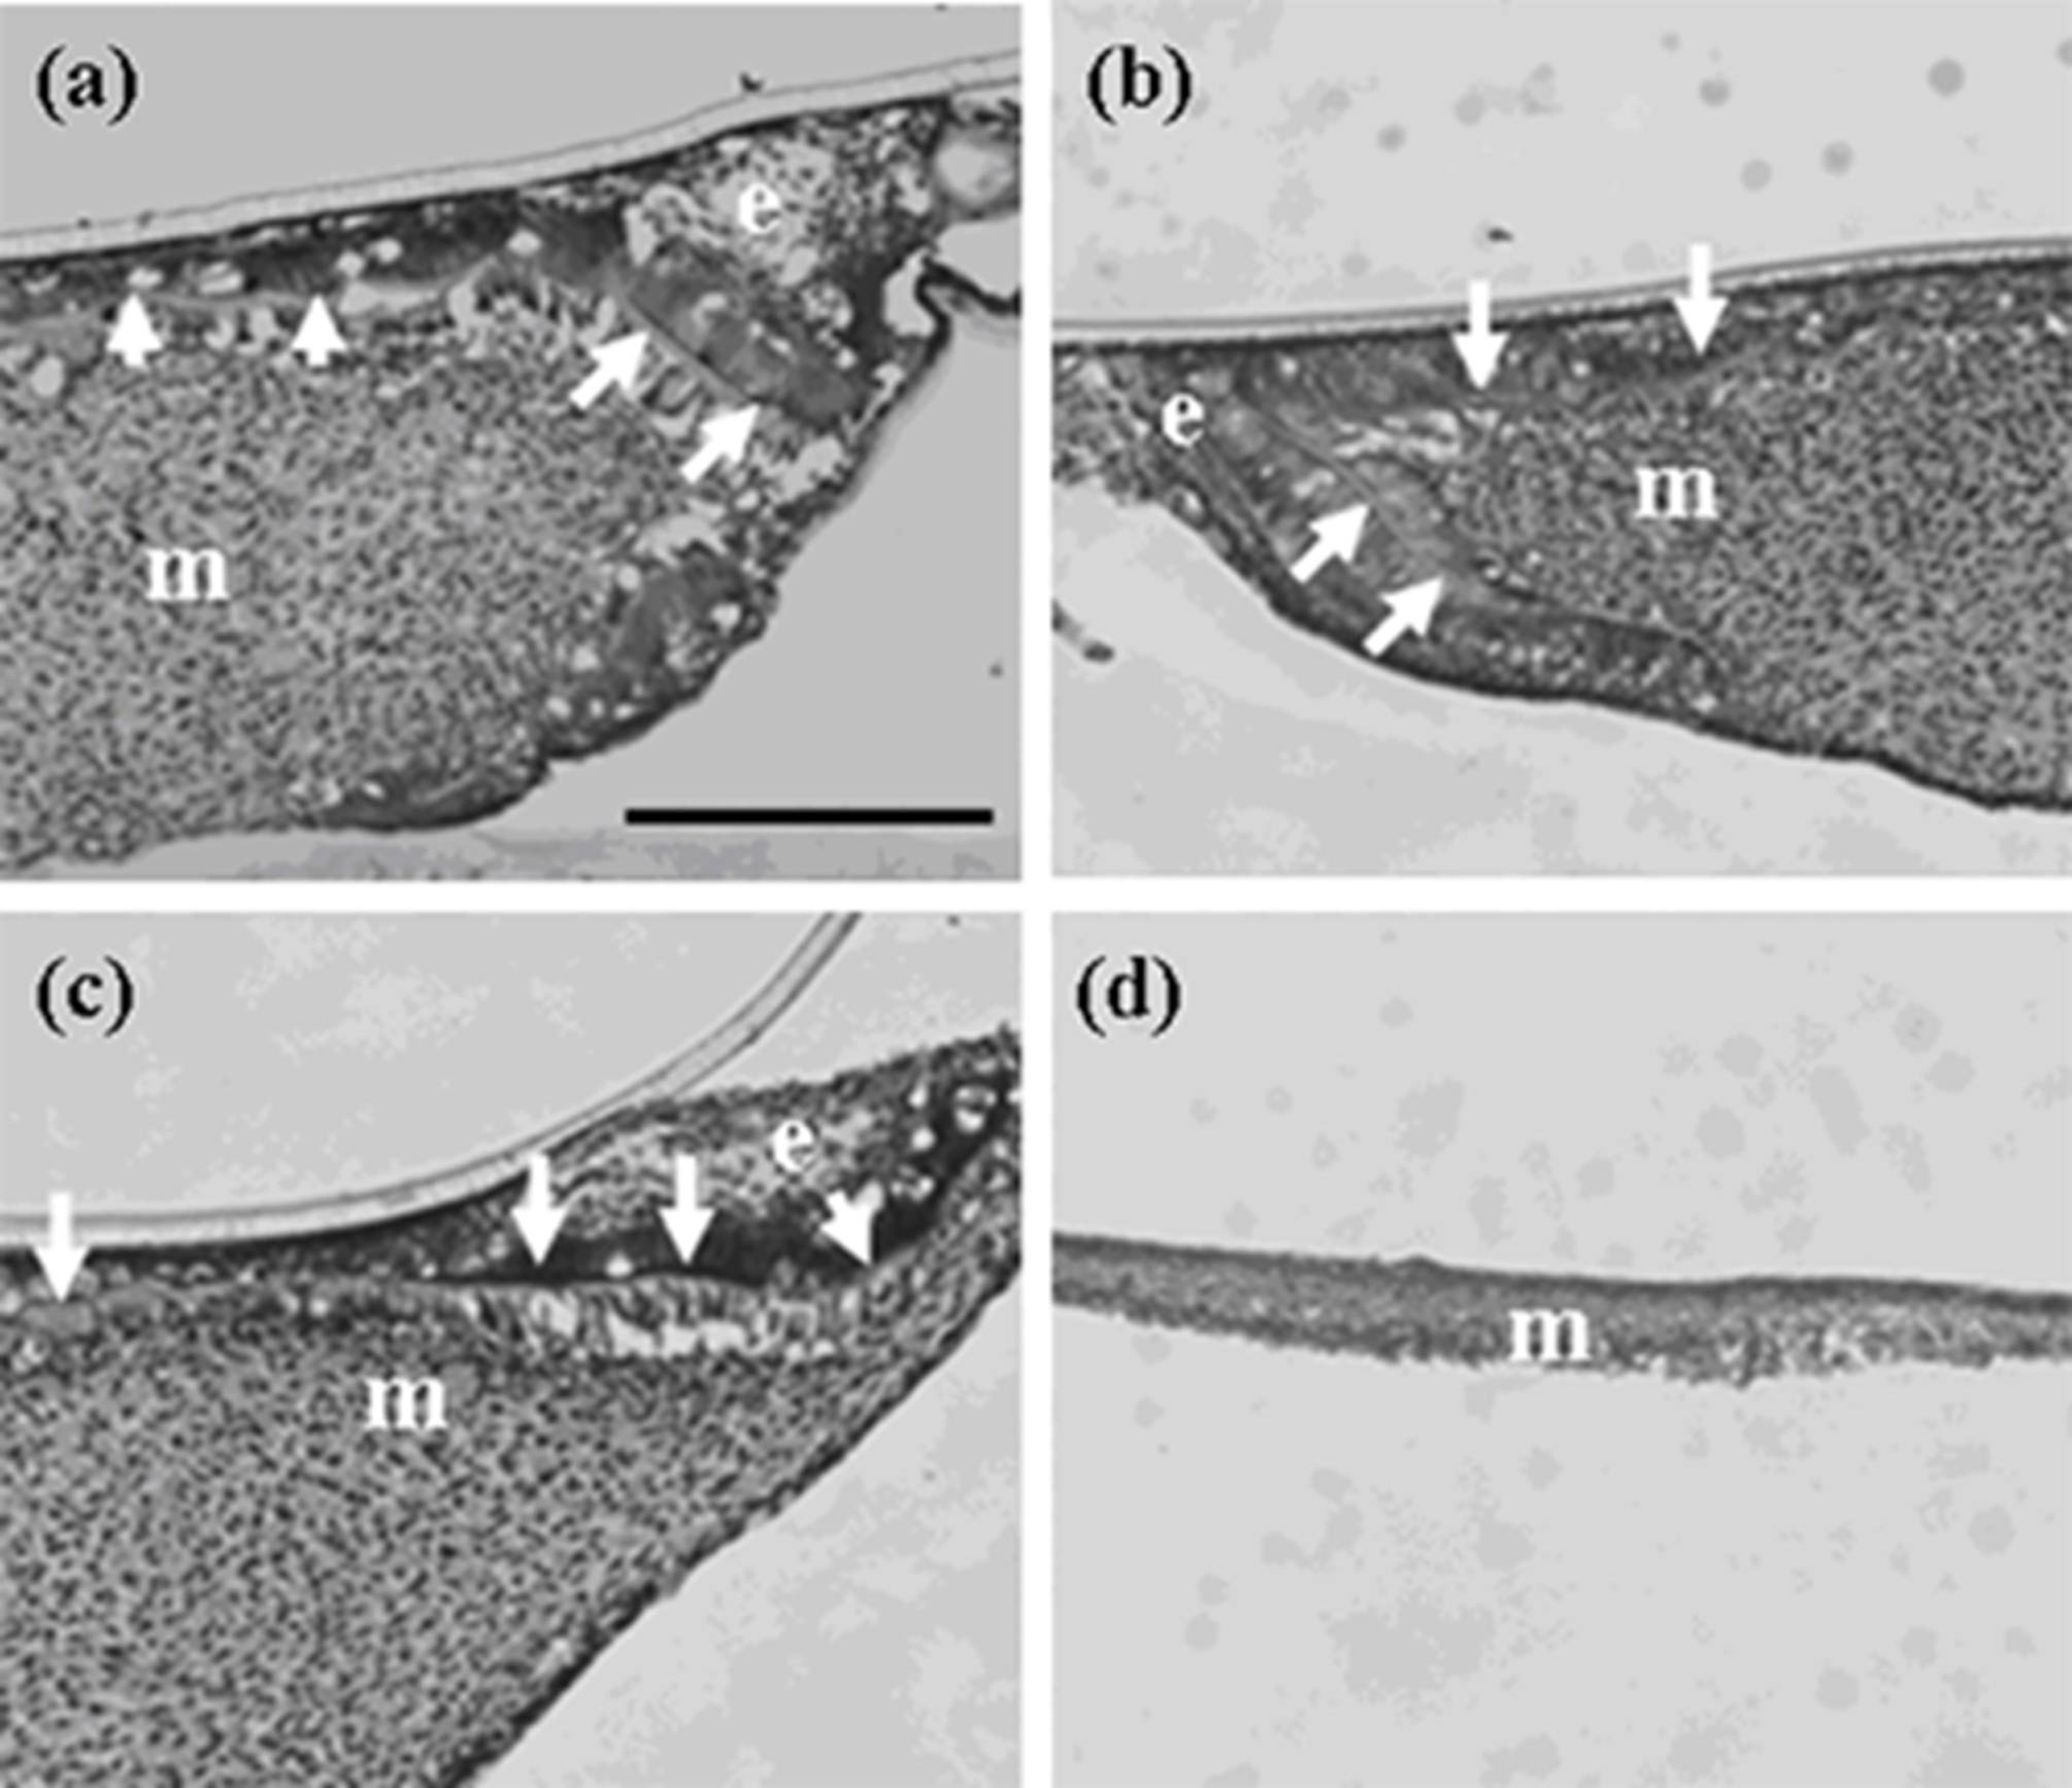
Histology of teeth developed from germs reconstructed with mixed epithelial cells (emtg-2 cells: EC = 1:0.75 to 0) and MT cultured for seven days on inserts. (a, b) All reconstructed germs (emtg-2 cells: EC = 1:0.75, 0.5) developed teeth. (c) Half of the germs (emtg-2 cells: EC = 1:0.25) developed teeth. Any histological difference was unrecognized among teeth developed from germs with different mixing rates (emtg-2 cells: EC = 1:0.75, 0.5 and 0.25). (d) No teeth developed from germs reconstructed with emtg-2 cells and EC (1:0) and MT. Only a thin layer of mesenchymal cells was recognized, e: epithelium, m: mesenchyme, arrows: very thin dentin-like structure, Scale bar is 100 μm in (a) and all figures are at the same magnification.
Figure 4.
Histology of teeth developed from germs reconstructed with mixed epithelial cells (emtg-2 cells: EC = 1:0.75 to 0) and MT cultured for seven days on inserts. (a, b) All reconstructed germs (emtg-2 cells: EC = 1:0.75, 0.5) developed teeth. (c) Half of the germs (emtg-2 cells: EC = 1:0.25) developed teeth. Any histological difference was unrecognized among teeth developed from germs with different mixing rates (emtg-2 cells: EC = 1:0.75, 0.5 and 0.25). (d) No teeth developed from germs reconstructed with emtg-2 cells and EC (1:0) and MT. Only a thin layer of mesenchymal cells was recognized, e: epithelium, m: mesenchyme, arrows: very thin dentin-like structure, Scale bar is 100 μm in (a) and all figures are at the same magnification.
2.1.5. Do Emtg Cells Actively Participate in Odontogenesis?
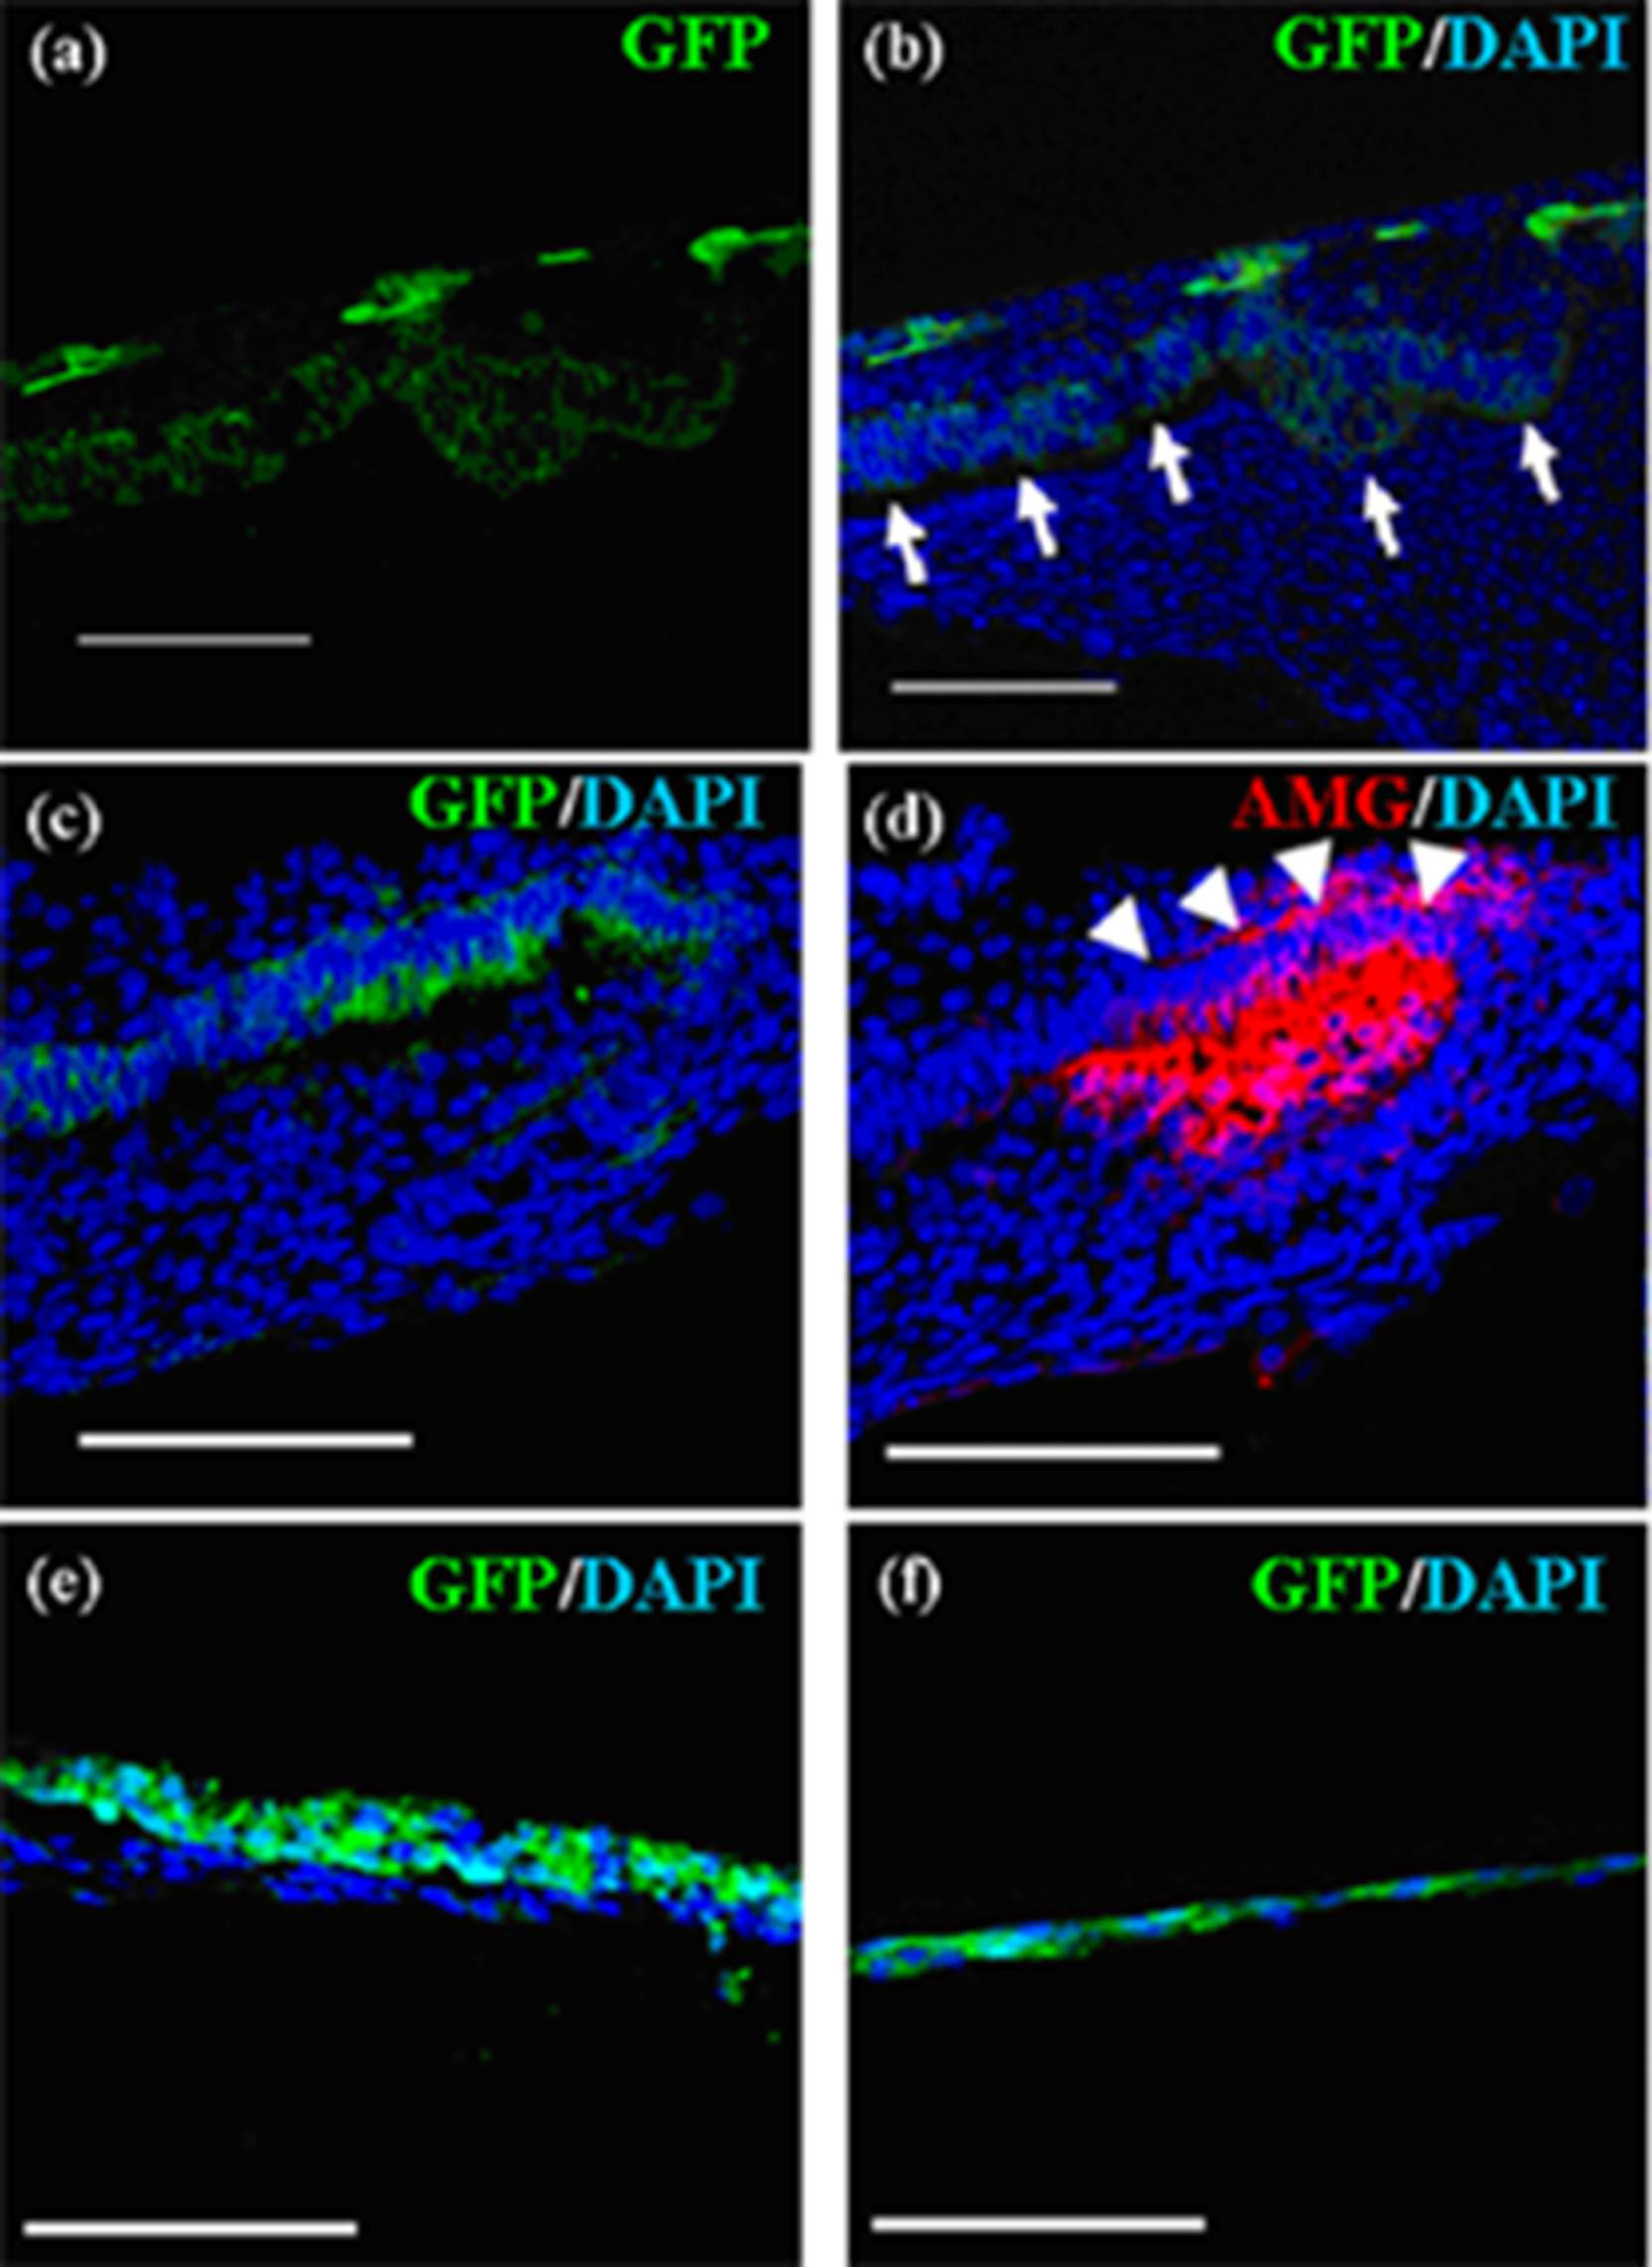
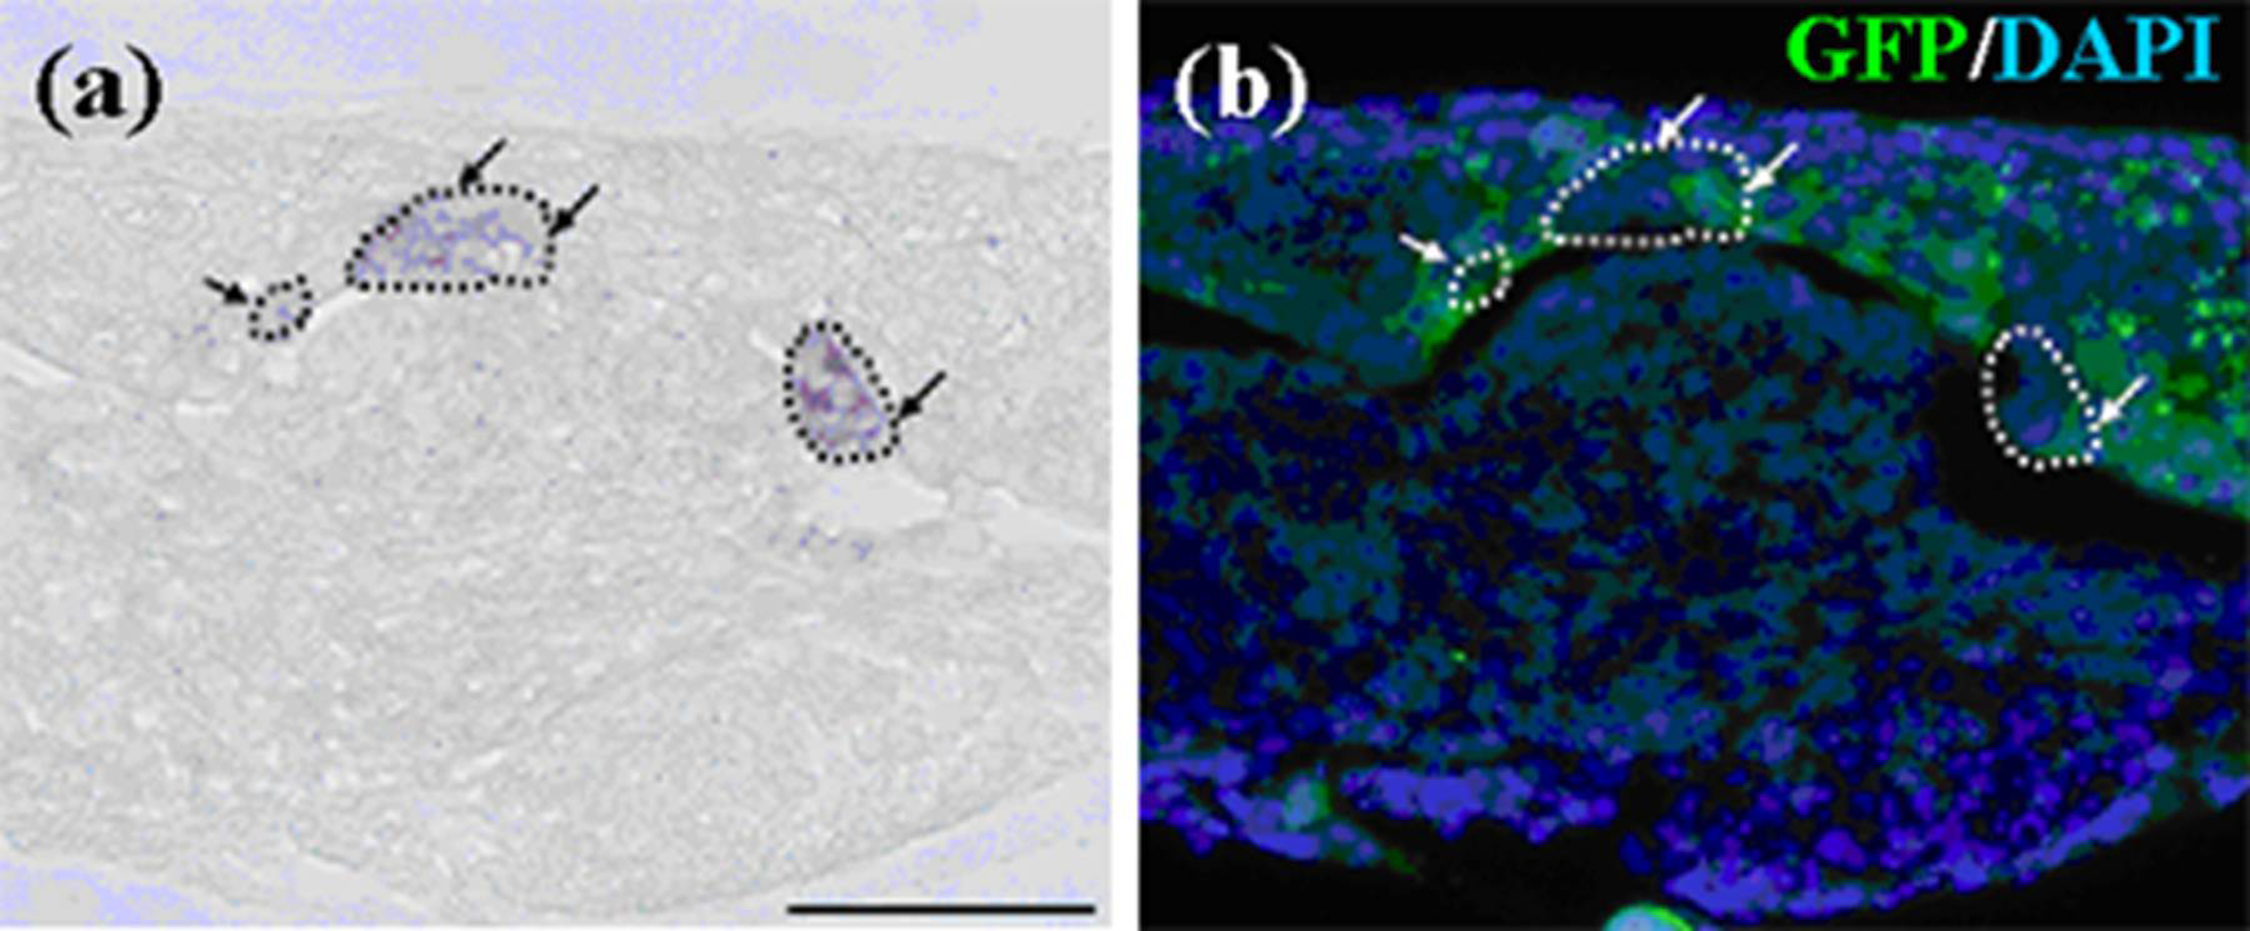
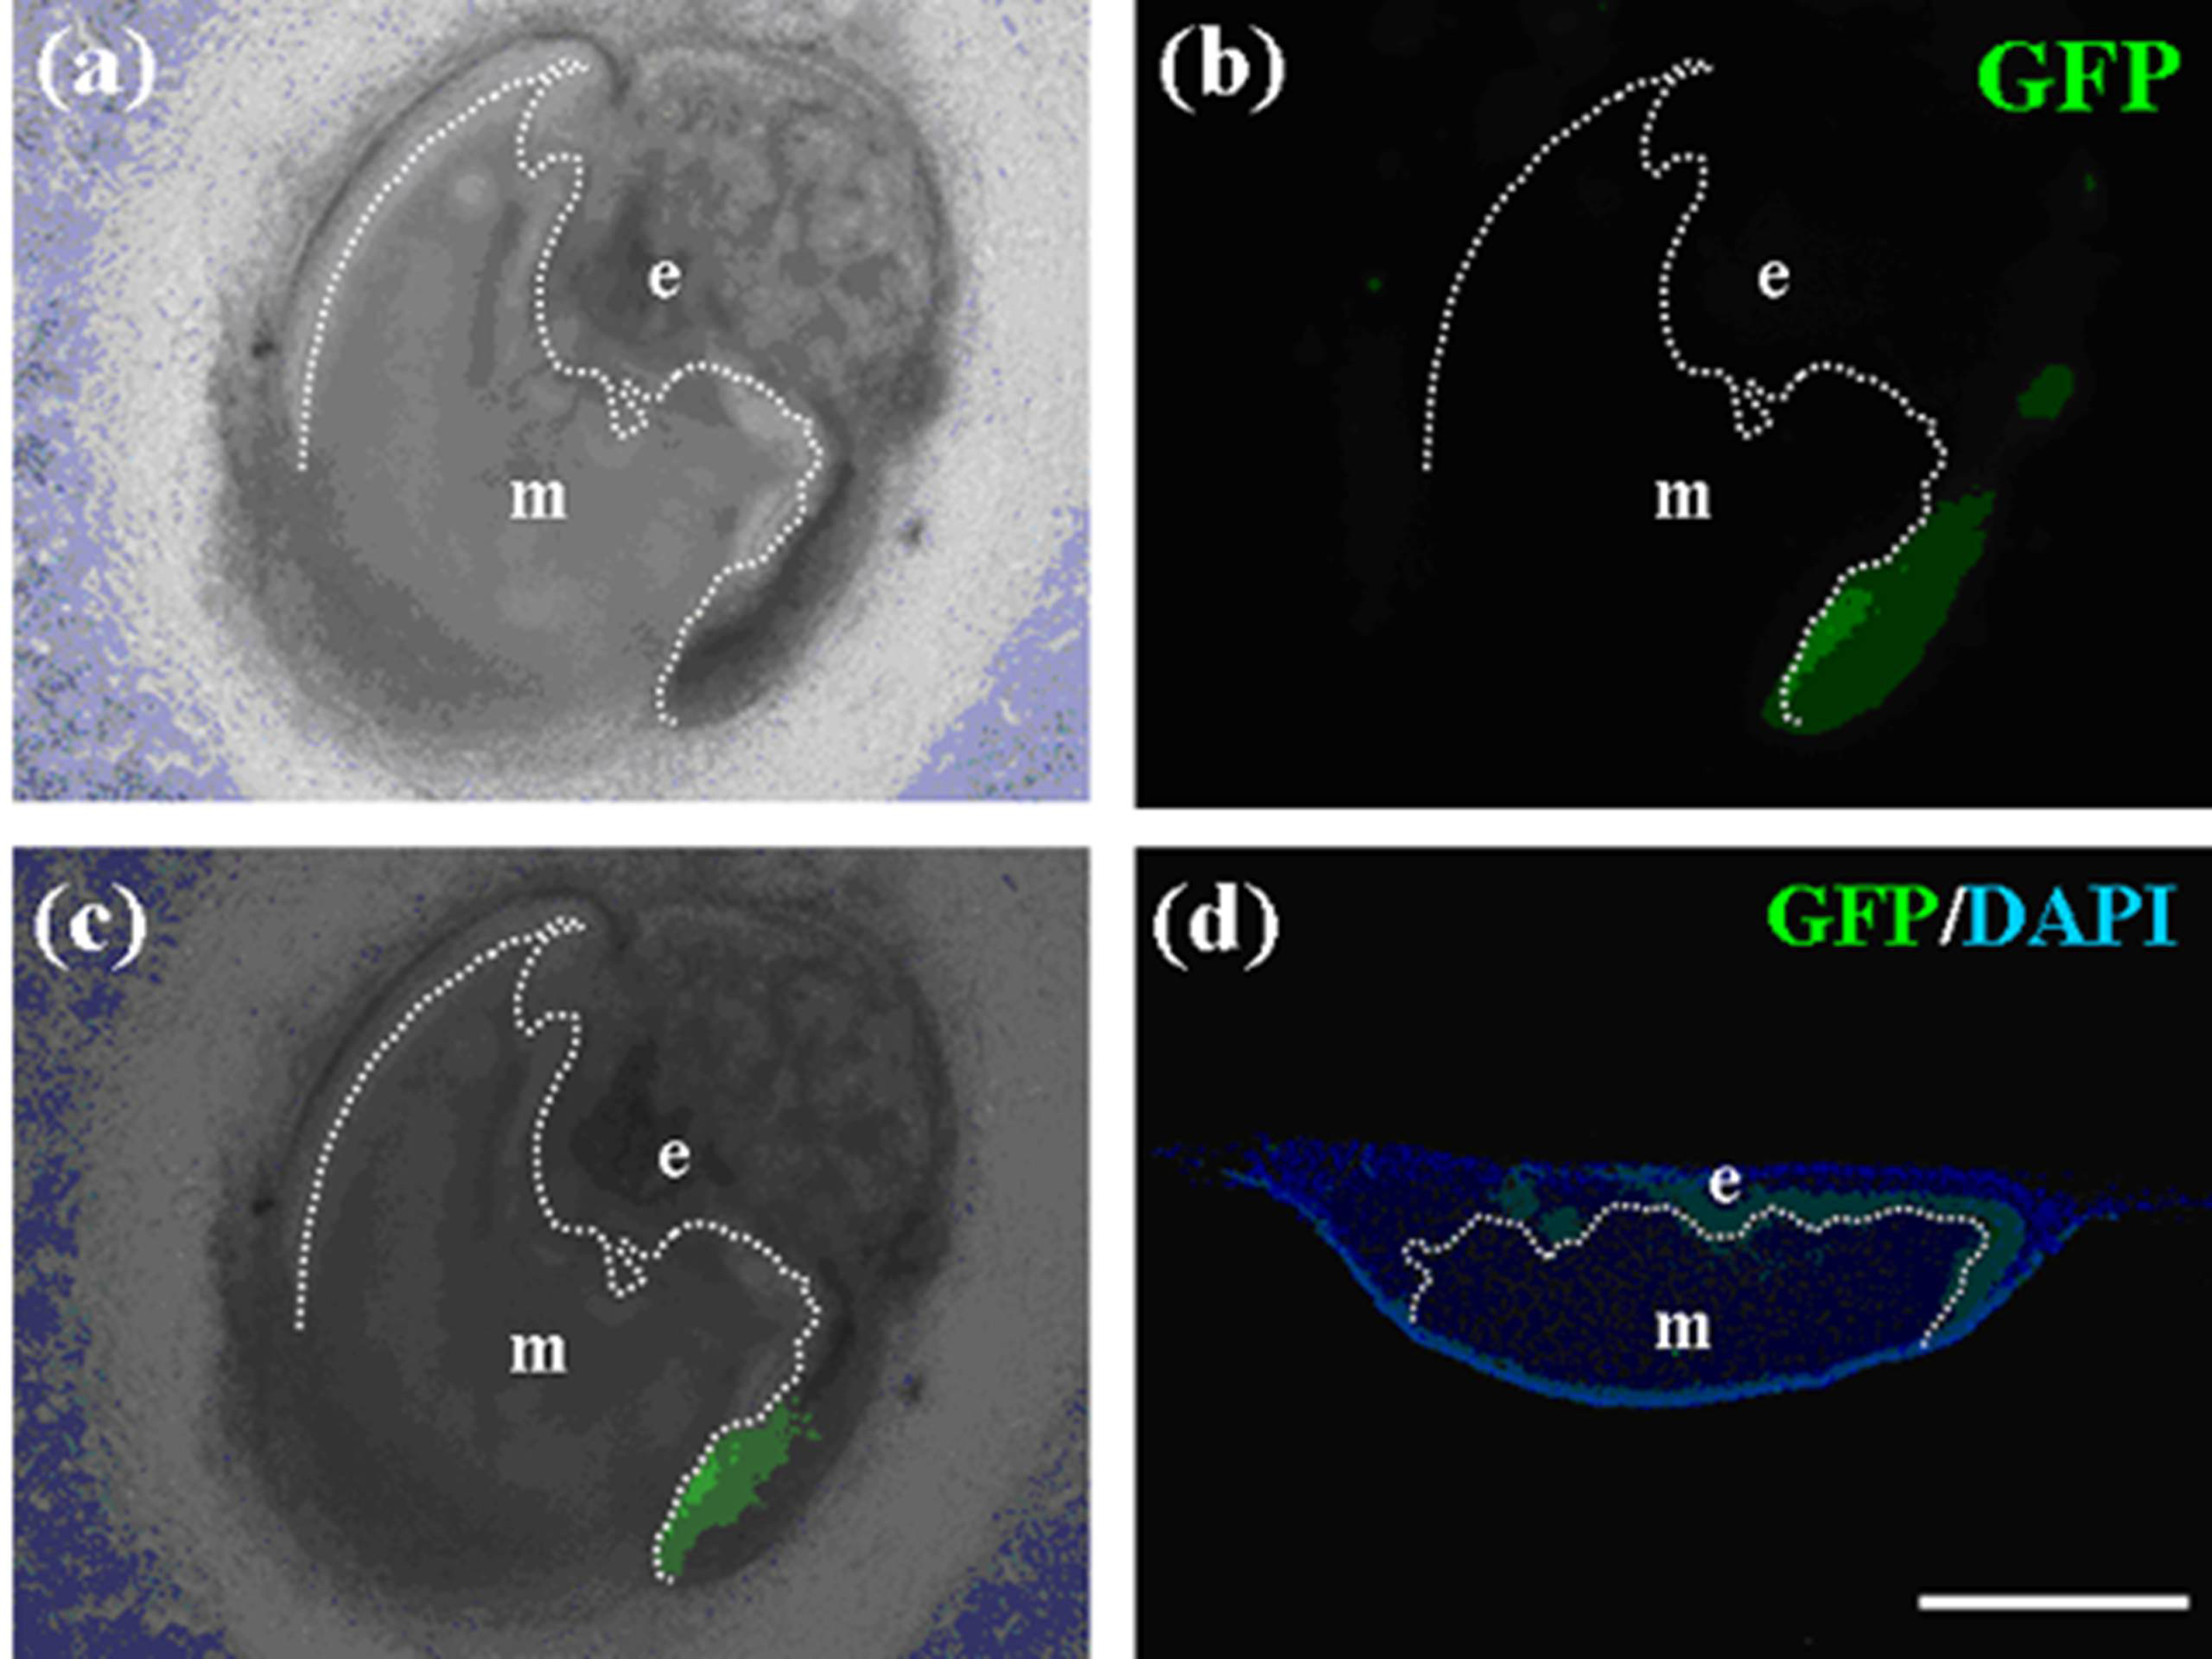
To examine whether emtg-2 cells contribute to the ameloblast layer, germs were prepared with GFP-labeled emtg-2 cells and EC (1:0.5) and with MT, and cultured on inserts. emtg-2 cells were detected intermittently in elongated epithelial cells adjacent to the mesenchyme (
Figure 5a and b). Amelogenin protein was detected in cells in GFP-positive regions (
Figure 5c and d) of serial section. The results demonstrated that emtg-2 cells were involved in the formation of the ameloblast layer and differentiated to ameloblasts.
The enamel knot is believed to be a critical center of odontogenesis and is localized as a Shh-expressing spot [
27].
In-situ hybridization demonstrated that Shh expression was detected in germs after three days in culture (
Figure 6a). In addition, Shh-expressing cells were localized in GFP-labeled cell layers (
Figure 6b) of serial sections, strongly indicating that some of emtg-2 cells were actively participating in odontogenesis as members of enamel knot-composing cells.
Figure 5.
Localization of emtg-2 cells in constructed teeth. (a–d) Germs were prepared with GFP-labeled emtg-2 cells and EC (1:0.5) and MT, and cultured on inserts for seven days. Constructed teeth were subjected to immunohistochemistry. (a,b) GFP-labeled emtg-2 cells (green) were localized in the dental epithelium and inner enamel epithelium (arrows). (c,d) GFP-labeled emtg-2 cells (green) in the inner enamel epithelium expressed amelogenin protein (red) (arrowheads). (c) and (d) are serial samples. (e,f) Germs reconstructed with emtg-2 cells and MT were cultured for three and seven days, respectively. All scale bars are 100 μm. Nuclei were stained with DAPI (blue).
Figure 6.
Shh expression in germs reconstructed with emtg-2 cells and EC (1:0.5) and MT and cultured for three days. (a) Shh expression (in-situ hybridization) was encircled with broken lines and pointed with arrows. (b) Immunohistochemistry with anti-GFP antibody localized emtg-2 cells (green) in the serial section, overlapping Shh expression. Scale bar is 100 μm and (b) is at the same magnification.
2.1.7. Gene Expression Patterns were Compared between Tooth Germs Prepared with and without EC.
On culture inserts, germs were reconstructed with a mixture of emtg-2 cells and EC (ratio = 1:1~0.5) and with MT developed teeth at 100%, but none of the germs without EC developed a tooth. In order to understand the microenvironments in the epithelial compartments of germs, gene expression patterns in emtg-2 cells adjacent to MT were compared between germs reconstructed with and without EC. Morphogenetic genes such as Shh, Lef1 are expressed for a relatively long period. Instead, the genes expressed transiently in germs would precisely reveal the stages of germs. Therefore, the following genes were selected:
Netrin3,
Fgf9,
Notch1,
Oasis,
N-myc,
Dlx3,
Bmp5 and
amelogenin (
Table 5) [
28,
29,
30,
31,
32,
33,
34,
35,
36,
37].
Table 5.
Summary of gene expression pattern in the inner enamel epithelium at developmental stages (
in-situ hybridization [
38])
Table 5.
Summary of gene expression pattern in the inner enamel epithelium at developmental stages (in-situ hybridization [38])
| | initi. | bud | cap | bell | diff. | Sec. |
|---|
| Netrin3 | + | − | − | − | N.D. | N.D. |
| Fgf9 | + | + | − | + | − | − |
| Notch1 | + | + | − | + | − | − |
| Oasis | − | − | + | + | + | − |
| N-myc | N.D. | N.D. | + | − | N.D. | N.D. |
| Dlx3 | − | − | − | + | + | N.D. |
| Bmp5 | − | − | − | − | + | + |
| amelogenin | N.D. | N.D. | N.D. | − | − | + |
After one to two days in culture, germs reconstructed with EC and MT (positive controls) took the same gene expression pattern as observed at the initiation stage (
Figure 8 and
Table 6). Germs reconstructed with mixed epithelial cells (emtg-2 cells: EC = 1:0.5) and with MT took a similar gene expression pattern as observed in positive controls (
Figure 9, 12 and
Table 6) with slight difference in
Bmp5 expression; after three days in culture,
Bmp5 expression was detected in positive controls, but it was undetectable in germs reconstructed with mixed epithelial cells.
After one day in culture, germs reconstructed with only emtg-2 cells and MT took the gene expression pattern similar to that of bell stage (
Figure 10 and
Table 6). Gene expressions were compared among three groups of germs (emtg-2 cells: EC = 0:1, 1:0.5, 1:0) (
Figure 8,
Figure 9,
Figure 10,
Figure 11,
Table 6). Expressions of
Fgf9, Notch1, Oasis, N-myc and
Dlx3 were decreased in epithelial cells of germs (emtg-2 cells: EC = 0:1, 1:0.5), but not in germs (emtg-2 cells: EC = 1:0).
Figure 8.
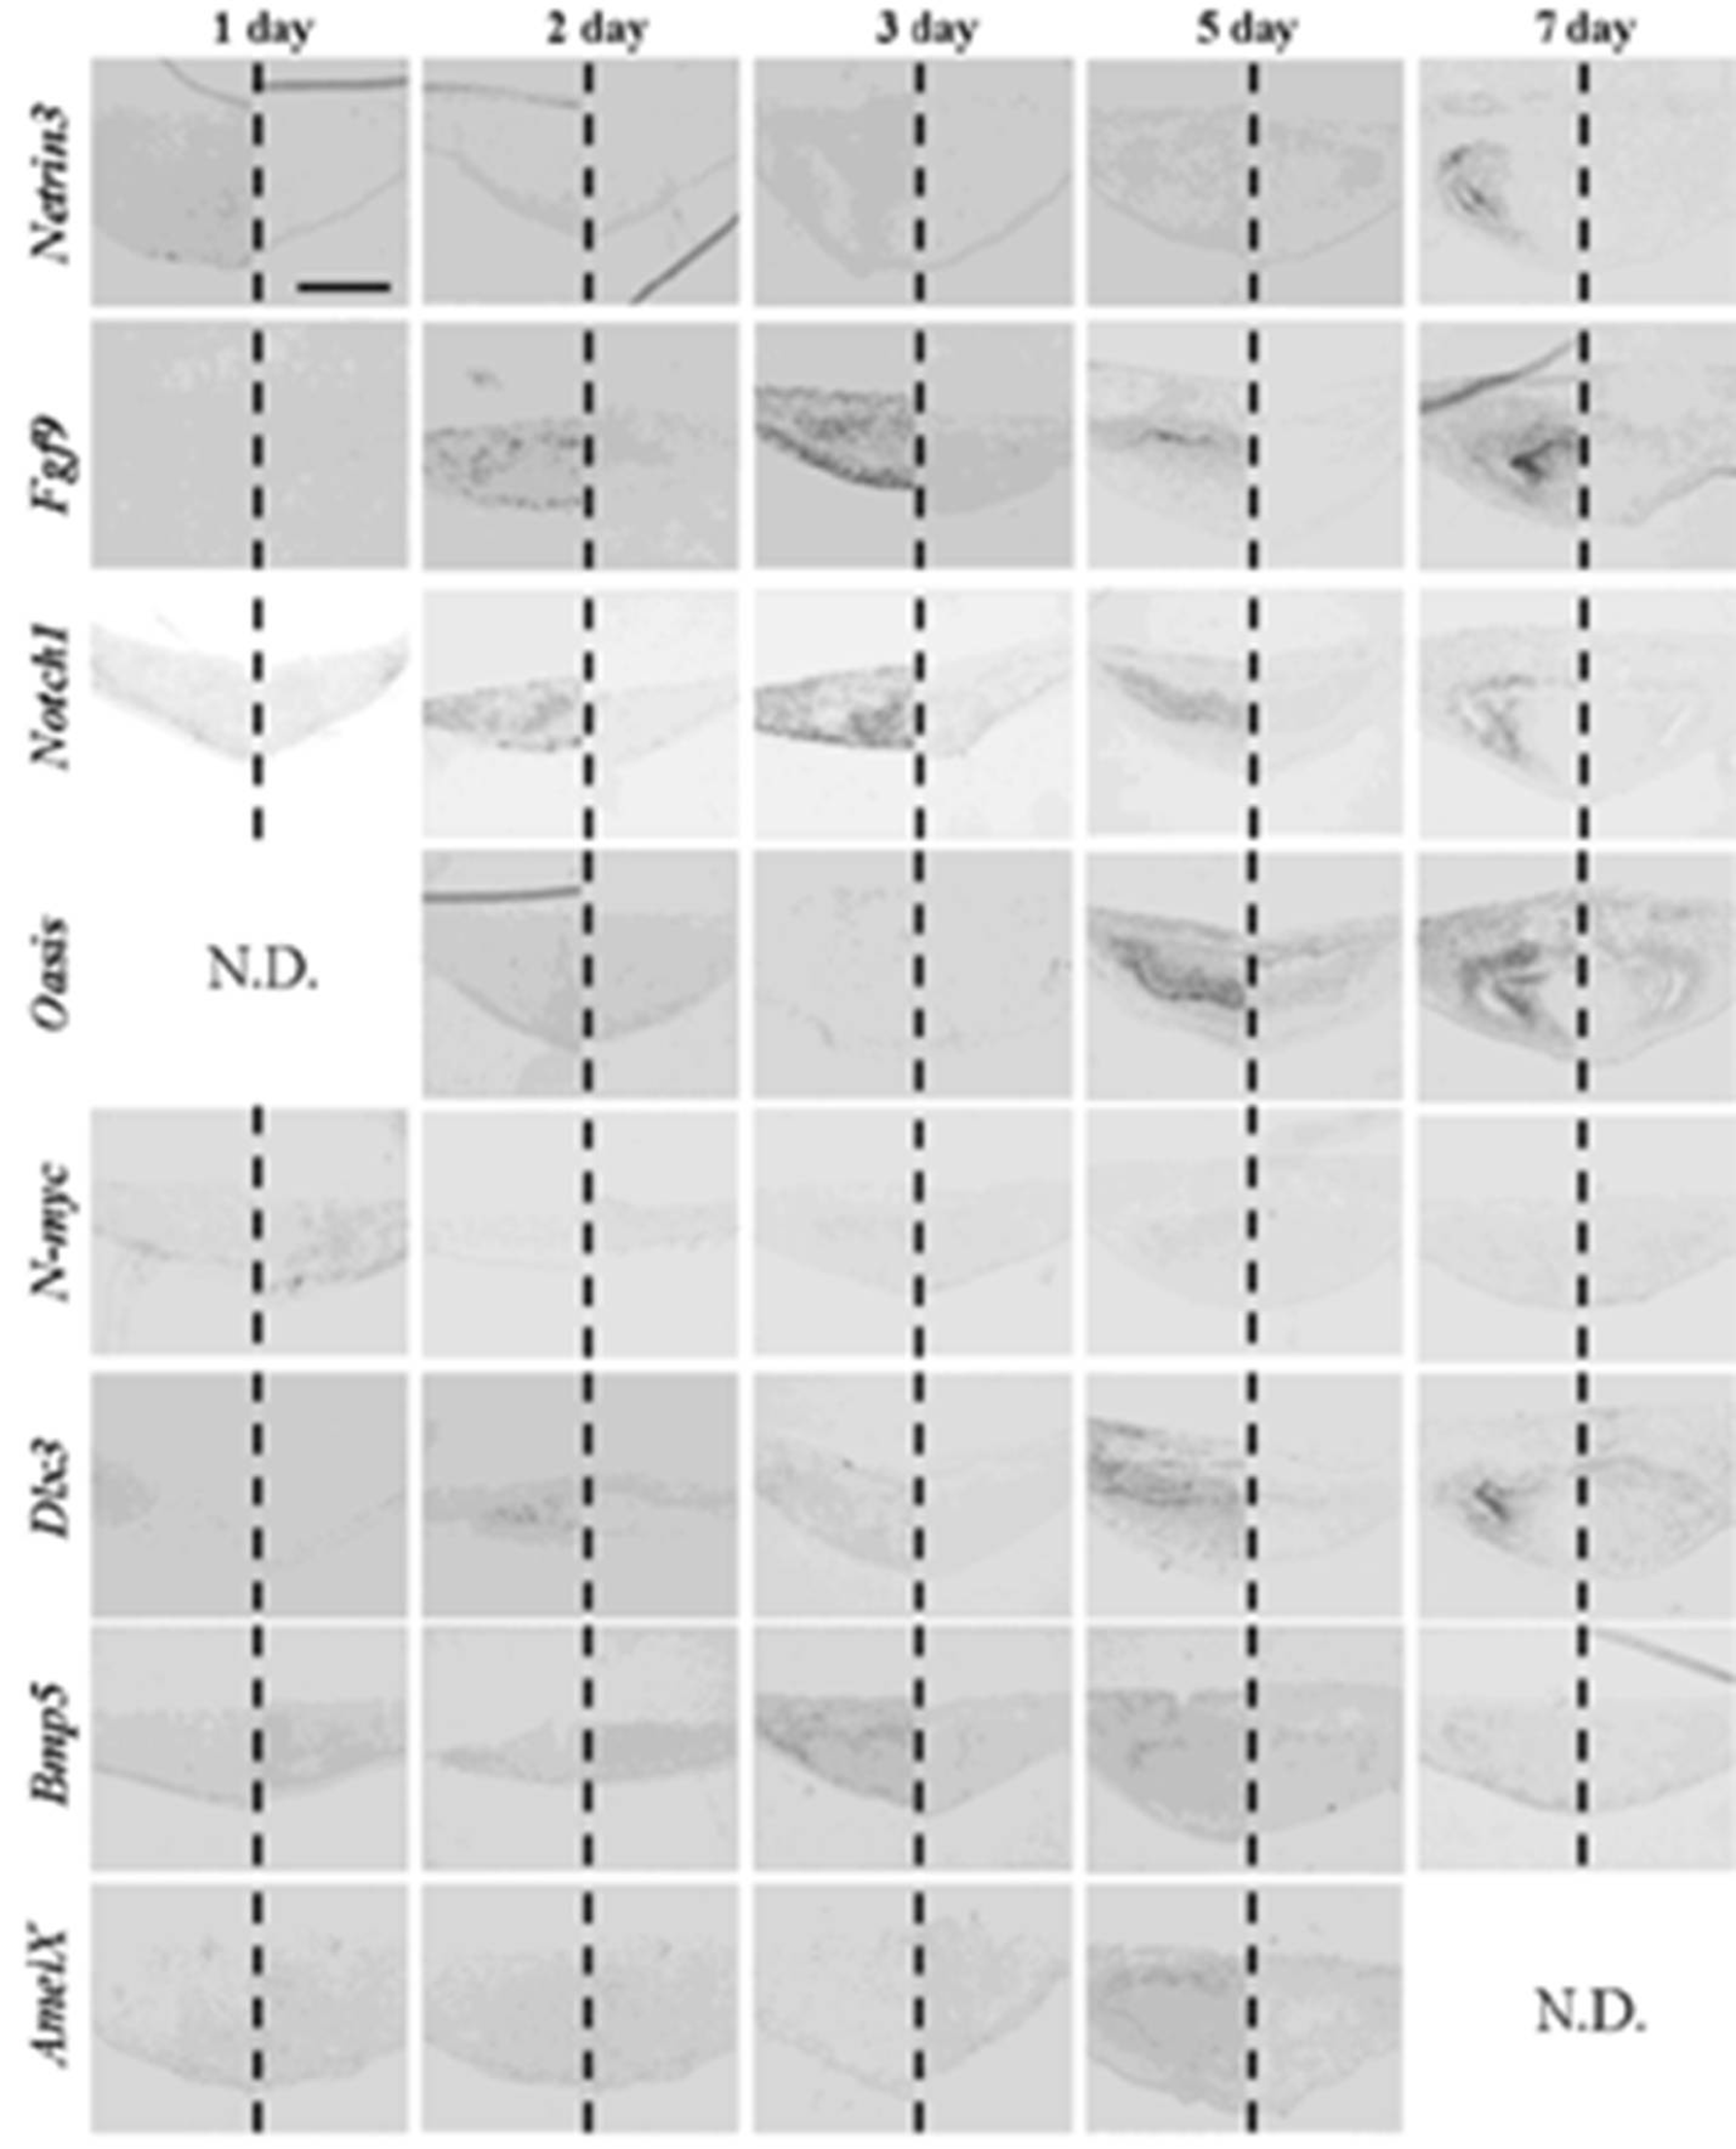
Gene expression pattern in germs reconstructed with EC and MT (positive control). Gene expressions were examined with in-situ hybridization with antisense probe in left and sense probe in right of each panel. Germs were cultured on inserts for one to seven days. Scale bar is 200 μm and all figures are at the same magnification.
Figure 8.
Gene expression pattern in germs reconstructed with EC and MT (positive control). Gene expressions were examined with in-situ hybridization with antisense probe in left and sense probe in right of each panel. Germs were cultured on inserts for one to seven days. Scale bar is 200 μm and all figures are at the same magnification.
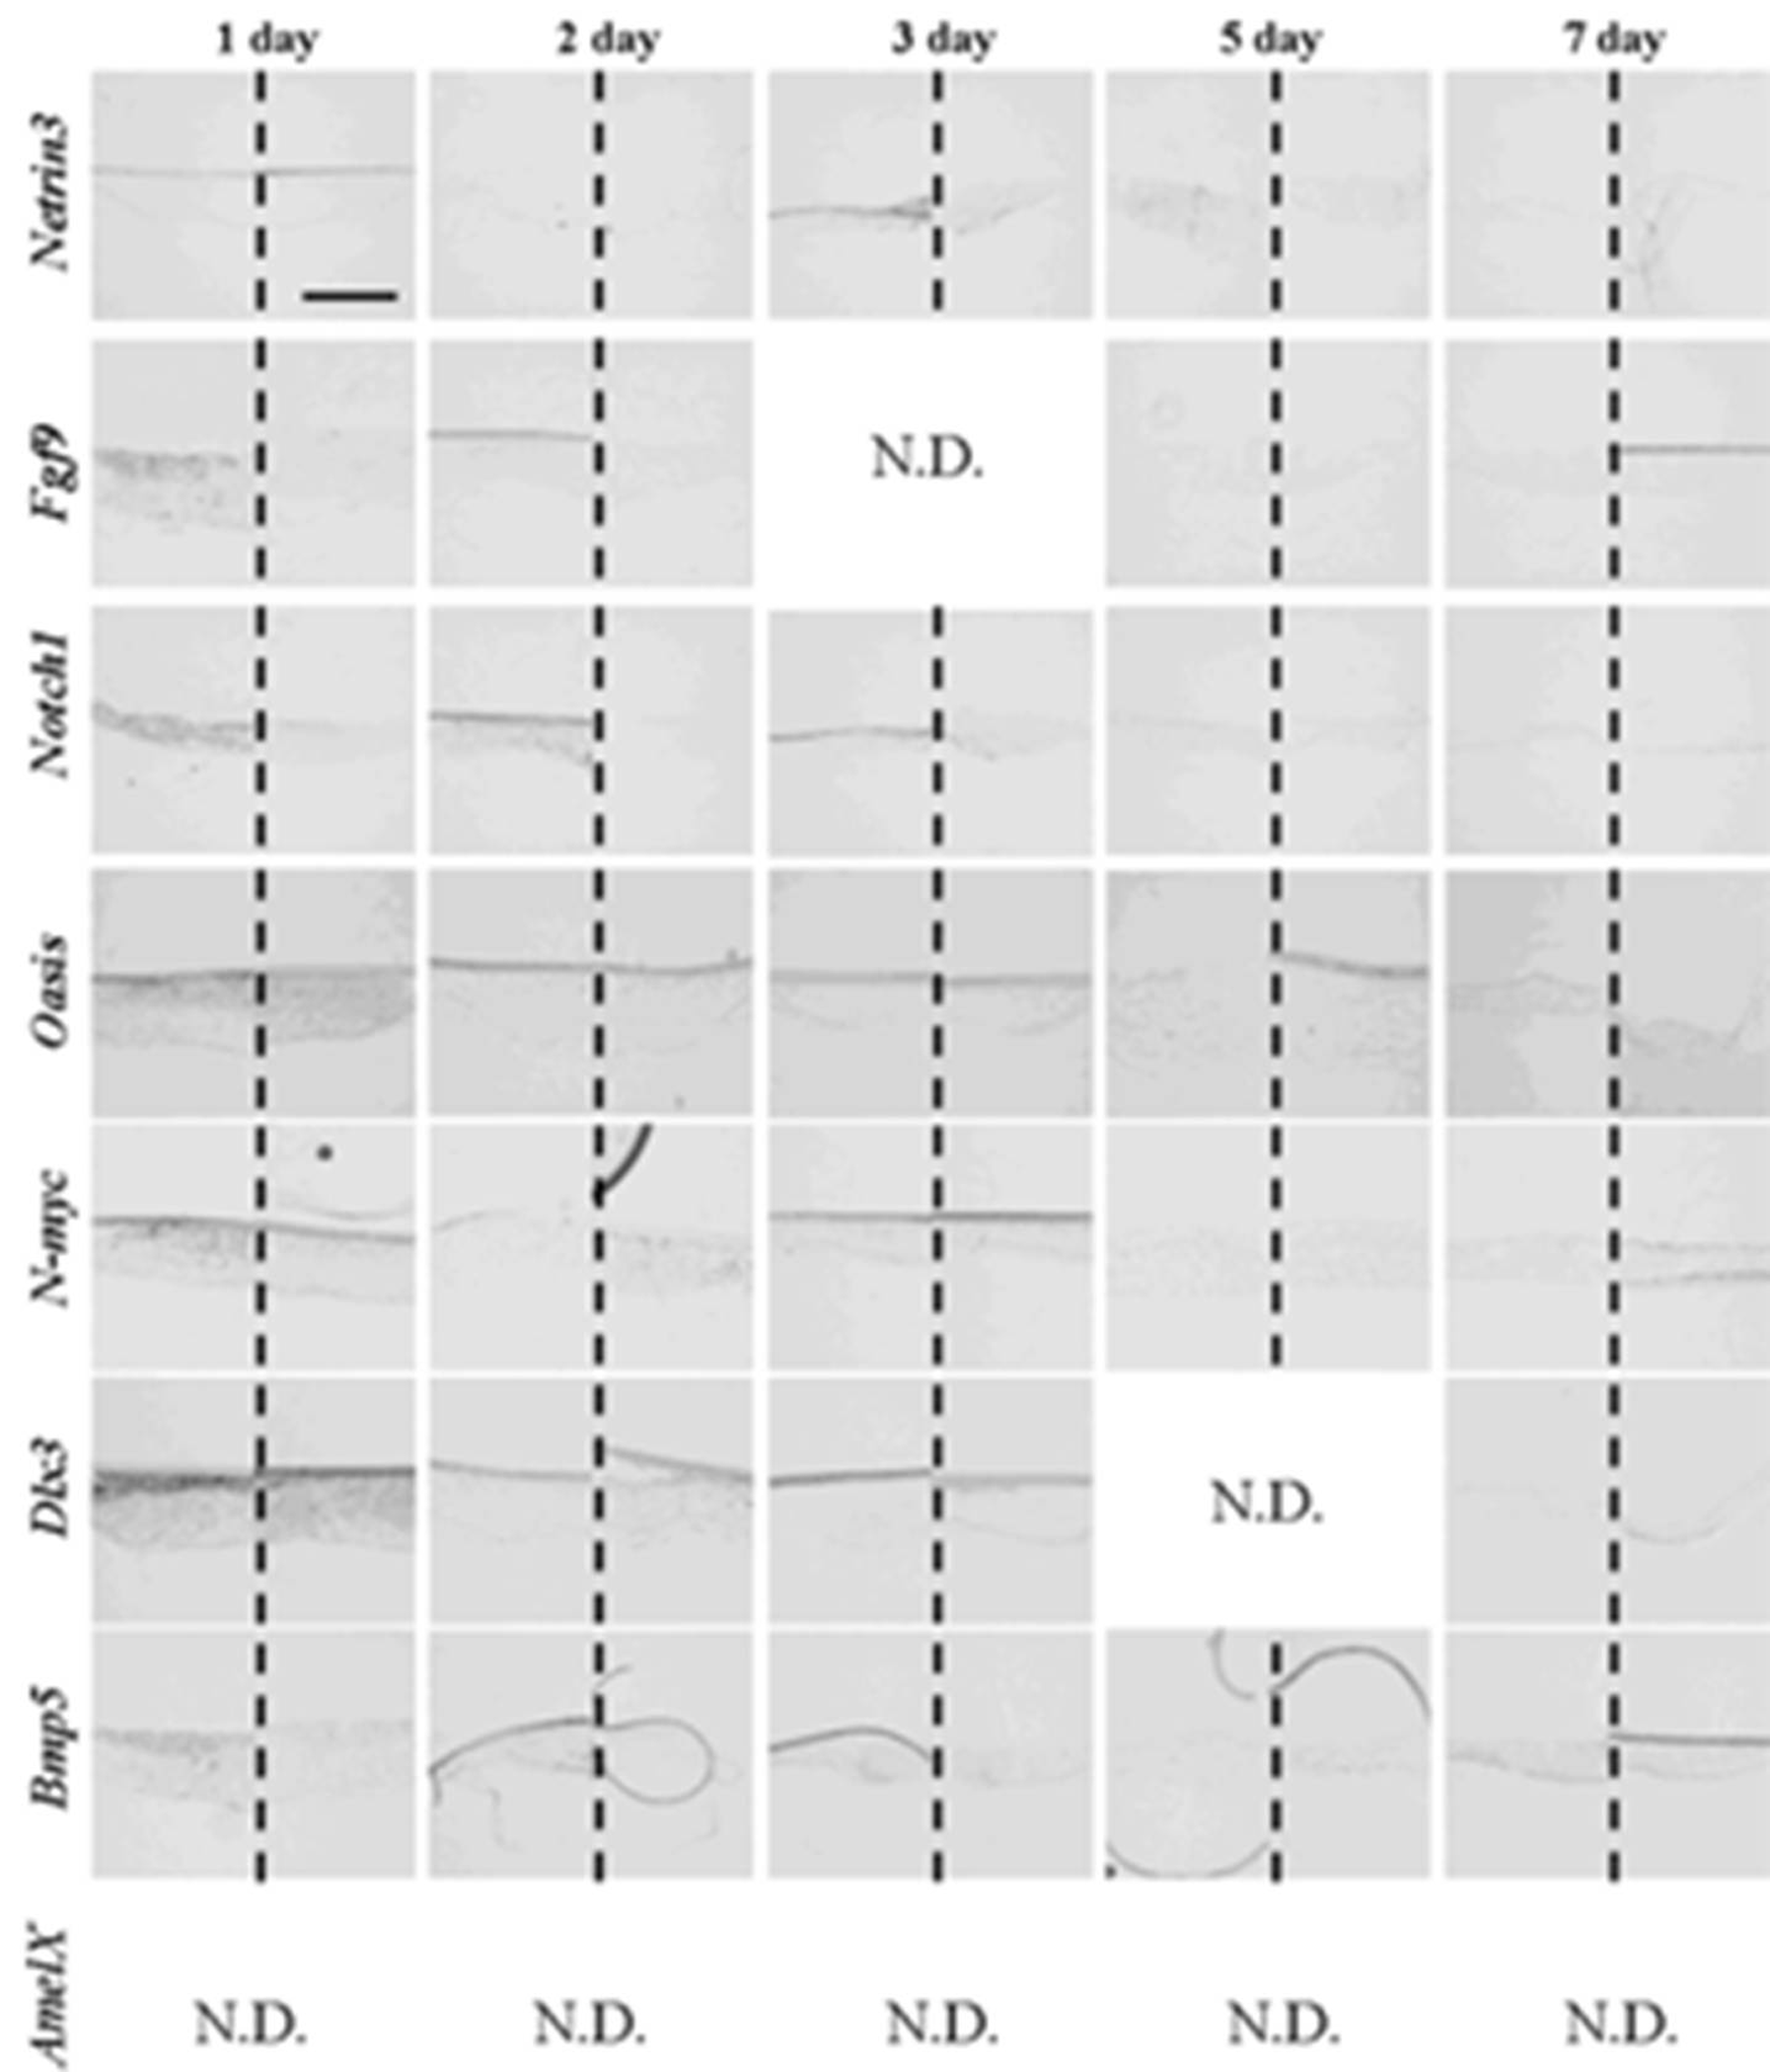
Figure 9.
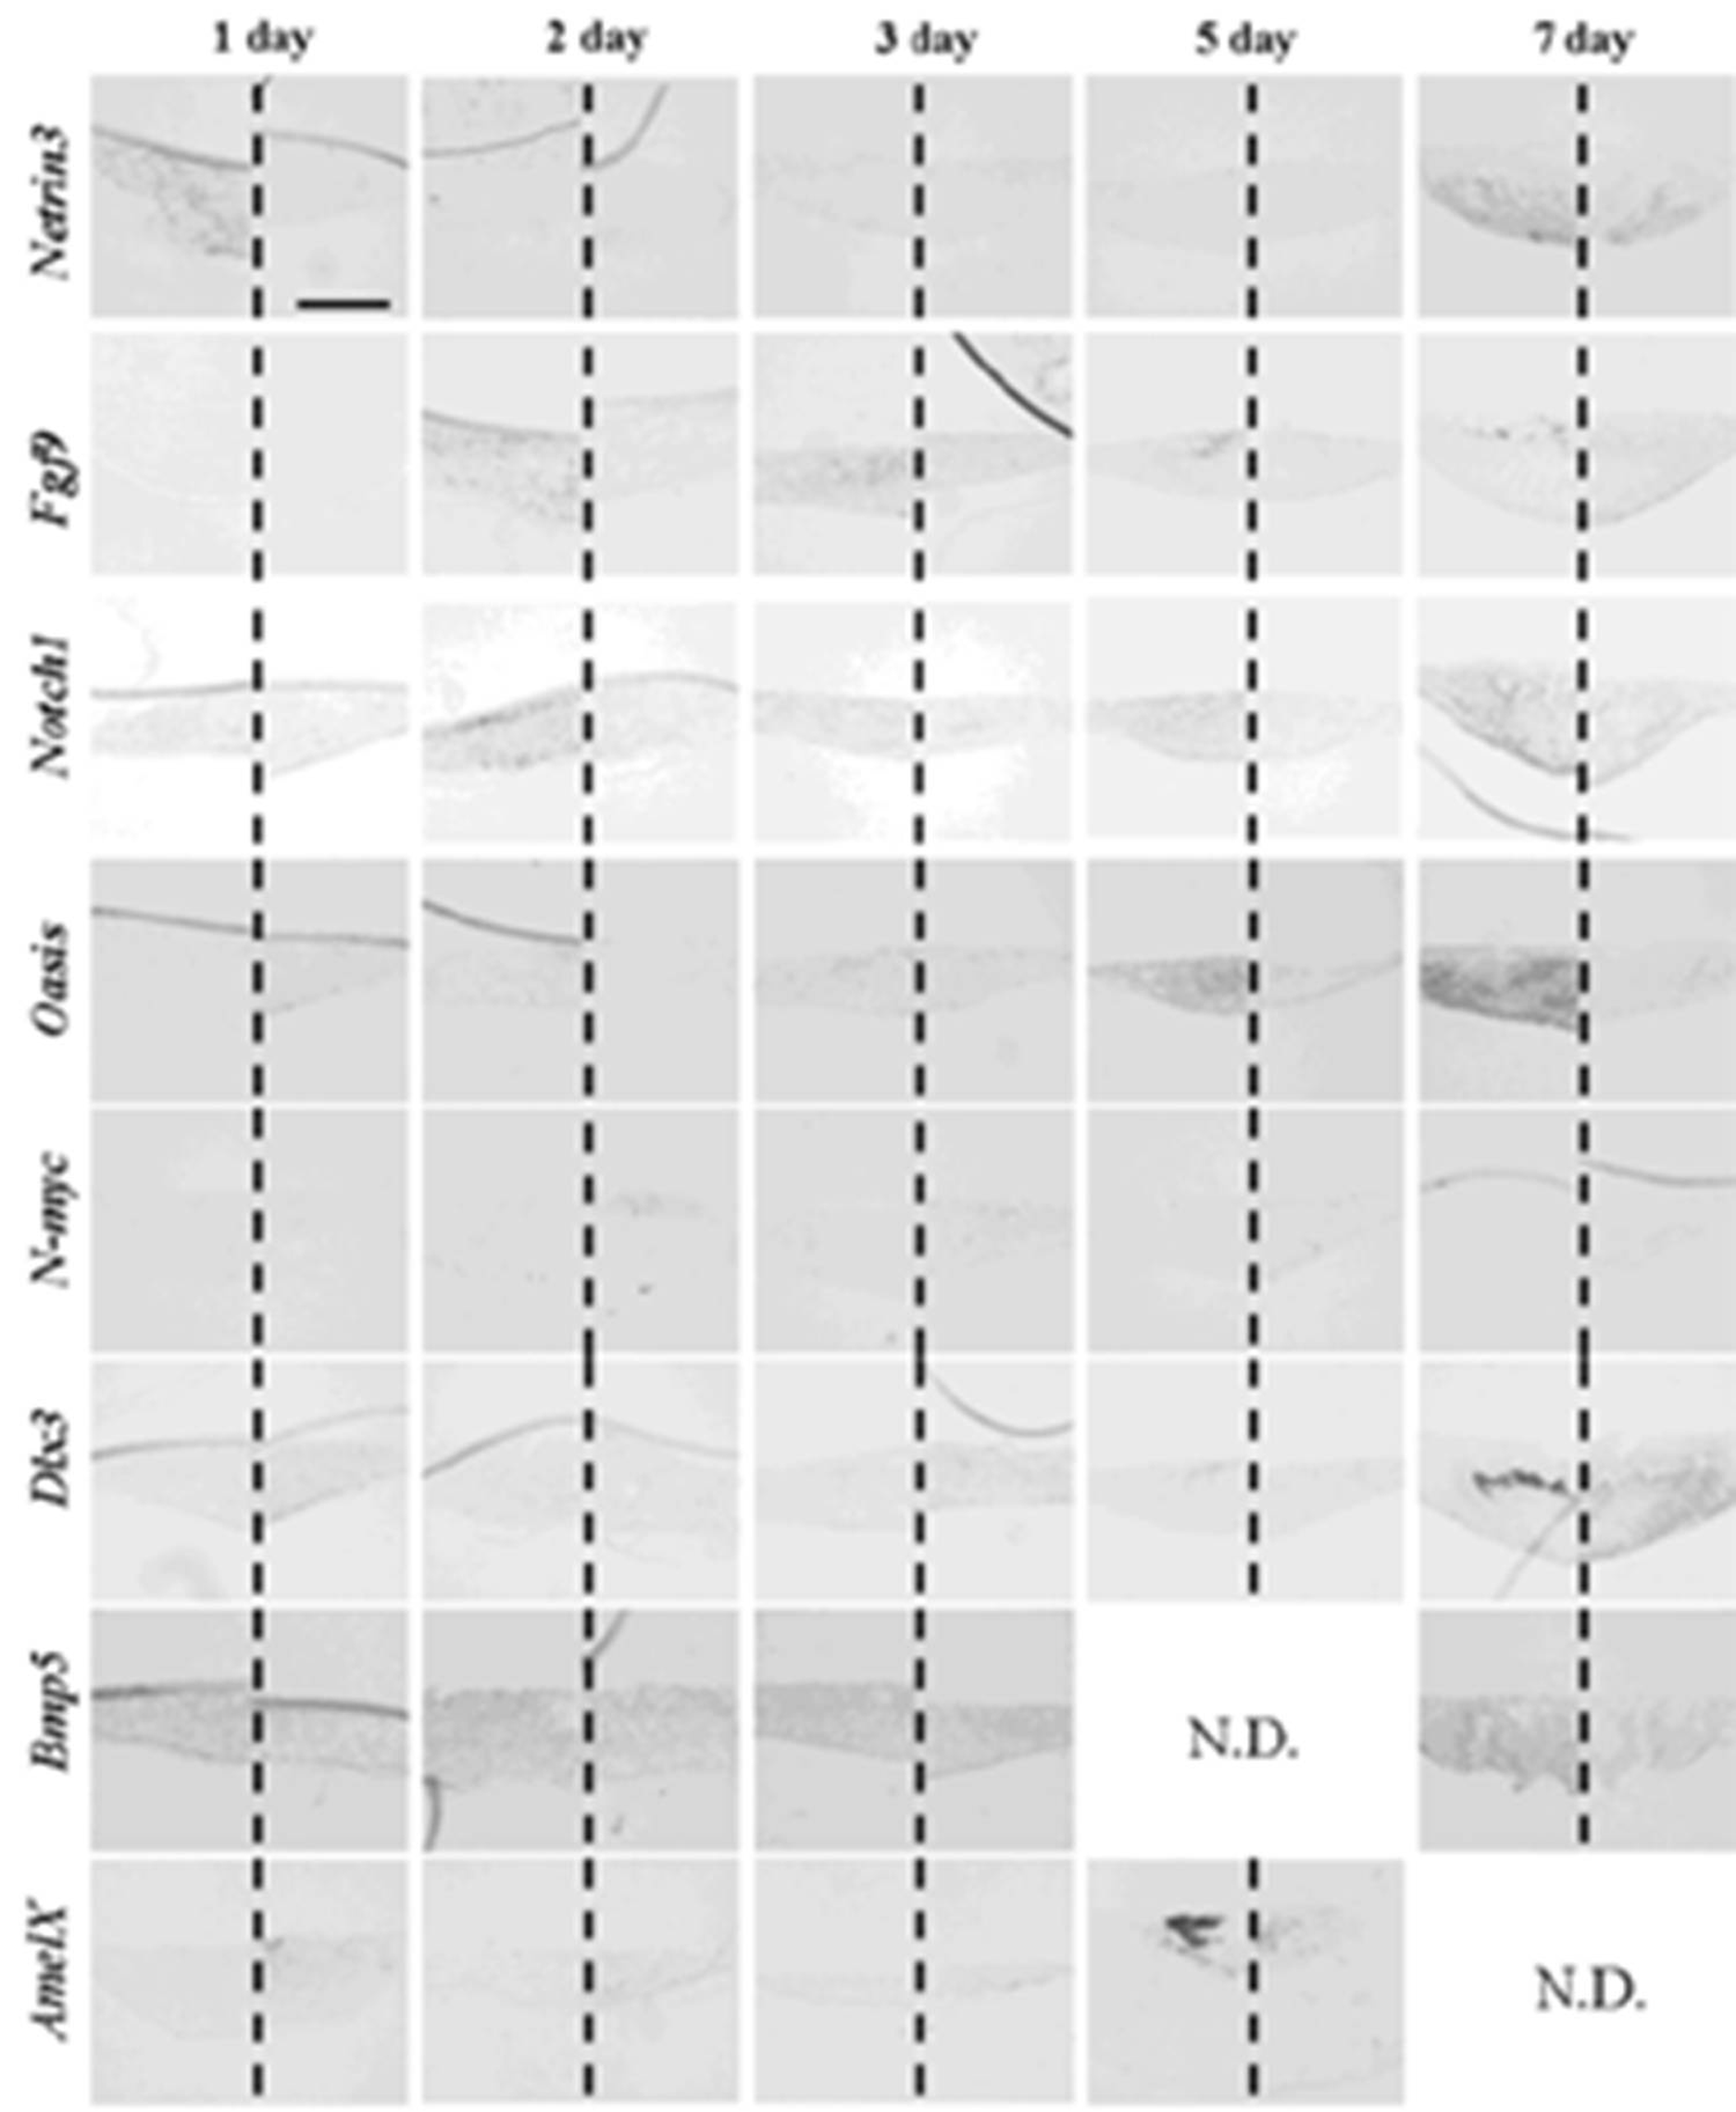
Gene expression pattern in germs reconstructed with emtg-2 cells and EC (1:0.5) and MT. Gene expressions were examined with in-situ hybridization with anti-sense probe in left and sense probe in right of each panel. Germs were cultured on inserts for one to seven days. Scale bar is 200 μm and all figures are at the same magnification.
Figure 9.
Gene expression pattern in germs reconstructed with emtg-2 cells and EC (1:0.5) and MT. Gene expressions were examined with in-situ hybridization with anti-sense probe in left and sense probe in right of each panel. Germs were cultured on inserts for one to seven days. Scale bar is 200 μm and all figures are at the same magnification.
Figure 10.
Gene expression pattern in germs reconstructed with emtg-2 cells and MT. Gene expressions were examined with in-situ hybridization with anti-sense probe in left and sense probe in right of each panel. Germs were cultured on inserts for one to seven days. Scale bar is 200 μm and all figures are at the same magnification.
Table 6.
Summary of gene expression patterns in reconstructed germs with EC and MT (positive control), emtg-2 cells and EC (ratio = 1:0.5) and MT, and emtg-2 cells and MT. Germs were cultured for one to seven days.
Table 6.
Summary of gene expression patterns in reconstructed germs with EC and MT (positive control), emtg-2 cells and EC (ratio = 1:0.5) and MT, and emtg-2 cells and MT. Germs were cultured for one to seven days.
| Positive Control |
|---|
| | 1d | 2d | 3d | 5d | 7d |
| Netrin3 | + | − | − | − | + |
| Fgf9 | − | + | + | + | + |
| Notch1 | − | + | + | + | + |
| Oasis | N.D. | − | − | + | + |
| N-myc | − | − | − | − | − |
| Dlx3 | − | − | − | + | + |
| Bmp5 | − | − | − | + | N.D. |
| amelogenin | N.D. | N.D. | N.D. | - | - |
| Emtg-2:EC = 1:0.5 |
| | 1d | 2d | 3d | 5d | 7d |
| Netrin3 | + | − | − | − | + |
| Fgf9 | − | + | + | + | + |
| Notch1 | − | + | + | + | + |
| Oasis | − | − | − | + | + |
| N-myc | − | − | − | − | − |
| Dlx3 | − | − | − | + | + |
| Bmp5 | − | − | − | N.D. | + |
| amelogenin | − | − | −. | + | N.D. |
| Emtg-2:EC = 1:0 |
| | 1d | 2d | 3d | 5d | 7d |
| Netrin3 | − | − | − | − | − |
| Fgf9 | + | − | N.D. | − | − |
| Notch1 | + | + | − | − | − |
| Oasis | + | − | − | − | − |
| N-myc | + | − | − | − | − |
| Dlx3 | + | − | − | N.D. | − |
| Bmp5 | − | − | − | − | − |
| amelogenin | N.D. | N.D. | N.D. | N.D. | N.D. |
Figure 11.
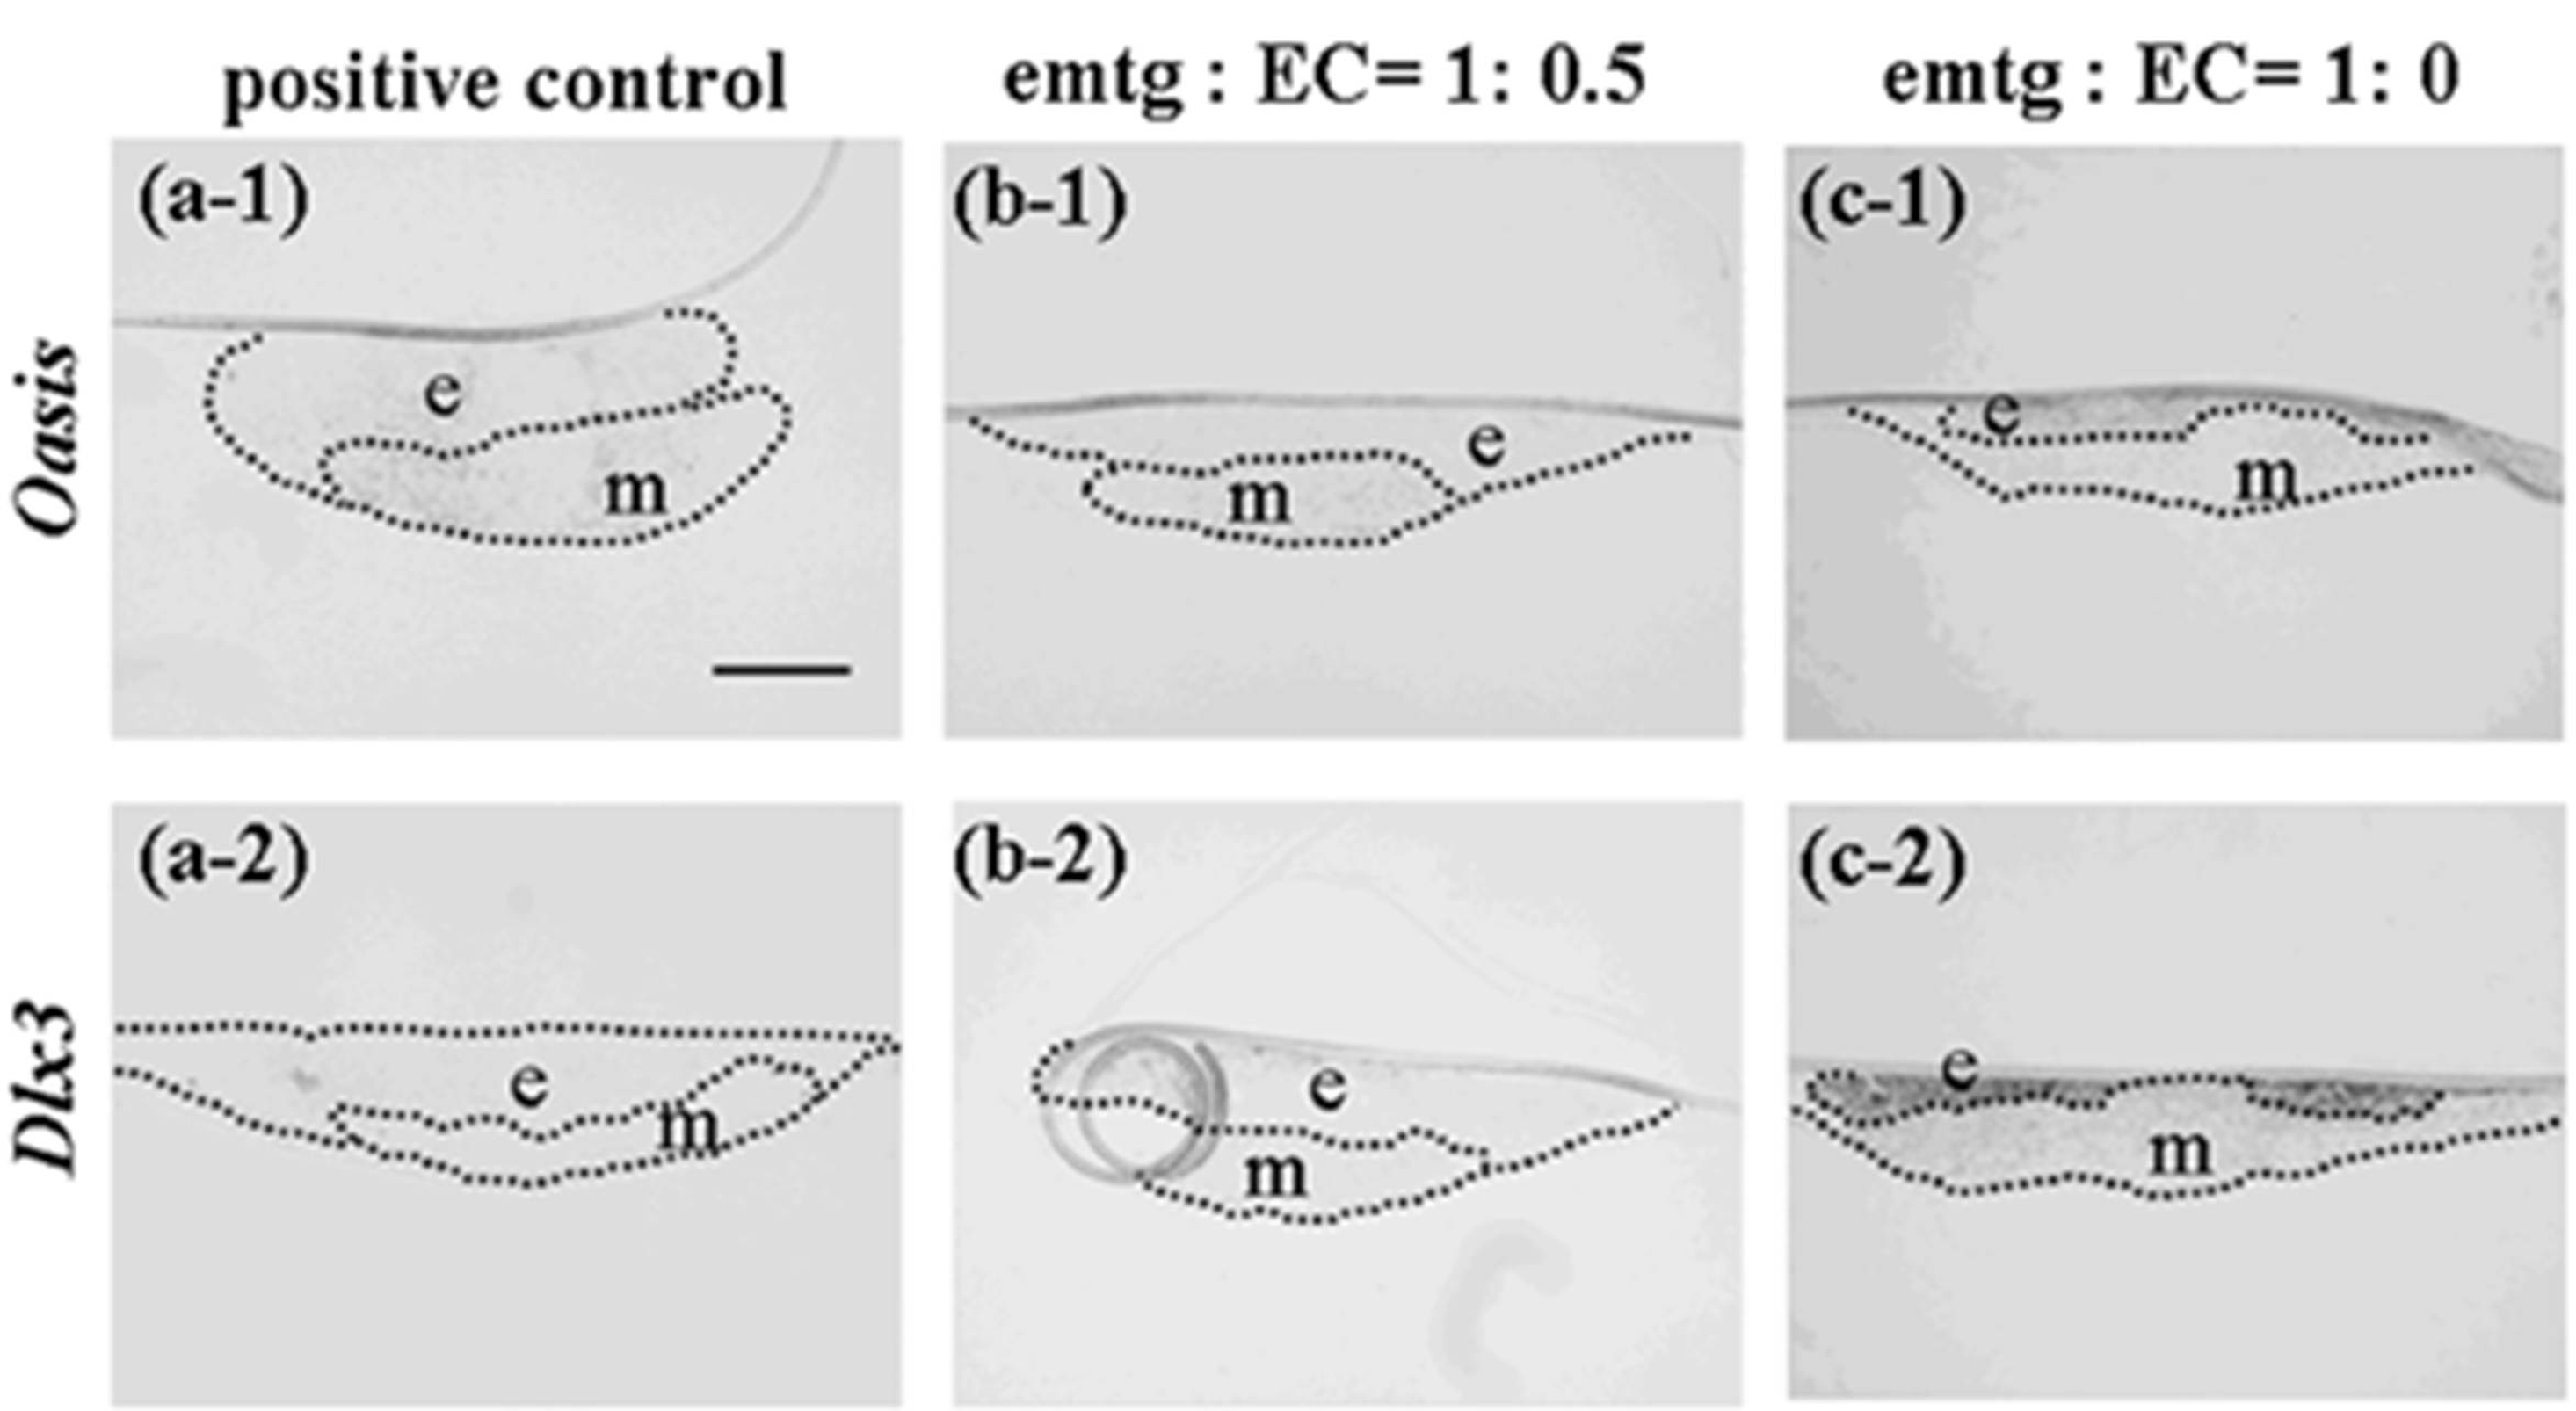
Expressions of Oasis and Dlx3 at a high magnification in germs cultured for one day. (a-1, 2) In-situ hybridization in reconstructed germs with EC and MT (positive control). (b-1, 2) In-situ hybridization in reconstructed germs with emtg-2 cells and EC (1:0.5) and MT. (c-1, 2) In-situ hybridization in reconstructed germs with emtg-2 cells and MT. (a-1, b-1, c-1) Expression of Oasis in reconstructed germs. (a-2, b-2, c-2) Expression of Dlx3 in reconstructed germs. e: epithelium, m: dental mesenchyme. Scale bar is 200 μm in (a-1) and all figures are at the same magnification.
Figure 11.
Expressions of Oasis and Dlx3 at a high magnification in germs cultured for one day. (a-1, 2) In-situ hybridization in reconstructed germs with EC and MT (positive control). (b-1, 2) In-situ hybridization in reconstructed germs with emtg-2 cells and EC (1:0.5) and MT. (c-1, 2) In-situ hybridization in reconstructed germs with emtg-2 cells and MT. (a-1, b-1, c-1) Expression of Oasis in reconstructed germs. (a-2, b-2, c-2) Expression of Dlx3 in reconstructed germs. e: epithelium, m: dental mesenchyme. Scale bar is 200 μm in (a-1) and all figures are at the same magnification.
The in-situ hybridization analyses clearly demonstrated that addition of EC to the epithelial compartment changed the gene expression pattern of reconstructed germs, supporting the hypothesis that the dental program in emtg-2 cells was canceled by mixing with EC.
2.1.8. Was the Reprogramming of emtg-2 cells Caused Directly by EC or Indirectly by EC Through MT?
It is well established that tissue interactions between epithelial and mesenchymal compartments drive organogenesis. In addition, cellular interactions in each compartment may be critical in odontogenesis. To examine whether EC have direct effects on gene expression of emtg-2 cells, dental germs were prepared with a modified method; the epithelial compartment was composed of a pellet of emtg-2 cells (1.5 × 10
4 cells) and a pellet of EC (1.5 × 10
4 cells), sitting in parallel on MT. In a regular germ, a pellet containing homogeneously the two epithelial populations (3 × 10
4 cells/germ) was sitting on MT (See
Figure 12 a-3, b-3, c-3). The modified germs were cultured for one day and subjected to
in situ hybridization analysis.
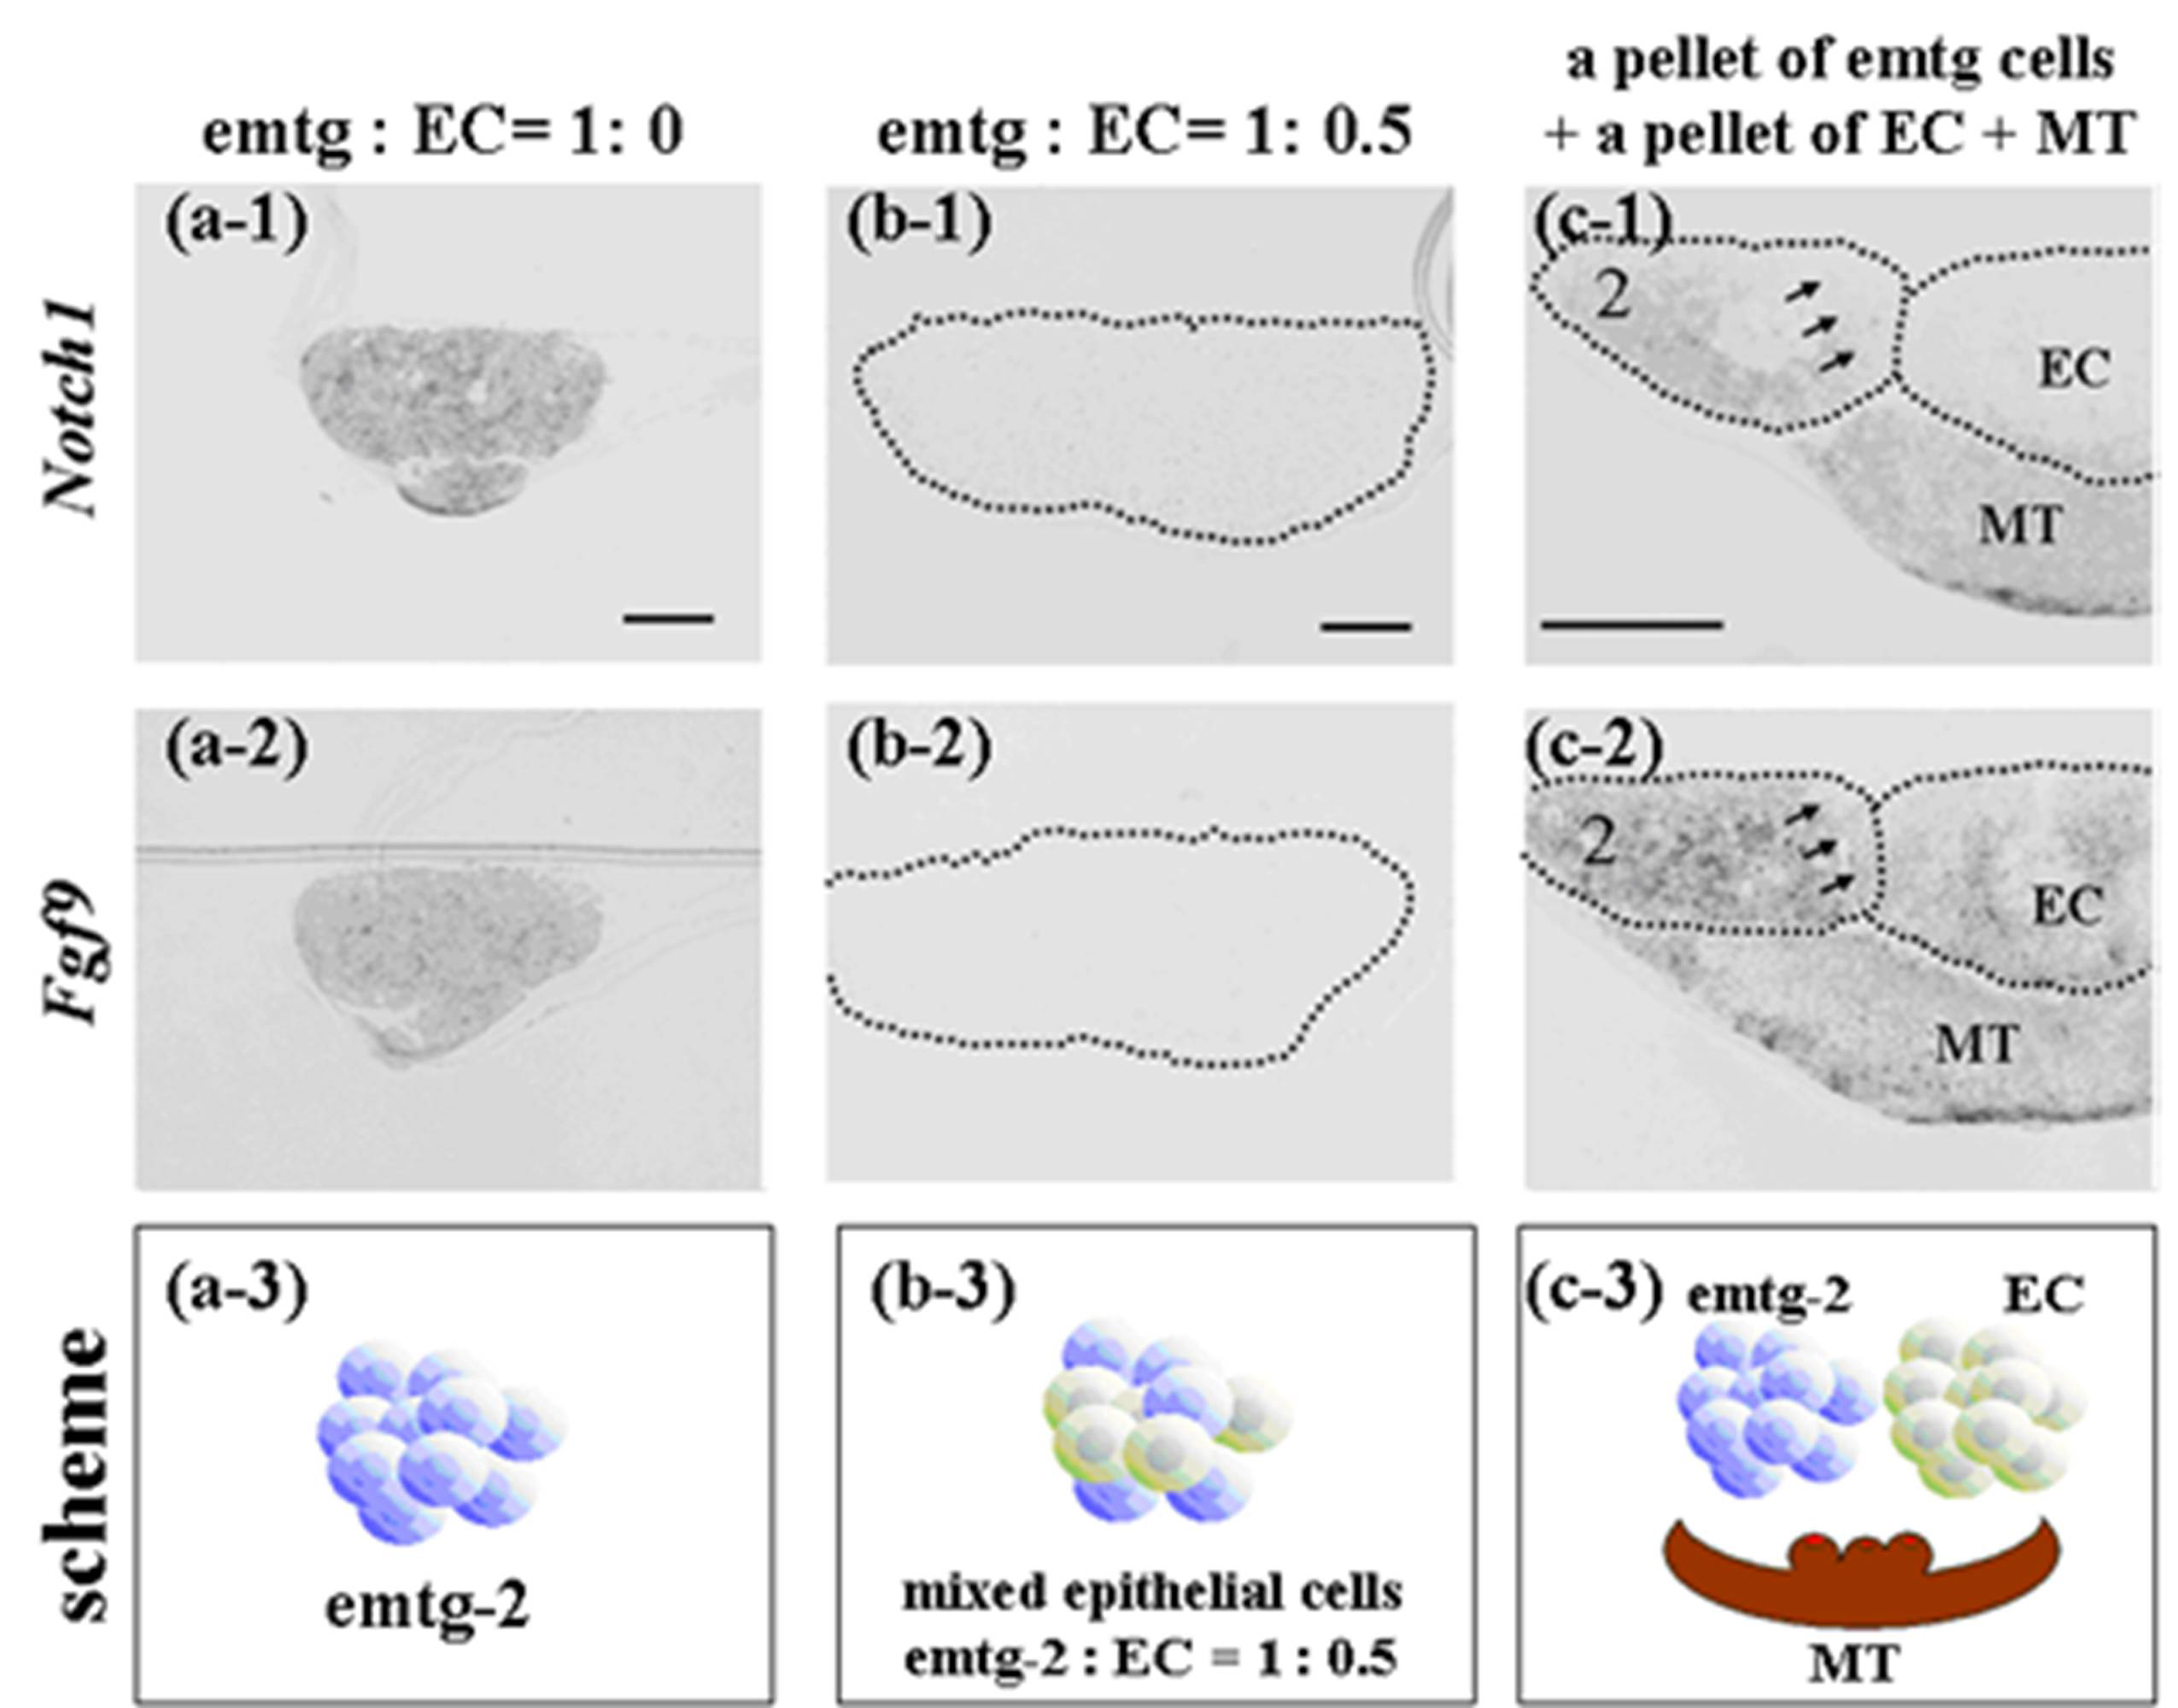
Expressions of
Notch1 and
Fgf9 were detected in pellets containing only emtg-2 cells (
Figure 12a), but not in pellets containing emtg-2 cells and EC (1:0.5) (
Figure 12b). Interestingly, in the modified germs, expressions of
Notch1 and
Fgf9 were reduced in emtg-2 cells facing the EC (
Figure 12c), but not in emtg-2 cells facing MT, and emtg-2 cells were localized in a right cervical loop area after seven days in culture (
Figure 13). These observations suggested that cancellation of the developmental program of emtg-2 cells was induced directly by EC.
Figure 12.
In-situ hybridization of Notch1 and Fgf9 in germs reconstructed with a modified method and cultured for one day. (a-1, 2) Gene expression in a pellet of emtg-2 cells. (b-1, 2) Gene expression in a pellet of emtg-2 cells and EC (1:0.5). (c-1, 2) Gene expression in reconstructed germs with a pellet of emtg-2 cells and a pellet of EC and MT. (a-1, b-1, c-1) Expression of Notch1 in reconstructed germs. (a-2, b-2, c-2) Expression of Fgf9 in reconstructed germs. (a-3, b-3, c-3) Illustration of the modified method. 2: emtg-2 cells, EC: dental epithelial cells, MT: dental mesenchyme. Scale bars are 100 μm in (a-1 and b-1) and (a-1, a-2, b-1 and b-2) are at the same magnification. Scale bar is 200 μm in (c-1) and (c-2) is at the same magnification.
Figure 13.
Immunohistochemistry of teeth developed from germs cultured for seven days. (a) Bright field photo of a constructed tooth with a pellet of GFP-labeled emtg-2 cells and a pellet of EC and with MT. (b) Immunohistochemistry with anti-GFP antibody detected GFP-labeled cells in an enamel organ (green). (c) (a) and (b) were marged. GFP-labeled emtg-2 cells were detected in cervical loop area. (d) Immunohistochemistry with anti-GFP antibody detected GFP-labeled cells in epithelium at right side in the section of (a). Nuclei were stained with DAPI (blue) in (d). dot line; basement membrane, e: epithelium, m: mesenchyme. Scale bar is 500 μm in (d) and all figures are at the same magnification.

