
Widespread Alternative Splicing Changes in Metastatic Breast Cancer Cells

 , ,
, ,  and
and 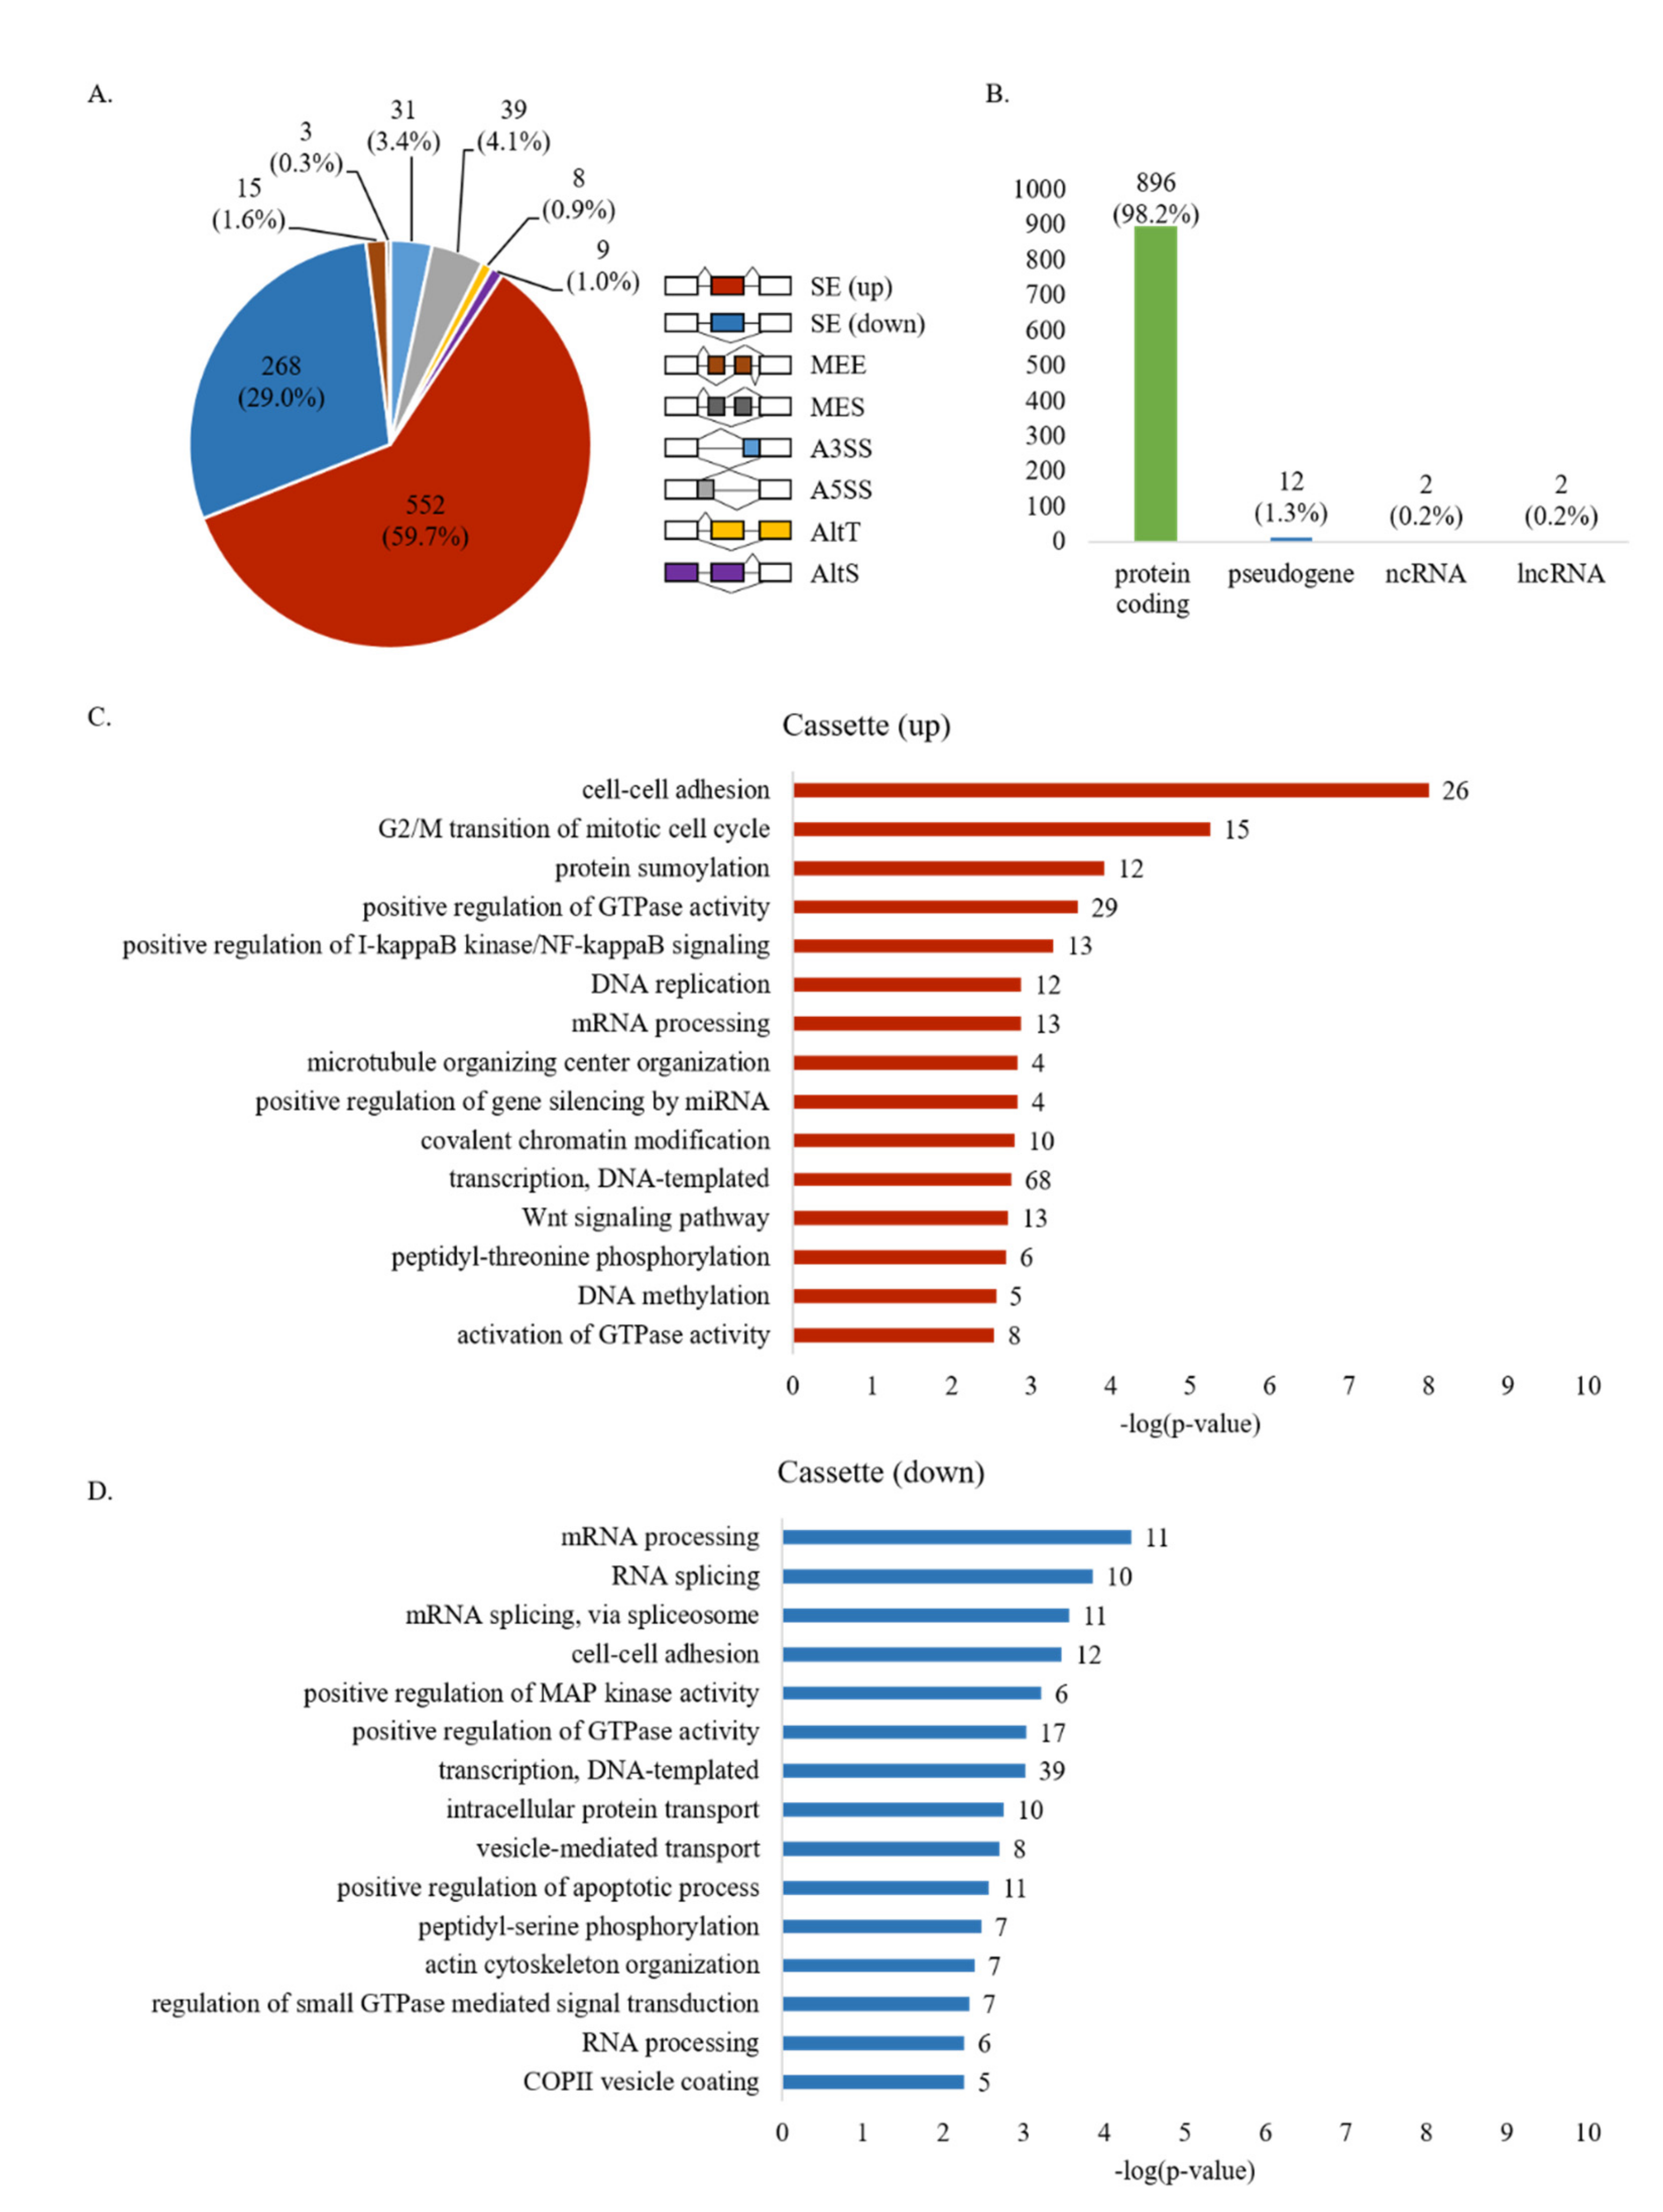
Abstract
1. Introduction
2. Materials and Methods
2.1. Cell Culture, RNA Extraction, and RT-PCR
2.2. Alternative Splicing Analysis with RASL-Seq
2.3. Gene Ontology (GO) Analysis
2.4. Calculation of Splicing Score
2.5. RNA-Binding Motifs Prediction
2.6. Gene Expression and Splicing Analyses of Transcriptomic Data
2.7. Survival Analysis
2.8. Plasmids
2.9. Plasmid Transfection and siRNA Silencing
2.10. Immunoblotting
2.11. Cell Imaging
2.12. Cell Proliferation Assay
2.13. Statistical Analyses and Plotting
3. Results
3.1. Identification of Widespread AS Changes in High-Metastatic Breast Cancer Cells
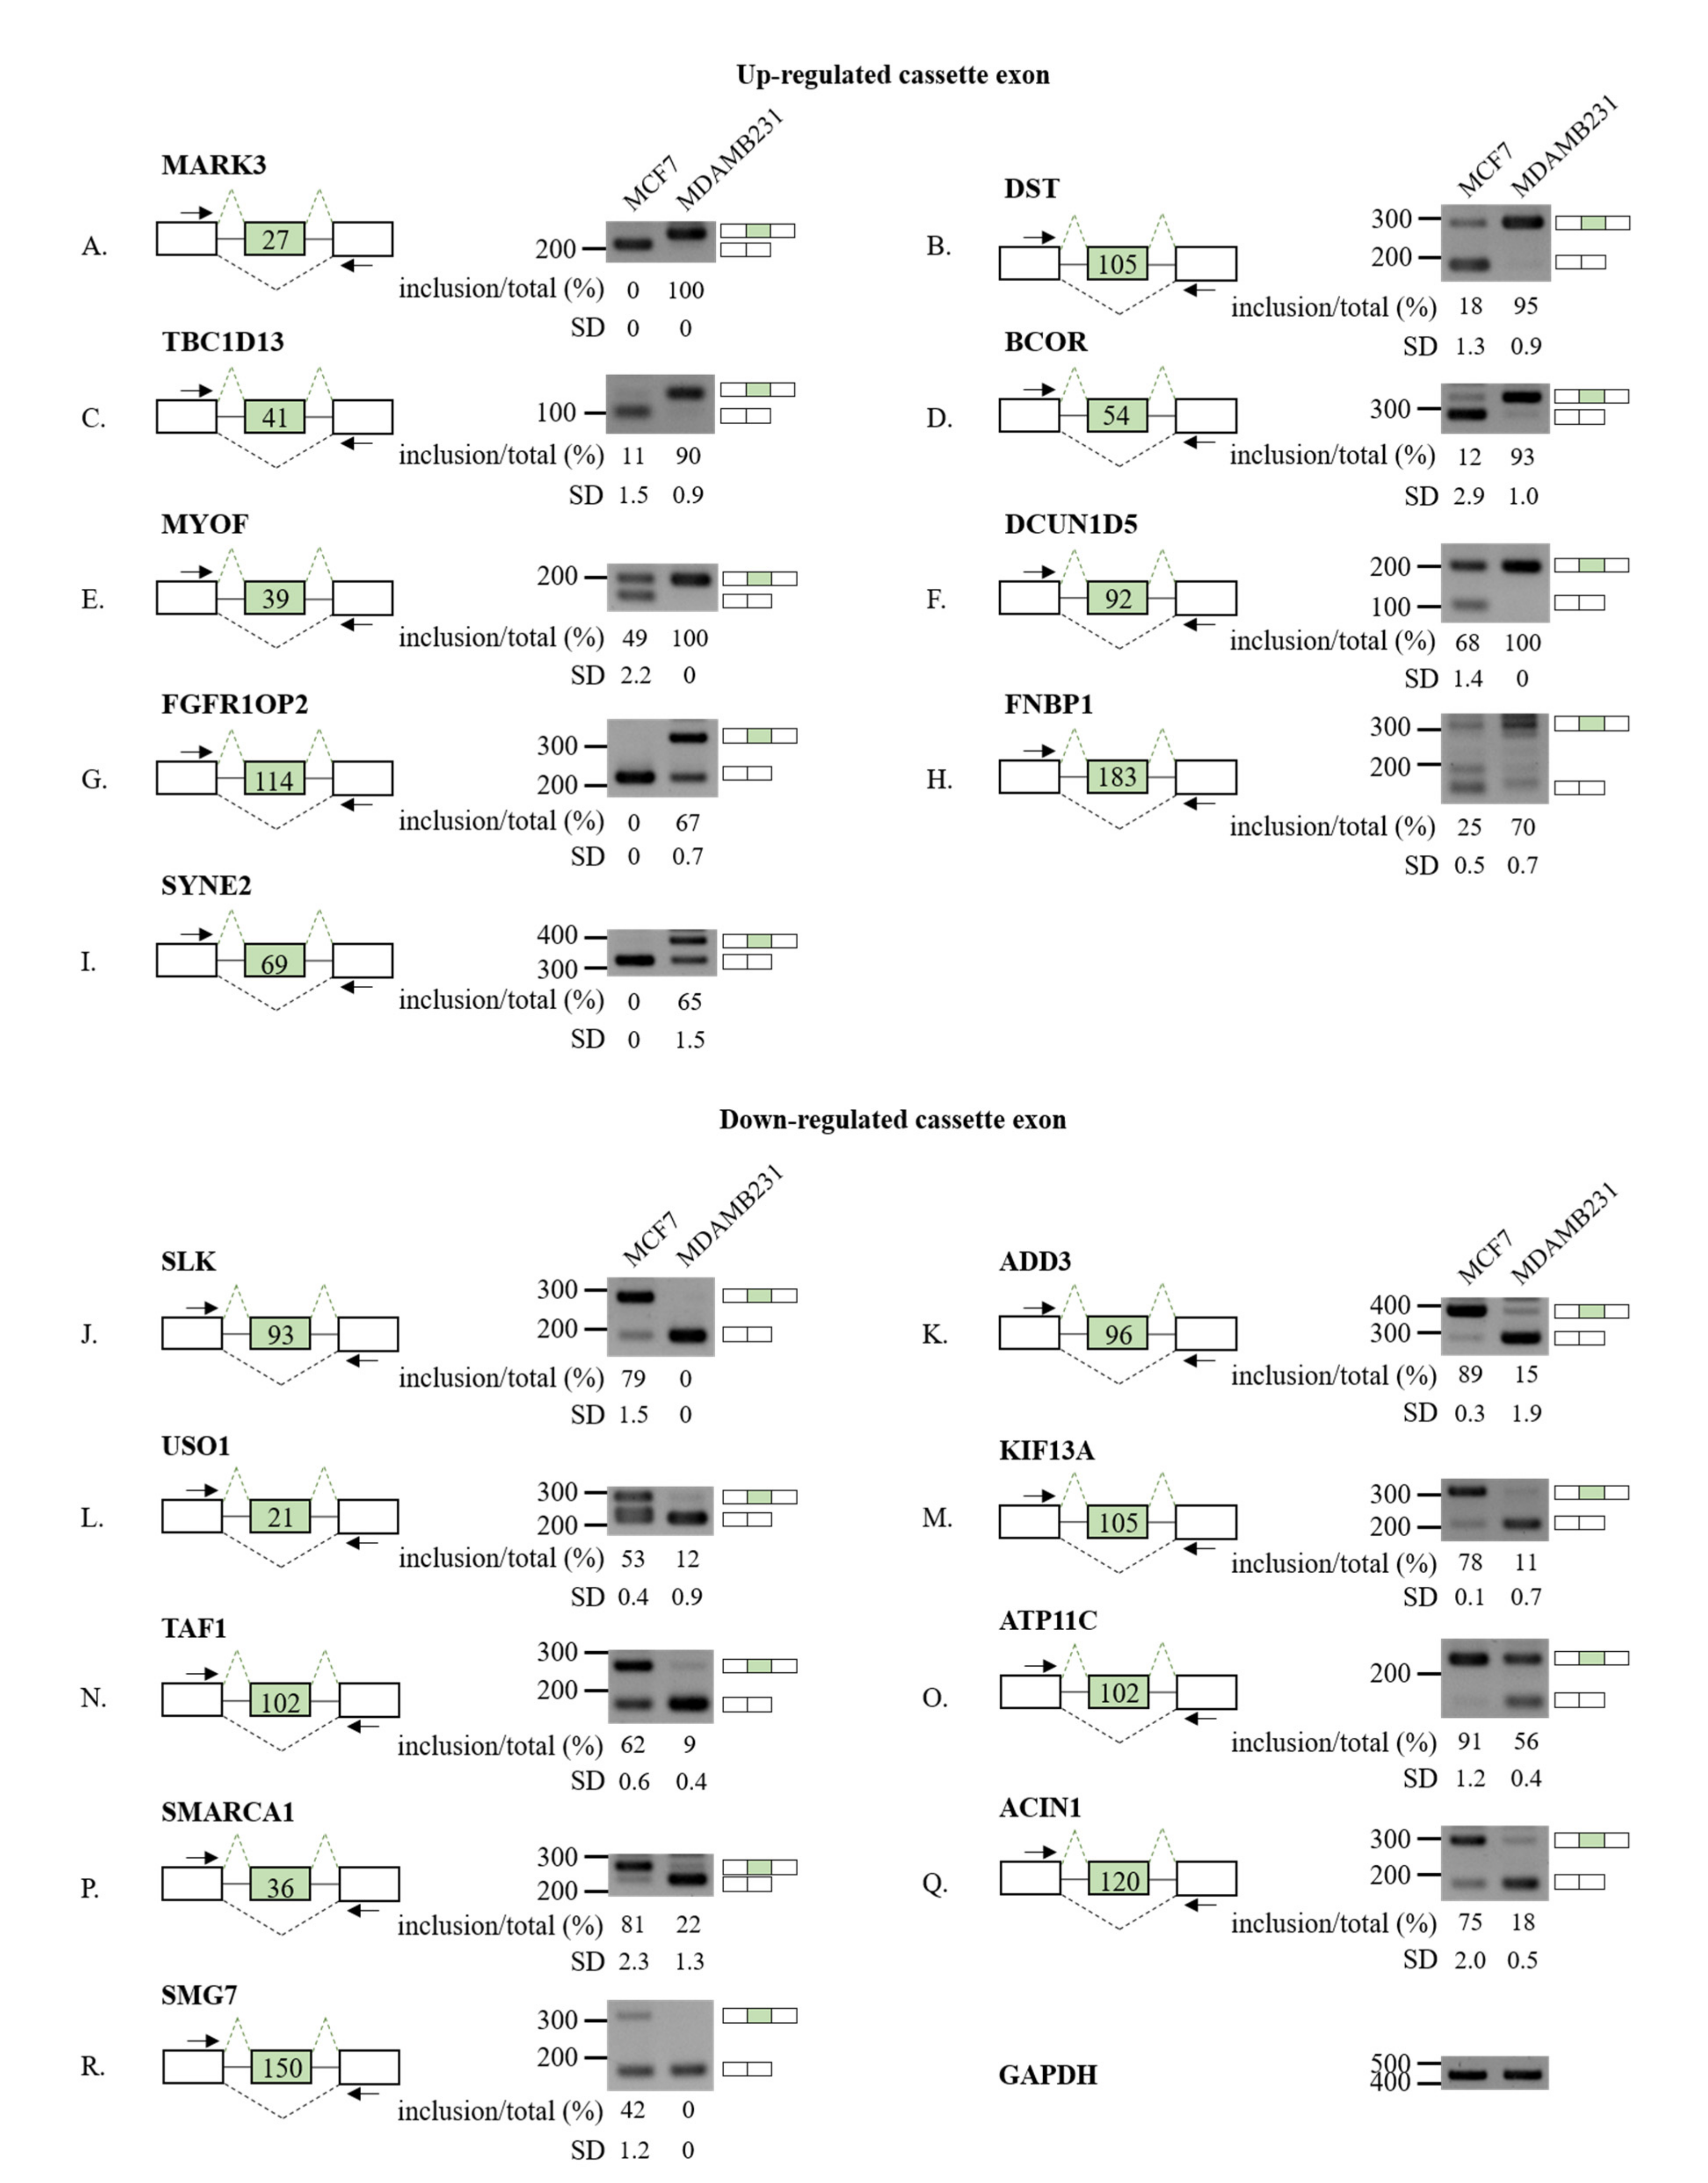
3.2. Validation of RASL-Seq Results in High- and Low-Metastatic Breast Cancer Cells
3.3. Distinct Sequence Properties of AS Cassette Exons Differently Regulated in High- vs. Low-Metastatic Breast Cancer Cells
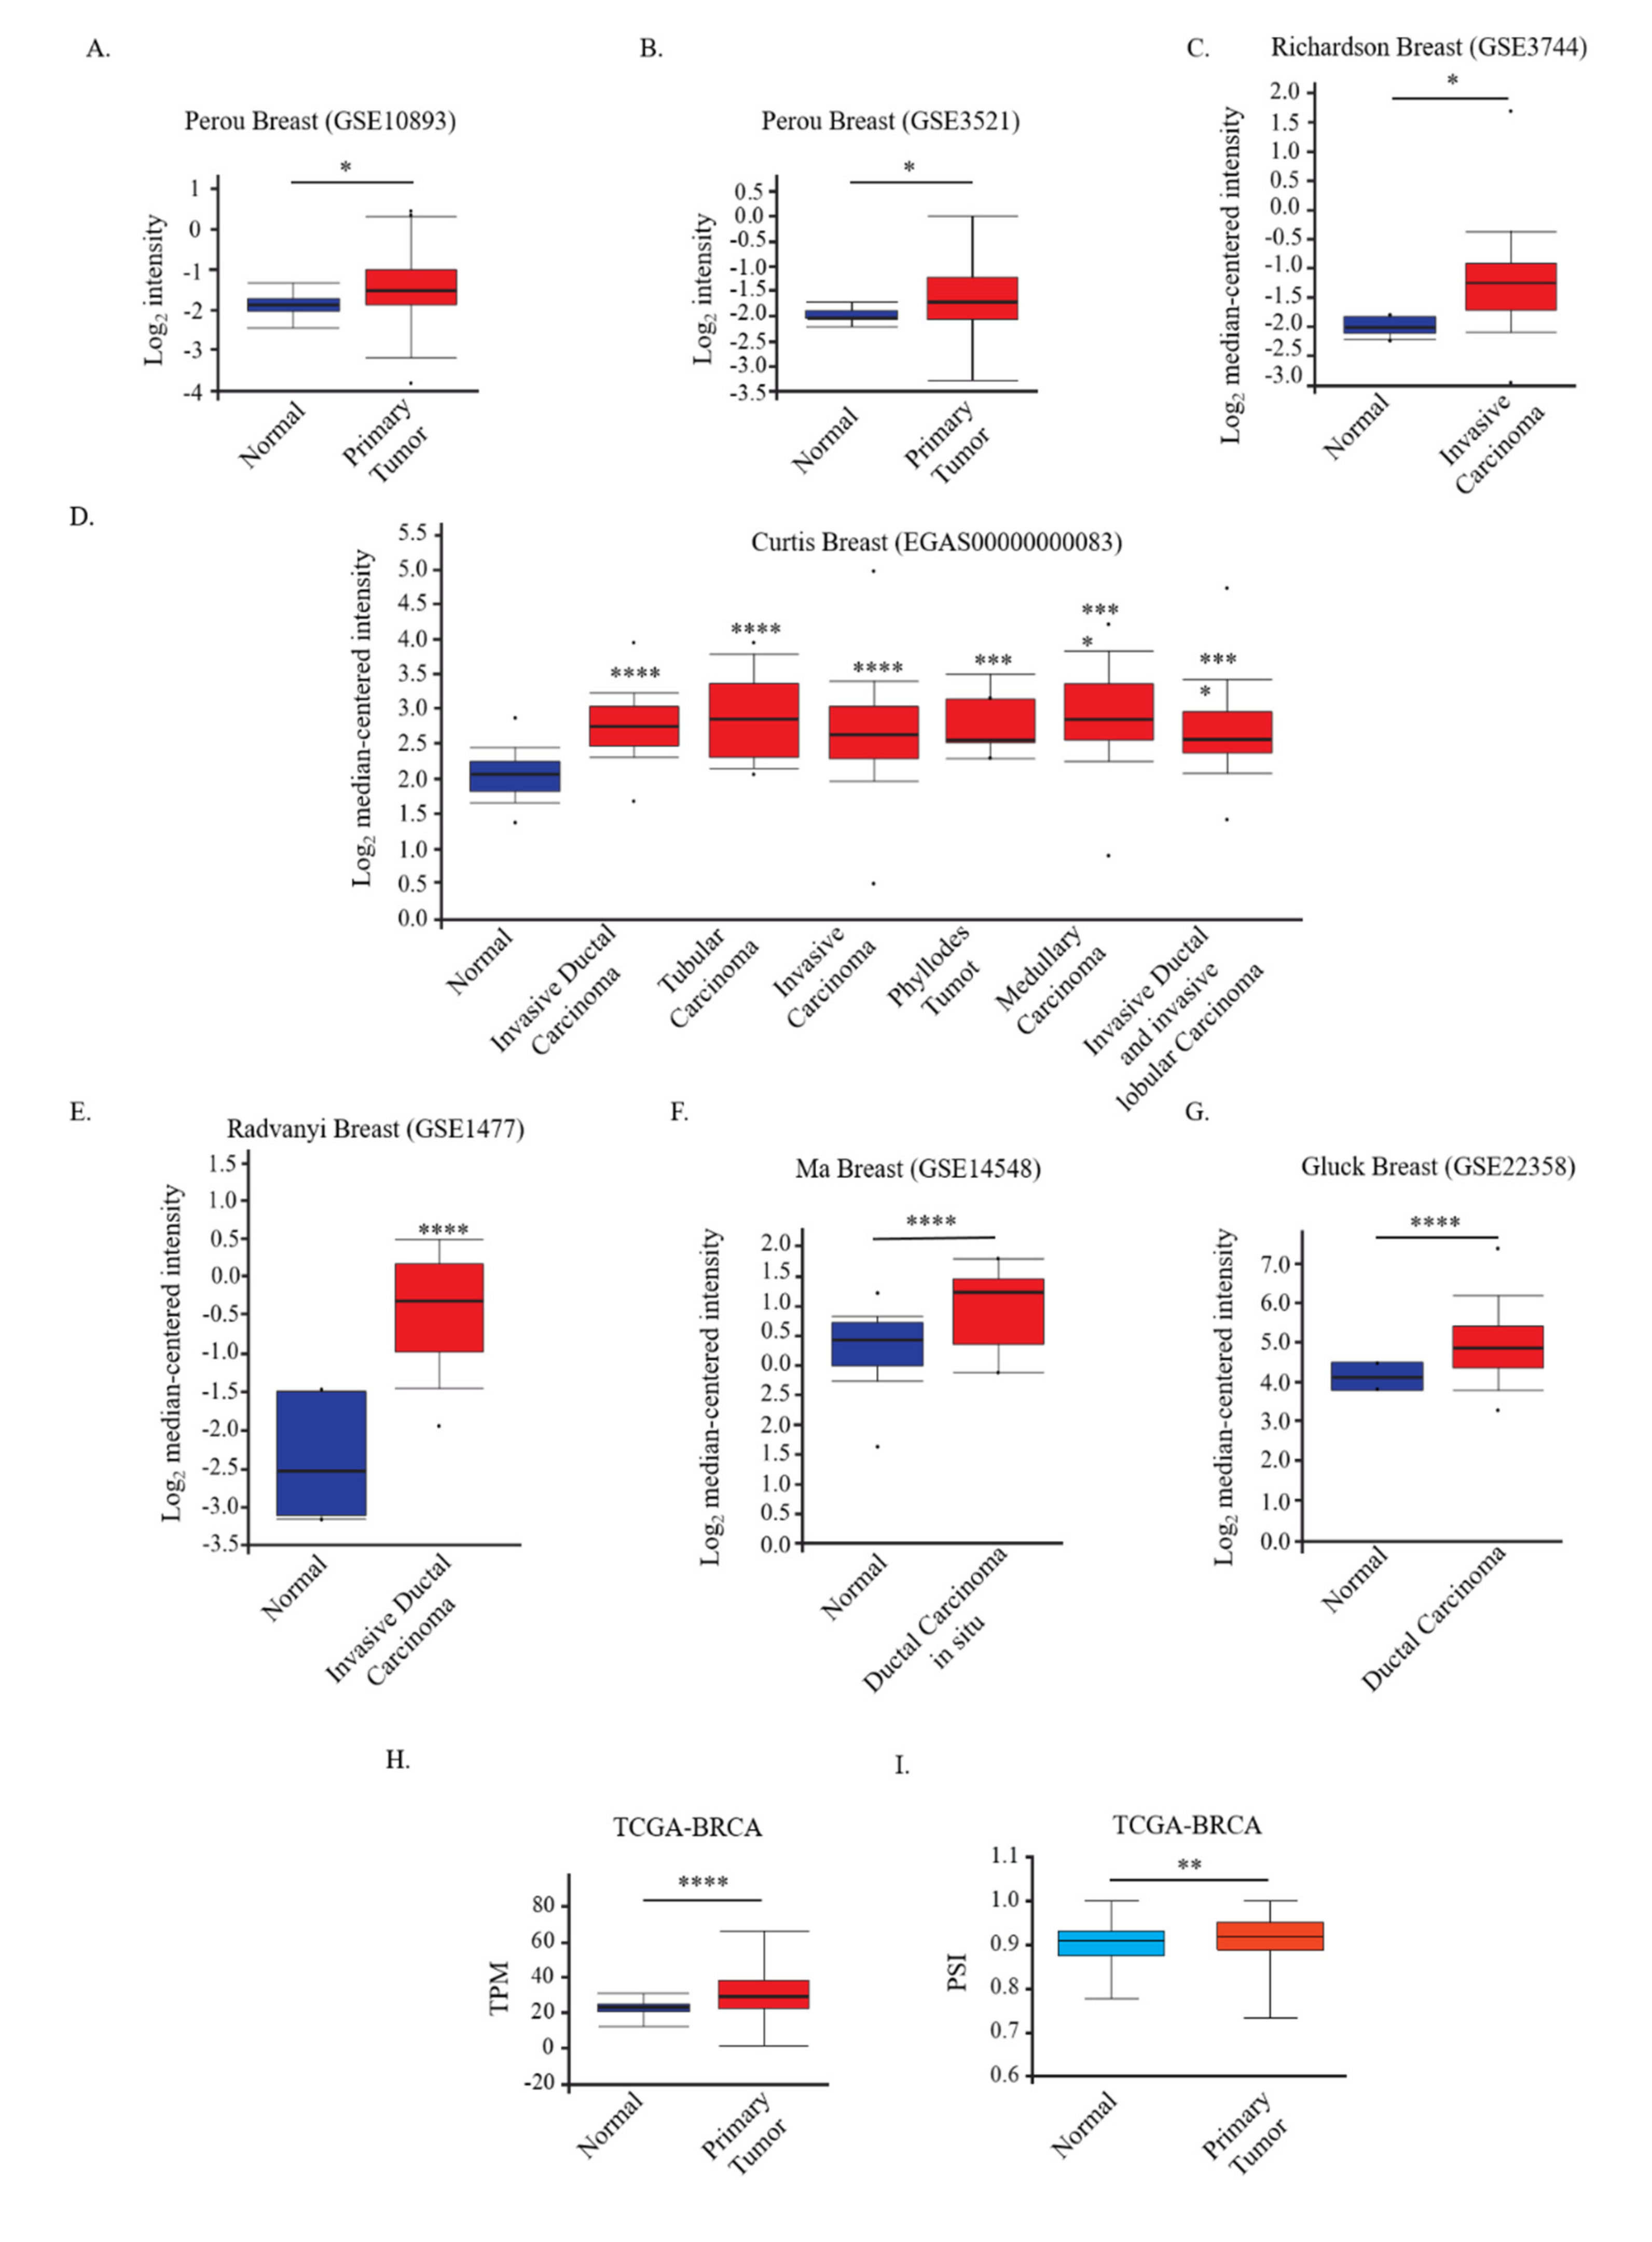
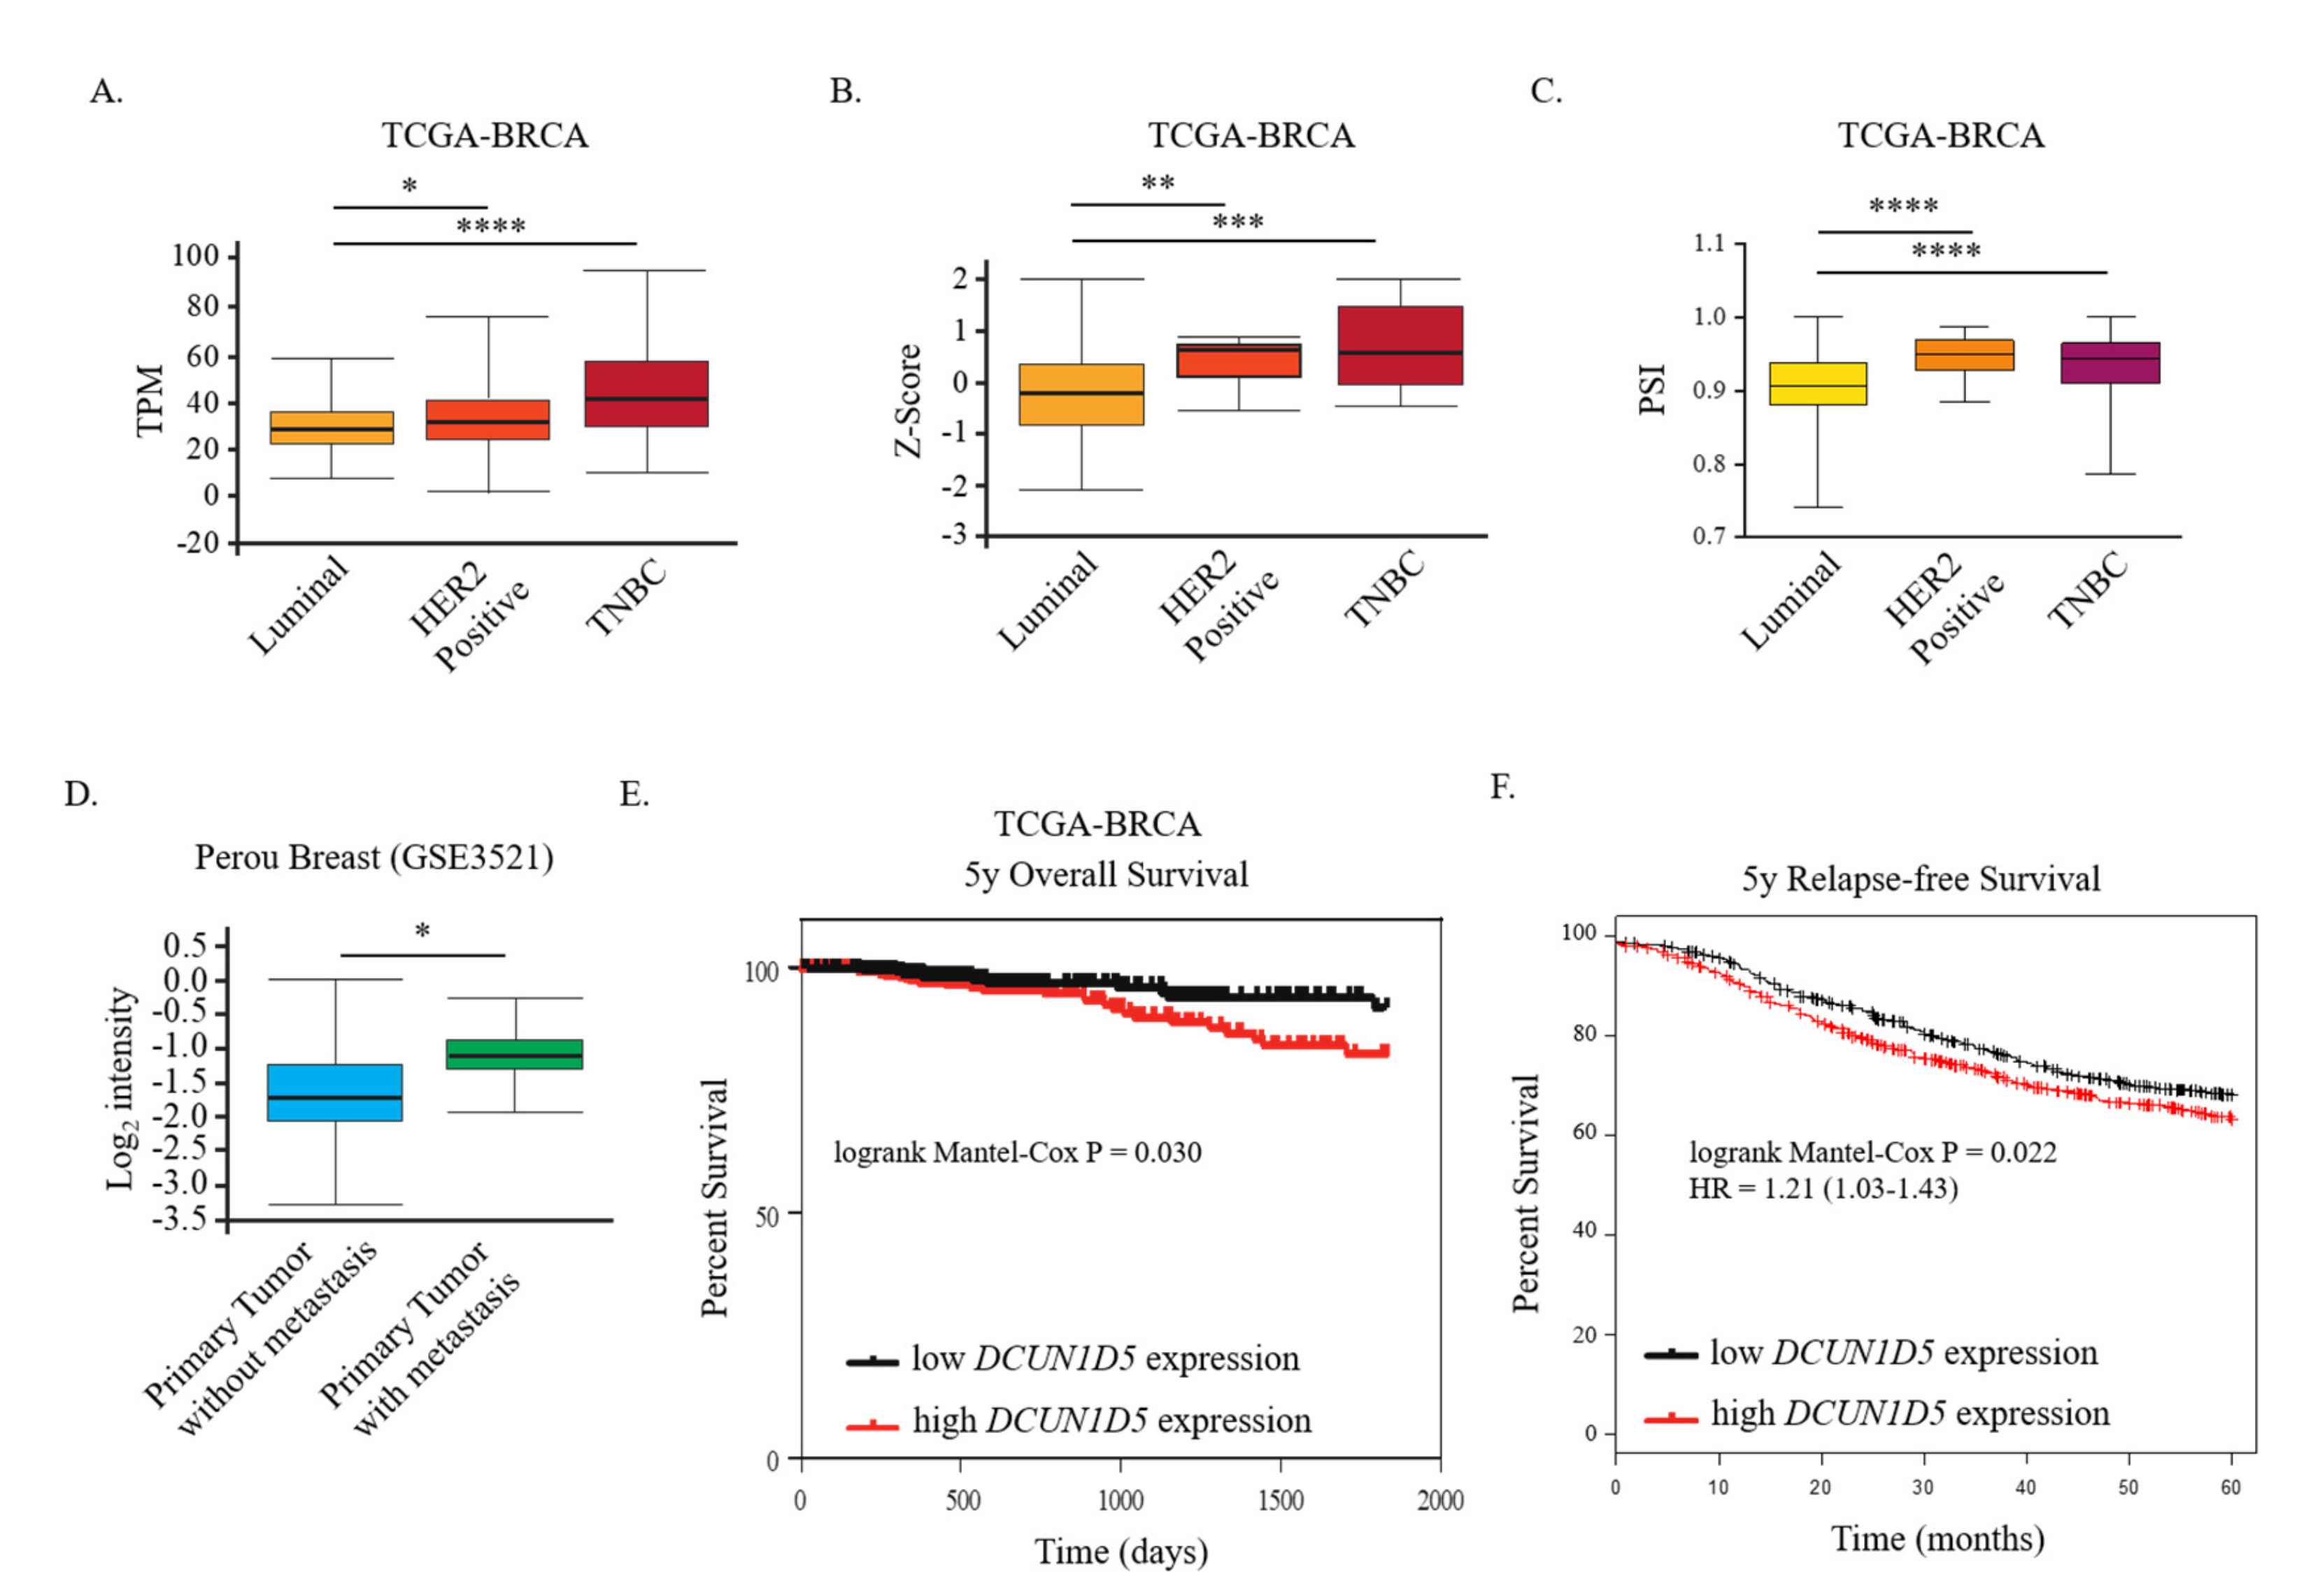
3.4. DCUN1D5 Expression Levels Are Significantly Associated with Breast Cancer Metastasis, and Survival
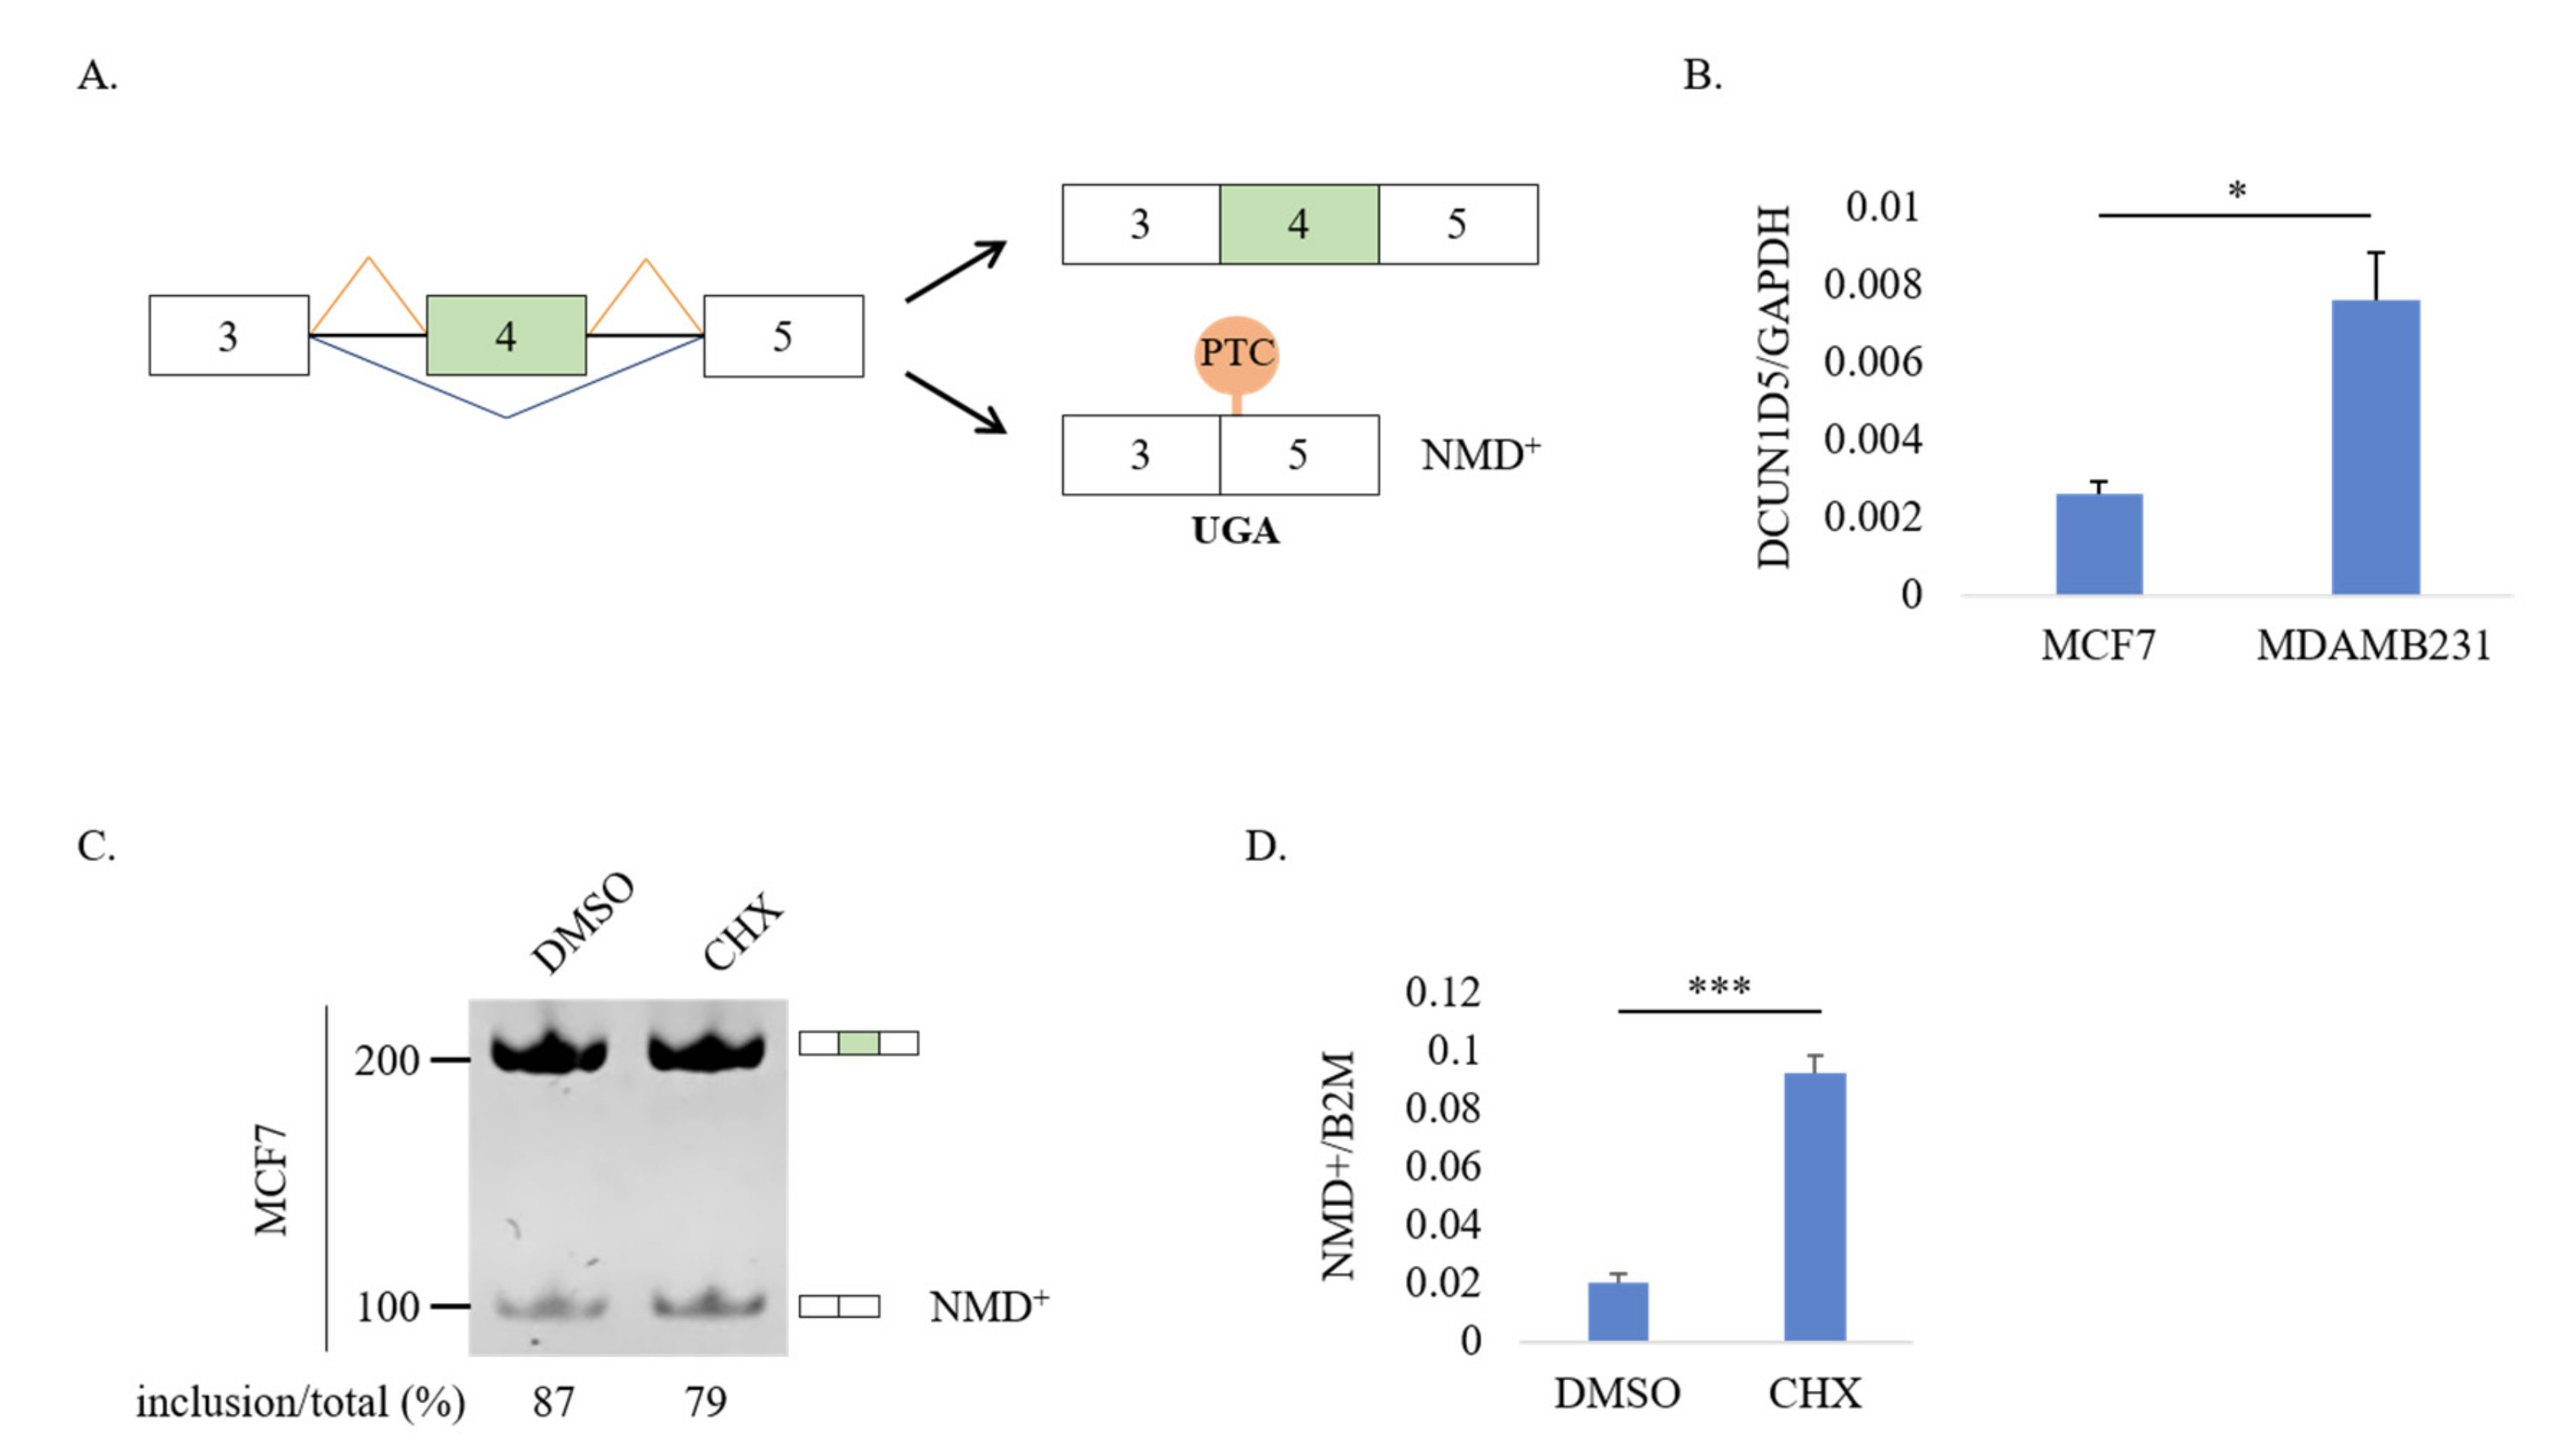
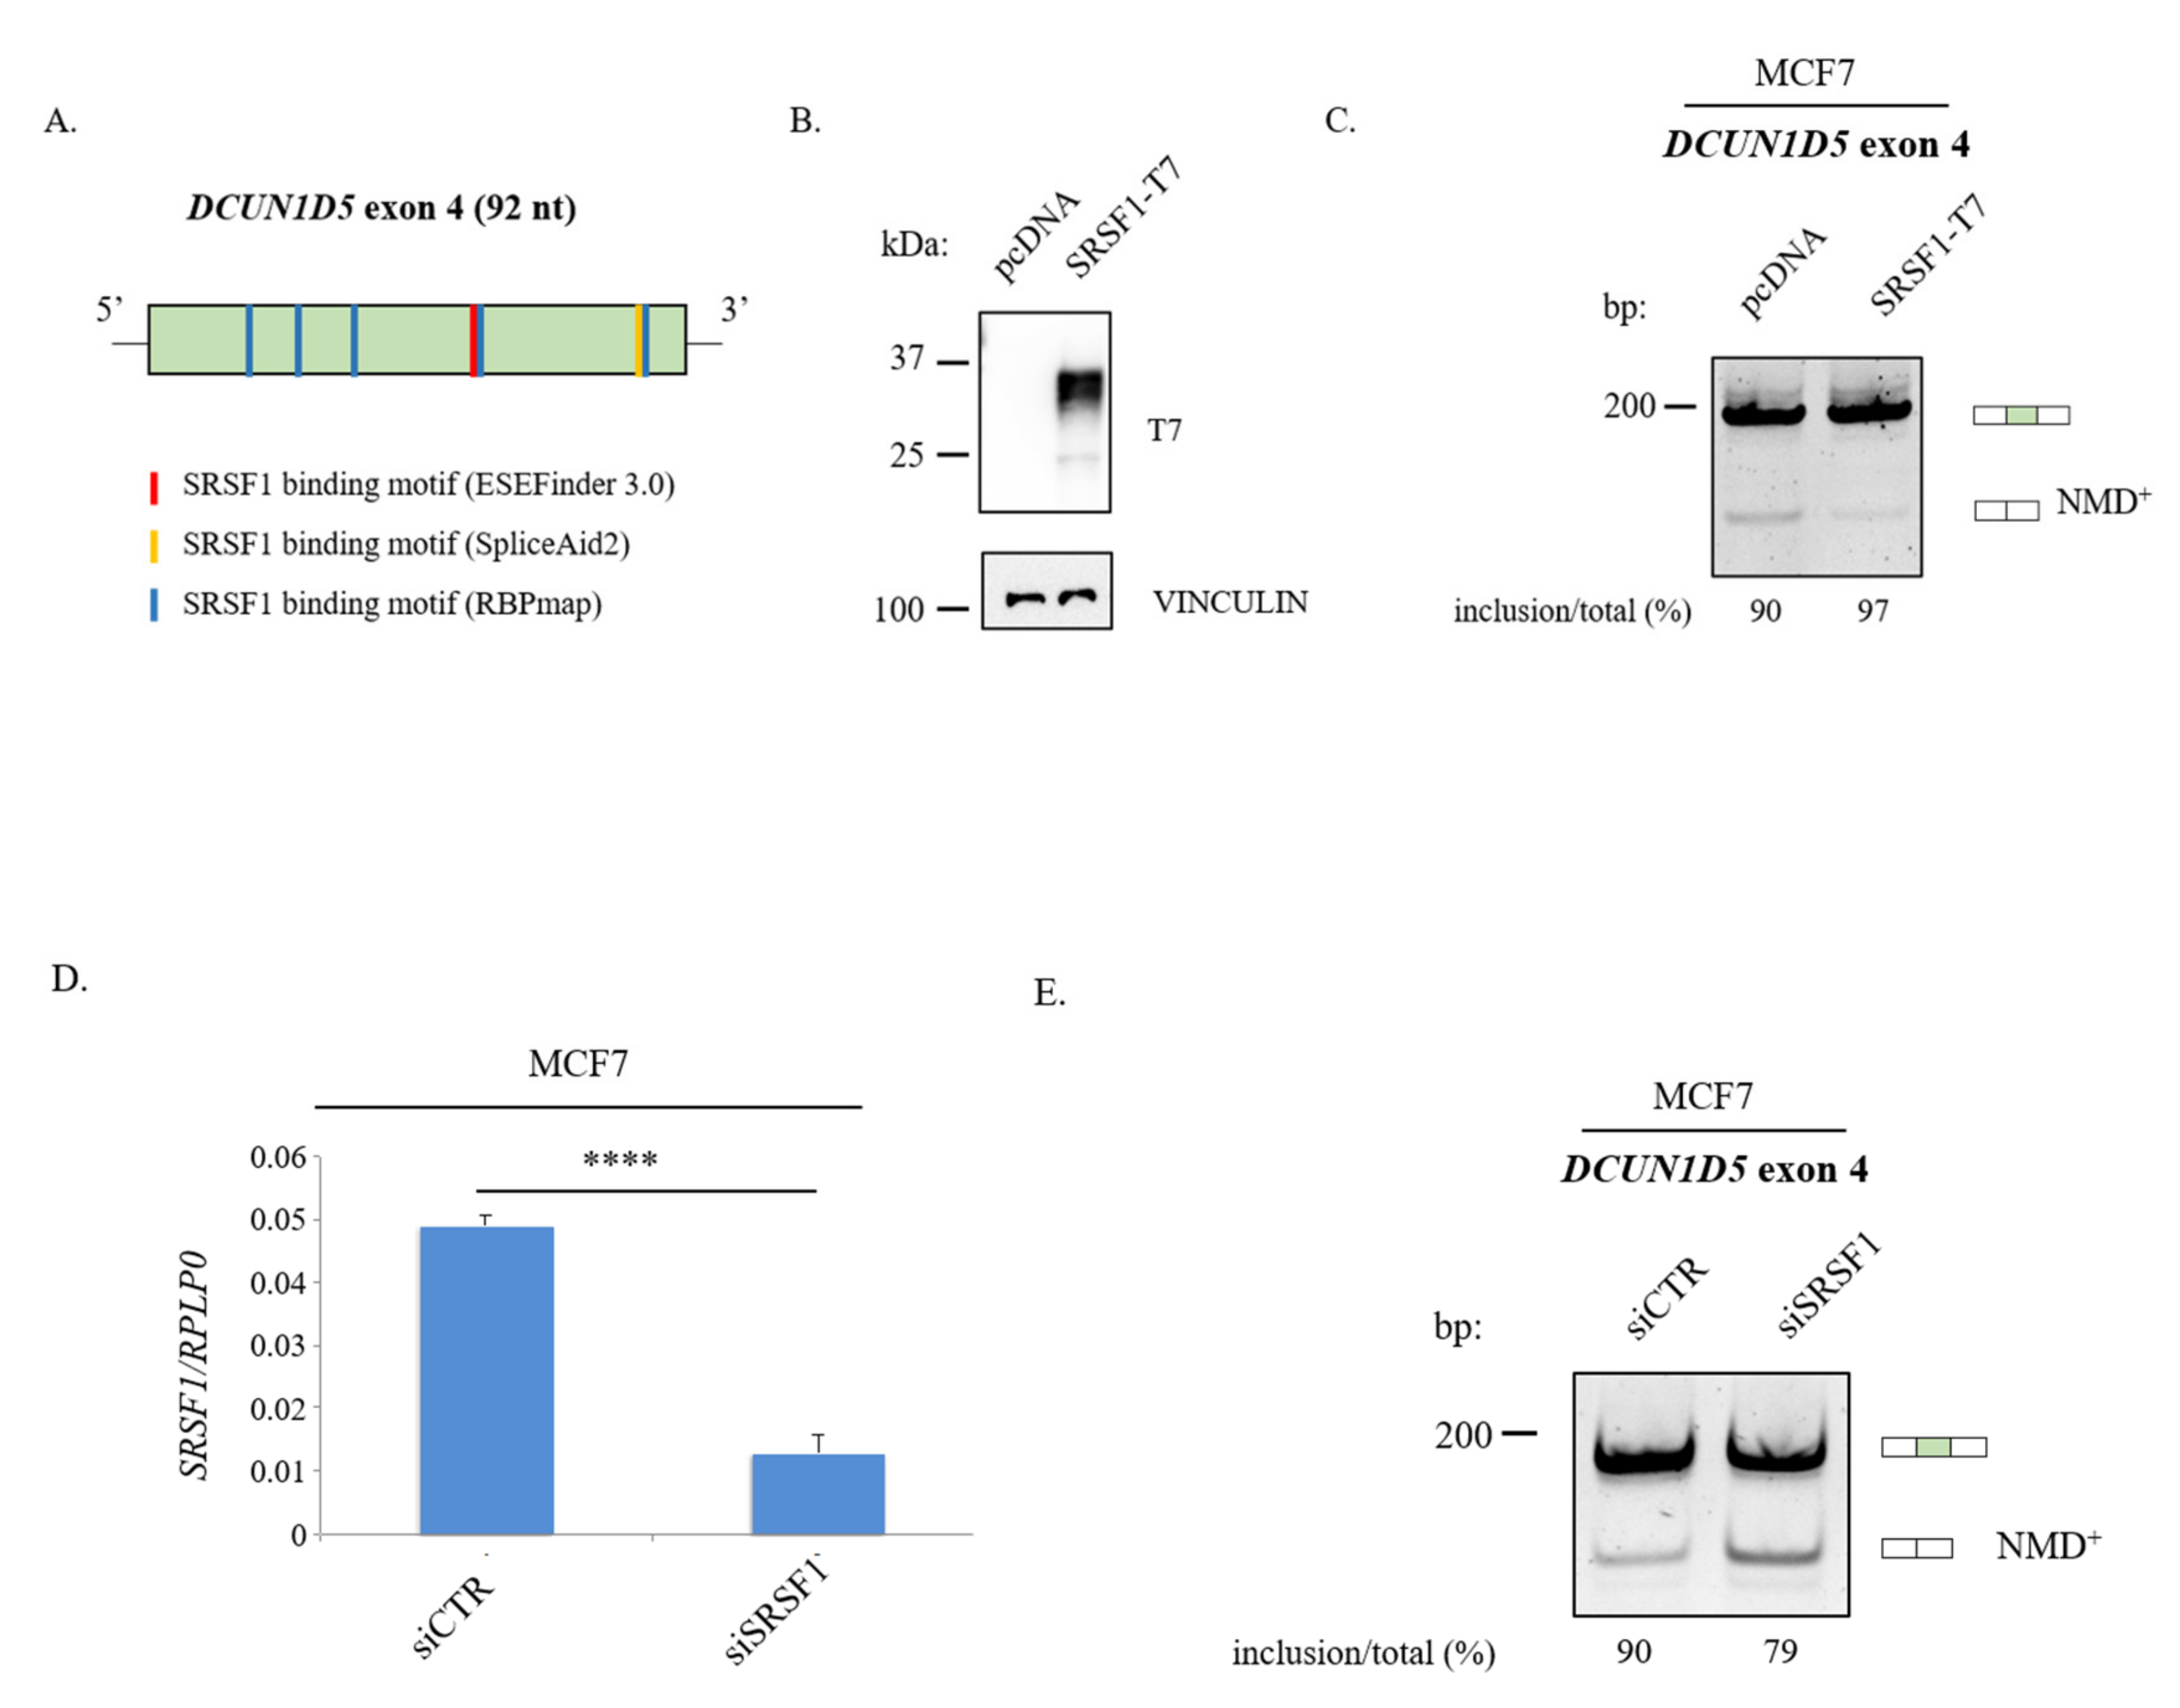
3.5. Molecular Mechanisms Regulation DCUN1D5 Exon 4 Splicing
4. Discussions
Supplementary Materials
Author Contributions
Funding
Institutional Review Board Statement
Informed Consent Statement
Data Availability Statement
Acknowledgments
Conflicts of Interest
References
- Padgett, R.A.; Grabowski, P.J.; Konarska, M.M.; Seiler, S.; Sharp, P.A. Splicing of messenger RNA precursors. Annu. Rev. Biochem. 1986, 55, 1119–1150. [Google Scholar] [CrossRef] [PubMed]
- Maniatis, T.; Reed, R. The role of small nuclear ribonucleoprotein particles in pre-mRNA splicing. Nature 1987, 325, 673–678. [Google Scholar] [CrossRef] [PubMed]
- Braunschweig, U.; Gueroussov, S.; Plocik, A.M.; Graveley, B.R.; Blencowe, B.J. Dynamic integration of splicing within gene regulatory pathways. Cell 2013, 152, 1252–1269. [Google Scholar] [CrossRef] [PubMed]
- Kurosaki, T.; Popp, M.W.; Maquat, L.E. Quality and quantity control of gene expression by nonsense-mediated mRNA decay. Nat. Rev. Mol. Cell Biol. 2019, 20, 406–420. [Google Scholar] [CrossRef] [PubMed]
- Isken, O.; Maquat, L.E. The multiple lives of NMD factors: Balancing roles in gene and genome regulation. Nat. Rev. Genet. 2008, 9, 699–712. [Google Scholar] [CrossRef] [PubMed]
- Popp, M.W.; Maquat, L.E. Leveraging Rules of Nonsense-Mediated mRNA Decay for Genome Engineering and Personalized Medicine. Cell 2016, 165, 1319–1322. [Google Scholar] [CrossRef]
- Valacca, C.; Bonomi, S.; Buratti, E.; Pedrotti, S.; Baralle, F.E.; Sette, C.; Ghigna, C.; Biamonti, G. Sam68 regulates EMT through alternative splicing-activated nonsense-mediated mRNA decay of the SF2/ASF proto-oncogene. J. Cell Biol. 2010, 191, 87–99. [Google Scholar] [CrossRef] [PubMed]
- Bonnal, S.C.; Lopez-Oreja, I.; Valcarcel, J. Roles and mechanisms of alternative splicing in cancer—Implications for care. Nat. Rev. Clin. Oncol. 2020, 17, 457–474. [Google Scholar] [CrossRef]
- Zhang, J.; Manley, J.L. Misregulation of pre-mRNA alternative splicing in cancer. Cancer Discov. 2013, 3, 1228–1237. [Google Scholar] [CrossRef]
- Anczukow, O.; Krainer, A.R. Splicing-factor alterations in cancers. RNA 2016, 22, 1285–1301. [Google Scholar] [CrossRef]
- He, C.; Zhou, F.; Zuo, Z.; Cheng, H.; Zhou, R. A global view of cancer-specific transcript variants by subtractive transcriptome-wide analysis. PLoS ONE 2009, 4, e4732. [Google Scholar] [CrossRef] [PubMed]
- Kahles, A.; Lehmann, K.V.; Toussaint, N.C.; Huser, M.; Stark, S.G.; Sachsenberg, T.; Stegle, O.; Kohlbacher, O.; Sander, C.; Cancer Genome Atlas Research, N.; et al. Comprehensive Analysis of Alternative Splicing Across Tumors from 8705 Patients. Cancer Cell 2018, 34, 211–224.e216. [Google Scholar] [CrossRef]
- Bonomi, S.; Gallo, S.; Catillo, M.; Pignataro, D.; Biamonti, G.; Ghigna, C. Oncogenic alternative splicing switches: Role in cancer progression and prospects for therapy. Int. J. Cell Biol. 2013, 2013, 962038. [Google Scholar] [CrossRef] [PubMed]
- Pradella, D.; Naro, C.; Sette, C.; Ghigna, C. EMT and stemness: Flexible processes tuned by alternative splicing in development and cancer progression. Mol. Cancer 2017, 16, 8. [Google Scholar] [CrossRef]
- Oltean, S.; Bates, D.O. Hallmarks of alternative splicing in cancer. Oncogene 2014, 33, 5311–5318. [Google Scholar] [CrossRef]
- Ghigna, C.; Valacca, C.; Biamonti, G. Alternative splicing and tumor progression. Curr. Genom. 2008, 9, 556–570. [Google Scholar] [CrossRef] [PubMed]
- Biamonti, G.; Catillo, M.; Pignataro, D.; Montecucco, A.; Ghigna, C. The alternative splicing side of cancer. Semin. Cell Dev. Biol. 2014, 32, 30–36. [Google Scholar] [CrossRef] [PubMed]
- Dvinge, H.; Kim, E.; Abdel-Wahab, O.; Bradley, R.K. RNA splicing factors as oncoproteins and tumour suppressors. Nat. Rev. Cancer 2016, 16, 413–430. [Google Scholar] [CrossRef]
- Wang, Y.; Chen, D.; Qian, H.; Tsai, Y.S.; Shao, S.; Liu, Q.; Dominguez, D.; Wang, Z. The splicing factor RBM4 controls apoptosis, proliferation, and migration to suppress tumor progression. Cancer Cell 2014, 26, 374–389. [Google Scholar] [CrossRef]
- Zong, F.Y.; Fu, X.; Wei, W.J.; Luo, Y.G.; Heiner, M.; Cao, L.J.; Fang, Z.; Fang, R.; Lu, D.; Ji, H.; et al. The RNA-binding protein QKI suppresses cancer-associated aberrant splicing. PLoS Genet. 2014, 10, e1004289. [Google Scholar] [CrossRef]
- Siegel, R.L.; Miller, K.D.; Jemal, A. Cancer statistics, 2018. CA Cancer J. Clin. 2018, 68, 7–30. [Google Scholar] [CrossRef] [PubMed]
- Da Costa, A.M.; Hashim, D.; Fregnani, J.; Weiderpass, E. Overall survival and time trends in breast and cervical cancer incidence and mortality in the Regional Health District (RHD) of Barretos, Sao Paulo, Brazil. BMC Cancer 2018, 18, 1079. [Google Scholar] [CrossRef] [PubMed]
- Hatami, R.; Sieuwerts, A.M.; Izadmehr, S.; Yao, Z.; Qiao, R.F.; Papa, L.; Look, M.P.; Smid, M.; Ohlssen, J.; Levine, A.C.; et al. KLF6-SV1 drives breast cancer metastasis and is associated with poor survival. Sci. Transl. Med. 2013, 5, 169ra112. [Google Scholar] [CrossRef] [PubMed]
- Maguire, S.L.; Leonidou, A.; Wai, P.; Marchio, C.; Ng, C.K.; Sapino, A.; Salomon, A.V.; Reis-Filho, J.S.; Weigelt, B.; Natrajan, R.C. SF3B1 mutations constitute a novel therapeutic target in breast cancer. J. Pathol. 2015, 235, 571–580. [Google Scholar] [CrossRef] [PubMed]
- Wen, J.; Toomer, K.H.; Chen, Z.; Cai, X. Genome-wide analysis of alternative transcripts in human breast cancer. Breast Cancer Res. Treat. 2015, 151, 295–307. [Google Scholar] [CrossRef]
- Read, A.; Natrajan, R. Splicing dysregulation as a driver of breast cancer. Endocr. Relat. Cancer 2018, 25, R467–R478. [Google Scholar] [CrossRef]
- Zhao, W.; Hoadley, K.A.; Parker, J.S.; Perou, C.M. Identification of mRNA isoform switching in breast cancer. BMC Genom. 2016, 17, 181. [Google Scholar] [CrossRef]
- Anczukow, O.; Akerman, M.; Clery, A.; Wu, J.; Shen, C.; Shirole, N.H.; Raimer, A.; Sun, S.; Jensen, M.A.; Hua, Y.; et al. SRSF1-Regulated Alternative Splicing in Breast Cancer. Mol. Cell 2015, 60, 105–117. [Google Scholar] [CrossRef]
- Zhang, F.L.; Cao, J.L.; Xie, H.Y.; Sun, R.; Yang, L.F.; Shao, Z.M.; Li, D.Q. Cancer-Associated MORC2-Mutant M276I Regulates an hnRNPM-Mediated CD44 Splicing Switch to Promote Invasion and Metastasis in Triple-Negative Breast Cancer. Cancer Res. 2018, 78, 5780–5792. [Google Scholar] [CrossRef]
- Park, S.; Brugiolo, M.; Akerman, M.; Das, S.; Urbanski, L.; Geier, A.; Kesarwani, A.K.; Fan, M.; Leclair, N.; Lin, K.T.; et al. Differential Functions of Splicing Factors in Mammary Transformation and Breast Cancer Metastasis. Cell Rep. 2019, 29, 2672–2688.e2677. [Google Scholar] [CrossRef]
- Li, H.; Qiu, J.; Fu, X.D. RASL-seq for massively parallel and quantitative analysis of gene expression. Curr. Protoc. Mol. Biol. 2012, 4. [Google Scholar] [CrossRef]
- Sun, S.; Ling, S.C.; Qiu, J.; Albuquerque, C.P.; Zhou, Y.; Tokunaga, S.; Li, H.; Qiu, H.; Bui, A.; Yeo, G.W.; et al. ALS-causative mutations in FUS/TLS confer gain and loss of function by altered association with SMN and U1-snRNP. Nat. Commun. 2015, 6, 6171. [Google Scholar] [CrossRef] [PubMed]
- Qiu, J.; Zhou, B.; Thol, F.; Zhou, Y.; Chen, L.; Shao, C.; DeBoever, C.; Hou, J.; Li, H.; Chaturvedi, A.; et al. Distinct splicing signatures affect converged pathways in myelodysplastic syndrome patients carrying mutations in different splicing regulators. RNA 2016, 22, 1535–1549. [Google Scholar] [CrossRef]
- Liu, Y.L.; Chou, C.K.; Kim, M.; Vasisht, R.; Kuo, Y.A.; Ang, P.; Liu, C.; Perillo, E.P.; Chen, Y.A.; Blocher, K.; et al. Assessing metastatic potential of breast cancer cells based on EGFR dynamics. Sci. Rep. 2019, 9, 3395. [Google Scholar] [CrossRef]
- Guo, W.; Li, G.J.; Xu, H.B.; Xie, J.S.; Shi, T.P.; Zhang, S.Z.; Chen, X.H.; Huang, Z.G. In vitro biological characterization of DCUN1D5 in DNA damage response. Asian Pac. J. Cancer Prev. 2012, 13, 4157–4162. [Google Scholar] [CrossRef]
- Huang, D.W.; Sherman, B.T.; Tan, Q.; Collins, J.R.; Alvord, W.G.; Roayaei, J.; Stephens, R.; Baseler, M.W.; Lane, H.C.; Lempicki, R.A. The DAVID Gene Functional Classification Tool: A novel biological module-centric algorithm to functionally analyze large gene lists. Genome Biol. 2007, 8, R183. [Google Scholar] [CrossRef]
- Quinlan, A.R. BEDTools: The Swiss-Army Tool for Genome Feature Analysis. Curr. Protoc. Bioinform. 2014, 47, 11–12. [Google Scholar] [CrossRef]
- Yeo, G.; Burge, C.B. Maximum entropy modeling of short sequence motifs with applications to RNA splicing signals. J. Comput. Biol. 2004, 11, 377–394. [Google Scholar] [CrossRef]
- Fischl, H.; Neve, J.; Wang, Z.; Patel, R.; Louey, A.; Tian, B.; Furger, A. hnRNPC regulates cancer-specific alternative cleavage and polyadenylation profiles. Nucleic Acids Res. 2019, 47, 7580–7591. [Google Scholar] [CrossRef] [PubMed]
- Paz, I.; Kosti, I.; Ares, M., Jr.; Cline, M.; Mandel-Gutfreund, Y. RBPmap: A web server for mapping binding sites of RNA-binding proteins. Nucleic Acids Res. 2014, 42, W361–W367. [Google Scholar] [CrossRef]
- Piva, F.; Giulietti, M.; Burini, A.B.; Principato, G. SpliceAid 2: A database of human splicing factors expression data and RNA target motifs. Hum. Mutat. 2012, 33, 81–85. [Google Scholar] [CrossRef]
- Smith, P.J.; Zhang, C.; Wang, J.; Chew, S.L.; Zhang, M.Q.; Krainer, A.R. An increased specificity score matrix for the prediction of SF2/ASF-specific exonic splicing enhancers. Hum. Mol. Genet. 2006, 15, 2490–2508. [Google Scholar] [CrossRef] [PubMed]
- Cartegni, L.; Wang, J.; Zhu, Z.; Zhang, M.Q.; Krainer, A.R. ESEfinder: A web resource to identify exonic splicing enhancers. Nucleic Acids Res. 2003, 31, 3568–3571. [Google Scholar] [CrossRef] [PubMed]
- Chandrashekar, D.S.; Bashel, B.; Balasubramanya, S.A.H.; Creighton, C.J.; Ponce-Rodriguez, I.; Chakravarthi, B.; Varambally, S. UALCAN: A Portal for Facilitating Tumor Subgroup Gene Expression and Survival Analyses. Neoplasia 2017, 19, 649–658. [Google Scholar] [CrossRef]
- Ryan, M.; Wong, W.C.; Brown, R.; Akbani, R.; Su, X.; Broom, B.; Melott, J.; Weinstein, J. TCGASpliceSeq a compendium of alternative mRNA splicing in cancer. Nucleic Acids Res. 2016, 44, D1018–D1022. [Google Scholar] [CrossRef]
- Rhodes, D.R.; Yu, J.; Shanker, K.; Deshpande, N.; Varambally, R.; Ghosh, D.; Barrette, T.; Pandey, A.; Chinnaiyan, A.M. ONCOMINE: A cancer microarray database and integrated data-mining platform. Neoplasia 2004, 6, 1–6. [Google Scholar] [CrossRef]
- Zheng, G.; Ma, Y.; Zou, Y.; Yin, A.; Li, W.; Dong, D. HCMDB: The human cancer metastasis database. Nucleic Acids Res. 2018, 46, D950–D955. [Google Scholar] [CrossRef] [PubMed]
- Barretina, J.; Caponigro, G.; Stransky, N.; Venkatesan, K.; Margolin, A.A.; Kim, S.; Wilson, C.J.; Lehar, J.; Kryukov, G.V.; Sonkin, D.; et al. Addendum: The Cancer Cell Line Encyclopedia enables predictive modelling of anticancer drug sensitivity. Nature 2019, 565, E5–E6. [Google Scholar] [CrossRef]
- Dai, X.; Cheng, H.; Bai, Z.; Li, J. Breast Cancer Cell Line Classification and Its Relevance with Breast Tumor Subtyping. J. Cancer 2017, 8, 3131–3141. [Google Scholar] [CrossRef] [PubMed]
- Sun, W.; Duan, T.; Ye, P.; Chen, K.; Zhang, G.; Lai, M.; Zhang, H. TSVdb: A web-tool for TCGA splicing variants analysis. BMC Genom. 2018, 19, 405. [Google Scholar] [CrossRef]
- Gyorffy, B.; Lanczky, A.; Eklund, A.C.; Denkert, C.; Budczies, J.; Li, Q.; Szallasi, Z. An online survival analysis tool to rapidly assess the effect of 22,277 genes on breast cancer prognosis using microarray data of 1809 patients. Breast Cancer Res. Treat. 2010, 123, 725–731. [Google Scholar] [CrossRef]
- Ghigna, C.; Giordano, S.; Shen, H.; Benvenuto, F.; Castiglioni, F.; Comoglio, P.M.; Green, M.R.; Riva, S.; Biamonti, G. Cell motility is controlled by SF2/ASF through alternative splicing of the Ron protooncogene. Mol. Cell 2005, 20, 881–890. [Google Scholar] [CrossRef] [PubMed]
- Vigevani, L.; Gohr, A.; Webb, T.; Irimia, M.; Valcarcel, J. Molecular basis of differential 3’ splice site sensitivity to anti-tumor drugs targeting U2 snRNP. Nat. Commun. 2017, 8, 2100. [Google Scholar] [CrossRef]
- Wang, X.; Li, Y.; Fan, Y.; Yu, X.; Mao, X.; Jin, F. PTBP1 promotes the growth of breast cancer cells through the PTEN/Akt pathway and autophagy. J. Cell Physiol. 2018, 233, 8930–8939. [Google Scholar] [CrossRef]
- He, X.; Arslan, A.D.; Ho, T.T.; Yuan, C.; Stampfer, M.R.; Beck, W.T. Involvement of polypyrimidine tract-binding protein (PTBP1) in maintaining breast cancer cell growth and malignant properties. Oncogenesis 2014, 3, e84. [Google Scholar] [CrossRef]
- Sterner, D.A.; Carlo, T.; Berget, S.M. Architectural limits on split genes. Proc. Natl. Acad. Sci. USA 1996, 93, 15081–15085. [Google Scholar] [CrossRef]
- Amit, M.; Donyo, M.; Hollander, D.; Goren, A.; Kim, E.; Gelfman, S.; Lev-Maor, G.; Burstein, D.; Schwartz, S.; Postolsky, B.; et al. Differential GC content between exons and introns establishes distinct strategies of splice-site recognition. Cell Rep. 2012, 1, 543–556. [Google Scholar] [CrossRef]
- Bommelje, C.C.; Weeda, V.B.; Huang, G.; Shah, K.; Bains, S.; Buss, E.; Shaha, M.; Gonen, M.; Ghossein, R.; Ramanathan, S.Y.; et al. Oncogenic function of SCCRO5/DCUN1D5 requires its Neddylation E3 activity and nuclear localization. Clin. Cancer Res. 2014, 20, 372–381. [Google Scholar] [CrossRef] [PubMed]
- Kurz, T.; Ozlu, N.; Rudolf, F.; O’Rourke, S.M.; Luke, B.; Hofmann, K.; Hyman, A.A.; Bowerman, B.; Peter, M. The conserved protein DCN-1/Dcn1p is required for cullin neddylation in C. elegans and S. cerevisiae. Nature 2005, 435, 1257–1261. [Google Scholar] [CrossRef]
- Yang, X.; Zhou, J.; Sun, L.; Wei, Z.; Gao, J.; Gong, W.; Xu, R.M.; Rao, Z.; Liu, Y. Structural basis for the function of DCN-1 in protein Neddylation. J. Biol. Chem. 2007, 282, 24490–24494. [Google Scholar] [CrossRef]
- Tani, H.; Imamachi, N.; Salam, K.A.; Mizutani, R.; Ijiri, K.; Irie, T.; Yada, T.; Suzuki, Y.; Akimitsu, N. Identification of hundreds of novel UPF1 target transcripts by direct determination of whole transcriptome stability. RNA Biol. 2012, 9, 1370–1379. [Google Scholar] [CrossRef]
- Kim, Y.K.; Maquat, L.E. UPFront and center in RNA decay: UPF1 in nonsense-mediated mRNA decay and beyond. RNA 2019, 25, 407–422. [Google Scholar] [CrossRef] [PubMed]
- Carter, M.S.; Doskow, J.; Morris, P.; Li, S.; Nhim, R.P.; Sandstedt, S.; Wilkinson, M.F. A regulatory mechanism that detects premature nonsense codons in T-cell receptor transcripts in vivo is reversed by protein synthesis inhibitors in vitro. J. Biol. Chem. 1995, 270, 28995–29003. [Google Scholar] [CrossRef] [PubMed]
- Cancer Genome Atlas, N. Comprehensive molecular characterization of human colon and rectal cancer. Nature 2012, 487, 330–337. [Google Scholar] [CrossRef]
- Karni, R.; de Stanchina, E.; Lowe, S.W.; Sinha, R.; Mu, D.; Krainer, A.R. The gene encoding the splicing factor SF2/ASF is a proto-oncogene. Nat. Struct. Mol. Biol. 2007, 14, 185–193. [Google Scholar] [CrossRef]
- Mazoyer, S.; Puget, N.; Perrin-Vidoz, L.; Lynch, H.T.; Serova-Sinilnikova, O.M.; Lenoir, G.M. A BRCA1 nonsense mutation causes exon skipping. Am. J. Hum. Genet. 1998, 62, 713–715. [Google Scholar] [CrossRef]
- Inoue, K.; Fry, E.A. Aberrant Splicing of Estrogen Receptor, HER2, and CD44 Genes in Breast Cancer. Genet. Epigenet. 2015, 7, 19–32. [Google Scholar] [CrossRef]
- Nielsen, F.C.; van Overeem Hansen, T.; Sorensen, C.S. Hereditary breast and ovarian cancer: New genes in confined pathways. Nat. Rev. Cancer 2016, 16, 599–612. [Google Scholar] [CrossRef]
- Dorman, S.N.; Viner, C.; Rogan, P.K. Splicing mutation analysis reveals previously unrecognized pathways in lymph node-invasive breast cancer. Sci. Rep. 2014, 4, 7063. [Google Scholar] [CrossRef]
- Brown, R.L.; Reinke, L.M.; Damerow, M.S.; Perez, D.; Chodosh, L.A.; Yang, J.; Cheng, C. CD44 splice isoform switching in human and mouse epithelium is essential for epithelial-mesenchymal transition and breast cancer progression. J. Clin. Investig. 2011, 121, 1064–1074. [Google Scholar] [CrossRef]
- Holliday, D.L.; Speirs, V. Choosing the right cell line for breast cancer research. Breast Cancer Res. 2011, 13, 215. [Google Scholar] [CrossRef] [PubMed]
- Zou, T.; Zhang, J. Diverse and pivotal roles of neddylation in metabolism and immunity. FEBS J. 2020. [Google Scholar] [CrossRef]
- He, X.; Ee, P.L.; Coon, J.S.; Beck, W.T. Alternative splicing of the multidrug resistance protein 1/ATP binding cassette transporter subfamily gene in ovarian cancer creates functional splice variants and is associated with increased expression of the splicing factors PTB and SRp20. Clin. Cancer Res. 2004, 10, 4652–4660. [Google Scholar] [CrossRef] [PubMed]
- Fischer, D.C.; Noack, K.; Runnebaum, I.B.; Watermann, D.O.; Kieback, D.G.; Stamm, S.; Stickeler, E. Expression of splicing factors in human ovarian cancer. Oncol. Rep. 2004, 11, 1085–1090. [Google Scholar] [CrossRef]
- Anczukow, O.; Rosenberg, A.Z.; Akerman, M.; Das, S.; Zhan, L.; Karni, R.; Muthuswamy, S.K.; Krainer, A.R. The splicing factor SRSF1 regulates apoptosis and proliferation to promote mammary epithelial cell transformation. Nat. Struct. Mol. Biol. 2012, 19, 220–228. [Google Scholar] [CrossRef]
- Maimon, A.; Mogilevsky, M.; Shilo, A.; Golan-Gerstl, R.; Obiedat, A.; Ben-Hur, V.; Lebenthal-Loinger, I.; Stein, I.; Reich, R.; Beenstock, J.; et al. Mnk2 alternative splicing modulates the p38-MAPK pathway and impacts Ras-induced transformation. Cell Rep. 2014, 7, 501–513. [Google Scholar] [CrossRef]
- Ben-Hur, V.; Denichenko, P.; Siegfried, Z.; Maimon, A.; Krainer, A.; Davidson, B.; Karni, R. S6K1 alternative splicing modulates its oncogenic activity and regulates mTORC1. Cell Rep. 2013, 3, 103–115. [Google Scholar] [CrossRef]
- Amin, E.M.; Oltean, S.; Hua, J.; Gammons, M.V.; Hamdollah-Zadeh, M.; Welsh, G.I.; Cheung, M.K.; Ni, L.; Kase, S.; Rennel, E.S.; et al. WT1 mutants reveal SRPK1 to be a downstream angiogenesis target by altering VEGF splicing. Cancer Cell 2011, 20, 768–780. [Google Scholar] [CrossRef]


Publisher’s Note: MDPI stays neutral with regard to jurisdictional claims in published maps and institutional affiliations. |
© 2021 by the authors. Licensee MDPI, Basel, Switzerland. This article is an open access article distributed under the terms and conditions of the Creative Commons Attribution (CC BY) license (https://creativecommons.org/licenses/by/4.0/).
Share and Cite
Oh, J.; Pradella, D.; Shao, C.; Li, H.; Choi, N.; Ha, J.; Ruggiero, S.; Fu, X.-D.; Zheng, X.; Ghigna, C.; et al. Widespread Alternative Splicing Changes in Metastatic Breast Cancer Cells. Cells 2021, 10, 858. https://doi.org/10.3390/cells10040858
Oh J, Pradella D, Shao C, Li H, Choi N, Ha J, Ruggiero S, Fu X-D, Zheng X, Ghigna C, et al. Widespread Alternative Splicing Changes in Metastatic Breast Cancer Cells. Cells. 2021; 10(4):858. https://doi.org/10.3390/cells10040858
Chicago/Turabian StyleOh, Jagyeong, Davide Pradella, Changwei Shao, Hairi Li, Namjeong Choi, Jiyeon Ha, Sonia Ruggiero, Xiang-Dong Fu, Xuexiu Zheng, Claudia Ghigna, and et al. 2021. "Widespread Alternative Splicing Changes in Metastatic Breast Cancer Cells" Cells 10, no. 4: 858. https://doi.org/10.3390/cells10040858
APA StyleOh, J., Pradella, D., Shao, C., Li, H., Choi, N., Ha, J., Ruggiero, S., Fu, X.-D., Zheng, X., Ghigna, C., & Shen, H. (2021). Widespread Alternative Splicing Changes in Metastatic Breast Cancer Cells. Cells, 10(4), 858. https://doi.org/10.3390/cells10040858