
Predicting Progression of Autosomal Dominant Polycystic Kidney Disease by Changes in the Telomeric Epigenome
 , , and
Abstract
:1. Introduction
2. Materials and Methods
2.1. Materials
2.2. Study Population
2.3. DNA Isolation from Blood Samples
2.4. Determination of Telomere Length
2.5. DNA: RNA Hybrid Isolation from DNA Samples
2.6. cDNA Synthesis
2.7. Determination of DNA:RNA Hybrid TERRA Levels in Real-Time PCR
2.8. Statistical Analyses
3. Results
4. Discussion
Shorter Telomere
5. Conclusions
Supplementary Materials
Author Contributions
Funding
Informed Consent Statement
Data Availability Statement
Conflicts of Interest
References
- Gabow, P.A. Autosomal dominant polycystic kidney disease. N. Engl. J. Med. 1993, 329, 332–342. [Google Scholar] [CrossRef]
- Menezes, L.F.; Germino, G.G. Systems biology of polycystic kidney disease: A critical review. Wiley Interdiscip. Rev. Syst. Biol. Med. 2015, 7, 39–52. [Google Scholar] [CrossRef] [Green Version]
- Li, X. Epigenetics and cell cycle regulation in cystogenesis. Cell. Signal. 2020, 68, 109509. [Google Scholar] [CrossRef]
- Ecder, T.; Schrier, R.W. Cardiovascular abnormalities in autosomal-dominant polycystic kidney disease. Nat. Rev. Nephrol. 2009, 5, 221–228. [Google Scholar] [CrossRef] [Green Version]
- Li, X. Epigenetics and autosomal dominant polycystic kidney disease. Biochim. Biophys. Acta (BBA)-Mol. Basis Dis. 2011, 1812, 1213–1218. [Google Scholar] [CrossRef] [PubMed] [Green Version]
- Li, X. Epigenetics in ADPKD: Understanding Mechanisms and Discovering Treatment; Exon Publications: Brisbane, Australia, 2015; pp. 283–311. [Google Scholar]
- Cherif, H.; Tarry, J.; Ozanne, S.; Hales, C. Ageing and telomeres: A study into organ-and gender-specific telomere shortening. Nucleic Acids Res. 2003, 31, 1576–1583. [Google Scholar] [CrossRef] [PubMed]
- Karlseder, J.; Smogorzewska, A.; de Lange, T. Senescence induced by altered telomere state, not telomere loss. Science 2002, 295, 2446–2449. [Google Scholar] [CrossRef] [PubMed] [Green Version]
- Azzalin, C.M.; Reichenbach, P.; Khoriauli, L.; Giulotto, E.; Lingner, J. Telomeric repeat–containing RNA and RNA surveillance factors at mammalian chromosome ends. Science 2007, 318, 798–801. [Google Scholar] [CrossRef]
- Lalonde, M.; Chartrand, P. TERRA, a multifaceted regulator of telomerase activity at telomeres. J. Mol. Biol. 2020, 432, 4232–4243. [Google Scholar] [CrossRef]
- Rassoulzadegan, M.; Sharifi-Zarchi, A.; Kianmehr, L. DNA-RNA Hybrid (R-Loop): From a Unified Picture of the Mammalian Telomere to the Genome-Wide Profile. Cells 2021, 10, 1556. [Google Scholar] [CrossRef]
- Roake, C.M.; Artandi, S.E. Approaching TERRA firma: Genomic functions of telomeric noncoding RNA. Cell 2017, 170, 8–9. [Google Scholar] [CrossRef] [PubMed] [Green Version]
- Balk, B.; Maicher, A.; Dees, M.; Klermund, J.; Luke-Glaser, S.; Bender, K.; Luke, B. Telomeric RNA-DNA hybrids affect telomere-length dynamics and senescence. Nat. Struct. Mol. Biol. 2013, 20, 1199–1205. [Google Scholar] [CrossRef] [PubMed]
- Chu, H.P.; Cifuentes-Rojas, C.; Kesner, B.; Aeby, E.; Lee, H.G.; Wei, C.; Oh, H.J.; Boukhali, M.; Haas, W.; Lee, J.T. TERRA RNA Antagonizes ATRX and Protects Telomeres. Cell 2017, 170, 86–101.e116. [Google Scholar] [CrossRef] [PubMed] [Green Version]
- Kidney Disease: Improving Global Outcomes (KDIGO). Chapter 2: Definition, identification, and prediction of CKD progression. Kidney Int. Suppl. 2013, 3, 63–72. [Google Scholar] [CrossRef] [Green Version]
- O’Callaghan, N.J.; Fenech, M. A quantitative PCR method for measuring absolute telomere length. Biol. Proced. Online 2011, 13, 1–10. [Google Scholar] [CrossRef] [Green Version]
- Livak, K.J.; Schmittgen, T.D. Analysis of relative gene expression data using real-time quantitative PCR and the 2− ΔΔCT method. Methods 2001, 25, 402–408. [Google Scholar] [CrossRef]
- Rao, X.; Lai, D.; Huang, X. A new method for quantitative real-time polymerase chain reaction data analysis. J. Comput. Biol. 2013, 20, 703–711. [Google Scholar] [CrossRef] [Green Version]
- Chebib, F.T.; Torres, V.E. Assessing risk of rapid progression in autosomal dominant polycystic kidney disease and special considerations for disease-modifying therapy. Am. J. Kidney Dis. 2021, 78, 282–292. [Google Scholar] [CrossRef]
- Schrier, R.W.; Brosnahan, G.; Cadnapaphornchai, M.A.; Chonchol, M.; Friend, K.; Gitomer, B.; Rossetti, S. Predictors of autosomal dominant polycystic kidney disease progression. J. Am. Soc. Nephrol. 2014, 25, 2399–2418. [Google Scholar] [CrossRef] [Green Version]
- Menon, V.; Rudym, D.; Chandra, P.; Miskulin, D.; Perrone, R.; Sarnak, M. Inflammation, oxidative stress, and insulin resistance in polycystic kidney disease. Clin. J. Am. Soc. Nephrol. 2011, 6, 7–13. [Google Scholar] [CrossRef]
- Wei, S.Y.; Pan, S.Y.; Li, B.; Chen, Y.M.; Lin, S.L. Rejuvenation: Turning back the clock of aging kidney. J. Formos. Med. Assoc. 2020, 119, 898–906. [Google Scholar] [CrossRef] [PubMed]
- Wang, Y.; Chen, S.; Feng, S.; Wang, C.; Jiang, H.; Rong, S.; Hermann, H.; Chen, J.; Zhang, P. Telomere shortening in patients on long-term hemodialysis. Chronic Dis. Transl. Med. 2021, 7, 266–275. [Google Scholar] [CrossRef]
- Gurung, R.L.; Dorajoo, R.; Wang, L.; Liu, S.; Liu, J.J.; Shao, Y.M.; Chen, Y.; Sim, X.; Ang, K.; Subramaniam, T.; et al. Association of leukocyte telomere length with chronic kidney disease in East Asians with type 2 diabetes: A Mendelian randomization study. Clin. Kidney J. 2021, 14, 2371–2376. [Google Scholar] [CrossRef] [PubMed]
- Fazzini, F.; Lamina, C.; Raschenberger, J.; Schultheiss, U.T.; Kotsis, F.; Schönherr, S.; Weissensteiner, H.; Forer, L.; Steinbrenner, I.; Meiselbach, H.; et al. Results from the German Chronic Kidney Disease (GCKD) study support association of relative telomere length with mortality in a large cohort of patients with moderate chronic kidney disease. Kidney Int. 2020, 98, 488–497. [Google Scholar] [CrossRef] [PubMed]
- Turner, K.J.; Vasu, V.; Griffin, D.K. Telomere biology and human phenotype. Cells 2019, 8, 73. [Google Scholar] [CrossRef] [PubMed] [Green Version]
- Luke, B.; Panza, A.; Redon, S.; Iglesias, N.; Li, Z.; Lingner, J. The Rat1p 5′ to 3′ exonuclease degrades telomeric repeat-containing RNA and promotes telomere elongation in Saccharomyces cerevisiae. Mol. Cell 2008, 32, 465–477. [Google Scholar] [CrossRef]
- Fernandes, R.V.; Feretzaki, M.; Lingner, J. The makings of TERRA R-loops at chromosome ends. Cell. Cycle 2021, 20, 1745–1759. [Google Scholar] [CrossRef]
- Bettin, N.; Oss Pegorar, C.; Cusanelli, E. The emerging roles of TERRA in telomere maintenance and genome stability. Cells 2019, 8, 246. [Google Scholar] [CrossRef] [Green Version]
- Galigniana, N.M.; Charó, N.L.; Uranga, R.; Cabanillas, A.M.; Piwien-Pilipuk, G. Oxidative stress induces transcription of telomeric repeat-containing RNA (TERRA) by engaging PKA signaling and cytoskeleton dynamics. Biochim. Biophys. Acta (BBA)-Mol. Cell Research. 2020, 1867, 118643. [Google Scholar] [CrossRef]
- Himmelbauer, H.; Pohlschmidt, M.; Snarey, A.; Germino, G.G.; Weinstat-Saslow, D.; Somlo, S.; Reeders, S.T.; Frischauf, A.M. Human-mouse homologies in the region of the polycystic kidney disease gene (PKD1). Genomics 1992, 13, 35–38. [Google Scholar] [CrossRef]
- Hu, J.; Harris, P.C. Regulation of polycystin expression, maturation and trafficking. Cell. Signal. 2020, 72, 109630. [Google Scholar] [CrossRef] [PubMed]
- Daniels, R.J.; Peden, J.F.; Lloyd, C.; Horsley, S.W.; Clark, K.; Tufarelli, C.; Kearney, L.; Buckle, V.J.; Doggett, N.A.; Flint, J.; et al. Sequence, structure and pathology of the fully annotated terminal 2 Mb of the short arm of human chromosome 16. Hum. Mol. Genet. 2001, 10, 339–352. [Google Scholar] [CrossRef] [PubMed]
- Bowden, S.A.; Rodger, E.J.; Chatterjee, A.; Eccles, M.R.; Stayner, C. Recent Discoveries in Epigenetic Modifications of Polycystic Kidney Disease. Int. J. Mol. Sci. 2021, 22, 13327. [Google Scholar] [CrossRef] [PubMed]
- Menezes, L.F.; Zhou, F.; Patterson, A.D.; Piontek, K.B.; Krausz, K.W.; Gonzalez, F.J.; Germino, G.G. Network analysis of a Pkd1-mouse model of autosomal dominant polycystic kidney disease identifies HNF4α as a disease modifier. PLoS Genet. 2012, 8, e1003053. [Google Scholar] [CrossRef] [Green Version]
- de Almeida, R.; Clendenon, S.G.; Richards, W.G.; Boedigheimer, M.; Damore, M.; Rossetti, S.; Harris, P.C.; Herbert, B.S.; Xu, W.M.; Wandinger-Ness, A.; et al. Transcriptome analysis reveals manifold mechanisms of cyst development in ADPKD. Hum. Genom. 2016, 10, 1–24. [Google Scholar] [CrossRef]


| Oligomers | Species | Oligomer Sequences (5′→3′) | Amplicon Size | |
|---|---|---|---|---|
| Standards | Telomer standard | human | (TTAGGG)14 | 84 bp |
| 36B4 standard | Human | CAGCAAGTGGGAAGGTGTAATCCGTC TCCACAGACAAGGCCAGGACTCGTTTGTACCCGTTGATGATAGAATGGG | >75 bp | |
| PCR Primers | Telo F | Human | CGGTTTGTTTGGGTTTGGGTTTGGGTTTGGGTTTGGGT | 75 bp |
| Telo R | Human | GGCTTGCCTTACCCTTACCCTTACCCTTACCCTTACCCT | 75 bp | |
| 36B4 F | Human | CAGCAAGTGGGAAGGTGTAATCC | 82 bp | |
| 36B4 R | Human | CCCATTCTATCATCAACGGGTACA | 82 bp | |
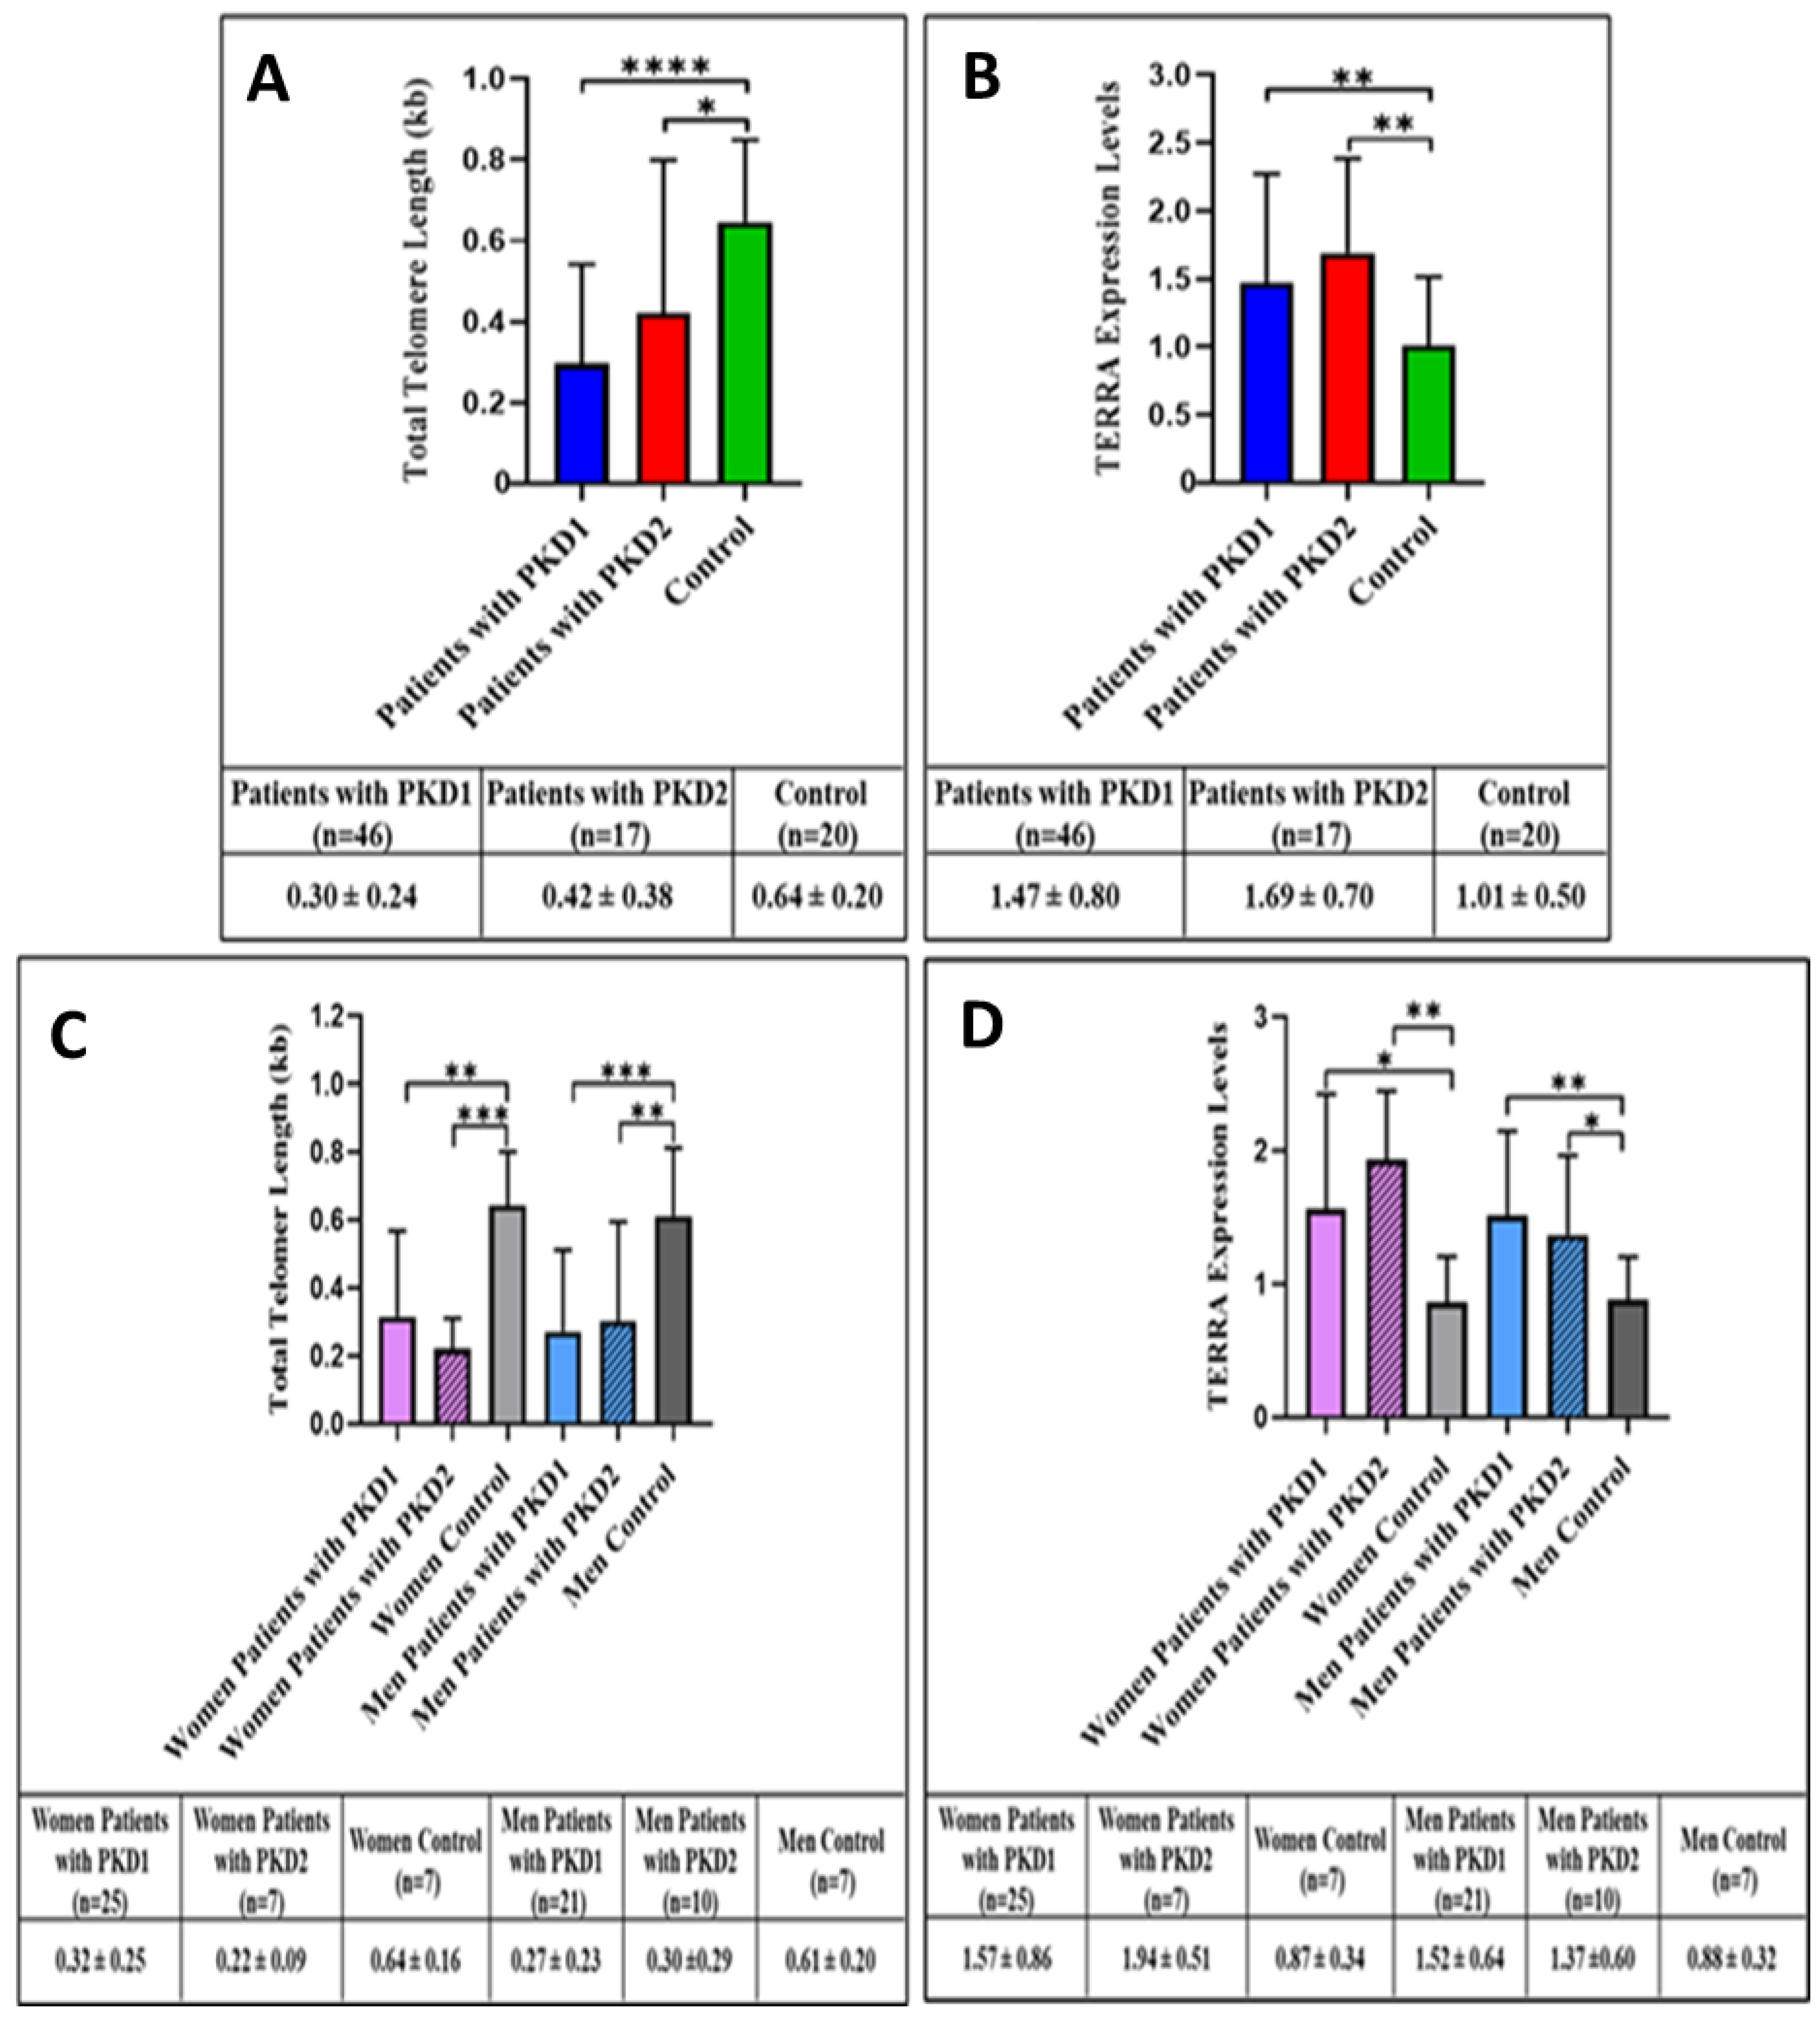
| Variable | PKD Mutation | p Value | |
|---|---|---|---|
| PKD1 (n = 43) | PKD2 (n = 22) | ||
| TERRA Levels | 1.69(1.04–3.36) | 1.15(0.97–2.21) | 0.039 |
| Telomere Length | 0.14(0.11–0.28) | 0.21(0.12–0.56) | 0.126 |
| Variable | Groups | Total | p Value | |
|---|---|---|---|---|
| Normal Progression (n = 62) | Rapid Progression (n = 16) | |||
| Age (year) | 49.26 ± 13.43 | 44.63 ± 14.29 | 48.31 ± 13.64 | 0.228 |
| Sex | 32(51.6) | 9(56.3) | 41(52.6) | 0.741 |
| Follow-up time (months) | 84.0(45.0–96.0) | 96.0(54.0–96.0) | 84.0(48.0–96.0) | 0.258 |
| PKD gene mutation | ||||
| PKD1 | 31(50.0) | 12(75.0) | 43(55.1) | 0.078 |
| PKD2 | 21(33.9) | 1(6.3) | 22(28.2) | |
| Non-diagnosed | 10(16.1) | 3(18.8) | 13(16.7) | |
| eGFR (mL/min/1.73 m2) | 77.00(47.00–91.00) | 35.50(25.50–54.25) | 67.00(35.50–89.00) | <0.001 |
| Sodium (mmol/L) | 138.43 ± 3.69 | 136.81 ± 3.49 | 138.09 ± 3.69 | 0.119 |
| Potassium (mmol/L) | 4.38 ± 0.52 | 4.74 ± 0.74 | 4.46 ± 0.59 | 0.027 |
| Albumin (g/dL) | 4.31 ± 0.42 | 4.28 ± 0.37 | 4.30 ± 0.41 | 0.774 |
| Glucose (mmol/L) | 201.5(156.5–273.5) | 258.0(189.0–290.0) | 208.0(160.0–288.0) | 0.317 |
| Triglyceride (mg/dL) | 96.0(89.0–102.0) | 97.5(88.5–152.0) | 96.0(89.0–104.5) | 0.321 |
| LDL cholesterol (mg/dL) | 124.90 ± 29.75 | 126.00 ± 43.24 | 125.18 ± 33.19 | 0.931 |
| Hemoglobin(g/dL) | 13.45 ± 1.81 | 12.99 ± 1.48 | 13.35 ± 1.74 | 0.349 |
| CRP (mg/dL) | 3.00(3.00–5.00) | 13.00(7.00–18.00) | 4.00(3.00–7.00) | <0.001 |
| Proteinuria (g/dL) | 0.17(0.10–0.25) | 0.86(0.56–1.20) | 0.21(0.10–0.50) | <0.001 |
| Hybrid TERRA levels | 1.20(0.84–1.67) | 2.70(1.61–4.00) | 1.31(0.93–2.11) | <0.001 |
| Telomere length | 0.23(0.12–0.73) | 0.12(0.07–0.41) | 0.22(0.12–0.71) | 0.041 |
| Variable | Univariate | Multiple | ||
|---|---|---|---|---|
| OR (%95CI) | p Value | OR (%95CI) | p Value | |
| Age (year) | 0.97(0.93–1.02) | 0.227 | - | - |
| Sex (female/male) | 1.21(0.40–3.64) | 0.001 | - | - |
| Follow-up time (months) | 1.01(0.99–1.03) | 0.349 | - | - |
| PKD gene mutation | ||||
| PKD1 | 1.00 | - | - | - |
| PKD2 | 1.29(0.30–5.51) | 0.731 | - | - |
| Non-diagnosed | 0.16(0.02–1.72) | 0.130 | - | - |
| eGFR (mL/min/1.73 m2) | 0.97(0.94–0.99) | 0.002 | - | - |
| Sodium (mmol/L) | 0.89(0.77–1.03) | 0.122 | - | - |
| Potassium (mmol/L) | 3.07(1.10–8.58) | 0.032 | - | - |
| Albumin (g/dL) | 0.82(0.21–3.15) | 0.771 | - | - |
| Glucose (mmol/L) | 1.00(1.00–1.01) | 0.498 | - | - |
| Triglyceride (mg/dL) | 1.03(1.01–1.05) | 0.014 | - | - |
| LDL cholesterol (mg/dL) | 1.00(0.98–1.02) | 0.914 | - | - |
| Hemoglobin(g/dL) | 0.86(0.63–1.18) | 0.347 | - | - |
| CRP (mg/dL) | 1.08(1.01–1.17) | 0.029 | 1.21(1.05–1.38) | 0.007 |
| Proteinuria (g/dL) | 91.11(9.75–851.49) | <0.001 | 16.64(1.13–245.47) | 0.041 |
| TERRA levels | 3.67(1.74–7.74) | 0.001 | 5.60(1.46–21.51) | 0.012 |
| Telomere length | 0.48(0.10–2.29) | 0.157 | - | - |
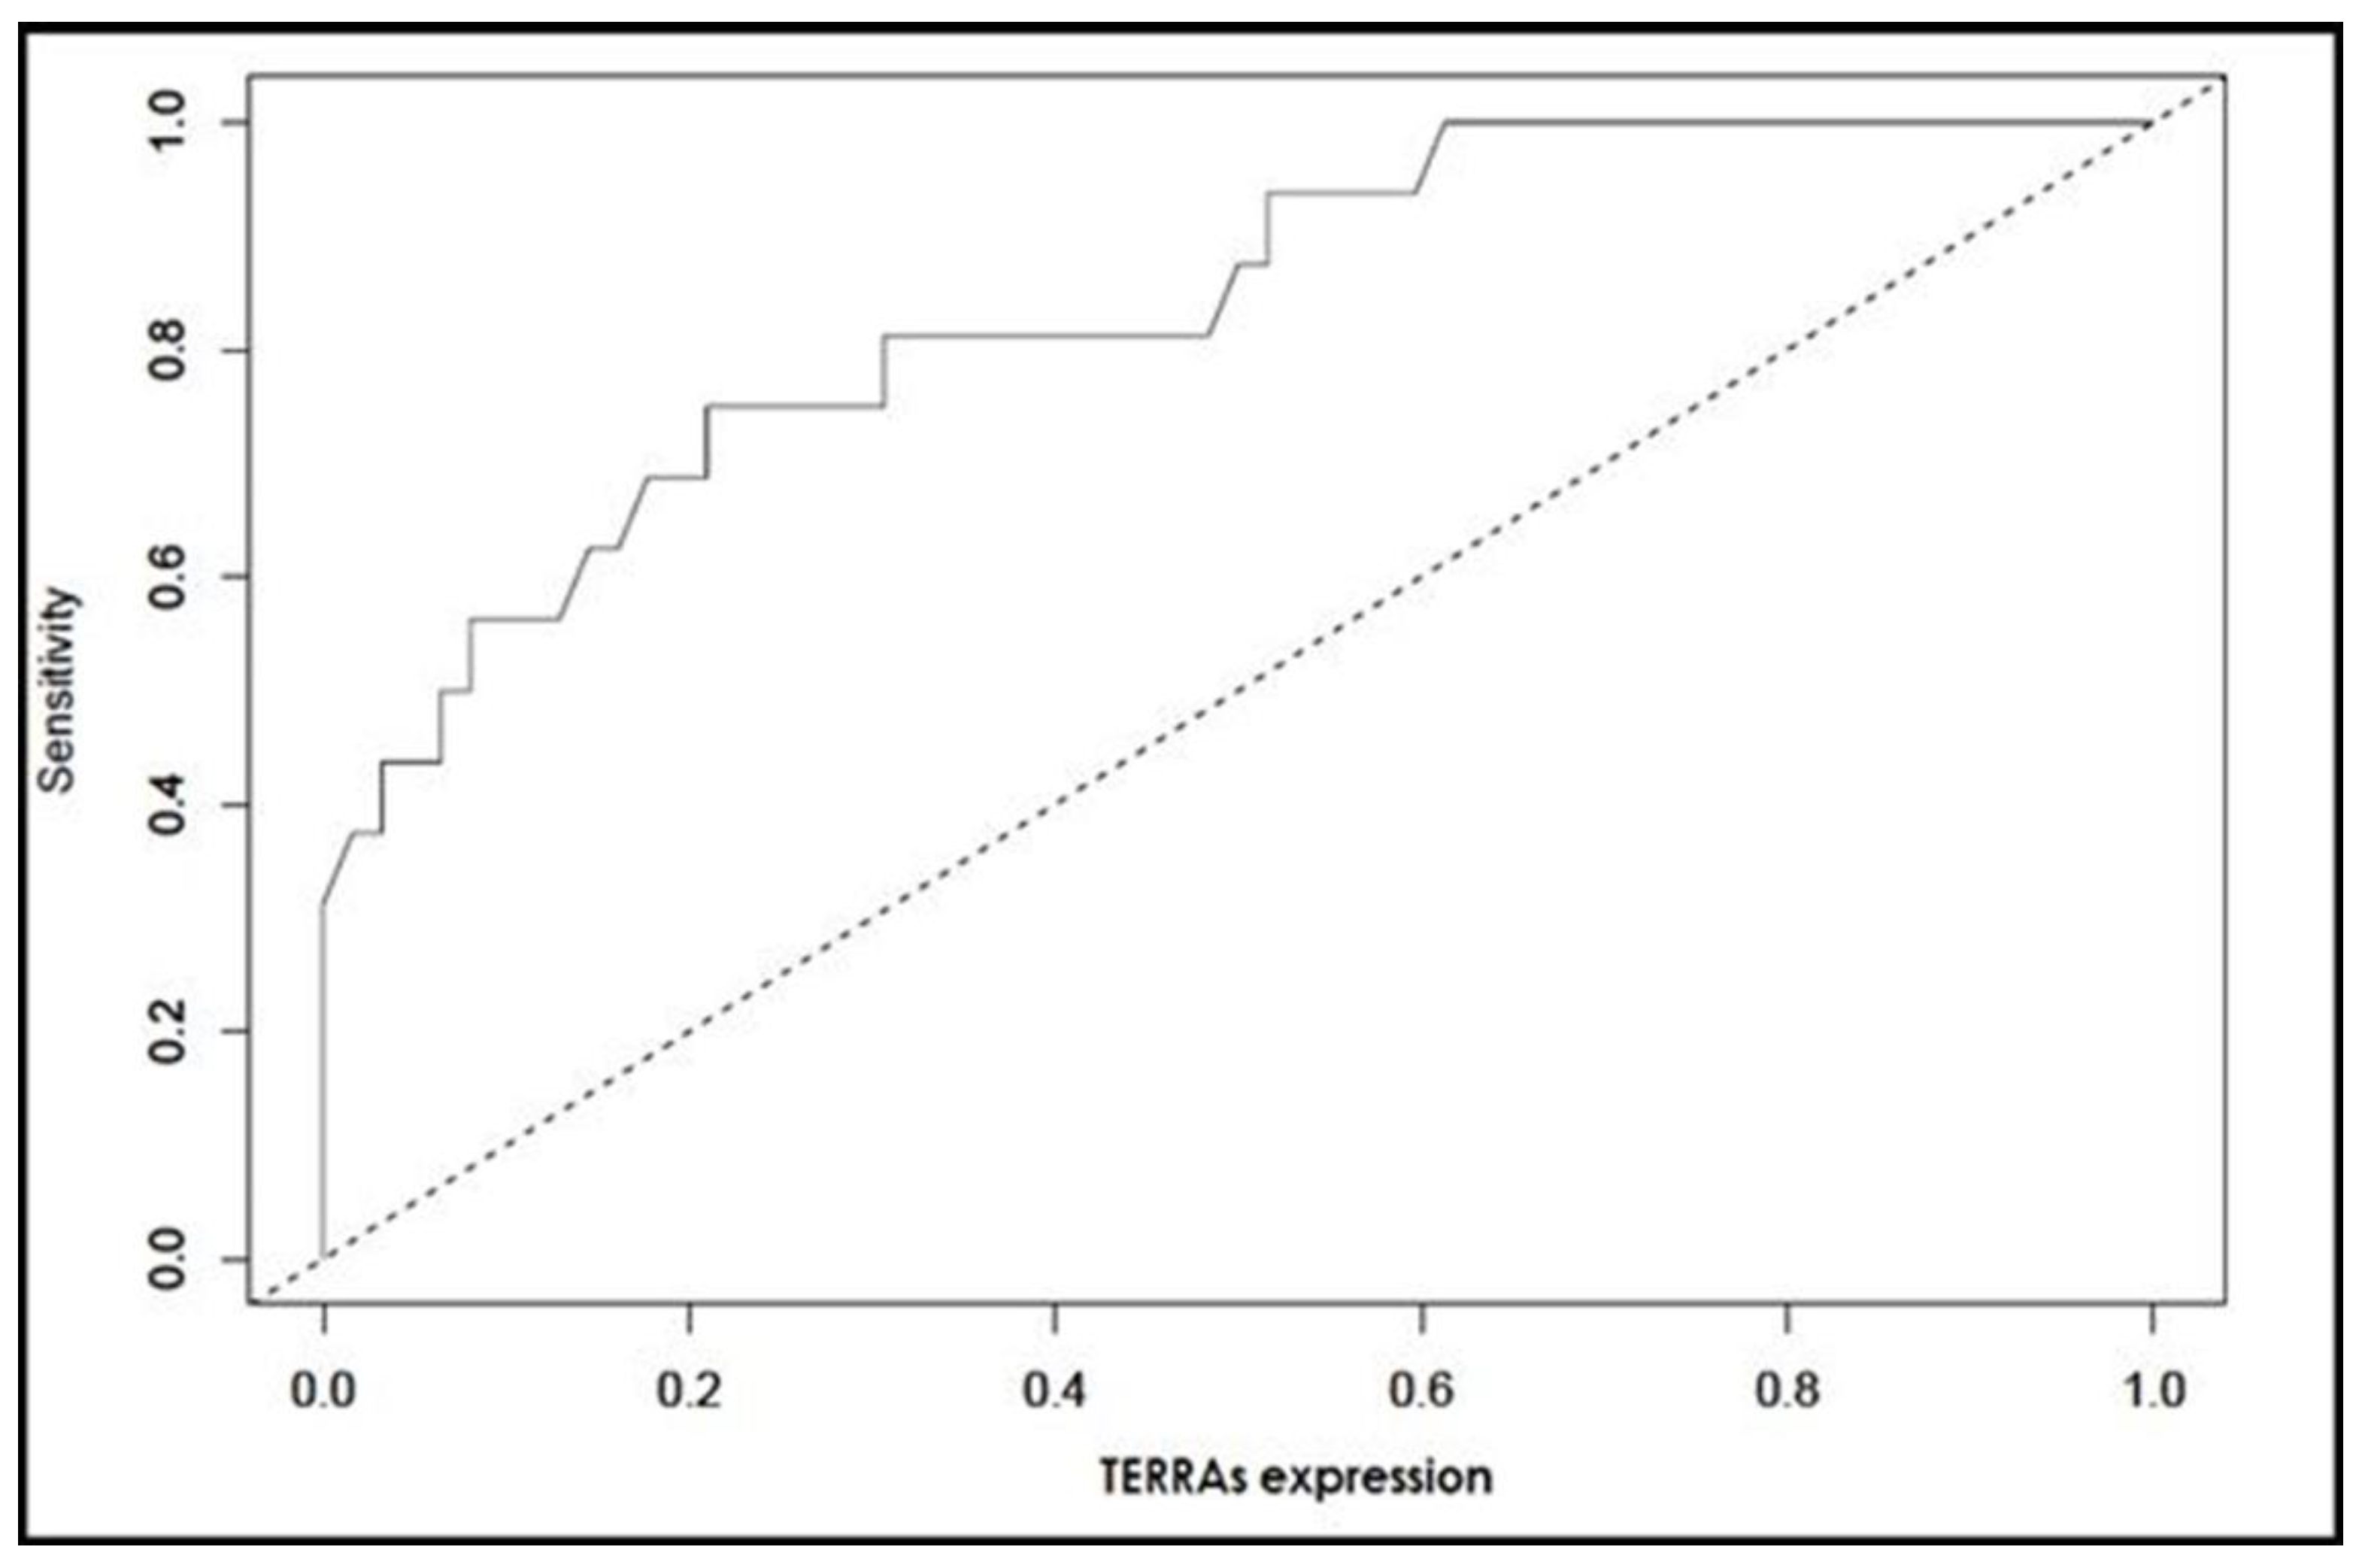
| Potential Biomarker | ROC statistic | Diagnostic Statistic | ||||
|---|---|---|---|---|---|---|
| AUC (%95 CI) | p Value | Sensitivity | Specificity | Positive Predictive Value | Negative Predictive Value | |
| TERRA Levels <1.804 | 0.836 (0.725–0.947) | <0.001 | 0.75 (0.48–0.93) | 0.79 (0.67–0.88) | 0.48 (0.33–0.80) | 0.93 (0.79–0.96) |
Publisher’s Note: MDPI stays neutral with regard to jurisdictional claims in published maps and institutional affiliations. |
© 2022 by the authors. Licensee MDPI, Basel, Switzerland. This article is an open access article distributed under the terms and conditions of the Creative Commons Attribution (CC BY) license (https://creativecommons.org/licenses/by/4.0/).
Share and Cite
Kocyigit, I.; Taheri, S.; Uysal, C.; Memis, M.; Ozayturk, S.G.; Zararsiz, G.; Rassoulzadegan, M. Predicting Progression of Autosomal Dominant Polycystic Kidney Disease by Changes in the Telomeric Epigenome. Cells 2022, 11, 3300. https://doi.org/10.3390/cells11203300
Kocyigit I, Taheri S, Uysal C, Memis M, Ozayturk SG, Zararsiz G, Rassoulzadegan M. Predicting Progression of Autosomal Dominant Polycystic Kidney Disease by Changes in the Telomeric Epigenome. Cells. 2022; 11(20):3300. https://doi.org/10.3390/cells11203300
Chicago/Turabian StyleKocyigit, Ismail, Serpil Taheri, Cihan Uysal, Mehmet Memis, Salih Guntug Ozayturk, Gokmen Zararsiz, and Minoo Rassoulzadegan. 2022. "Predicting Progression of Autosomal Dominant Polycystic Kidney Disease by Changes in the Telomeric Epigenome" Cells 11, no. 20: 3300. https://doi.org/10.3390/cells11203300