
NFAT Factors Are Dispensable for the Development but Are Critical for the Maintenance of Foxp3+ Regulatory T Cells

1
Peninsula School of Medicine, University of Plymouth, Plymouth PL6 8BU, UK
2
Department of Biology and Biochemistry, University of Bath, Bath BA2 7AX, UK
3
Department of Molecular Pathology, Institute of Pathology, University of Würzburg, Josef Schneider-Str. 2, 97080 Würzburg, Germany
*
Author to whom correspondence should be addressed.
Cells 2022, 11(9), 1397; https://doi.org/10.3390/cells11091397
Submission received: 10 March 2022
/
Revised: 11 April 2022
/
Accepted: 13 April 2022
/
Published: 20 April 2022
(This article belongs to the Section Cellular Immunology)
Abstract
:The transcription factors of the nuclear factor of activated T cell (NFAT) family play a crucial role in multiple aspects of T cell function. It has recently been reported that NFATs play an important role in the suppressive function of CD4+CD25+Foxp3+ regulatory T (Treg) cells. In this study, we have investigated the role of NFATs in the thymic development of Treg cells in mice. We show that NFAT factors are dispensable for the development of Foxp3+ Treg cells in the thymus but are critical for the maintenance of both the phenotype and survival of Treg cells in the thymus as well as in peripheral lymphoid organs. Specifically, the homeostasis of CD4+CD25+Foxp3+ but not the CD4+CD25−Foxp3+ fraction is severely perturbed when NFAT signaling is blocked, leading to a strongly reduced Treg population. We underscored this intriguing effect of NFAT on CD4+CD25+Foxp3+ Treg cells to the disruption of survival signals provided by interleukin 2 (IL-2). Accordingly, blocking Treg cell death by abolishing the activity of pro-apoptotic Bcl-2 family member Bim, compensated for the survival defects induced due to a lack of NFAT-IL-2-IL-2R signaling. Inhibition of NFAT activity led to a strong reduction in the number of Foxp3+ Treg cells; however, it did not influence the level of Foxp3 expression on an individual cell basis. In addition, we show a differential effect of IL-2 and IL-7 signaling on Foxp3+ Treg versus CD4+CD25− T cell development, again underlining the dispensability of NFAT signaling in the development, but not in the maintenance of Foxp3+ Treg cells.
1. Introduction
The role of CD4+CD25+Foxp3+ regulatory T (Treg) cells in abating the development of autoimmune diseases has been an area of intense study in recent years. Several studies have shown the development of various organ-specific autoimmune disorders in both mouse and human, due to the lack of Treg cells. Foxp3+ Treg cells constitute nearly 5% of the mature CD4+ single positive thymocytes and up to 15% of the peripheral CD4+ T cells. Many recent studies have shown that mouse models having alterations in various signaling pathways bear an increased or decreased population of Foxp3+ Treg cells. Although the mechanism of Foxp3+ Treg cell-mediated prevention of autoimmunity by suppressing CD4+CD25− effector cells is well studied, the signals controlling the development of Foxp3+ Treg cells are still not clearly elucidated. It has recently been reported that TGF-β and other signals control the generation of CD4+CD25+Foxp3+ Treg cells in the periphery [1,2,3,4,5] Several recent studies have documented the thymic origin of Treg cells [6,7,8]. Additionally, mice thymectomized at day 3 after birth lack Foxp3+ Treg cells in the periphery and develop autoimmune diseases [9,10]. Thus, the thymus plays a major role in the development of Foxp3+ Treg cells, although additional mechanisms appear to be involved in their generation in the periphery. Mice deficient in Tgfb1, or T-cell-specific knockout for Tgfbr2, have a normal thymic development of Foxp3+ Treg cells indicating TGF-β signaling is dispensable for the thymic development of these cells [11,12,13]. So far, the precise signals controlling the development of Foxp3+ Treg cells in the thymus are not known.
The nuclear factor of activated T cell (NFAT) family transcription factors (TF) play an important role in the development and function of T lymphocytes [14,15,16,17]. Recently, it has been reported that NFATc2 plays a role in the suppressive function of Foxp3+ Treg cells by directly interacting with Foxp3. NFATc2-Foxp3 complexes appear to suppress Il2 and activate Ctla4 and Cd25 gene expression in Foxp3+ Treg cells [18]. Additionally, NFAT proteins have been reported to play an important role in the functioning of induced-Treg (iTreg) cells in the periphery [19]. Thus, it is evident that NFAT proteins play an important role in the functioning of Treg cells. However, it is unknown whether NFAT proteins play any role in the thymic development of natural Foxp3+ Treg (nTreg) cells. Mice deficient in NFATc2 and NFATc3 show a normal Foxp3+ Treg population in the periphery compared to WT mice [20]. Mice deficient in NFATc1 are embryonic lethal [21], and the role of NFATc1 in the development of Foxp3+ Treg cells has not been studied. In the current study, we have explored the involvement of NFAT proteins in the thymic development of CD4+CD25+Foxp3+ nTreg cells. We show that NFAT is not necessary for thymic development but is crucial for the maintenance of Foxp3+ nTreg cells in the thymus and periphery.
2. Materials and Methods
2.1. Mice
C57BL/6 WT, calcineurin tg (∆Cam), Il2-/-, Il2-/-Bim-/-, Nfatc2-/-Nfatc3-/-, Jak3-/-, DEREG and Vav-creNfatc1αAfl/fl mice were maintained in the animal facility of the Institute for Virology and Immunobiology, University of Wuerzburg, according to institutional guidelines. Il7r-/- mice were kindly provided by Dr. Thomas Schueler, Institute of Immunology, Charité, Berlin. All mice were on C57BL/6 background and were used either at day 1 after birth or at 6 weeks of age. For the analysis of aged mice, WT BL/6 mice of over one year of age were used. All mice were used according to institutional guidelines.
2.2. Antibodies, Cell Sorting and Flow Cytometry
Anti-CD4 (GK1.5), anti-CD8 (53–6.7), anti-CD25 (PC61 and 7D4), anti-CD3 (145.2C11) and anti-CD28 (37.51) antibodies were all purchased from BD-Pharmingen (Franklin Lakes, NJ, USA). Biotinylated antibodies were revealed with streptavidin-APC. Thymocytes, LN cells or splenocytes were surface stained with anti-CD4, anti-CD8 and anti-CD25 Abs and were analyzed in a FACS Calibure (Becton Dickinson, Heidelberg, Germany). For cell sorting, thymocytes or LN cells were surface stained with anti-CD4, anti-CD8 and anti-CD25 Abs and DN or DP thymocytes, or CD4+CD25− and CD4+CD25+ T cells from LNs were FACS sorted using a FACSVantage cell sorter and FACS DIVA software (Becton Dickinson, Heidelberg, Germany).
2.3. Neonatal Thymic Organ Culture (NTOC)
Thymic lobes from one-day-old newborn WT BL/6 mice were cultured on nucleopore membranes (Whatman) in 1 ml cRPMI-1640 medium supplemented with 10% FCS, with PMA (100 ng/mL) plus Ionomycin (100 ng/mL) in presence or absence of CsA (100 ng/mL) or with PMA or Ionomycin alone at 37 °C for 3.5 days. Similarly, Il2-/- newborn thymic lobes were cultured in presence or absence of recombinant murine interleukin-7 (IL-7; 20 ng/mL, PeproTech) for 3.5 days. Afterwards, single cell suspensions were surface stained for CD4, CD8 and CD25 and analyzed for the CD4+CD25+ population gated on CD4+ T-cells in FACSCalibure using CellQuest (Becton Dickinson, Heidelberg, Germany) software.
2.4. Intracellular Foxp3 and Bcl-2 Staining
Intracellular Foxp3 staining was performed with a rat-anti-mouse Foxp3 staining kit (eBioscience) according to manufacturer’s protocol and as published previously [22]. Briefly, thymocytes or LN cells were first surface stained with anti-CD4, anti-CD8 and anti-CD25 Abs. Surface-stained cells were fixed in 1X Fixperm buffer at room temperature (RT) washed and was stained for intracellular Foxp3 in 1X permeabilization buffer at RT. Afterwards, cells were washed in permeabilization buffer and were analyzed for Foxp3 positive population gated on CD4+ T cells using a FACSCalibure and CellQuest software. Intracellular Bcl-2 staining was performed as published previously [16].
2.5. Confocal Microscopy
Immunofluorescence staining for confocal microscopy analysis was performed as described previously [16]. Sorted WT CD4+CD25− and CD4+CD25+ T cells from LNs were fixed and stained for NFATc1 (rabbit polyclonal, ImmunoGlobe) and with rat anti-mouse Foxp3 antibodies (eBioscience). Similarly, anti-CD3 (1 μg/mL) plus anti-CD28 (5 μg/mL) antibodies stimulated WT CD4+CD25− and CD4+CD25+ T cells from LNs or sorted DN and DP thymocytes from WT and ∆Cam tg mice were stained with NFATc1 antibodies. In each case, cells were co-stained with DAPI to ascertain nuclear staining. Images were acquired using a Leica TCS SP2 confocal laser-scanning microscope and software.
2.6. Cell Death Analysis
Thymic lobes left untreated or treated with CsA (100 ng/mL) at 24 h of NTOC were collected and single cell suspension were prepared. Cells were stained for CD4, CD8 and CD25, and cell death was analyzed by Annexin V staining following manufacturer’s protocol (BD Biosciences).
2.7. Statistics
Data are presented as mean ± s.d. Statistical significance was assessed using Student’s t-test for comparison between two groups and ANOVA for differences between groups.
3. Results
3.1. Constitutive Calcineurin/NFAT Activity Does Not Affect the Development of Foxp3+ nTreg Cells in the Thymus
We have previously reported that a high and constitutive nuclear NFAT activity blocked T-cell development in calcineurin transgenic (∆Cam) mice at the double negative stage 3 (DN3) [23]. This was due to a severe defect in the formation of preTCR in the DN3 thymocytes, and as a result, only few CD4+CD8+ double positive (DP) thymocytes were generated in the thymus of these mice. In ∆Cam mice, thymic output was drastically reduced, as is evident from low total thymic cellularity as well as the T-cell populations in the periphery (Supplementary Figure S1a). Compared to WT littermate controls, ∆Cam mice are significantly lymphopenic as the cellularity in the thymus and peripheral lymphoid organs are severely affected (Supplementary Figure S1b). However, in these mice no signs of increased susceptibility to autoimmune diseases or infections were observed until one and half years of age.
To study whether the calcineurin/NFAT-mediated defects in T-cell development in ∆Cam mice affect the development of nTreg cells, we analyzed the thymus and LNs from these mice for CD4+CD25+Foxp3+ cells. Although more than 80% of CD4+ T-cells in the thymus were CD25+, we detected a normal proportion of CD4+Foxp3+ nTreg population in the thymus of ∆Cam mice, compared to age matched WT mice (Figure 1a–d). However, a significantly increased proportion of both CD4+CD25+ as well as CD4+Foxp3+ nTreg populations were observed in the peripheral lymphoid organs of ∆Cam mice (Figure 1a–d). To rule out any interference from the transgenic calcineurin, we analyzed the Vav-creNfatc1αAfl/fl mice, in which NFAT activity is enhanced due to the expression of a constitutively active form of NFATc1 in a Cre-dependent manner [17]. In Vav-creNfatc1αAfl/fl mice, we observed a similar effect of increased NFAT activity on thymic generation of CD4+Foxp3+ nTreg cells as in the ∆Cam mice (Supplementary Figure S1c–f). In these mice also the overall T cell development was severely affected [17]. The observations from both these animal models suggest that a high and constitutive NFAT activity does not affect the development of Foxp3+ nTreg cells in the thymus, although it exerts a profound negative effect on non-Treg thymocyte development.
Cooperation between Foxp3 and NFAT has been reported to play a role in the suppressor function of Treg cells [18]. However, it is unclear whether NFAT proteins play a role in nTreg cell development. To check whether CD4+CD25− effector T cells (Teff) and CD4+CD25+ nTreg cells have any intrinsic difference in NFAT activity, we analyzed nuclear levels of NFATc1 in these cells from WT mice by confocal microscopy. We observed a low but similar levels of nuclear NFATc1 in freshly isolated both CD4+CD25− Teff and CD4+CD25+ nTreg cells (Figure 1e,f), whereas a stark difference in the expression of Foxp3 was observed in these two populations (Figure 1e). Confocal microscopy analysis failed to demonstrate any correlation between NFAT and Foxp3 expression patterns, neither in the nTreg nor in the Teff populations. As the nTreg and Teff cells arise from the DP thymocytes we analyzed the nuclear level of NFATc1 in WT and ∆Cam DP cells. As shown in Figure 1g, ∆Cam DP cells have considerably higher nuclear NFATc1 levels than wild-type DP cells. However, the development of nTreg cell population in the thymus of these mice remained unaffected (Figure 1c,d). Additionally, upon anti-CD3 plus anti-CD28 antibodies stimulation, NFATc1 was predominantly found within the nucleus, to a similar extent in both nTreg and Teff cells (Figure 1h,i), indicating that nTreg cells do not have any inherent defect in NFAT activation. Together with the observations from ∆Cam mice, the confocal microscopy analysis indicates that the level of NFAT expression is not correlated with Foxp3+ nTreg cell development. Interestingly, NFAT levels did not influence the levels of Foxp3 expression as both in the ∆Cam and Vav-creNfatc1αAfl/fl mice, nTreg cells expressed a similar level of Foxp3 as in WT nTreg cells (Figure 1j and Supplementary Figure S1g).
3.2. Deficiency in NFATc2 and NFATc3 Does Not Affect Thymic Development of Foxp3+ nTreg Cells
To further clarify the role of NFAT proteins in Foxp3+ nTreg cell development, we investigated mice deficient in two of the three predominantly lymphoid specific NFAT family members. Mice deficient in NFATc2 and NFATc3 (Nfatc2-/-Nfatc3-/-) do not have any apparent abnormality in thymocyte development whereas the peripheral T-cells from these mice are hyperactive [24]. As shown in Supplementary Figure S2a, the cellularity in the thymus and LNs of Nfatc2-/-Nfatc3-/- mice are comparable to that of littermate control mice. These mice do not have any problem either in the development of thymocytes or in the generation of peripheral CD4+ and CD8+ T cells (Supplementary Figure S2b). The distribution of CD4+CD25+ T cells was increased in the thymus of Nfatc2-/-Nfatc3-/- mice, whereas, in the LN it was comparable with that of WT control mice (Figure 2a,b). However, development of Foxp3+ nTreg population, neither in the thymus nor in the periphery was affected in the Nfatc2-/-Nfatc3-/- mice (Figure 2c,d). Interestingly, the lack of NFATc2 and NFATc3 did not have any effect on the level of Foxp3 expression in the nTreg cells from Nfatc2-/-Nfatc3-/- mice (Figure 2e), suggesting that Foxp3 expression is independent of NFATc2 and NFATc3 activity. Despite the deficiency of NFATc2 and NFATc3, a distinct Foxp3+ population was observed in the DN and DP thymocytes of the Nfatc2-/-Nfatc3-/- mice, as was detected in the WT and ∆Cam mice (Figure 2f). Similar to the CD4+CD25-Foxp3+ population, the Foxp3+ cells in DN and DP populations in WT, ∆Cam and Nfatc2-/-Nfatc3-/- mice were found to be CD25 low or negative (Figure 2f). These Foxp3+ cell’s presence in the DN and DP thymocytes was confirmed in the DEREG mice [25], where Foxp3 expression could be analyzed by GFP expression (Supplementary Figure S2c,d). This indicates that CD25 expression is not correlated with Foxp3 expression. The CD25-Foxp3+ cells in the DN population most likely arise from DN4 cells expressing the preTCR, since DN2 and DN3 cells are CD25+. This is in consistence with a previous report showing the absence of Foxp3+ cells in Rag1-/- mice [26]. However, it is unlikely that preTCR signals alone could stimulate the development of this small fraction of Foxp3+ cells as the same preTCR signals do not induce Foxp3 expression in the rest of DN4 cells. Similarly, αβ-TCR signals do not seem to induce Foxp3 in the minor fraction of Foxp3+ DP cells. Thus, it is unknown which signal(s), alone or in combination with preTCR or αβ-TCR signals, induces Foxp3 expression in thymocytes destined to become nTreg cells. Taken together, the development of Foxp3+ nTreg cells appears to be independent of the influence of NFAT proteins, as NFAT overactivity (∆Cam and Vav-creNfatc1αAfl/fl mice) or NFATc2 and NFATc3 deficiency (Nfatc2-/-Nfatc3-/-) does not affect the generation of these cells.
3.3. Cyclosporin A (CsA) Treatment Reduces the Population of Foxp3+ Treg Cells Both in the Thymus and in the Periphery
As lymphocytes from Nfatc2-/-Nfatc3-/- mice still express NFATc1, this could compensate for the deficiency of other two members and control nTreg cell development. NFATc1 appears to be the critical NFAT protein that regulate T cell development, as a hematopoietic cells-specific ablation of NFATc1 resulted in a block of T cell development at the DN1 stage [16]. This phenotype of the mice lacking NFATc1 in the hematopoietic cells, ruled out further analysis of Treg cell development in them. However, to study how Treg cell development is affected in complete absence of all NFAT proteins, we analyzed the development of Foxp3+ Treg cells in neonatal thymic lobe cultures (NTOC) from newborn wild-type mice cultured in the absence or presence of low doses of CsA. Since CsA blocks NFAT activation by inhibiting calcineurin activity, it should disrupt the effect of all NFAT proteins on Foxp3+ Treg cell development. In NTOCs, CsA treatment did not result in any significant alterations in the distribution or number of CD4+ T cells compared to the control lobes (Supplementary Figure S3a,b). However, post 3.5 days of CsA treatment, analysis of NTOC shows that CsA strongly downregulated the population of CD4+CD25+ cells (Figure 3a,b). Due to the reported NFAT-mediated control of CD25 expression in T cells [27], a loss of CD25 expression though was expected upon CsA treatment; however, simultaneously a strong decrease in CD4+Foxp3+ population was also observed in the CsA-treated lobes (Figure 3c,d). Interestingly, this decrease in Foxp3+ cells was restricted to the CD4+CD25+Foxp3+ fraction as the proportion of CD4+CD25-Foxp3+ Treg cells remained unaffected by CsA treatment (Figure 3c,d). Again, blocking NFAT activity by CsA had no effect on the level of Foxp3 expression in the surviving CD4+CD25-Foxp3+ Treg cells (Figure 3e).
To test our assumption that CD25 plays an essential role in the survival (and not in development) of CD4+CD25+Foxp3+ nTreg cells we investigated thymocytes and T cells from mice deficient for IL-2. As shown in Figure 3f,g, and reported by others [28,29], IL-2 deficiency led to a decrease in Foxp3+ nTreg population, more strongly in the periphery than in the thymus. Interestingly, similar to the CsA treatment of NTOCs (Figure 3c,d), both in the thymus and in periphery the reduction in Foxp3+ nTreg population was mostly due to a specific abolition of CD25+Foxp3+ cells (Figure 3f,g). On the other hand, the maintenance of CD25-Foxp3+ nTreg cells (Figure 3f,g), as well as the level of Foxp3 expression (Figure 3h) remained unaffected in the absence of IL-2 signaling.
3.4. PMA Signals Negatively Regulate the Development of Foxp3+ nTreg Cells in the Thymus
To further investigate the role of NFAT proteins in Foxp3+ nTreg cell development we treated NTOCs from newborn mice with PMA and ionomycin (IO) in absence or presence of CsA for 3.5 days to induce NFAT activation and to suppress it by CsA. Under these conditions, we did not observe any overt perturbation neither in the distribution of thymic subsets based on CD4 and CD8 stainings nor in the thymic cellularity (Supplementary Figure S4a,b). PMA + IO treatment has been shown to enhance negative selection of self-reactive T cells in the thymus [30]. Analysis of NTOCs showed an increase in the population of CD4+CD25+ cells in the PMA + IO-treated NTOCs, which was reversed by CsA treatment suggesting the upregulation of NFAT activity and NFAT-mediated CD25 expression by PMA + IO (Figure 4a,b). However, in the PMA + IO-treated NTOCs the development of CD4+Foxp3+ nTreg cells was severely reduced compared to non-treated NTOCs (Figure 4c,d). This drastic effect of PMA + IO treatment on CD4+Foxp3+ nTreg cell development was not induced because of high NFAT activity, as CsA treatment of PMA + IO-treated NTOCs did not rescue the development of nTreg cells (Figure 4c,d). This suggests that NFAT proteins are not involved in the PMA + IO-mediated elimination of Foxp3+ nTreg cells in the NTOCs.
Next, we wanted to explore which of these two signals (PMA or IO) is responsible for the inhibition of the Foxp3+ nTreg cell development in NTOCs. Therefore, we treated NTOCs either with PMA or IO alone and studied the development of Foxp3+ nTreg cells 3.5 days later. Under these conditions, neither the thymic subsets distribution, nor cellularity was affected significantly (Supplementary Figure S4c,d). Distribution of CD4+CD25+ T cells was increased in both PMA- or IO-treated lobes compared to control NTOCs indicating the effectiveness of these treatments (Figure 4e,f). Interestingly, despite a similar increase in CD4+CD25+ T cells, NTOCs treated with IO alone showed a normal development of Foxp3+ nTreg cells, whereas Foxp3+ nTreg cell development was severely affected in NTOCs treated with PMA compared to untreated lobes (Figure 4g,h). Both the CD4+CD25+Foxp3+ and CD4+CD25-Foxp3+ populations were severely reduced in PMA-treated NTOCs, whereas development was normal in the control as well as in IO-treated NTOCs. However, under no condition was the level of Foxp3 expression affected in the nTreg cells, and their levels in the few surviving nTreg cells in the PMA-treated lobes were comparable to that of IO-treated or med control cells (Figure 4i). These observations suggest that the thymic development of Foxp3+ nTreg cells is independent of NFAT activity and is suppressed by signals generated by PMA.
3.5. NFAT Signals Are Not Essential for the Generation of Foxp3+ nTreg Cells
Inhibition of NFAT activity in CsA-treated NTOCs led to the disappearance of CD25+Foxp3+ nTreg cells (Figure 3 and Figure 4) by blocking the expression of CD25 and, therefore, IL-2 signaling via the common γ-chain. Since γ-chain-mediated signals arise not only from IL-2 but also from several other cytokines we wanted to analyze further the signals responsible for the development of Foxp3+ nTreg cells in the thymus. Because IL-7 plays a critical role in thymic T cell development as well as in maintenance of both naïve and memory peripheral CD4+ and CD8+ T cells [31], we analyzed Il7r-/- and Jak3-/- mice for the development of Foxp3+ nTreg cells. T cell development in Il7r-/- and Jak3-/- mice is strongly impaired and both these mice suffers from severe T cell lymphopenia (Figure 5a,b) [32,33,34,35]. The distribution of CD4+CD25+ T cells in the thymus and in LNs was similar for both WT and Il7r-/- mice, but in case of Jak3-/- mice this population was significantly reduced (Figure 5c,d). Intriguingly, in the thymus and periphery of Il7r-/- mice, we observed the development of a significantly increased proportion of CD4+Foxp3+ nTreg cells compared to WT mice (Figure 5e). This result was consistent with the recently reported observation about an enhanced Foxp3+ Treg cell development in Il7-/- mice [36]. However, both in the thymus and in the periphery of Jak3-/- mice the development of Foxp3+ nTreg cells was strongly reduced compared to WT control (Figure 5e). Again, the severe reduction in nTreg cells was not due to a general block in the development of Foxp3+ nTreg cells but due to the disappearance of CD4+CD25+Foxp3+ Treg population, while the development of CD4+CD25-Foxp3+ Treg cells was normal in Jak3-/- mice thymus compared to WT mice (Figure 5f,g). We have reported recently that IL-7-JAK3-mediated NFATc1 activation is critical for thymocyte differentiation and survival at the pTCR-negative stages, and in IL-7R-deficient pTCR-negative cells NFATc1 activation is strongly impaired [16]. Thus, the presence of Foxp3+ Treg cells in Il7r-/- mice, further suggests that NFAT activity is dispensable for their development.
It has been well established that with age there is a decrease in lymphocyte population both in the thymus and in the periphery leading to a lymphopenic situation similar to that in the IL-7 signaling deficient mice. In the old mice, there was a significant increase in the CD4+CD25+ population in the spleen compared to 6-week-old mice (Supplementary Figure S5a,b). Interestingly, we also observed a significant increase in CD4+Foxp3+ nTreg cells in the periphery of WT mice over one year of age, compared to 6-week-old mice (Supplementary Figure S5c,d). This increase in Foxp3+ nTreg population was comparable to that in Il7r-/- mice (Figure 5) and Il7-/- mice, as reported by others [36]. Treg cells have low IL-7Ra expression compared to non-Treg cells [37]. Thus, an inverse correlation seems to exist between the extent of IL-7 signals and the development of Foxp3+ nTreg cells, as IL-7 signaling deficiency in vivo in case of Il7-/-, Il7r-/- mice, and in case of aged WT mice, there is a strong increase in Foxp3+ nTreg cells. Treg cells independence on IL-7 was evident as in thymic lobe cultures from newborn Il2-/- mice, treatment of exogenous IL-7 did not rescue the CD4+CD25+Foxp3+ population from death (Supplementary Figure S5e).
3.6. Lack of NFAT Activity Compromises the Survival of nTreg cells
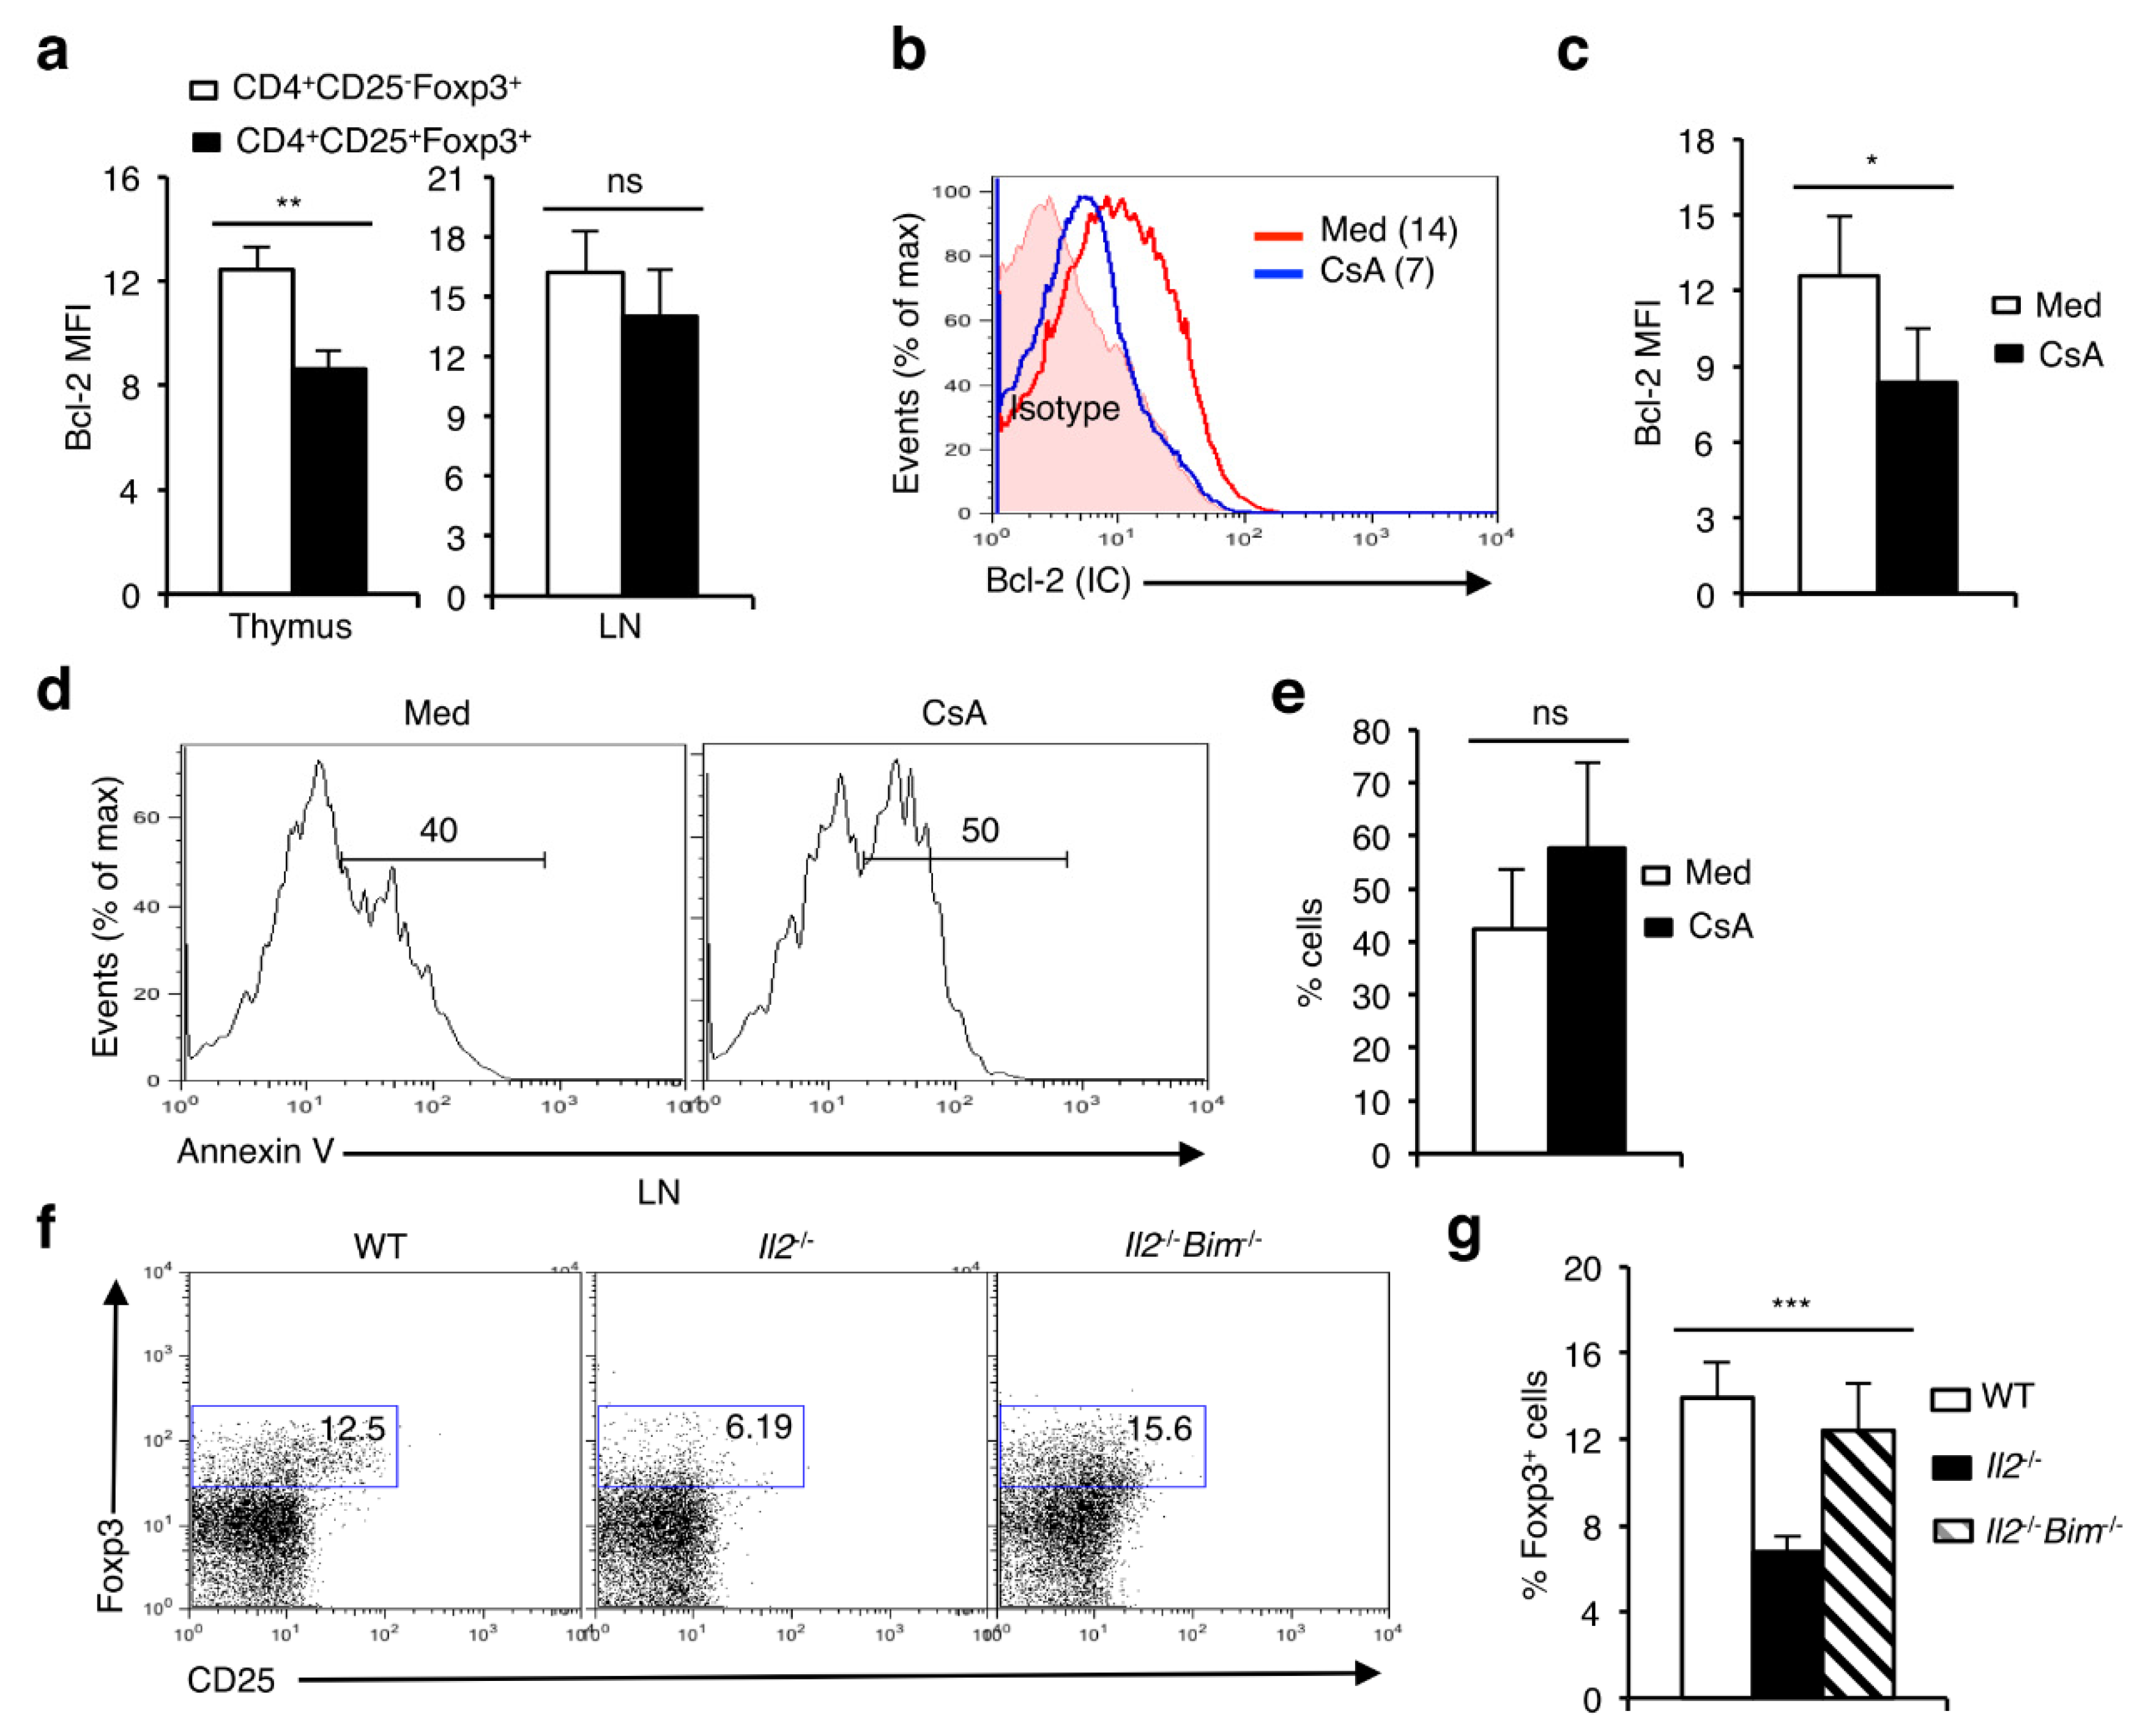
NFAT activity has been reported to control both IL-2 and the IL-2Rα (CD25) expression [27,38,39]. Additionally, IL-2 via signaling through its high affinity receptor upregulates Bcl-2 expression and regulates cell survival and function [40,41,42]. To explore whether a lack of NFAT activity affects survival and thereby leads to the development of fewer nTreg cells, we analyzed Bcl-2 levels in these cells. Bcl-2 levels were significantly higher in thymic CD4+CD25−Foxp3+ cells compared to the CD4+CD25+Foxp3+ cells whereas, in the periphery the Bcl-2 levels in both these populations were similar (Figure 6a). Interestingly, blocking NFAT activity by CsA led to a significant decrease in Bcl-2 levels in nTreg cells (Figure 6b,c). This could potentially lead to their death and hence the disappearance of nTreg cells we have observed in the NTOCs (Figure 3 and Figure 4). Accordingly, we have observed enhanced cell death in CsA-treated thymic lobes compared to untreated lobes (Figure 6d,e). We have reported previously that NFATc1 regulates the expression of Bcl-2 in thymocytes and erythrocytes and influences their survival and differentiation [16,43]. Additionally, CsA treatment or shRNA-mediated suppression of NFAT activity resulted in a strong downregulation of Bcl-2 in the thymocytes [16]. Thus, reduced Bcl-2 levels could alter the balance between anti- and pro-apoptotic Bcl-2 family members such as Bim, and thereby influence Treg survival and development. Bim has been reported to be involved in Treg cell death [44,45]. Accordingly, abolition of Bim activity prevented nTreg cell death and restored their development in the IL-2 ko mice (Figure 6f,g). This suggests NFAT is a critical component in regulating multiple parameters related to cell survival, and hence in the maintenance of nTreg cells.
4. Discussion
Our observations show that NFAT proteins play an important role in the maintenance and proliferation of CD4+CD25+Foxp3+ Treg cells by controlling CD25 expression and therefore IL-2 signaling, but not in the development of nTreg cells. The continuous up-regulated expression of CD25 on a majority of Foxp3+ Treg cells appears to be due to the sustained interaction between Foxp3 and NFAT factors as Foxp3 is always nuclear and has been shown to occupy the regulatory regions of Cd25 in primary Treg cells [46]. Whereas the activation-induced upregulation of CD25 on conventional CD4+ T cells is transient, the constitutive expression of CD25 on Treg cells is quite stable. However, both in activated CD4+ T cells as well as in Treg cells, CD25 expression is sensitive to CsA, implicating an involvement of NFAT proteins. The disruption of interaction between Foxp3 and NFAT in CD4+CD25+Foxp3+ Treg cells by CsA treatment leads to the same effect as losing any essential component of the IL-2 signaling cascade. In all these situations, the lack of survival signals will drive the majority of Foxp3+ Treg cells into apoptosis leading to a significant reduction in the number of Treg (CD4+CD25−Foxp3+) cells and to a reduced potential to suppress autoimmune diseases.
In our experiments, blockade of NFAT activity by CsA leading to the downregulation of CD25 (IL-2Rα) most likely resulted in the disruption of survival signals provided by IL-2. A similar effect on CD4+CD25+Foxp3+ cells was also observed when LN cells were treated with CsA (data not shown). Due to the strong decrease in Foxp3+ Treg population, the net suppressive capacity of the remaining Foxp3+ Treg cells might not be sufficient to protect the organism against development of autoimmunity. Our observation could explain the development of T cell-mediated autoimmunity that has been reported to develop in mice treated with repeated doses of CsA [47,48].
The presence of normal numbers of nTreg cells in the Nfatc2-/-Nfatc3-/- mice suggests that most likely the events regulating their maintenance are compensated by NFATc1, which is still present. The lymphocyte hyperproliferation reported in the Nfatc2-/-Nfatc3-/- mice could be due to the functional anomalies in the Teff cells rather than that in the nTreg cells. Due to the constraint of embryonic lethality, NFATc1-deficient mice could not be analyzed for nTreg cell development. However, the observations from CsA-treated NTOCs clearly suggests that nTreg cell maintenance is critically dependent on NFAT activity. The reduced nTreg cell numbers in the Il2-/- mice and in all mice lacking any component of the IL-2 signaling pathway indicates that there is a strong dysregulation of cell survival in the absence of IL-2 signals. Here, again the underlying molecular events are regulated by NFAT activity. NFAT has been reported to bind the regulatory elements of Il2 and Il2ra (Cd25) and control their expression in T cells [27,38,39]. Downstream of IL-2 signaling, Bcl-2 is an effector molecule that helps T cells survive and discharge their function. NFAT itself has also been shown to regulate Bcl-2 and Bcl-XL in various cell types to influence their survival [23,49,50]. Thus, it is likely that the NFAT-IL-2-IL-2R-Bcl-2 axis is critically essential for Treg cell survival and function, and to keep autoimmunity under control.
The generation of nTreg cells, and their maintenance to keep undue autoimmune reactions under control seem to be differentially regulated by NFAT. Whereas Foxp3 expression levels in nTreg cells were not affected by an increase or decrease in NFAT activity (Figure 1f, Figure 2e, Figure 3e and Figure 4i), the maintenance of the Foxp3+ nTreg population was compromised when NFAT activity was abolished (Figure 3 and Figure 4). The presence of Foxp3+ nTreg cells in CsA-treated NTOCs, although in a severely reduced number suggests that the generation of nTreg cells is not dependent on NFAT, rather, the reduced nTreg population is due to failure in maintaining the NFAT-IL-2-IL-2R-Bcl-2 signaling axis and the resultant enhanced cell death. This was evident as abolition of Bim activity, prevented the nTreg cell death and restored the full complement of Treg population in the Il2-/-Bim-/- mice (Figure 6f,g). One interesting observation of our study was the unaffected population of CD4+CD25-Foxp3+ cells to NFAT inhibition or IL-2 deficiency (Figure 3). The underlying mechanism for their better survival is unknown. However, we have observed that the thymic CD4+CD25−Foxp3+ cells do express significantly higher levels of Bcl-2 than the CD4+CD25+Foxp3+ cells (Figure 6a).
Several studies have implicated IL-2 signaling to be critical in Treg cell physiology. However, again the generation of Foxp3+ cells and in particular the CD4+CD25-Foxp3+ cells was not affected in Il2-/- or other IL-2 signaling defective (Jak3-/-) mice. This suggests that the generation of Foxp3+ cells in the thymus as such is not affected in absence of IL-2 signaling. Rather, their maintenance is severely affected, which is more prominent in the periphery than in the thymus. The presence of a distinct Foxp3+ population in the CD4-CD8- double negative (DN) and CD4+CD8+ double positive (DP) (Figure 2f and Supplementary Figure S2c,d) thymocytes suggests that the Foxp3+ cells are generated much earlier than the differentiating CD4+ cells from the DP thymocytes. Similar to the CD4+CD25−Foxp3+ cells, these Foxp3+ cells in the DN and DP thymocytes express low levels of CD25. Whether these Foxp3+ cells in the DN and DP thymocytes are the precursors for the nTreg cells is an interesting proposition to investigate.
The contrasting observations on the development of CD4+CD25+Foxp3+ Treg cells in the Il7r-/- and Jak3-/-, two severely lymphopenic mice exhibiting a similar defect in thymic development, could be explained by their specific defects in signaling. Whereas in Il7r-/- mice, IL-2 signaling was still intact, in Jak3-/- mice both IL-7 signals, as well as IL-2/CD25 signals critical for the maintenance of Foxp3+ Treg cells were disrupted leading to the reduction in the Foxp3+ Treg population. A similar negative effect on Foxp3+ Treg population has been reported for mice defective in STAT5 activity, a transcription factor activated by JAK3 [51]. Thus, signaling via the CD25/IL-2α and common γ-chain receptor is essential for the maintenance but not for the development of Foxp3+ Treg cells.
We have shown recently that IL-7 signaling-induced NFAT activation is an indispensable feature of T cell development in the thymus [16]. In the absence of NFAT activity, T cell development is severely affected in IL-7 signaling deficient mice. However, the generation of nTreg cells in these mice, that is also at an enhanced level, further suggests that the generation of nTreg cells is independent of NFAT activity. This is also reflected in our analysis of aged animals (Supplementary Figure S5), where IL-7 signaling should be sub-optimal. Altogether, our study reveals an important aspect of NFAT activity in the generation and maintenance of nTreg cells, which could potentially influence multiple clinical conditions such as transplantation, autoimmunity and cancer.
Supplementary Materials
The following are available online at https://www.mdpi.com/article/10.3390/cells11091397/s1, Figure S1: Enhanced NFAT activity on T cell and nTreg cell development; Figure S2: T cell development in the thymus and LNs of Nfatc2-/-Nfatc3-/- mice; Figure S3: Effects of CsA treament on T cell development in NTOCs; Figure S4: Effects of PMA and IO on thymocytes in absence or presence of CsA in NTOCs; Figure S5: Increase in Foxp3+ Treg population with age.
Author Contributions
C.B.d.B. isolated cells and performed experiments. A.K.P. designed the project, performed experiments, supervised the study and wrote the manuscript. All authors have read and agreed to the published version of the manuscript.
Funding
This work was supported by an ‘EMBO Short Term Fellowship’ (ATF No: 93-06), a ‘PostDoc Plus Funding’ grant (Graduate School of Life Sciences; GSLS, University of Wuerzburg) and a fellowship from the Vandervell Foundation, UK to A.K.P.
Acknowledgments
We thank T. Schueler, Institute of Immunology, Charité, Berlin for the Il7r-/- mice, V. Ellenrieder (University of Goettingen) for the Nfatc1αAfl/fl mice, D. J. Murphy (University of Glasgow, U.K.) for Bim-/-, and T. Sparwasser (Institute of Infection Immunology, TWINCORE, Center for Experimental and Clinical Infection Research, Hannover) for the DEREG mice, and C. Linden (University of Wuerzburg) for excellent FACS sorting. We thank E. Serfling, Institute of Pathology, University of Wuerzburg, for his guidance and in facilitating this study (Animal Experimentation Licence: approved by the Regierung von Unterfranken, Wuerzburg, Permit Number 55.2-2531.01-53/10B to E.S.).
Conflicts of Interest
The authors declare that they have no financial or commercial conflict of interest.
References
- Chen, W.; Jin, W.; Hardegen, N.; Lei, K.J.; Li, L.; Marinos, N.; McGrady, G.; Wahl, S.M. Conversion of peripheral CD4+CD25− naive T cells to CD4+CD25+ regulatory T cells by TGF-beta induction of transcription factor Foxp3. J. Exp. Med. 2003, 198, 1875–1886. [Google Scholar] [CrossRef]
- Fantini, M.C.; Becker, C.; Monteleone, G.; Pallone, F.; Galle, P.R.; Neurath, M.F. Cutting edge: TGF-beta induces a regulatory phenotype in CD4+CD25− T cells through Foxp3 induction and down-regulation of Smad7. J. Immunol. 2004, 172, 5149–5153. [Google Scholar] [CrossRef] [Green Version]
- Kretschmer, K.; Apostolou, I.; Hawiger, D.; Khazaie, K.; Nussenzweig, M.C.; Von Boehmer, H. Inducing and expanding regulatory T cell populations by foreign antigen. Nat. Immunol. 2005, 6, 1219–1227. [Google Scholar] [CrossRef]
- Coombes, J.L.; Siddiqui, K.R.; Arancibia-Carcamo, C.V.; Hall, J.; Sun, C.M.; Belkaid, Y.; Powrie, F. A functionally specialized population of mucosal CD103+ DCs induces Foxp3+ regulatory T cells via a TGF-beta and retinoic acid-dependent mechanism. J. Exp. Med. 2007, 204, 1757–1764. [Google Scholar] [CrossRef]
- Sun, C.-M.; Hall, J.A.; Blank, R.B.; Bouladoux, N.; Oukka, M.; Mora, J.R.; Belkaid, Y. Small intestine lamina propria dendritic cells promote de novo generation of Foxp3 T reg cells via retinoic acid. J. Exp. Med. 2007, 204, 1775–1785. [Google Scholar] [CrossRef] [Green Version]
- Itoh, M.; Takahashi, T.; Sakaguchi, N.; Kuniyasu, Y.; Shimizu, J.; Otsuka, F.; Sakaguchi, S. Thymus and autoimmunity: Production of CD25+CD4+ naturally anergic and suppressive T cells as a key function of the thymus in maintaining immunologic self-tolerance. J. Immunol. 1999, 162, 5317–5326. [Google Scholar]
- Shimizu, J.; Yamazaki, S.; Takahashi, T.; Ishida, Y.; Sakaguchi, S. Stimulation of CD25+CD4+ regulatory T cells through GITR breaks immunological self-tolerance. Nat. Immunol. 2002, 3, 135–142. [Google Scholar] [CrossRef]
- Hori, S.; Haury, M.; Coutinho, A.; Demengeot, J. Specificity requirements for selection and effector functions of CD25+ 4+ regulatory T cells in anti-myelin basic protein T cell receptor transgenic mice. Proc. Natl. Acad. Sci. USA 2002, 99, 8213–8218. [Google Scholar] [CrossRef] [Green Version]
- Bonomo, A.; Kehn, P.J.; Payer, E.; Rizzo, L.; Cheever, A.W.; Shevach, E.M. Pathogenesis of post-thymectomy autoimmunity. Role of syngeneic MLR-reactive T cells. J. Immunol. 1995, 154, 6602–6611. [Google Scholar]
- Asano, M.; Toda, M.; Sakaguchi, N.; Sakaguchi, S. Autoimmune disease as a consequence of developmental abnormality of a T cell subpopulation. J. Exp. Med. 1996, 184, 387–396. [Google Scholar] [CrossRef]
- Marie, J.C.; Letterio, J.J.; Gavin, M.; Rudensky, A.Y. TGF-beta1 maintains suppressor function and Foxp3 expression in CD4+CD25+ regulatory T cells. J. Exp. Med. 2005, 201, 1061–1067. [Google Scholar] [CrossRef] [PubMed]
- Marie, J.C.; Liggitt, D.; Rudensky, A.Y. Cellular mechanisms of fatal early-onset autoimmunity in mice with the T cell-specific targeting of transforming growth factor-beta receptor. Immunity 2006, 25, 441–454. [Google Scholar] [CrossRef] [PubMed] [Green Version]
- Li, M.O.; Sanjabi, S.; Flavell, R.A. Transforming Growth Factor-β Controls Development, Homeostasis, and Tolerance of T Cells by Regulatory T Cell-Dependent and -Independent Mechanisms. Immunity 2006, 25, 455–471. [Google Scholar] [CrossRef] [PubMed] [Green Version]
- Macian, F. NFAT proteins: Key regulators of T-cell development and function. Nat. Rev. Immunol. 2005, 5, 472–484. [Google Scholar] [CrossRef] [PubMed]
- Serfling, E.; Klein-Hessling, S.; Palmetshofer, A.; Bopp, T.; Stassen, M.; Schmitt, E. NFAT transcription factors in control of peripheral T cell tolerance. Eur. J. Immunol. 2006, 36, 2837–2843. [Google Scholar] [CrossRef]
- Patra, A.; Avots, A.; Zahedi, R.; Schüler, T.; Sickmann, A.; Bommhardt, U.; Serfling, E. An alternative NFAT-activation pathway mediated by IL-7 is critical for early thymocyte development. Nat. Immunol. 2013, 14, 127–135. [Google Scholar] [CrossRef]
- Klein-Hessling, S.; Rudolf, R.; Muhammad, K.; Knobeloch, K.-P.; Maqbool, M.A.; Cauchy, P.; Andrau, J.-C.; Avots, A.; Talora, C.; Ellenrieder, V.; et al. A threshold level of NFATc1 activity facilitates thymocyte differentiation and opposes notch-driven leukaemia development. Nat. Commun. 2016, 7, 11841. [Google Scholar] [CrossRef]
- Wu, Y.; Borde, M.; Heissmeyer, V.; Feuerer, M.; Lapan, A.D.; Stroud, J.; Bates, D.L.; Guo, L.; Han, A.; Ziegler, S.F.; et al. FOXP3 Controls Regulatory T Cell Function through Cooperation with NFAT. Cell 2006, 126, 375–387. [Google Scholar] [CrossRef] [Green Version]
- Vaeth, M.; Schliesser, U.; Müller, G.; Reissig, S.; Satoh, K.; Tuettenberg, A.; Jonuleit, H.; Waisman, A.; Müller, M.R.; Serfling, E.; et al. Dependence on nuclear factor of activated T-cells (NFAT) levels discriminates conventional T cells from Foxp3+ regulatory T cells. Proc. Natl. Acad. Sci. USA 2012, 109, 16258–16263. [Google Scholar] [CrossRef] [Green Version]
- Bopp, T.; Palmetshofer, A.; Serfling, E.; Heib, V.; Schmitt, S.; Richter, C.; Klein, M.; Schild, H.; Schmitt, E.; Stassen, M. NFATc2 and NFATc3 transcription factors play a crucial role in suppression of CD4+ T lymphocytes by CD4+ CD25+ regulatory T cells. J. Exp. Med. 2005, 201, 181–187. [Google Scholar] [CrossRef] [Green Version]
- de la Pompa, J.L.; Timmerman, L.A.; Takimoto, H.; Yoshida, H.; Elia, A.J.; Samper, E.; Potter, J.; Wakeham, A.; Marengere, L.; Langille, B.L.; et al. Role of the NF-ATc transcription factor in morphogenesis of cardiac valves and septum. Nature 1998, 392, 182–186. [Google Scholar] [CrossRef] [PubMed]
- Chopra, M.; Langenhorst, D.; Beilhack, A.; Serfling, E.; Patra, A.K. Interleukin-2 critically regulates bone marrow erythropoiesis and prevents anemia development. Eur. J. Immunol. 2015, 45, 3362–3374. [Google Scholar] [CrossRef] [PubMed] [Green Version]
- Patra, A.K.; Drewes, T.; Engelmann, S.; Chuvpilo, S.; Kishi, H.; Hünig, T.; Serfling, E.; Bommhardt, U.H. PKB Rescues Calcineurin/NFAT-Induced Arrest of Rag Expression and Pre-T Cell Differentiation. J. Immunol. 2006, 177, 4567–4576. [Google Scholar] [CrossRef] [PubMed] [Green Version]
- Ranger, A.M.; Oukka, M.; Rengarajan, J.; Glimcher, L.H. Inhibitory Function of Two NFAT Family Members in Lymphoid Homeostasis and Th2 Development. Immunity 1998, 9, 627–635. [Google Scholar] [CrossRef] [Green Version]
- Lahl, K.; Sparwasser, T. In Vivo Depletion of FoxP3+ Tregs Using the DEREG Mouse Model. Methods Mol. Biol. 2011, 707, 157–172. [Google Scholar] [CrossRef]
- Fontenot, J.D.; Rasmussen, J.; Williams, L.M.; Dooley, J.; Farr, A.G.; Rudensky, A.Y. Regulatory T Cell Lineage Specification by the Forkhead Transcription Factor Foxp3. Immunity 2005, 22, 329–341. [Google Scholar] [CrossRef]
- Schuh, K.; Twardzik, T.; Kneitz, B.; Heyer, J.; Schimpl, A.; Serfling, E. The Interleukin 2 Receptor α Chain/CD25 Promoter Is a Target for Nuclear Factor of Activated T Cells. J. Exp. Med. 1998, 188, 1369–1373. [Google Scholar] [CrossRef] [Green Version]
- Fontenot, J.D.; Rasmussen, J.P.; Gavin, M.A.; Rudensky, A.Y. A function for interleukin 2 in Foxp3-expressing regulatory T cells. Nat. Immunol. 2005, 6, 1142–1151. [Google Scholar] [CrossRef]
- D’Cruz, L.M.; Klein, L. Development and function of agonist-induced CD25+Foxp3+ regulatory T cells in the absence of interleukin 2 signaling. Nat. Immunol. 2005, 6, 1152–1159. [Google Scholar] [CrossRef]
- Cante-Barrett, K.; Gallo, E.M.; Winslow, M.M.; Crabtree, G.R. Thymocyte negative selection is mediated by protein kinase C- and Ca2+-dependent transcriptional induction of bim [corrected]. J. Immunol. 2006, 176, 2299–2306. [Google Scholar] [CrossRef] [Green Version]
- Fry, T.J.; Mackall, C.L. The Many Faces of IL-7: From Lymphopoiesis to Peripheral T Cell Maintenance. J. Immunol. 2005, 174, 6571–6576. [Google Scholar] [CrossRef] [PubMed]
- Peschon, J.J.; Morrissey, P.J.; Grabstein, K.H.; Ramsdell, F.J.; Maraskovsky, E.; Gliniak, B.C.; Park, L.S.; Ziegler, S.F.; E Williams, D.; Ware, C.B.; et al. Early lymphocyte expansion is severely impaired in interleukin 7 receptor-deficient mice. J. Exp. Med. 1994, 180, 1955–1960. [Google Scholar] [CrossRef] [PubMed] [Green Version]
- Nosaka, T.; van Deursen, J.M.A.; Tripp, R.A.; Thierfelder, W.E.; Witthuhn, B.A.; McMickle, A.P.; Doherty, P.C.; Grosveld, G.C.; Ihle, J.N. Defective Lymphoid Development in Mice Lacking Jak3. Science 1995, 270, 800–802. [Google Scholar] [CrossRef] [PubMed]
- Park, S.Y.; Saijo, K.; Takahashi, T.; Osawa, M.; Arase, H.; Hirayama, N.; Miyake, K.; Nakauchi, H.; Shirasawa, T.; Saito, T. Developmental defects of lymphoid cells in Jak3 kinase-deficient mice. Immunity 1995, 3, 771–782. [Google Scholar] [CrossRef] [Green Version]
- Thomis, D.C.; Gurniak, C.B.; Tivol, E.; Sharpe, A.H.; Berg, L.J. Defects in B Lymphocyte Maturation and T Lymphocyte Activation in Mice Lacking Jak3. Science 1995, 270, 794–797. [Google Scholar] [CrossRef]
- Peffault de Latour, R.; Dujardin, H.C.; Mishellany, F.; Burlen-Defranoux, O.; Zuber, J.; Marques, R.; Di Santo, J.; Cumano, A.; Vieira, P.; Bandeira, A. Ontogeny, function, and peripheral homeostasis of regulatory T cells in the absence of interleukin-7. Blood 2006, 108, 2300–2306. [Google Scholar] [CrossRef]
- Liu, W.; Putnam, A.L.; Xu-Yu, Z.; Szot, G.L.; Lee, M.R.; Zhu, S.; Gottlieb, P.A.; Kapranov, P.; Gingeras, T.R.; de St Groth, B.F.; et al. CD127 expression inversely correlates with FoxP3 and suppressive function of human CD4+ T reg cells. J. Exp. Med. 2006, 203, 1701–1711. [Google Scholar] [CrossRef] [Green Version]
- Rao, A.; Luo, C.; Hogan, P.G. Transcription Factors of the NFAT Family: Regulation and Function. Annu. Rev. Immunol. 1997, 15, 707–747. [Google Scholar] [CrossRef]
- Jain, J.; Loh, C.; Rao, A. Transcriptional regulation of the IL-2 gene. Curr. Opin. Immunol. 1995, 7, 333–342. [Google Scholar] [CrossRef]
- Lord, J.D.; McIntosh, B.C.; Greenberg, P.D.; Nelson, B. The IL-2 receptor promotes proliferation, bcl-2 and bcl-x induction, but not cell viability through the adapter molecule Shc. J. Immunol. 1998, 161, 4627–4633. [Google Scholar]
- Miyazaki, T.; Liu, Z.-J.; Kawahara, A.; Minami, Y.; Yamada, K.; Tsujimoto, Y.; Barsoumian, E.L.; Perlmutter, R.M.; Taniguchi, T. Three distinct IL-2 signaling pathways mediated by bcl-2, c-myc, and lck cooperate in hematopoietic cell proliferation. Cell 1995, 81, 223–231. [Google Scholar] [CrossRef] [Green Version]
- Adachi, M.; Torigoe, T.; Takayama, S.; Imai, K. BAG-1 and Bcl-2 in IL-2 Signaling. Leuk. Lymphoma 1998, 30, 483–491. [Google Scholar] [CrossRef] [PubMed]
- Giampaolo, S.; Wojcik, G.; Klein-Hessling, S.; Serfling, E.; Patra, A.K. NFAT-mediated defects in erythropoiesis cause anemia in Il2(−/−) mice. Oncotarget 2018, 9, 9632–9644. [Google Scholar] [CrossRef] [PubMed] [Green Version]
- Chougnet, C.A.; Tripathi, P.; Lages, C.S.; Raynor, J.; Sholl, A.; Fink, P.; Plas, D.R.; Hildeman, D. A Major Role for Bim in Regulatory T Cell Homeostasis. J. Immunol. 2011, 186, 156–163. [Google Scholar] [CrossRef] [PubMed] [Green Version]
- Tai, X.; Erman, B.; Alag, A.; Mu, J.; Kimura, M.; Katz, G.; Guinter, T.; McCaughtry, T.; Etzensperger, R.; Feigenbaum, L.; et al. Foxp3 Transcription Factor Is Proapoptotic and Lethal to Developing Regulatory T Cells unless Counterbalanced by Cytokine Survival Signals. Immunity 2013, 38, 1116–1128. [Google Scholar] [CrossRef] [PubMed] [Green Version]
- Zheng, Y.; Josefowicz, S.; Kas, A.; Chu, T.-T.; Gavin, M.A.; Rudensky, A.Y. Genome-wide analysis of Foxp3 target genes in developing and mature regulatory T cells. Nature 2007, 445, 936–940. [Google Scholar] [CrossRef] [PubMed]
- Jenkins, M.K.; Schwartz, R.H.; Pardoll, D.M. Effects of cyclosporine A on T cell development and clonal deletion. Science 1988, 241, 1655–1658. [Google Scholar] [CrossRef] [PubMed]
- Gao, E.-K.; Lo, D.; Cheney, R.; Kanagawa, O.; Sprent, J. Abnormal differentiation of thymocytes in mice treated with cyclosporin A. Nature 1988, 336, 176–179. [Google Scholar] [CrossRef] [PubMed]
- Oukka, M.; Ho, I.-C.; de la Brousse, F.C.; Hoey, T.; Grusby, M.J.; Glimcher, L.H. The Transcription Factor NFAT4 Is Involved in the Generation and Survival of T Cells. Immunity 1998, 9, 295–304. [Google Scholar] [CrossRef] [Green Version]
- Kawamura, T.; Ono, K.; Morimoto, T.; Akao, M.; Iwai-Kanai, E.; Wada, H.; Sowa, N.; Kita, T.; Hasegawa, K. Endothelin-1–Dependent Nuclear Factor of Activated T Lymphocyte Signaling Associates with Transcriptional Coactivator p300 in the Activation of the B Cell Leukemia-2 Promoter in Cardiac Myocytes. Circ. Res. 2004, 94, 1492–1499. [Google Scholar] [CrossRef] [Green Version]
- Yao, Z.; Kanno, Y.; Kerenyi, M.; Stephens, G.; Durant, L.; Watford, W.T.; Laurence, A.; Robinson, G.W.; Shevach, E.M.; Moriggl, R.; et al. Nonredundant roles for Stat5a/b in directly regulating Foxp3. Blood 2007, 109, 4368–4375. [Google Scholar] [CrossRef] [PubMed] [Green Version]
Figure 1.
Constitutively active calcineurin/NFAT activity does not affect thymic development of Foxp3+ Treg cells. (a) Distribution of CD4+CD25+ cells in the thymus and LNs from WT and ∆Cam tg mice as revealed by flow cytometry. (b) Quantification of the frequency of CD4+CD25+ cells in the thymus and LNs from WT and ∆Cam tg mice (*** p < 0.0001 and * p = 0.0342; unpaired t-test). (c) Distribution of CD4+CD25+Foxp3+ cells in the thymus and LNs from WT and ∆Cam tg mice as revealed by flow cytometry. (d) Quantification of the frequency of CD4+CD25+Foxp3+ cells in the thymus and LNs from WT and ∆Cam tg mice (ns = not significant and * p = 0.0101; unpaired t-test). In (b,d), n = 5 each. Numbers inside each dot plot indicate percent respective populations. (e) Immunofluorescence staining showing nuclear levels of NFATc1 and Foxp3 in sorted WT CD4+CD25− and CD4+CD25+ populations from LNs. Data represent one of two independent experiments involving pooled LN cells from three mice per experiment. (f) Quantification of the mean relative fluorescence (MRF) for NFATc1 levels in CD4+CD25− (n = 35) and CD4+CD25+ (n = 33) LN cells from WT mice. (g) Immunofluorescence analysis of sorted DP thymocytes from WT and ∆Cam tg mice showing nuclear NFATc1 levels. DP cells in ∆Cam tg thymocytes are indicated by arrows. Data represent one of two independent experiments. (h) Immunofluorescence staining for NFATc1 in anti-CD3 plus anti-CD28 Abs stimulated CD4+CD25− and CD4+CD25+ T-cells from WT mice. (i) Quantification of MRF for NFATc1 levels in anti-CD3 plus anti-CD28 Abs stimulated CD4+CD25− (n = 24) and CD4+CD25+ (n = 40) T-cells from WT mice. In (e,g,h), nuclear staining was confirmed by DAPI. Scale bar, 10 μm. (j) Quantification of the mean fluorescence intensity (MFI) for Foxp3 in thymic and LN Foxp3+ cells from WT and ∆Cam tg mice. Data represent one of four independent experiments involving 5 WT and ∆Cam tg mice each. Data in (b,d,f,i,j) are presented as mean ± s.d.

Figure 2.
Development of Foxp3+ Treg cells is unaffected in Nfatc2-/-Nfatc3-/- mice. (a) Distribution of CD4+CD25+ T cells among CD4+ T cell population in the thymus and LN of Nfatc2-/-Nfatc3-/- mice compared to WT littermates. (b) Quantification of percent CD4+CD25+ T cells among CD4+ T cell population in the thymus and LN of Nfatc2-/-Nfatc3-/- mice compared to WT controls (n = 3 each, * p = 0.0120, ns = not significant; unpaired t-test). (c) Distribution of CD4+CD25+Foxp3+ Treg cells in the thymus and LN of Nfatc2-/-Nfatc3-/- and WT mice gated on CD4+ T-cells. (d) Quantification of the frequency of CD4+CD25+Foxp3+ Treg cells in the thymus and LNs from WT and Nfatc2-/-Nfatc3-/- mice (n = 5 WT and 3 Nfatc2-/-Nfatc3-/- mice; ns = not significant; unpaired t-test). (e) Quantification of MFI for Foxp3 in thymic and LN Foxp3+ cells from WT and Nfatc2-/-Nfatc3-/- mice (ns = not significant; unpaired t-test). (f) Distribution of Foxp3+ cells in DN and DP thymocyte populations from WT, ∆Cam and Nfatc2-/-Nfatc3-/- mice. Data are representative of two independent experiments, and in (b,d,e) are presented as mean ± s.d.
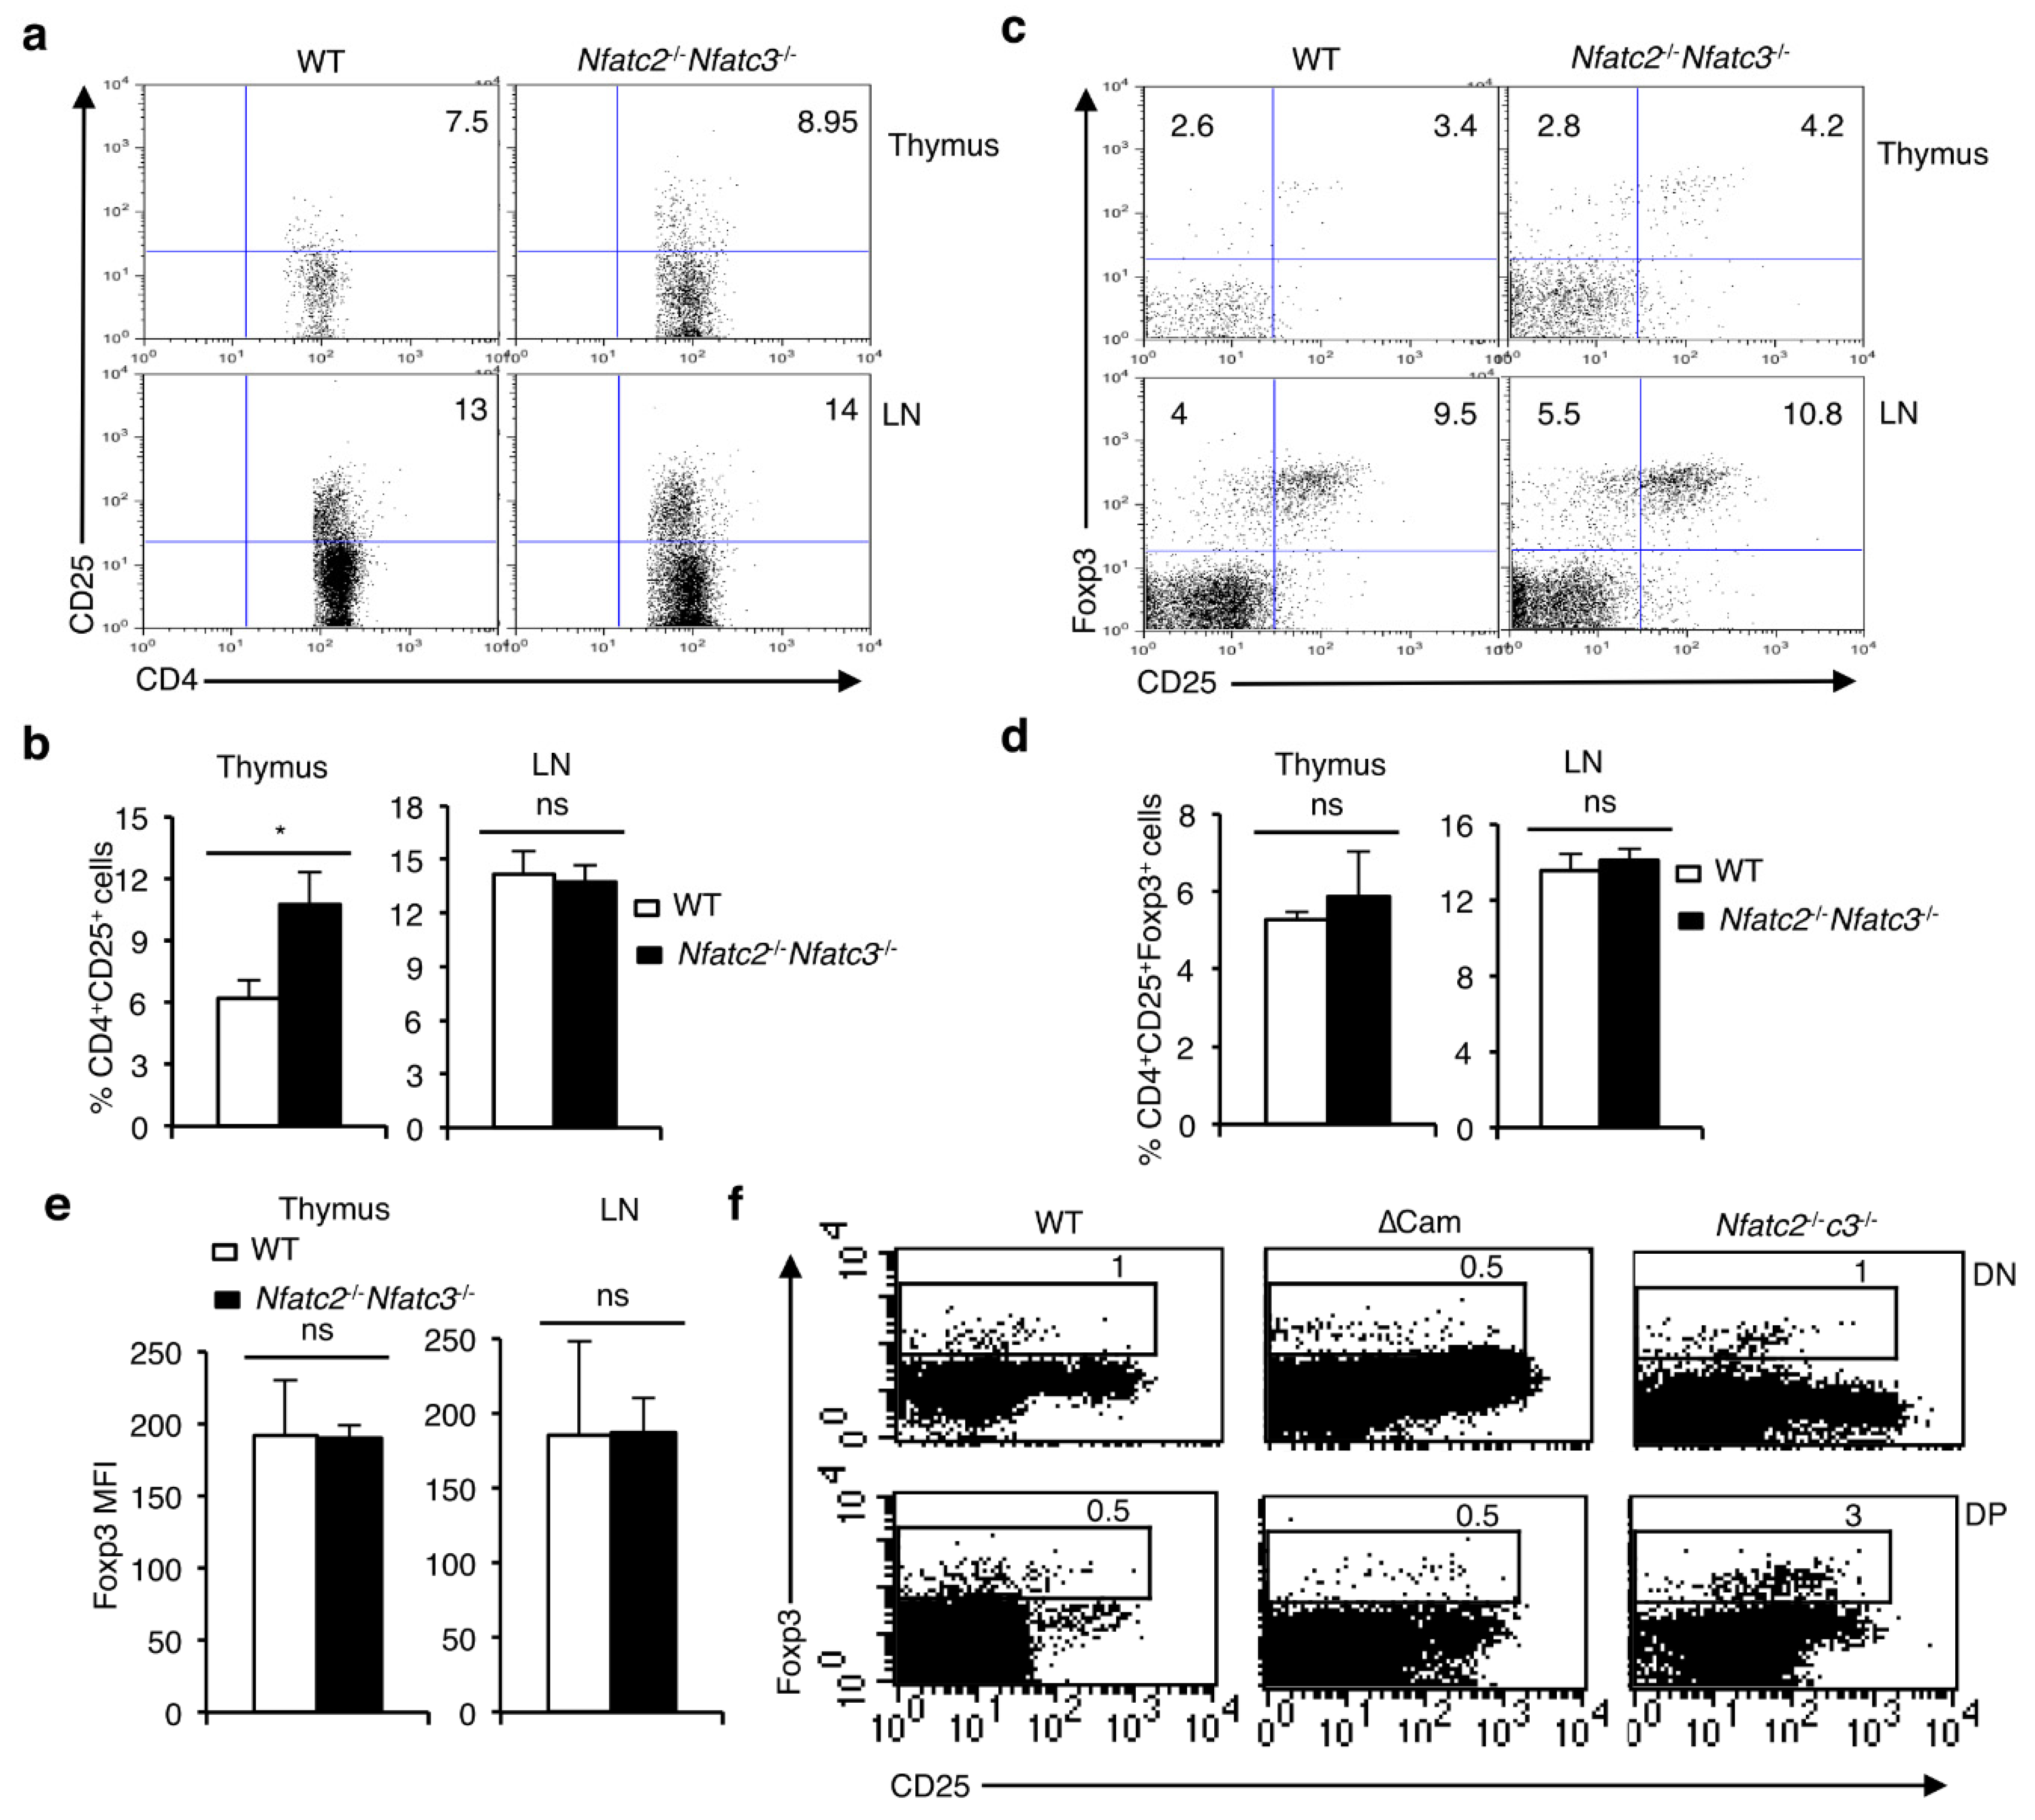
Figure 3.
NFAT factors are essential for the maintenance of CD4+CD25+Foxp3+ Treg cells. (a) Distribution of CD4+CD25+ T cells in day 3.5 medium or CsA-treated NTOCs from WT mice. (b) Quantification of percent distribution and absolute numbers (*** p = 0.0004) of CD4+CD25+ T cells in day 3.5 NTOCs from WT mice in presence or absence of CsA. (c) Flow cytometry showing the distribution of CD25+Foxp3+ cells gated on CD4+ T cells in day 3.5 NTOCs from WT mice in presence or absence of CsA. (d) Quantification of percent distribution of total Foxp3+ (** p = 0.0071), CD25+Foxp3+ (** p = 0.0015) and CD25-Foxp3+ (ns = not significant) cells gated on CD4+ T cells in day 3.5 NTOCs from WT mice in presence or absence of CsA. (e) Quantification of MFI for Foxp3 expression levels in Foxp3+ cells from day 3.5 NTOCs of WT mice in presence or absence of CsA (ns = not significant). (f) Distribution of CD25-Foxp3+ and CD25+Foxp3+ cells gated on CD4+ T cells in the thymus, and LNs of Il2-/- mice compared to WT mice. (g) Quantification of percent distribution of total Foxp3+ (* p = 0.0183; thymus and *** p < 0.0001; LN), CD25+Foxp3+ (*** p < 0.0001; both thymus and LN) and CD25-Foxp3+ (ns = not significant) cells gated on CD4+ T cells in the thymus, and LNs of Il2-/- mice compared to WT mice. (h) Quantification of MFI for Foxp3 expression levels in Foxp3+ cells from thymus, and LNs of Il2-/- mice compared to WT mice (ns = not significant). Numbers inside each dot plot represent percent respective populations. Data are representative of three independent experiments, and in (b,d,e,g,h) are presented as mean ± s.d., unpaired t-test.

Figure 4.
PMA signaling negatively regulates thymic development of Foxp3+ Treg cells. (a) Distribution of CD4+CD25+ cells gated on CD4+ T cells in day 3.5 NTOCs from WT mice treated with PMA + Ionomycin (IO) in the presence or absence of CsA. (b) Quantification of percent distribution of CD4+CD25+ cells gated on CD4+ T cells in day 3.5 NTOCs from WT mice treated with PMA + Ionomycin (IO) in the presence or absence of CsA (*** p < 0.0001; one-way ANOVA). (c) Distribution of CD25+Foxp3+ cells gated on CD4+ T cells in day 3.5 NTOCs from WT mice treated with PMA+Ionomycin (IO) in the presence or absence of CsA. (d) Quantification of percent distribution of CD25+Foxp3+ cells gated on CD4+ T cells in day 3.5 NTOCs from WT mice treated with PMA + Ionomycin (IO) in the presence or absence of CsA (*** p < 0.0001; one-way ANOVA). (e) Distribution of CD4+CD25+ cells gated on CD4+ T cells in day 3.5 NTOCs from WT mice treated either with PMA or Ionomycin (IO). (f) Quantification of percent distribution of CD4+CD25+ cells gated on CD4+ T cells in day 3.5 NTOCs from WT mice treated either with PMA or Ionomycin (IO) (*** p < 0.0001; unpaired t-test). (g) Distribution of CD25+Foxp3+ cells gated on CD4+ T cells in day 3.5 NTOCs from WT mice treated either with PMA or Ionomycin (IO). (h) Quantification of percent distribution of CD25+Foxp3+ cells gated on CD4+ T cells in day 3.5 NTOCs from WT mice treated either with PMA or Ionomycin (IO) (*** p < 0.0001; ns = not significant; unpaired t-test). (i) Quantification of MFI for Foxp3 expression levels in Foxp3+ cells from day 3.5 NTOCs of WT mice left untreated or treated either with PMA or Ionomycin (IO) (ns = not significant; one-way ANOVA). Data are representative of three independent experiments, and in (b,d,f,h,i) are presented as mean ± s.d.
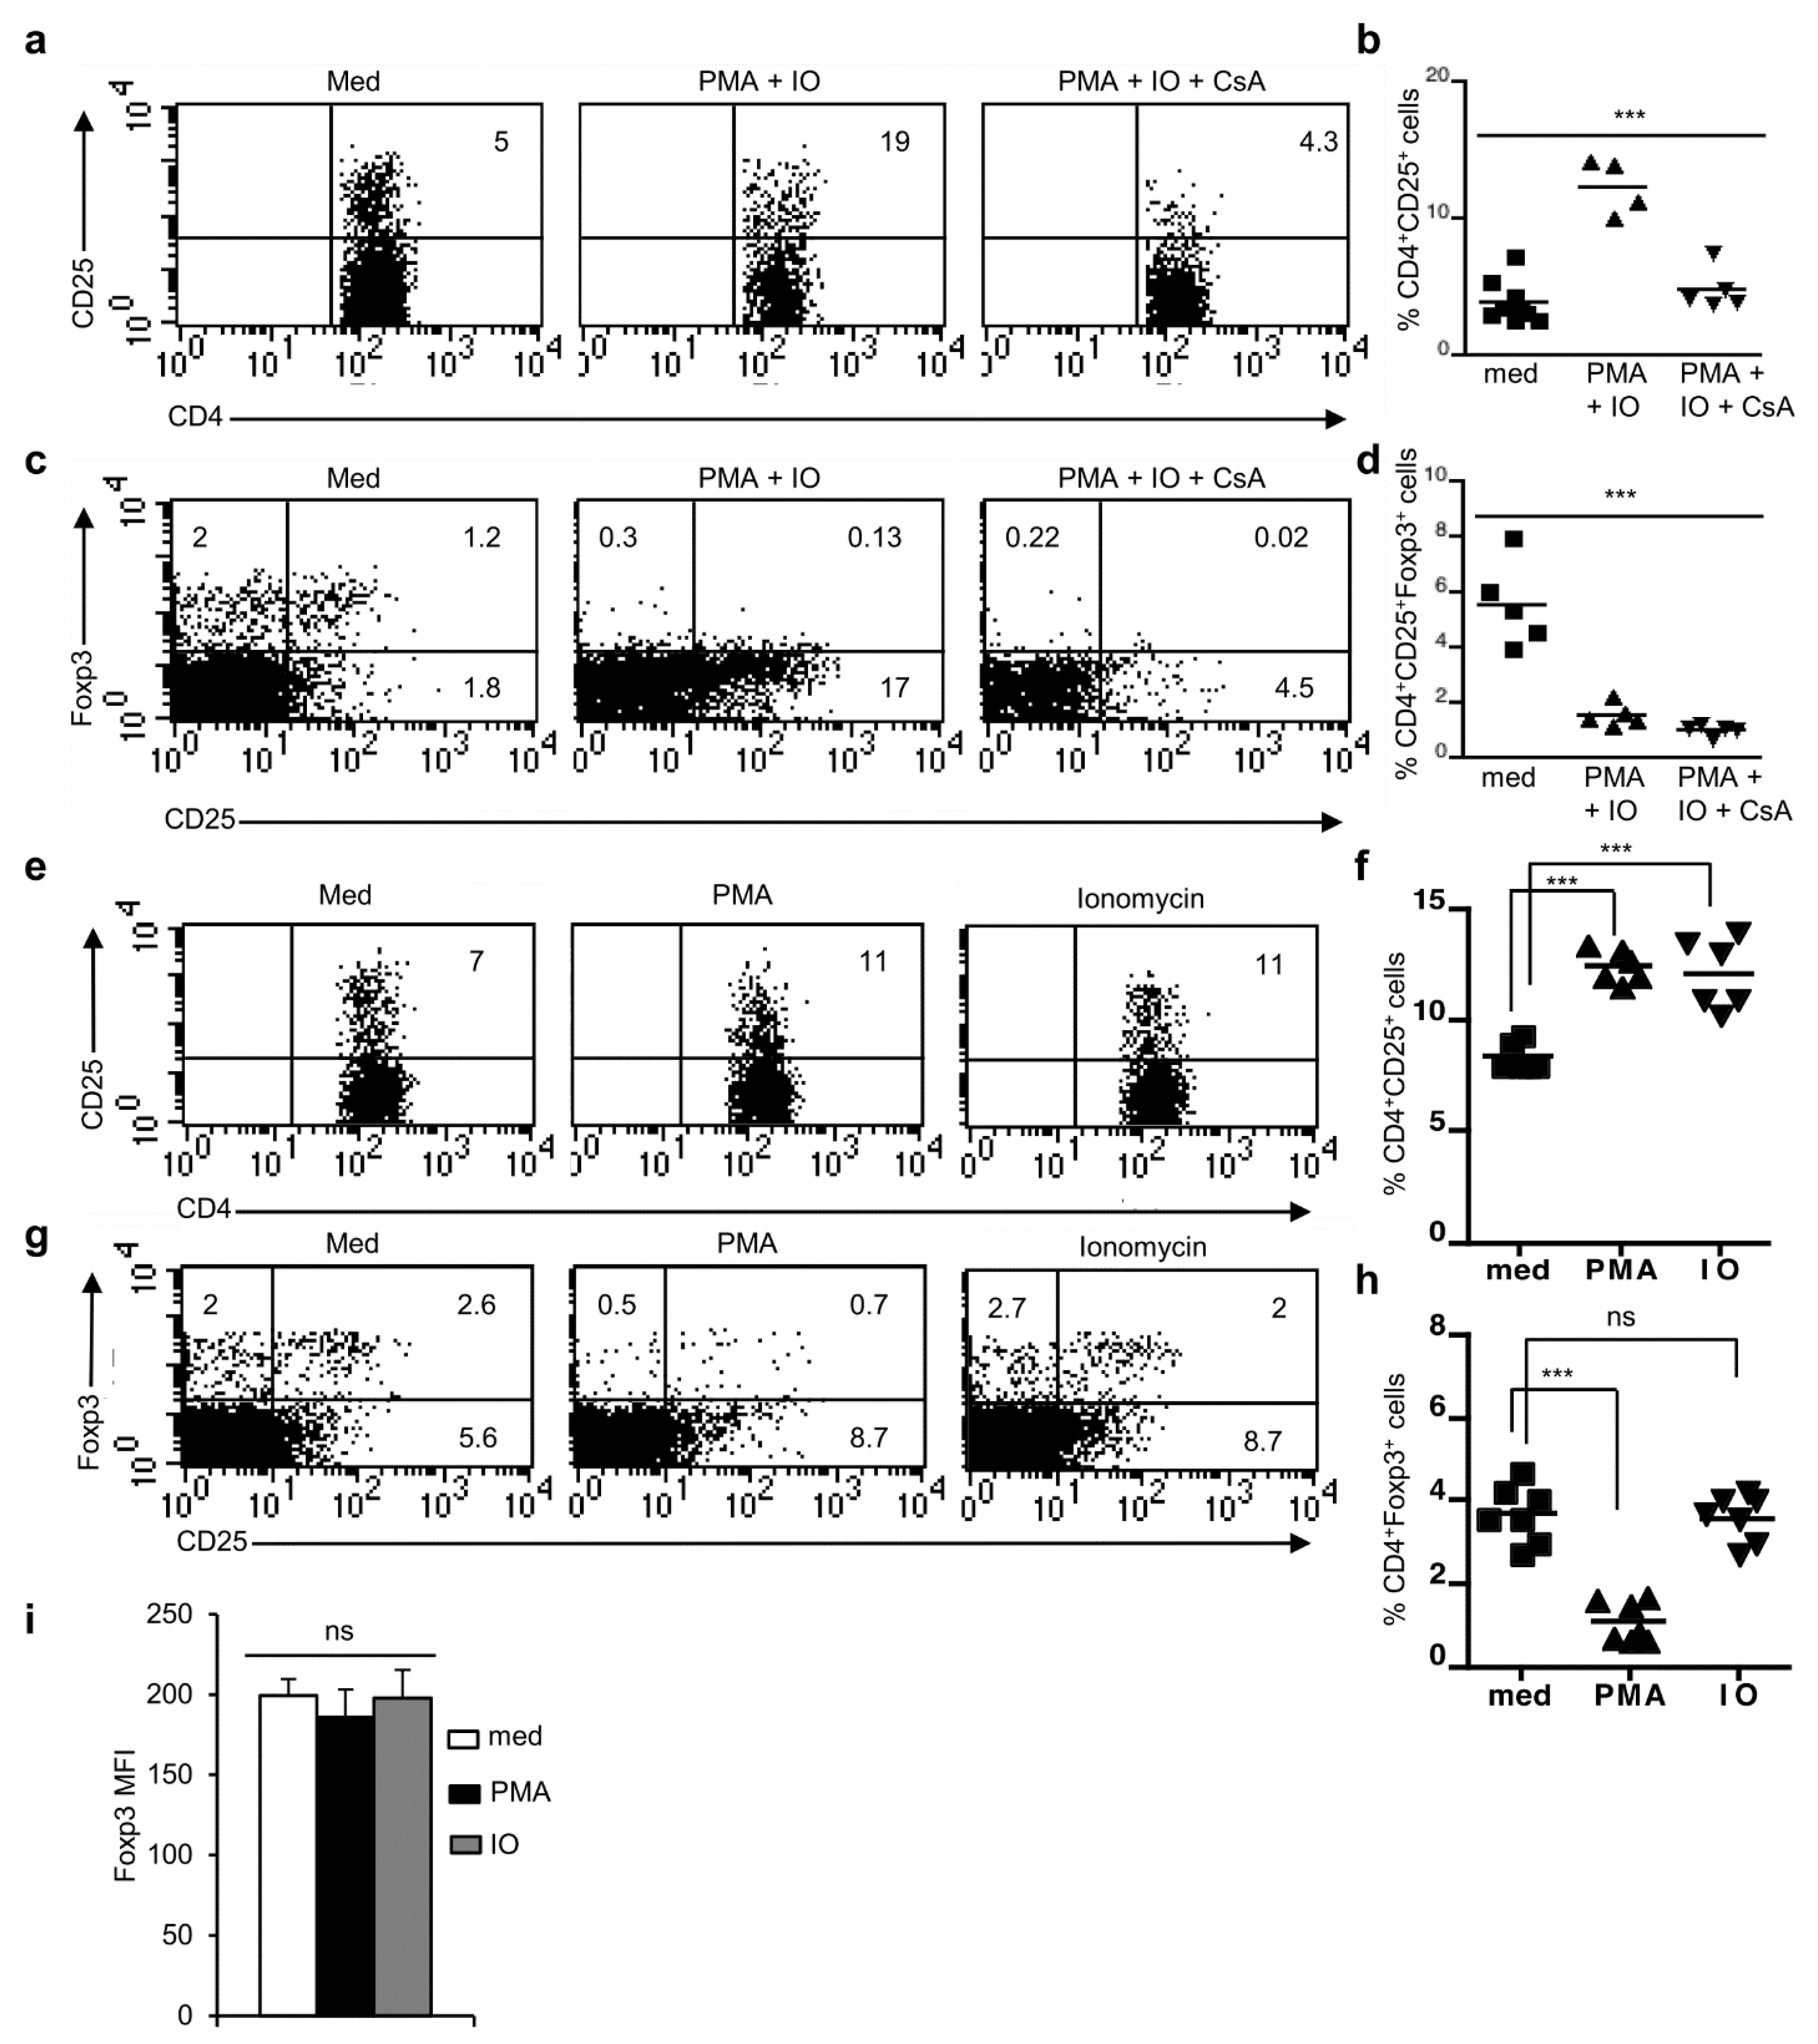
Figure 5.
NFAT signaling is dispensable for the generation of Foxp3+ Treg cells. (a) Flow cytometry showing the distribution of thymocyte populations based on CD4 and CD8 stainings from WT, Il7r-/- and Jak3-/- mice. Numbers atop each plot represent total cellularity and within each plot represent the percent distribution of respective populations. (b) Quanification of total thymic cellularity in WT, Il7r-/- and Jak3-/- mice (n = 7 each, *** p < 0.0001; one-way ANOVA). (c) Distribution of CD4+CD25+ cells gated on CD4+ T cells in the thymus and LNs from Il7r-/- and Jak3-/- mice compared to WT controls. (d) Quantification of percent CD4+CD25+ cells gated on CD4+ T cells in the thymus and LNs from Il7r-/- and Jak3-/- mice compared to WT controls (n = 6 mice each, ** p = 0.0047 and *** p < 0.0001; one-way ANOVA). (e) Distribution of CD25+Foxp3+ cells gated on CD4+ T cells in the thymus and LNs of indicated mice. (f) Quantification of the frequency of CD4+CD25−Foxp3+ cells in the thymus and LNs from Il7r-/- and Jak3-/- mice compared to WT mice (*** p < 0.0001, ns = not significant; unpaired t-test). (g) Quantification of the frequency of CD4+CD25+Foxp3+ population in the thymus and in LNs from Il7r-/- and Jak3-/- mice compared to WT mice (*** p < 0.0001; unpaired t-test). In (f,g), each dot represents one individual mouse and the horizontal bar represents the mean values. Data are representative of three independent experiments.
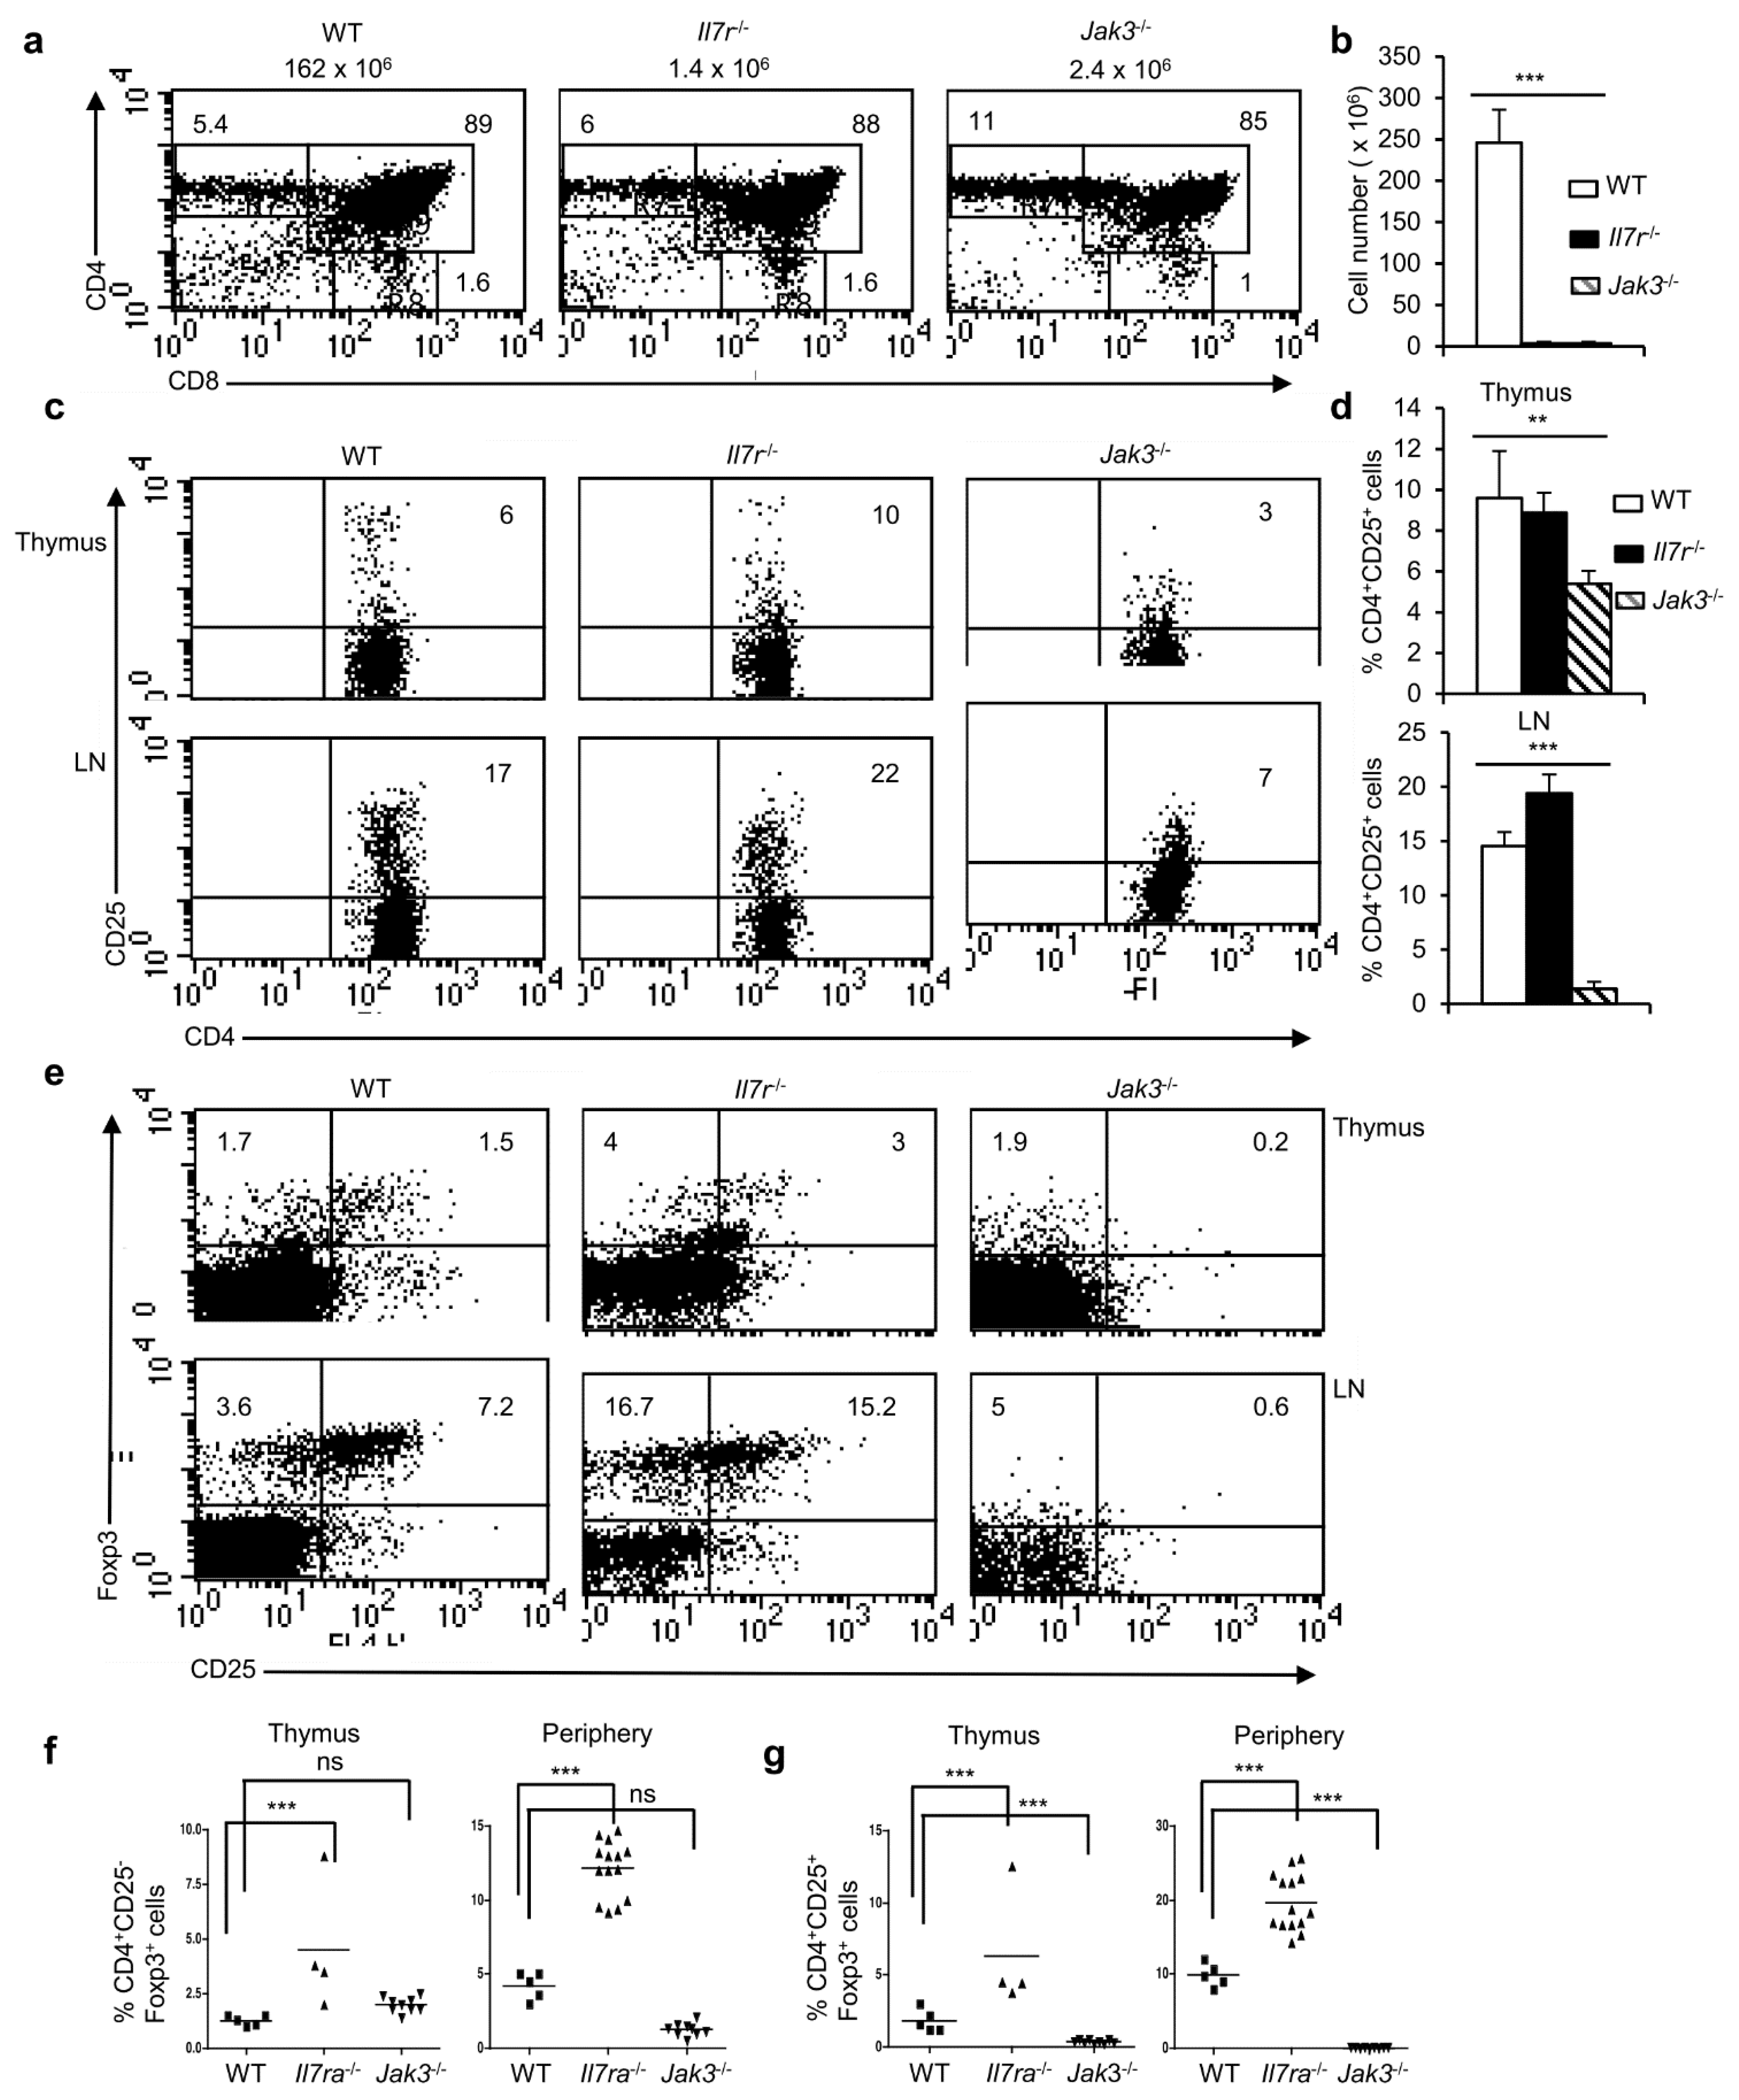
Figure 6.
NFAT activity promotes survival and thereby the maintenance of Foxp3+ Treg cells. (a) Levels of Bcl-2 expression in CD4+CD25−Foxp3+ and CD4+CD25+Foxp3+ cells in the thymus (** p = 0.0045; unpaired t-test) and in LNs (ns = not significant; unpaired t-test) from WT mice. (b) Levels of Bcl-2 in CD4+Foxp3+ cells from 24h NTOC in absence or presence of CsA. Numbers within the plot represent Bcl-2 MFI in respective conditions. (c) Quantification of Bcl-2 levels in CD4+Foxp3+ cells from 24 h NTOC in absence or presence of CsA (* p = 0.0401; unpaired t-test). (d) Cell death in 24 h NTOC in absence or presence of CsA. (e) Quantification of cell death in WT 24h NTOC in untreated or CsA-treated lobes (ns = not significant; unpaired t-test). (f) Restoration of CD4+Foxp3+ Treg population in Il2-/-Bim-/- mice compared to Il2-/- mice. (g) Quantification of percent CD4+Foxp3+ Treg population in Il2-/-Bim-/- mice compared to littermate control mice (n = 7 WT, 6 Il2-/- and 5 Il2-/-Bim-/- mice, *** p < 0.0001; one-way ANOVA). Number inside each dot plot represents % Foxp3+ cells. Data are representative of three independent experiments and in (a,c,e,g) are presented as mean ± s.d.
Publisher’s Note: MDPI stays neutral with regard to jurisdictional claims in published maps and institutional affiliations. |
© 2022 by the authors. Licensee MDPI, Basel, Switzerland. This article is an open access article distributed under the terms and conditions of the Creative Commons Attribution (CC BY) license (https://creativecommons.org/licenses/by/4.0/).
Share and Cite
MDPI and ACS Style
Barahona de Brito, C.; Patra, A.K. NFAT Factors Are Dispensable for the Development but Are Critical for the Maintenance of Foxp3+ Regulatory T Cells. Cells 2022, 11, 1397. https://doi.org/10.3390/cells11091397
AMA Style
Barahona de Brito C, Patra AK. NFAT Factors Are Dispensable for the Development but Are Critical for the Maintenance of Foxp3+ Regulatory T Cells. Cells. 2022; 11(9):1397. https://doi.org/10.3390/cells11091397
Chicago/Turabian StyleBarahona de Brito, Carlotta, and Amiya Kumar Patra. 2022. "NFAT Factors Are Dispensable for the Development but Are Critical for the Maintenance of Foxp3+ Regulatory T Cells" Cells 11, no. 9: 1397. https://doi.org/10.3390/cells11091397
Note that from the first issue of 2016, this journal uses article numbers instead of page numbers. See further details here.