
Cellular and Genomic Features of Muscle Differentiation from Isogenic Fibroblasts and Myoblasts
 ,
,  , , , , and
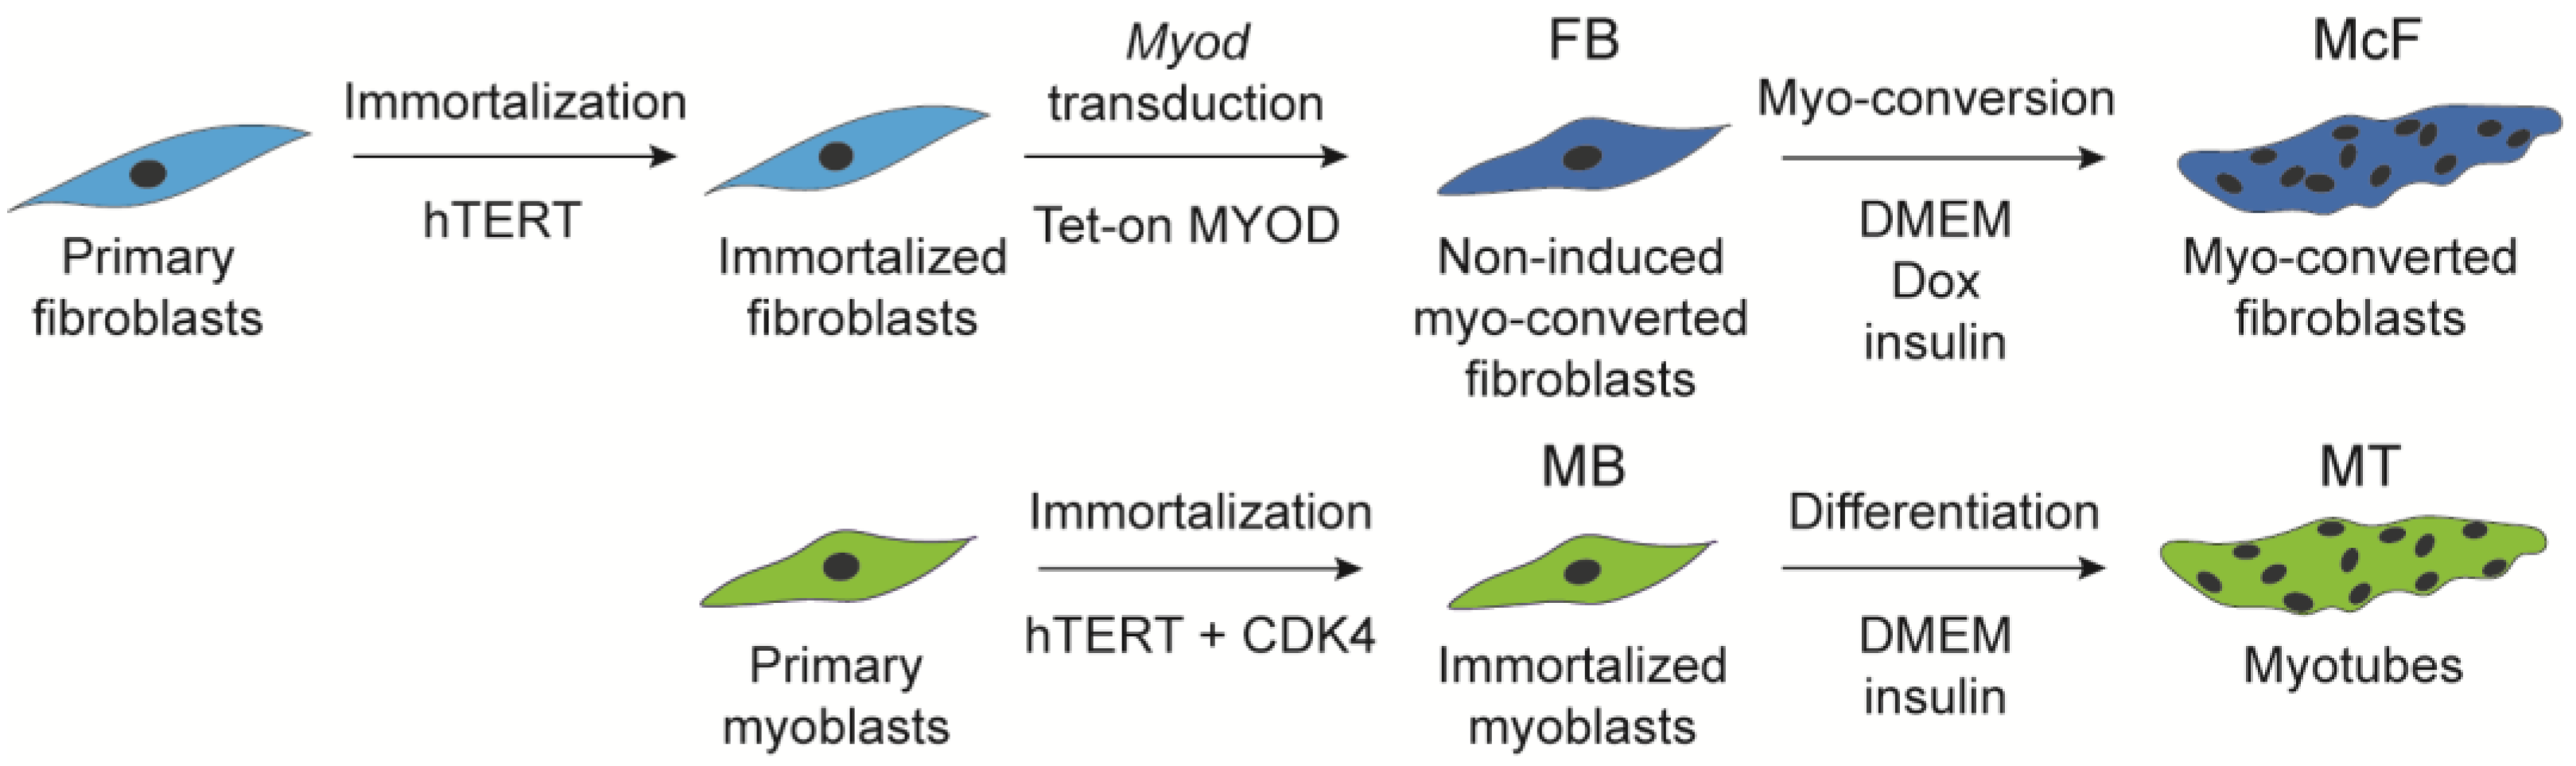
Abstract
:1. Introduction
2. Materials and Methods
2.1. Myogenic Induction of Myoblasts and Fibroblasts
2.2. Immunofluorescence
2.3. RNA-Sequencing and RNA-Seq Analysis
2.4. Chromatin Immunoprecipitation (ChIP)-Sequencing and ChIP-Seq Analysis
2.5. Intersections between LADs and Genomic Features
3. Results
3.1. Myo-Converted Fibroblasts Recapitulate the Phenotypic Characteristics of Myotubes
3.2. Myod-Induced Fibroblasts Transcriptionally Commit to Myogenesis
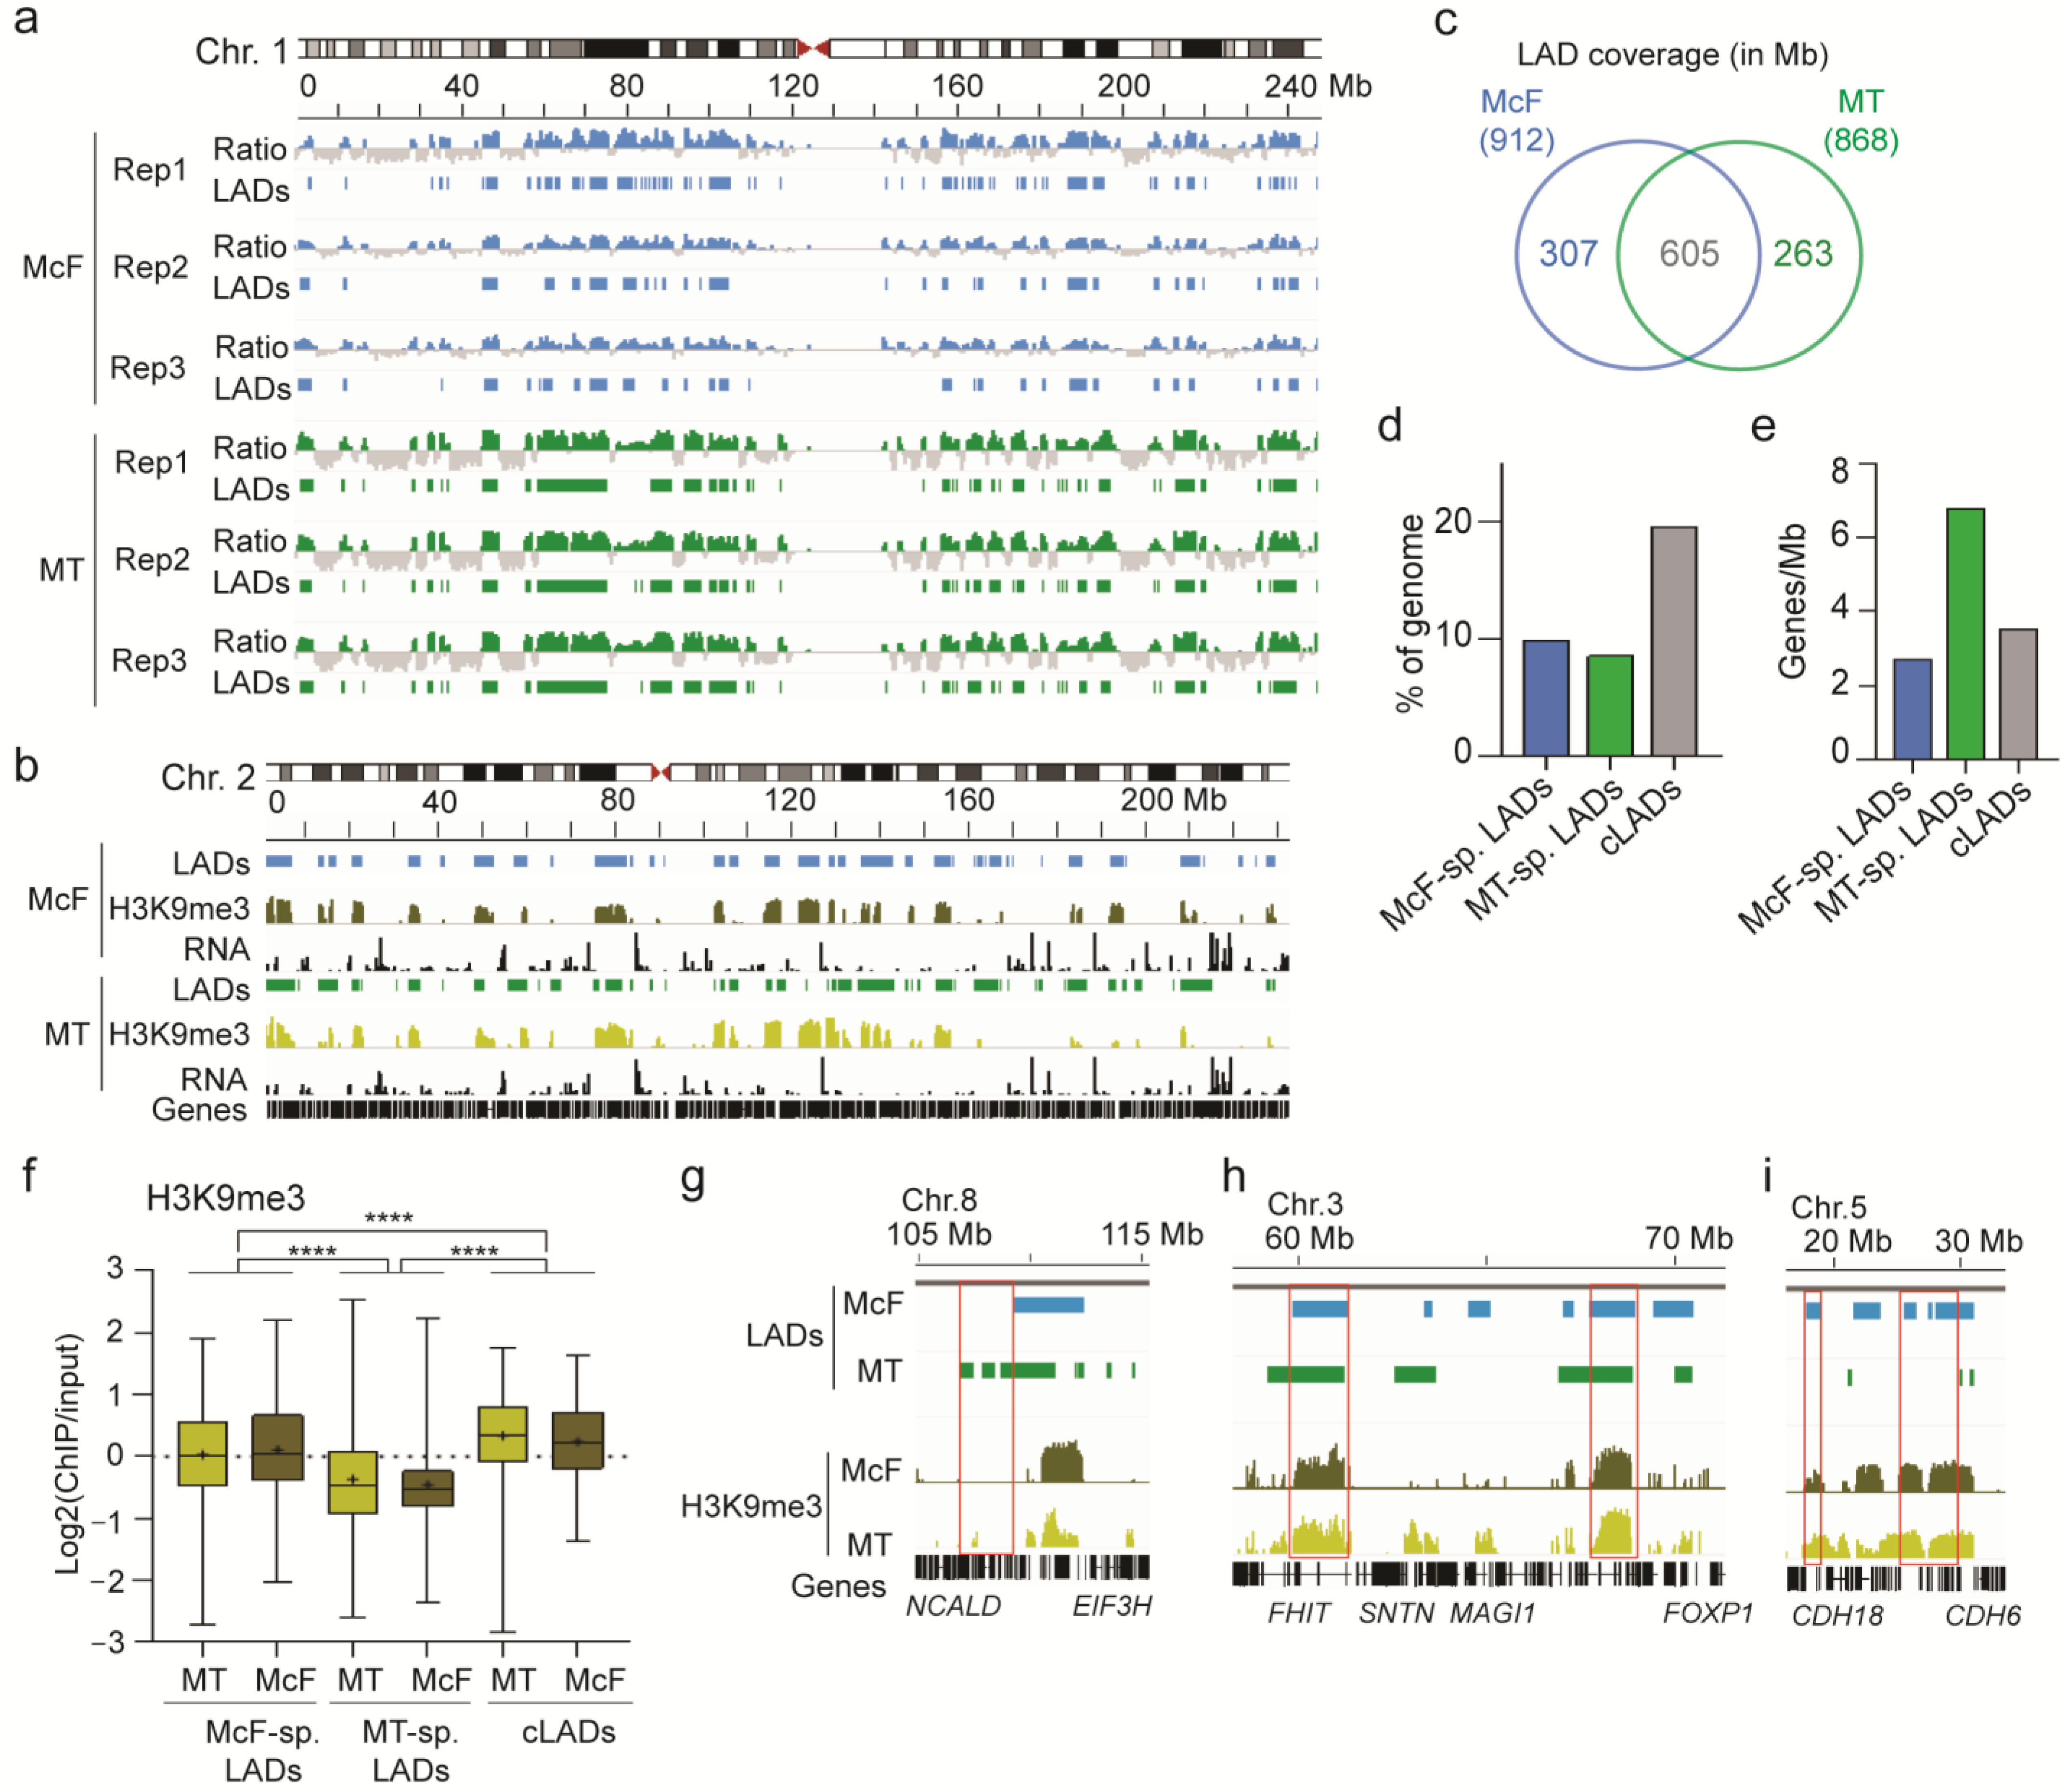
3.3. Features of Lamin A/C LADs in Myotubes and Myo-Converted Fibroblasts
3.4. A Subset of Myogenic Genes Is Localized and Expressed in LADs
4. Discussion
5. Conclusions
Supplementary Materials
Author Contributions
Funding
Institutional Review Board Statement
Informed Consent Statement
Data Availability Statement
Acknowledgments
Conflicts of Interest
Abbreviations
| ChIP | chromatin immunoprecipitation |
| GEO | Gene expression omnibus |
| LAD | lamina-associated domain |
| cLAD | conserved LAD |
| FB | fibroblast; MB |
| iPS | Induced pluripotent stem |
| McF | myo-converted fibroblast |
| MT | myotube |
| MHC | myosin heavy chain |
| PCA | principal component analysis |
| TPM | transcript per million. |
| MB | myoblast |
| seq | sequencing |
References
- Chal, J.; Pourquie, O. Making muscle: Skeletal myogenesis in vivo and in vitro. Development 2017, 144, 2104–2122. [Google Scholar] [CrossRef] [PubMed] [Green Version]
- Bigot, A.; Jacquemin, V.; Debacq-Chainiaux, F.; Butler-Browne, G.S.; Toussaint, O.; Furling, D.; Mouly, V. Replicative aging down-regulates the myogenic regulatory factors in human myoblasts. Biol. Cell 2008, 100, 189–199. [Google Scholar] [CrossRef] [Green Version]
- Zhang, H.; Wen, J.; Bigot, A.; Chen, J.; Shang, R.; Mouly, V.; Bi, P. Human myotube formation is determined by MyoD-Myomixer/Myomaker axis. Sci. Adv. 2020, 6, eabc4062. [Google Scholar] [CrossRef]
- Zschuntzsch, J.; Meyer, S.; Shahriyari, M.; Kummer, K.; Schmidt, M.; Kummer, S.; Tiburcy, M. The Evolution of Complex Muscle Cell In Vitro Models to Study Pathomechanisms and Drug Development of Neuromuscular Disease. Cells 2022, 11, 1233. [Google Scholar] [CrossRef]
- Chaouch, S.; Mouly, V.; Goyenvalle, A.; Vulin, A.; Mamchaoui, K.; Negroni, E.; Di Santo, J.; Butler-Browne, G.; Torrente, Y.; Garcia, L.; et al. Immortalized skin fibroblasts expressing conditional MyoD as a renewable and reliable source of converted human muscle cells to assess therapeutic strategies for muscular dystrophies: Validation of an exon-skipping approach to restore dystrophin in Duchenne muscular dystrophy cells. Hum. Gene Ther. 2009, 20, 784–790. [Google Scholar] [PubMed]
- Lattanzi, L.; Salvatori, G.; Coletta, M.; Sonnino, C.; Cusella De Angelis, M.G.; Gioglio, L.; Murry, C.E.; Kelly, R.; Ferrari, G.; Molinaro, M.; et al. High efficiency myogenic conversion of human fibroblasts by adenoviral vector-mediated MyoD gene transfer. An alternative strategy for ex vivo gene therapy of primary myopathies. J. Clin. Investig. 1998, 101, 2119–2128. [Google Scholar] [CrossRef]
- Choi, J.; Costa, M.L.; Mermelstein, C.S.; Chagas, C.; Holtzer, S.; Holtzer, H. MyoD converts primary dermal fibroblasts, chondroblasts, smooth muscle, and retinal pigmented epithelial cells into striated mononucleated myoblasts and multinucleated myotubes. Proc. Natl. Acad. Sci. USA 1990, 87, 7988–7992. [Google Scholar] [CrossRef] [PubMed]
- Weintraub, H.; Tapscott, S.J.; Davis, R.L.; Thayer, M.J.; Adam, M.A.; Lassar, A.B.; Miller, A.D. Activation of muscle-specific genes in pigment, nerve, fat, liver, and fibroblast cell lines by forced expression of MyoD. Proc. Natl. Acad. Sci. USA 1989, 86, 5434–5438. [Google Scholar] [CrossRef]
- Bodnar, A.G.; Ouellette, M.; Frolkis, M.; Holt, S.E.; Chiu, C.P.; Morin, G.B.; Harley, C.B.; Shay, J.W.; Lichtsteiner, S.; Wright, W.E. Extension of life-span by introduction of telomerase into normal human cells. Science 1998, 279, 349–352. [Google Scholar] [CrossRef] [Green Version]
- Park, G.H.; Jeong, H.; Jeong, M.G.; Jang, E.J.; Bae, M.A.; Lee, Y.L.; Kim, N.J.; Hong, J.H.; Hwang, E.S. Novel TAZ modulators enhance myogenic differentiation and muscle regeneration. Br. J. Pharmacol. 2014, 171, 4051–4061. [Google Scholar] [CrossRef] [Green Version]
- Perovanovic, J.; Dell’Orso, S.; Gnochi, V.F.; Jaiswal, J.K.; Sartorelli, V.; Vigouroux, C.; Mamchaoui, K.; Mouly, V.; Bonne, G.; Hoffman, E.P. Laminopathies disrupt epigenomic developmental programs and cell fate. Sci. Transl. Med. 2016, 8, 335ra358. [Google Scholar] [CrossRef] [Green Version]
- Owens, D.J.; Messeant, J.; Moog, S.; Viggars, M.; Ferry, A.; Mamchaoui, K.; Lacene, E.; Romero, N.; Brull, A.; Bonne, G.; et al. Lamin-Related Congenital Muscular Dystrophy Alters Mechanical Signaling and Skeletal Muscle Growth. Int. J. Mol. Sci. 2020, 22, 306. [Google Scholar] [CrossRef] [PubMed]
- Kayman Kurekci, G.; Acar, A.C.; Dincer, P.R. Loss of the Nuclear Envelope Protein LAP1B Disrupts the Myogenic Differentiation of Patient-Derived Fibroblasts. Int. J. Mol. Sci. 2022, 23, 13615. [Google Scholar] [CrossRef] [PubMed]
- Wein, N.; Vulin, A.; Findlay, A.R.; Gumienny, F.; Huang, N.; Wilton, S.D.; Flanigan, K.M. Efficient Skipping of Single Exon Duplications in DMD Patient-Derived Cell Lines Using an Antisense Oligonucleotide Approach. J. Neuromuscul. Dis. 2017, 4, 199–207. [Google Scholar] [CrossRef] [PubMed]
- Ketley, A.; Chen, C.Z.; Li, X.; Arya, S.; Robinson, T.E.; Granados-Riveron, J.; Udosen, I.; Morris, G.E.; Holt, I.; Furling, D.; et al. High-content screening identifies small molecules that remove nuclear foci, affect MBNL distribution and CELF1 protein levels via a PKC-independent pathway in myotonic dystrophy cell lines. Hum. Mol. Genet. 2014, 23, 1551–1562. [Google Scholar] [CrossRef] [PubMed] [Green Version]
- Buchwalter, A.; Kaneshiro, J.M.; Hetzer, M.W. Coaching from the sidelines: The nuclear periphery in genome regulation. Nat. Rev. Genet. 2019, 20, 39–50. [Google Scholar] [CrossRef] [PubMed]
- Burke, B.; Stewart, C.L. The nuclear lamins: Flexibility in function. Nat. Rev. Mol. Cell Biol. 2013, 14, 13–24. [Google Scholar] [CrossRef]
- Briand, N.; Collas, P. Lamina-associated domains: Peripheral matters and internal affairs. Genome Biol. 2020, 21, 85. [Google Scholar] [CrossRef] [Green Version]
- Meuleman, W.; Peric-Hupkes, D.; Kind, J.; Beaudry, J.B.; Pagie, L.; Kellis, M.; Reinders, M.; Wessels, L.; van Steensel, B. Constitutive nuclear lamina-genome interactions are highly conserved and associated with A/T-rich sequence. Genome Res. 2013, 23, 270–280. [Google Scholar] [CrossRef] [Green Version]
- Shah, P.P.; Keough, K.C.; Gjoni, K.; Santini, G.T.; Abdill, R.J.; Wickramasinghe, N.M.; Dundes, C.E.; Karnay, A.; Chen, A.; Salomon, R.E.A.; et al. An atlas of lamina-associated chromatin across twelve human cell types reveals an intermediate chromatin subtype. Genome Biol. 2023, 24, 16. [Google Scholar] [CrossRef]
- Peric-Hupkes, D.; Meuleman, W.; Pagie, L.; Bruggeman, S.W.; Solovei, I.; Brugman, W.; Graf, S.; Flicek, P.; Kerkhoven, R.M.; van Lohuizen, M.; et al. Molecular maps of the reorganization of genome-nuclear lamina interactions during differentiation. Mol. Cell 2010, 38, 603–613. [Google Scholar] [CrossRef] [PubMed]
- Rønningen, T.; Shah, A.; Oldenburg, A.R.; Vekterud, K.; Delbarre, E.; Moskaug, J.O.; Collas, P. Prepatterning of differentiation-driven nuclear lamin A/C-associated chromatin domains by GlcNAcylated histone H2B. Genome Res. 2015, 25, 1825–1835. [Google Scholar] [CrossRef] [PubMed] [Green Version]
- Robson, M.I.; de Las Heras, J.I.; Czapiewski, R.; Sivakumar, A.; Kerr, A.R.W.; Schirmer, E.C. Constrained release of lamina-associated enhancers and genes from the nuclear envelope during T-cell activation facilitates their association in chromosome compartments. Genome Res. 2017, 27, 1126–1138. [Google Scholar] [CrossRef] [PubMed] [Green Version]
- Czapiewski, R.; Batrakou, D.G.; de las Heras, J.; Carter, R.N.; Sivakumar, A.; Sliwinska, M.; Dixon, C.R.; Webb, S.; Lattanzi, G.; Morton, N.M.; et al. Genomic loci mispositioning in Tmem120a knockout mice yields latent lipodystrophy. Nat. Commun. 2022, 13, 321. [Google Scholar] [CrossRef]
- Madsen-Østerbye, J.; Abdelhalim, M.; Baudement, M.O.; Collas, P. Local euchromatin enrichment in lamina-associated domains anticipates their re-positioning in the adipogenic lineage. Genome Biol. 2022, 23, 91. [Google Scholar] [CrossRef]
- Bellanger, A.; Madsen-Osterbye, J.; Galigniana, N.M.; Collas, P. Restructuring of Lamina-Associated Domains in Senescence and Cancer. Cells 2022, 11, 1846. [Google Scholar] [CrossRef]
- Brull, A.; Morales Rodriguez, B.; Bonne, G.; Muchir, A.; Bertrand, A.T. The Pathogenesis and Therapies of Striated Muscle Laminopathies. Front. Physiol. 2018, 9, 1533. [Google Scholar] [CrossRef] [Green Version]
- Shin, J.Y.; Worman, H.J. Molecular Pathology of Laminopathies. Annu. Rev. Pathol. 2022, 17, 159–180. [Google Scholar] [CrossRef]
- Shumaker, D.K.; Dechat, T.; Kohlmaier, A.; Adam, S.A.; Bozovsky, M.R.; Erdos, M.R.; Eriksson, M.; Goldman, A.E.; Khuon, S.; Collins, F.S.; et al. Mutant nuclear lamin A leads to progressive alterations of epigenetic control in premature aging. Proc. Natl. Acad. Sci. USA 2006, 103, 8703–8708. [Google Scholar] [CrossRef]
- Paulsen, J.; Sekelja, M.; Oldenburg, A.R.; Barateau, A.; Briand, N.; Delbarre, E.; Shah, A.; Sørensen, A.L.; Vigouroux, C.; Buendia, B.; et al. Chrom3D: Three-dimensional genome modeling from Hi-C and lamin-genome contacts. Genome Biol. 2017, 18, 21. [Google Scholar] [CrossRef]
- Briand, N.; Guenantin, A.C.; Jeziorowska, D.; Shah, A.; Mantecon, M.; Capel, E.; Garcia, M.; Oldenburg, A.; Paulsen, J.; Hulot, J.S.; et al. The lipodystrophic hotspot lamin A p.R482W mutation deregulates the mesodermal inducer T/Brachyury and early vascular differentiation gene networks. Hum. Mol. Genet. 2018, 27, 1447–1459. [Google Scholar] [CrossRef] [PubMed] [Green Version]
- Harr, J.C.; Schmid, C.D.; Munoz-Jimenez, C.; Romero-Bueno, R.; Kalck, V.; Gonzalez-Sandoval, A.; Hauer, M.H.; Padeken, J.; Askjaer, P.; Mattout, A.; et al. Loss of an H3K9me anchor rescues laminopathy-linked changes in nuclear organization and muscle function in an Emery-Dreifuss muscular dystrophy model. Genes Dev. 2020, 34, 560–579. [Google Scholar] [CrossRef] [PubMed] [Green Version]
- Kim, Y.; Zheng, X.; Zheng, Y. Role of lamins in 3D genome organization and global gene expression. Nucleus 2019, 10, 33–41. [Google Scholar] [CrossRef] [PubMed] [Green Version]
- Shah, P.P.; Lv, W.; Rhoades, J.H.; Poleshko, A.; Abbey, D.; Caporizzo, M.A.; Linares-Saldana, R.; Heffler, J.G.; Sayed, N.; Thomas, D.; et al. Pathogenic LMNA variants disrupt cardiac lamina-chromatin interactions and de-repress alternative fate genes. Cell Stem Cell 2021, 28, 938–954.e939. [Google Scholar] [CrossRef] [PubMed]
- Wang, Y.; Elsherbiny, A.; Kessler, L.; Cordero, J.; Shi, H.; Serke, H.; Lityagina, O.; Trogisch, F.A.; Mohammadi, M.M.; El-Battrawy, I.; et al. Lamin A/C-dependent chromatin architecture safeguards naive pluripotency to prevent aberrant cardiovascular cell fate and function. Nat. Commun. 2022, 13, 6663. [Google Scholar] [CrossRef]
- Zhang, X.; Shao, X.; Zhang, R.; Zhu, R.; Feng, R. Integrated analysis reveals the alterations that LMNA interacts with euchromatin in LMNA mutation-associated dilated cardiomyopathy. Clin. Epigenetics 2021, 13, 3. [Google Scholar] [CrossRef]
- Mamchaoui, K.; Trollet, C.; Bigot, A.; Negroni, E.; Chaouch, S.; Wolff, A.; Kandalla, P.K.; Marie, S.; Di Santo, J.; St Guily, J.L.; et al. Immortalized pathological human myoblasts: Towards a universal tool for the study of neuromuscular disorders. Skelet. Muscle 2011, 1, 34. [Google Scholar] [CrossRef] [Green Version]
- Thorley, M.; Duguez, S.; Mazza, E.M.C.; Valsoni, S.; Bigot, A.; Mamchaoui, K.; Harmon, B.; Voit, T.; Mouly, V.; Duddy, W. Skeletal muscle characteristics are preserved in hTERT/cdk4 human myogenic cell lines. Skelet. Muscle 2016, 6, 43. [Google Scholar] [CrossRef] [Green Version]
- Chen, S.; Zhou, Y.; Chen, Y.; Gu, J. fastp: An ultra-fast all-in-one FASTQ preprocessor. Bioinformatics 2018, 34, i884–i890. [Google Scholar] [CrossRef]
- Patro, R.; Duggal, G.; Love, M.I.; Irizarry, R.A.; Kingsford, C. Salmon provides fast and bias-aware quantification of transcript expression. Nat. Methods 2017, 14, 417–419. [Google Scholar] [CrossRef] [Green Version]
- Martin, F.J.; Amode, M.R.; Aneja, A.; Austine-Orimoloye, O.; Azov, A.G.; Barnes, I.; Becker, A.; Bennett, R.; Berry, A.; Bhai, J.; et al. Ensembl 2023. Nucleic Acids Res. 2023, 51, D933–D941. [Google Scholar] [CrossRef] [PubMed]
- Soneson, C.; Love, M.I.; Robinson, M.D. Differential analyses for RNA-seq: Transcript-level estimates improve gene-level inferences. F1000Res 2015, 4, 1521. [Google Scholar] [CrossRef] [PubMed]
- Love, M.I.; Huber, W.; Anders, S. Moderated estimation of fold change and dispersion for RNA-seq data with DESeq2. Genome Biol. 2014, 15, 550. [Google Scholar] [CrossRef] [PubMed] [Green Version]
- Varet, H.; Brillet-Gueguen, L.; Coppee, J.Y.; Dillies, M.A. SARTools: A DESeq2- and EdgeR-Based R Pipeline for Comprehensive Differential Analysis of RNA-Seq Data. PLoS ONE 2016, 11, e0157022. [Google Scholar] [CrossRef] [PubMed] [Green Version]
- Subramanian, A.; Tamayo, P.; Mootha, V.K.; Mukherjee, S.; Ebert, B.L.; Gillette, M.A.; Paulovich, A.; Pomeroy, S.L.; Golub, T.R.; Lander, E.S.; et al. Gene set enrichment analysis: A knowledge-based approach for interpreting genome-wide expression profiles. Proc. Natl. Acad. Sci. USA 2005, 102, 15545–15550. [Google Scholar] [CrossRef]
- Liberzon, A.; Birger, C.; Thorvaldsdottir, H.; Ghandi, M.; Mesirov, J.P.; Tamayo, P. The Molecular Signatures Database (MSigDB) hallmark gene set collection. Cell Syst. 2015, 1, 417–425. [Google Scholar] [CrossRef] [Green Version]
- Langmead, B.; Salzberg, S.L. Fast gapped-read alignment with Bowtie 2. Nat. Methods 2012, 9, 357–359. [Google Scholar] [CrossRef] [Green Version]
- Zerbino, D.R.; Johnson, N.; Juettemann, T.; Wilder, S.P.; Flicek, P. WiggleTools: Parallel processing of large collections of genome-wide datasets for visualization and statistical analysis. Bioinformatics 2014, 30, 1008–1009. [Google Scholar] [CrossRef] [Green Version]
- Ramírez, F.; Dündar, F.; Diehl, S.; Grüning, B.A.; Manke, T. deepTools: A flexible platform for exploring deep-sequencing data. Nucleic Acids Res. 2014, 42, W187–W191. [Google Scholar] [CrossRef] [Green Version]
- Lund, E.G.; Oldenburg, A.R.; Collas, P. Enriched Domain Detector: A program for detection of wide genomic enrichment domains robust against local variations. Nucleic Acids Res 2014, 42, e92. [Google Scholar] [CrossRef]
- Thorvaldsdottir, H.; Robinson, J.T.; Mesirov, J.P. Integrative Genomics Viewer (IGV): High-performance genomics data visualization and exploration. Brief. Bioinform. 2013, 14, 178–192. [Google Scholar] [CrossRef] [PubMed] [Green Version]
- Quinlan, A.R.; Hall, I.M. BEDTools: A flexible suite of utilities for comparing genomic features. Bioinformatics 2010, 26, 841–842. [Google Scholar] [CrossRef] [Green Version]
- Neph, S.; Kuehn, M.S.; Reynolds, A.P.; Haugen, E.; Thurman, R.E.; Johnson, A.K.; Rynes, E.; Maurano, M.T.; Vierstra, J.; Thomas, S. BEDOPS: High-performance genomic feature operations. Bioinformatics 2012, 28, 1919–1920. [Google Scholar] [CrossRef] [Green Version]
- Mi, H.; Muruganujan, A.; Huang, X.; Ebert, D.; Mills, C.; Guo, X.; Thomas, P.D. Protocol Update for large-scale genome and gene function analysis with the PANTHER classification system (v.14.0). Nat. Protoc. 2019, 14, 703–721. [Google Scholar] [CrossRef]
- Mouly, V.; Aamiri, A.; Bigot, A.; Cooper, R.N.; Di Donna, S.; Furling, D.; Gidaro, T.; Jacquemin, V.; Mamchaoui, K.; Negroni, E.; et al. The mitotic clock in skeletal muscle regeneration, disease and cell mediated gene therapy. Acta Physiol. Scand. 2005, 184, 3–15. [Google Scholar] [CrossRef] [PubMed]
- Wu, Y.; Zhang, X.; Salmon, M.; Lin, X.; Zehner, Z.E. TGFbeta1 regulation of vimentin gene expression during differentiation of the C2C12 skeletal myogenic cell line requires Smads, AP-1 and Sp1 family members. Biochim. Biophys. Acta 2007, 1773, 427–439. [Google Scholar] [CrossRef] [Green Version]
- Hindi, S.M.; Tajrishi, M.M.; Kumar, A. Signaling mechanisms in mammalian myoblast fusion. Sci. Signal. 2013, 6, re2. [Google Scholar] [CrossRef] [PubMed] [Green Version]
- Hu, P.; Geles, K.G.; Paik, J.H.; DePinho, R.A.; Tjian, R. Codependent activators direct myoblast-specific MyoD transcription. Dev. Cell 2008, 15, 534–546. [Google Scholar] [CrossRef] [Green Version]
- Wu, F.; Yao, J. Identifying Novel Transcriptional and Epigenetic Features of Nuclear Lamina-associated Genes. Sci. Rep. 2017, 7, 100. [Google Scholar] [CrossRef] [Green Version]
- Iberite, F.; Gruppioni, E.; Ricotti, L. Skeletal muscle differentiation of human iPSCs meets bioengineering strategies: Perspectives and challenges. NPJ Regen. Med. 2022, 7, 23. [Google Scholar] [CrossRef]
- Rouhani, F.J.; Zou, X.; Danecek, P.; Badja, C.; Amarante, T.D.; Koh, G.; Wu, Q.; Memari, Y.; Durbin, R.; Martincorena, I.; et al. Substantial somatic genomic variation and selection for BCOR mutations in human induced pluripotent stem cells. Nat. Genet. 2022, 54, 1406–1416. [Google Scholar] [CrossRef] [PubMed]
- Falcone, S.; Roman, W.; Hnia, K.; Gache, V.; Didier, N.; Laine, J.; Aurade, F.; Marty, I.; Nishino, I.; Charlet-Berguerand, N.; et al. N-WASP is required for Amphiphysin-2/BIN1-dependent nuclear positioning and triad organization in skeletal muscle and is involved in the pathophysiology of centronuclear myopathy. EMBO Mol. Med. 2014, 6, 1455–1475. [Google Scholar] [CrossRef]
- Roman, W.; Gomes, E.R. Nuclear positioning in skeletal muscle. Semin. Cell Dev. Biol. 2018, 82, 51–56. [Google Scholar] [CrossRef] [PubMed]
- Bone, C.R.; Tapley, E.C.; Gorjanacz, M.; Starr, D.A. The Caenorhabditis elegans SUN protein UNC-84 interacts with lamin to transfer forces from the cytoplasm to the nucleoskeleton during nuclear migration. Mol. Biol. Cell 2014, 25, 2853–2865. [Google Scholar] [CrossRef] [PubMed]
- Folker, E.S.; Ostlund, C.; Luxton, G.W.; Worman, H.J.; Gundersen, G.G. Lamin A variants that cause striated muscle disease are defective in anchoring transmembrane actin-associated nuclear lines for nuclear movement. Proc. Natl. Acad. Sci. USA 2011, 108, 131–136. [Google Scholar] [CrossRef]
- Haque, F.; Mazzeo, D.; Patel, J.T.; Smallwood, D.T.; Ellis, J.A.; Shanahan, C.M.; Shackleton, S. Mammalian SUN protein interaction networks at the inner nuclear membrane and their role in laminopathy disease processes. J. Biol. Chem. 2010, 285, 3487–3498. [Google Scholar] [CrossRef] [Green Version]
- Meinke, P.; Mattioli, E.; Haque, F.; Antoku, S.; Columbaro, M.; Straatman, K.R.; Worman, H.J.; Gundersen, G.G.; Lattanzi, G.; Wehnert, M.; et al. Muscular dystrophy-associated SUN1 and SUN2 variants disrupt nuclear-cytoskeletal connections and myonuclear organization. PLoS Genet. 2014, 10, e1004605. [Google Scholar] [CrossRef] [Green Version]
- Razafsky, D.; Potter, C.; Hodzic, D. Validation of a Mouse Model to Disrupt LINC Complexes in a Cell-specific Manner. J. Vis. Exp. 2015, 106, e53318. [Google Scholar]
- Shaw, N.M.; Rios-Monterrosa, J.L.; Fedorchak, G.R.; Ketterer, M.R.; Coombs, G.S.; Lammerding, J.; Wallrath, L.L. Effects of mutant lamins on nucleo-cytoskeletal coupling in Drosophila models of LMNA muscular dystrophy. Front. Cell Dev. Biol. 2022, 10, 934586. [Google Scholar] [CrossRef]
- Taranum, S.; Vaylann, E.; Meinke, P.; Abraham, S.; Yang, L.; Neumann, S.; Karakesisoglou, I.; Wehnert, M.; Noegel, A.A. LINC complex alterations in DMD and EDMD/CMT fibroblasts. Eur. J. Cell Biol. 2012, 91, 614–628. [Google Scholar] [CrossRef]
- Zwerger, M.; Jaalouk, D.E.; Lombardi, M.L.; Isermann, P.; Mauermann, M.; Dialynas, G.; Herrmann, H.; Wallrath, L.L.; Lammerding, J. Myopathic lamin mutations impair nuclear stability in cells and tissue and disrupt nucleo-cytoskeletal coupling. Hum. Mol. Genet. 2013, 22, 2335–2349. [Google Scholar] [CrossRef] [PubMed] [Green Version]
- Cadot, B.; Gache, V.; Vasyutina, E.; Falcone, S.; Birchmeier, C.; Gomes, E.R. Nuclear movement during myotube formation is microtubule and dynein dependent and is regulated by Cdc42, Par6 and Par3. EMBO Rep. 2012, 13, 741–749. [Google Scholar] [CrossRef] [PubMed] [Green Version]
- Vicente-Garcia, C.; Hernandez-Camacho, J.D.; Carvajal, J.J. Regulation of myogenic gene expression. Exp. Cell Res. 2022, 419, 113299. [Google Scholar] [CrossRef]
- Conerly, M.L.; Yao, Z.; Zhong, J.W.; Groudine, M.; Tapscott, S.J. Distinct Activities of Myf5 and MyoD Indicate Separate Roles in Skeletal Muscle Lineage Specification and Differentiation. Dev. Cell 2016, 36, 375–385. [Google Scholar] [CrossRef] [Green Version]
- Cao, Y.; Kumar, R.M.; Penn, B.H.; Berkes, C.A.; Kooperberg, C.; Boyer, L.A.; Young, R.A.; Tapscott, S.J. Global and gene-specific analyses show distinct roles for Myod and Myog at a common set of promoters. EMBO J. 2006, 25, 502–511. [Google Scholar] [CrossRef] [PubMed] [Green Version]
- Cao, Y.; Yao, Z.; Sarkar, D.; Lawrence, M.; Sanchez, G.J.; Parker, M.H.; MacQuarrie, K.L.; Davison, J.; Morgan, M.T.; Ruzzo, W.L.; et al. Genome-wide MyoD binding in skeletal muscle cells: A potential for broad cellular reprogramming. Dev. Cell 2010, 18, 662–674. [Google Scholar] [CrossRef] [PubMed] [Green Version]
- de la Serna, I.L.; Roy, K.; Carlson, K.A.; Imbalzano, A.N. MyoD can induce cell cycle arrest but not muscle differentiation in the presence of dominant negative SWI/SNF chromatin remodeling enzymes. J. Biol. Chem. 2001, 276, 41486–41491. [Google Scholar] [CrossRef] [Green Version]
- Braun, T.; Arnold, H.H. Myf-5 and myoD genes are activated in distinct mesenchymal stem cells and determine different skeletal muscle cell lineages. EMBO J. 1996, 15, 310–318. [Google Scholar] [CrossRef]
- Manandhar, D.; Song, L.; Kabadi, A.; Kwon, J.B.; Edsall, L.E.; Ehrlich, M.; Tsumagari, K.; Gersbach, C.A.; Crawford, G.E.; Gordan, R. Incomplete MyoD-induced transdifferentiation is associated with chromatin remodeling deficiencies. Nucleic Acids Res. 2017, 45, 11684–11699. [Google Scholar] [CrossRef] [Green Version]
- Ren, R.; Fan, Y.; Peng, Z.; Wang, S.; Jiang, Y.; Fu, L.; Cao, J.; Zhao, S.; Wang, H. Characterization and perturbation of CTCF-mediated chromatin interactions for enhancing myogenic transdifferentiation. Cell Rep. 2022, 40, 111206. [Google Scholar] [CrossRef]
- Avsec, Z.; Agarwal, V.; Visentin, D.; Ledsam, J.R.; Grabska-Barwinska, A.; Taylor, K.R.; Assael, Y.; Jumper, J.; Kohli, P.; Kelley, D.R. Effective gene expression prediction from sequence by integrating long-range interactions. Nat. Methods 2021, 18, 1196–1203. [Google Scholar] [CrossRef] [PubMed]
- Sahu, B.; Hartonen, T.; Pihlajamaa, P.; Wei, B.; Dave, K.; Zhu, F.; Kaasinen, E.; Lidschreiber, K.; Lidschreiber, M.; Daub, C.O.; et al. Sequence determinants of human gene regulatory elements. Nat. Genet. 2022, 54, 283–294. [Google Scholar] [CrossRef] [PubMed]
- Yang, M.G.; Ling, E.; Cowley, C.J.; Greenberg, M.E.; Vierbuchen, T. Characterization of sequence determinants of enhancer function using natural genetic variation. eLife 2022, 11, e76500. [Google Scholar] [CrossRef]
- Brueckner, L.; Zhao, P.A.; van Schaik, T.; Leemans, C.; Sima, J.; Peric-Hupkes, D.; Gilbert, D.M.; van Steensel, B. Local rewiring of genome-nuclear lamina interactions by transcription. EMBO J. 2020, 39, e103159. [Google Scholar] [CrossRef]
- Madsen-Østerbye, J.; Abdelhalim, M.; Hazell Pickering, S.; Collas, P. Gene Regulatory Interactions at Lamina-Associated Domains. Genes 2023, 14, 334. [Google Scholar] [CrossRef]
- Leemans, C.; van der Zwalm, M.C.H.; Brueckner, L.; Comoglio, F.; van Schaik, T.; Pagie, L.; van Arensbergen, J.; van Steensel, B. Promoter-Intrinsic and Local Chromatin Features Determine Gene Repression in LADs. Cell 2019, 177, 852–864.e814. [Google Scholar] [CrossRef] [Green Version]
- Brunet, A.; Forsberg, F.; Fan, Q.; Sæther, T.; Collas, P. Nuclear lamin B1 interactions with chromatin during the circadian cycle are uncoupled from periodic gene expression. Front. Genet. 2019, 10, 917. [Google Scholar] [CrossRef] [Green Version]
- Feng, R.; Desbordes, S.C.; Xie, H.; Tillo, E.S.; Pixley, F.; Stanley, E.R.; Graf, T.P. 1 and C/EBPalpha/beta convert fibroblasts into macrophage-like cells. Proc. Natl. Acad. Sci. USA 2008, 105, 6057–6062. [Google Scholar] [CrossRef]
- Paoletti, C.; Chiono, V. Bioengineering Methods in MicroRNA-Mediated Direct Reprogramming of Fibroblasts Into Cardiomyocytes. Front. Cardiovasc. Med. 2021, 8, 750438. [Google Scholar] [CrossRef] [PubMed]
- Roccio, M. Directed differentiation and direct reprogramming: Applying stem cell technologies to hearing research. Stem Cells 2021, 39, 375–388. [Google Scholar] [CrossRef]
- Ruetz, T.; Pfisterer, U.; Di Stefano, B.; Ashmore, J.; Beniazza, M.; Tian, T.V.; Kaemena, D.F.; Tosti, L.; Tan, W.; Manning, J.R.; et al. Constitutively Active SMAD2/3 Are Broad-Scope Potentiators of Transcription-Factor-Mediated Cellular Reprogramming. Cell Stem Cell 2017, 21, 791–805.e799. [Google Scholar] [CrossRef] [PubMed] [Green Version]
- Takeda, Y.; Harada, Y.; Yoshikawa, T.; Dai, P. Direct conversion of human fibroblasts to brown adipocytes by small chemical compounds. Sci. Rep. 2017, 7, 4304. [Google Scholar] [CrossRef] [PubMed]


Disclaimer/Publisher’s Note: The statements, opinions and data contained in all publications are solely those of the individual author(s) and contributor(s) and not of MDPI and/or the editor(s). MDPI and/or the editor(s) disclaim responsibility for any injury to people or property resulting from any ideas, methods, instructions or products referred to in the content. |
© 2023 by the authors. Licensee MDPI, Basel, Switzerland. This article is an open access article distributed under the terms and conditions of the Creative Commons Attribution (CC BY) license (https://creativecommons.org/licenses/by/4.0/).
Share and Cite
Benarroch, L.; Madsen-Østerbye, J.; Abdelhalim, M.; Mamchaoui, K.; Ohana, J.; Bigot, A.; Mouly, V.; Bonne, G.; Bertrand, A.T.; Collas, P. Cellular and Genomic Features of Muscle Differentiation from Isogenic Fibroblasts and Myoblasts. Cells 2023, 12, 1995. https://doi.org/10.3390/cells12151995
Benarroch L, Madsen-Østerbye J, Abdelhalim M, Mamchaoui K, Ohana J, Bigot A, Mouly V, Bonne G, Bertrand AT, Collas P. Cellular and Genomic Features of Muscle Differentiation from Isogenic Fibroblasts and Myoblasts. Cells. 2023; 12(15):1995. https://doi.org/10.3390/cells12151995
Chicago/Turabian StyleBenarroch, Louise, Julia Madsen-Østerbye, Mohamed Abdelhalim, Kamel Mamchaoui, Jessica Ohana, Anne Bigot, Vincent Mouly, Gisèle Bonne, Anne T. Bertrand, and Philippe Collas. 2023. "Cellular and Genomic Features of Muscle Differentiation from Isogenic Fibroblasts and Myoblasts" Cells 12, no. 15: 1995. https://doi.org/10.3390/cells12151995