
Effects of Diabetes Mellitus on Corneal Immune Cell Activation and the Development of Keratopathy
 , ,
, ,  , , and
Abstract
:
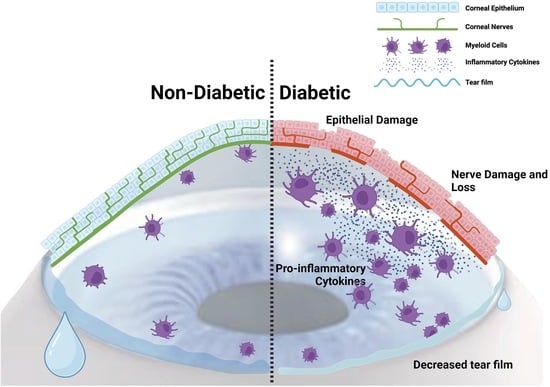
1. Introduction
2. Materials and Methods
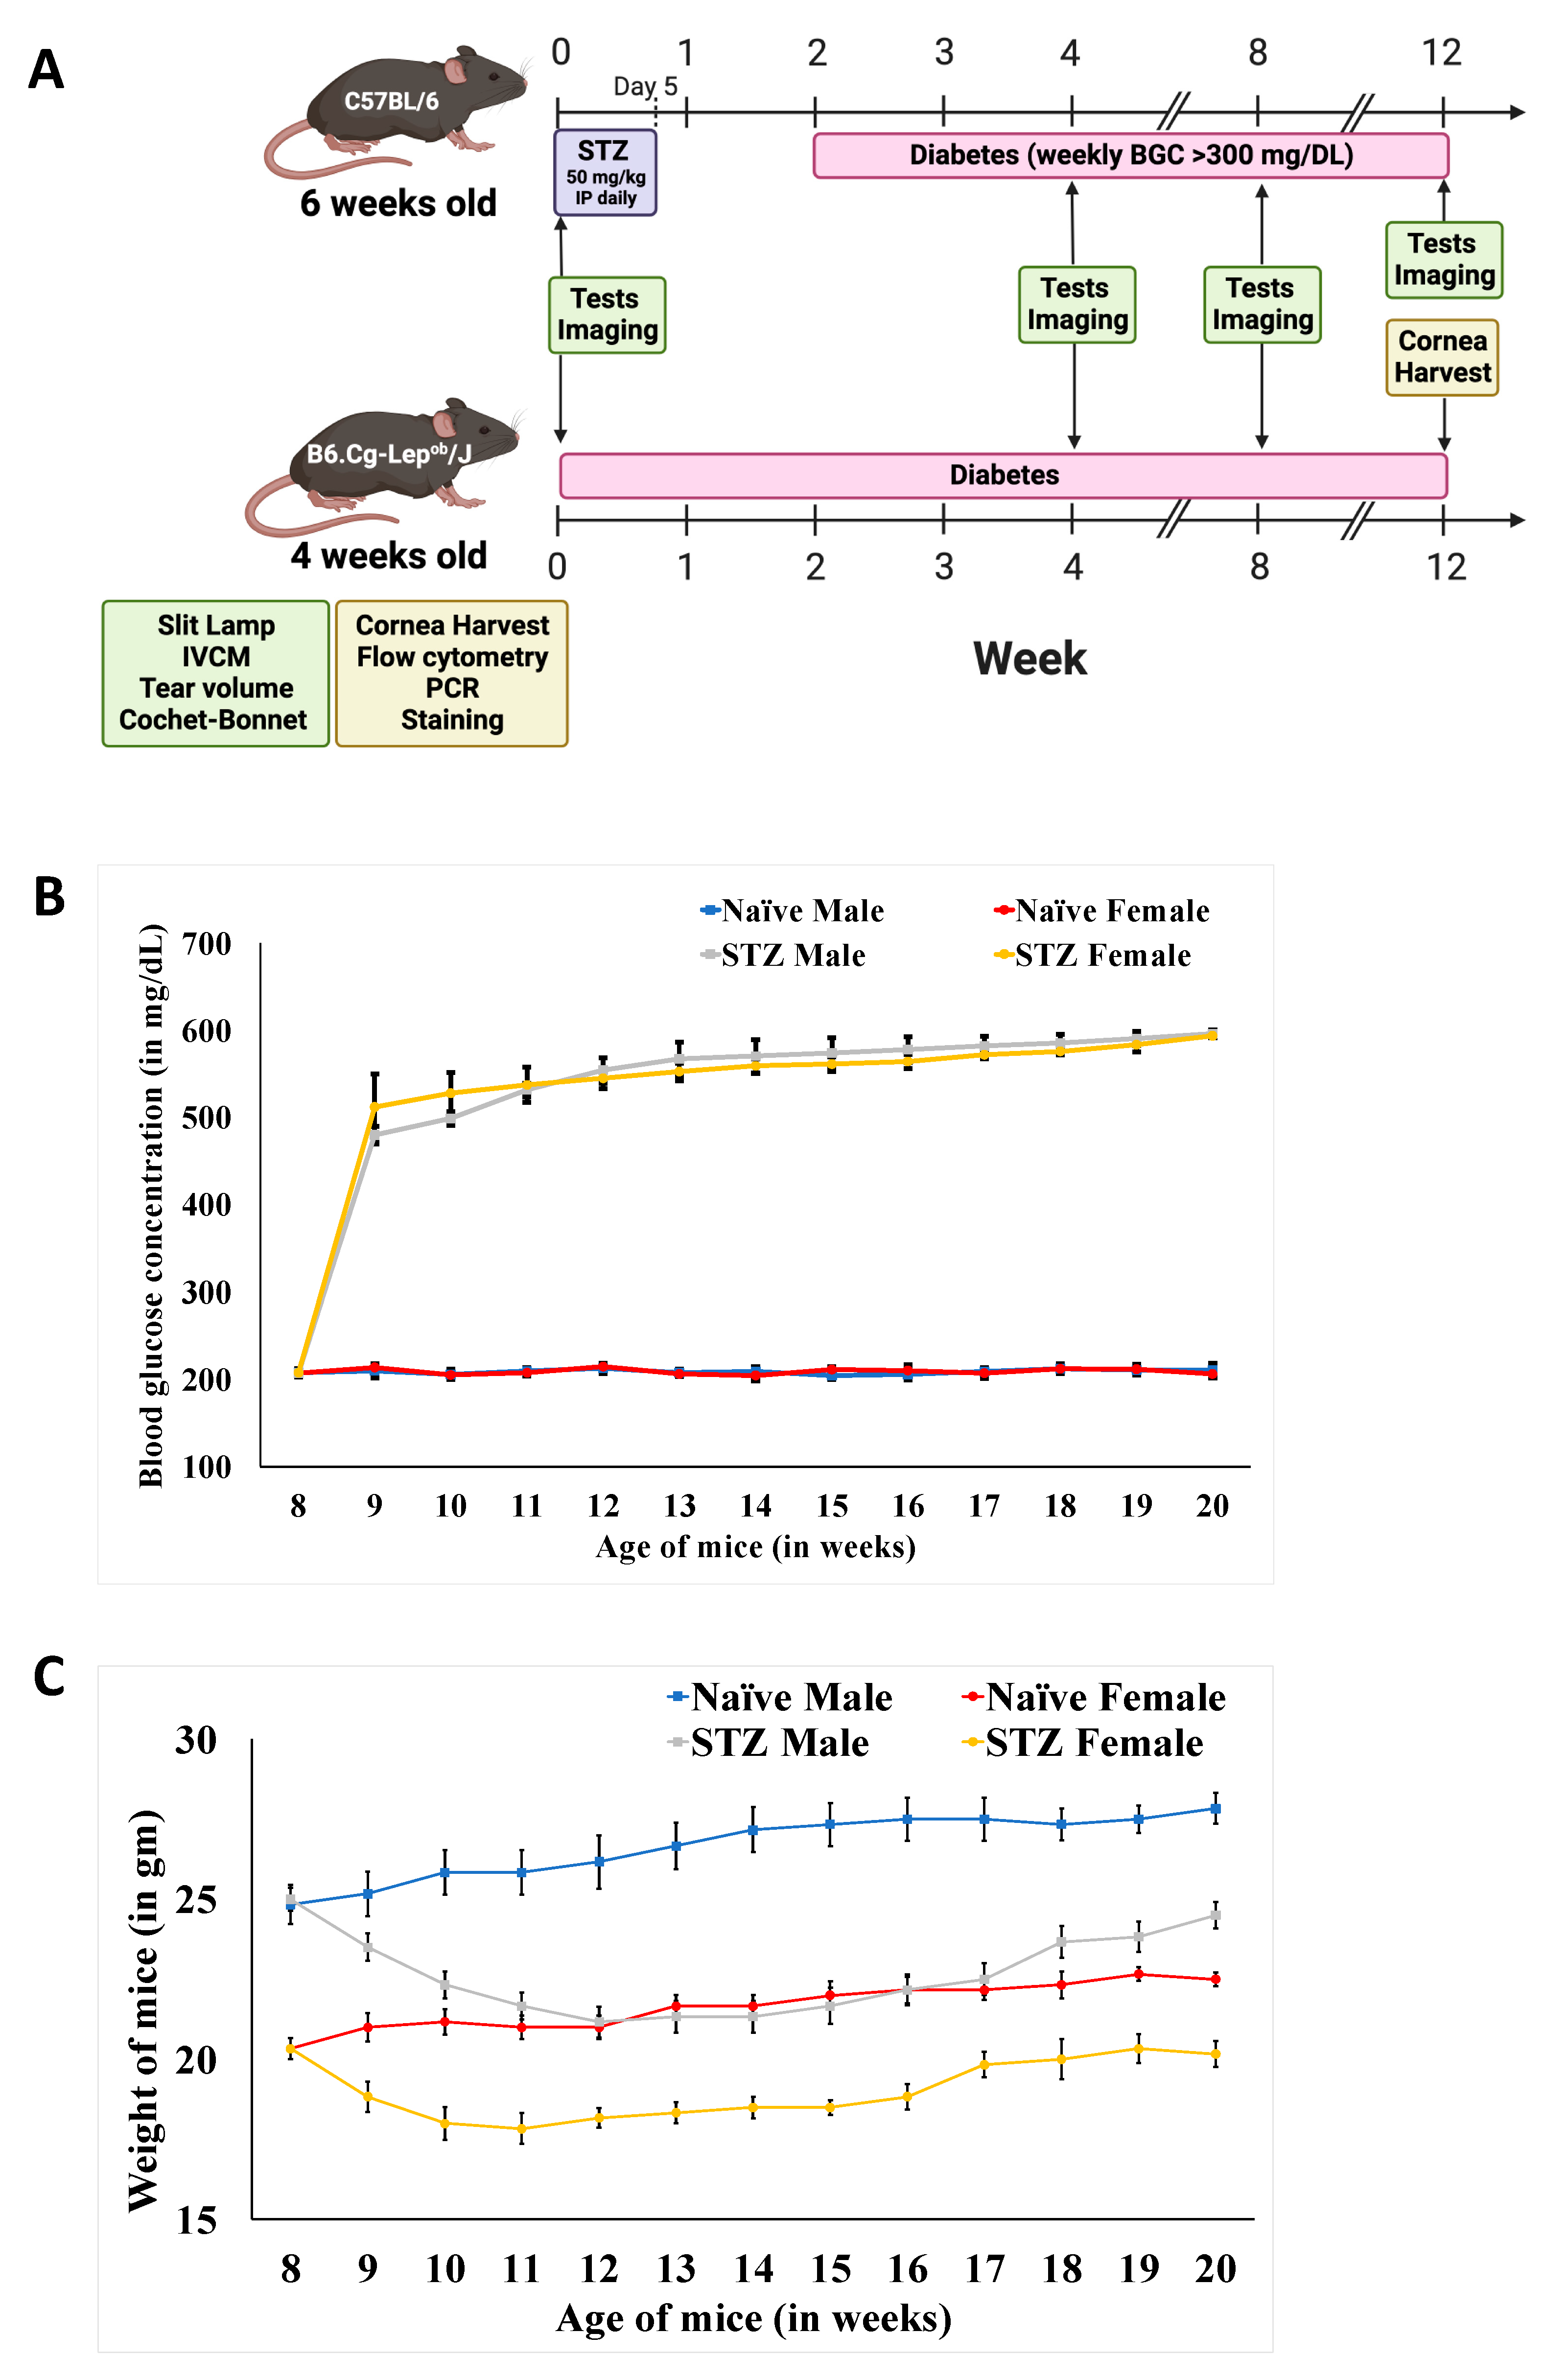
2.1. Animals
2.2. Diabetes Induction and Glycemic Control
2.3. Corneal Single-Cell Suspensions
2.4. Flow Cytometry Analysis
2.5. Cell Sorting
2.6. Polymerase Chain Reaction
2.7. Immunostaining and Confocal Microscopy
2.8. Tear Volume Assessment
2.9. Corneal Sensitivity Assessment
2.10. Corneal Epitheliopathy Assessment
2.11. Optical Coherence Tomography
2.12. In-Vivo Confocal Microscopy
2.13. Statistical Analyses
3. Results
3.1. Weight and Blood Glucose Concentration Changes on Diabetes Induction in Mice
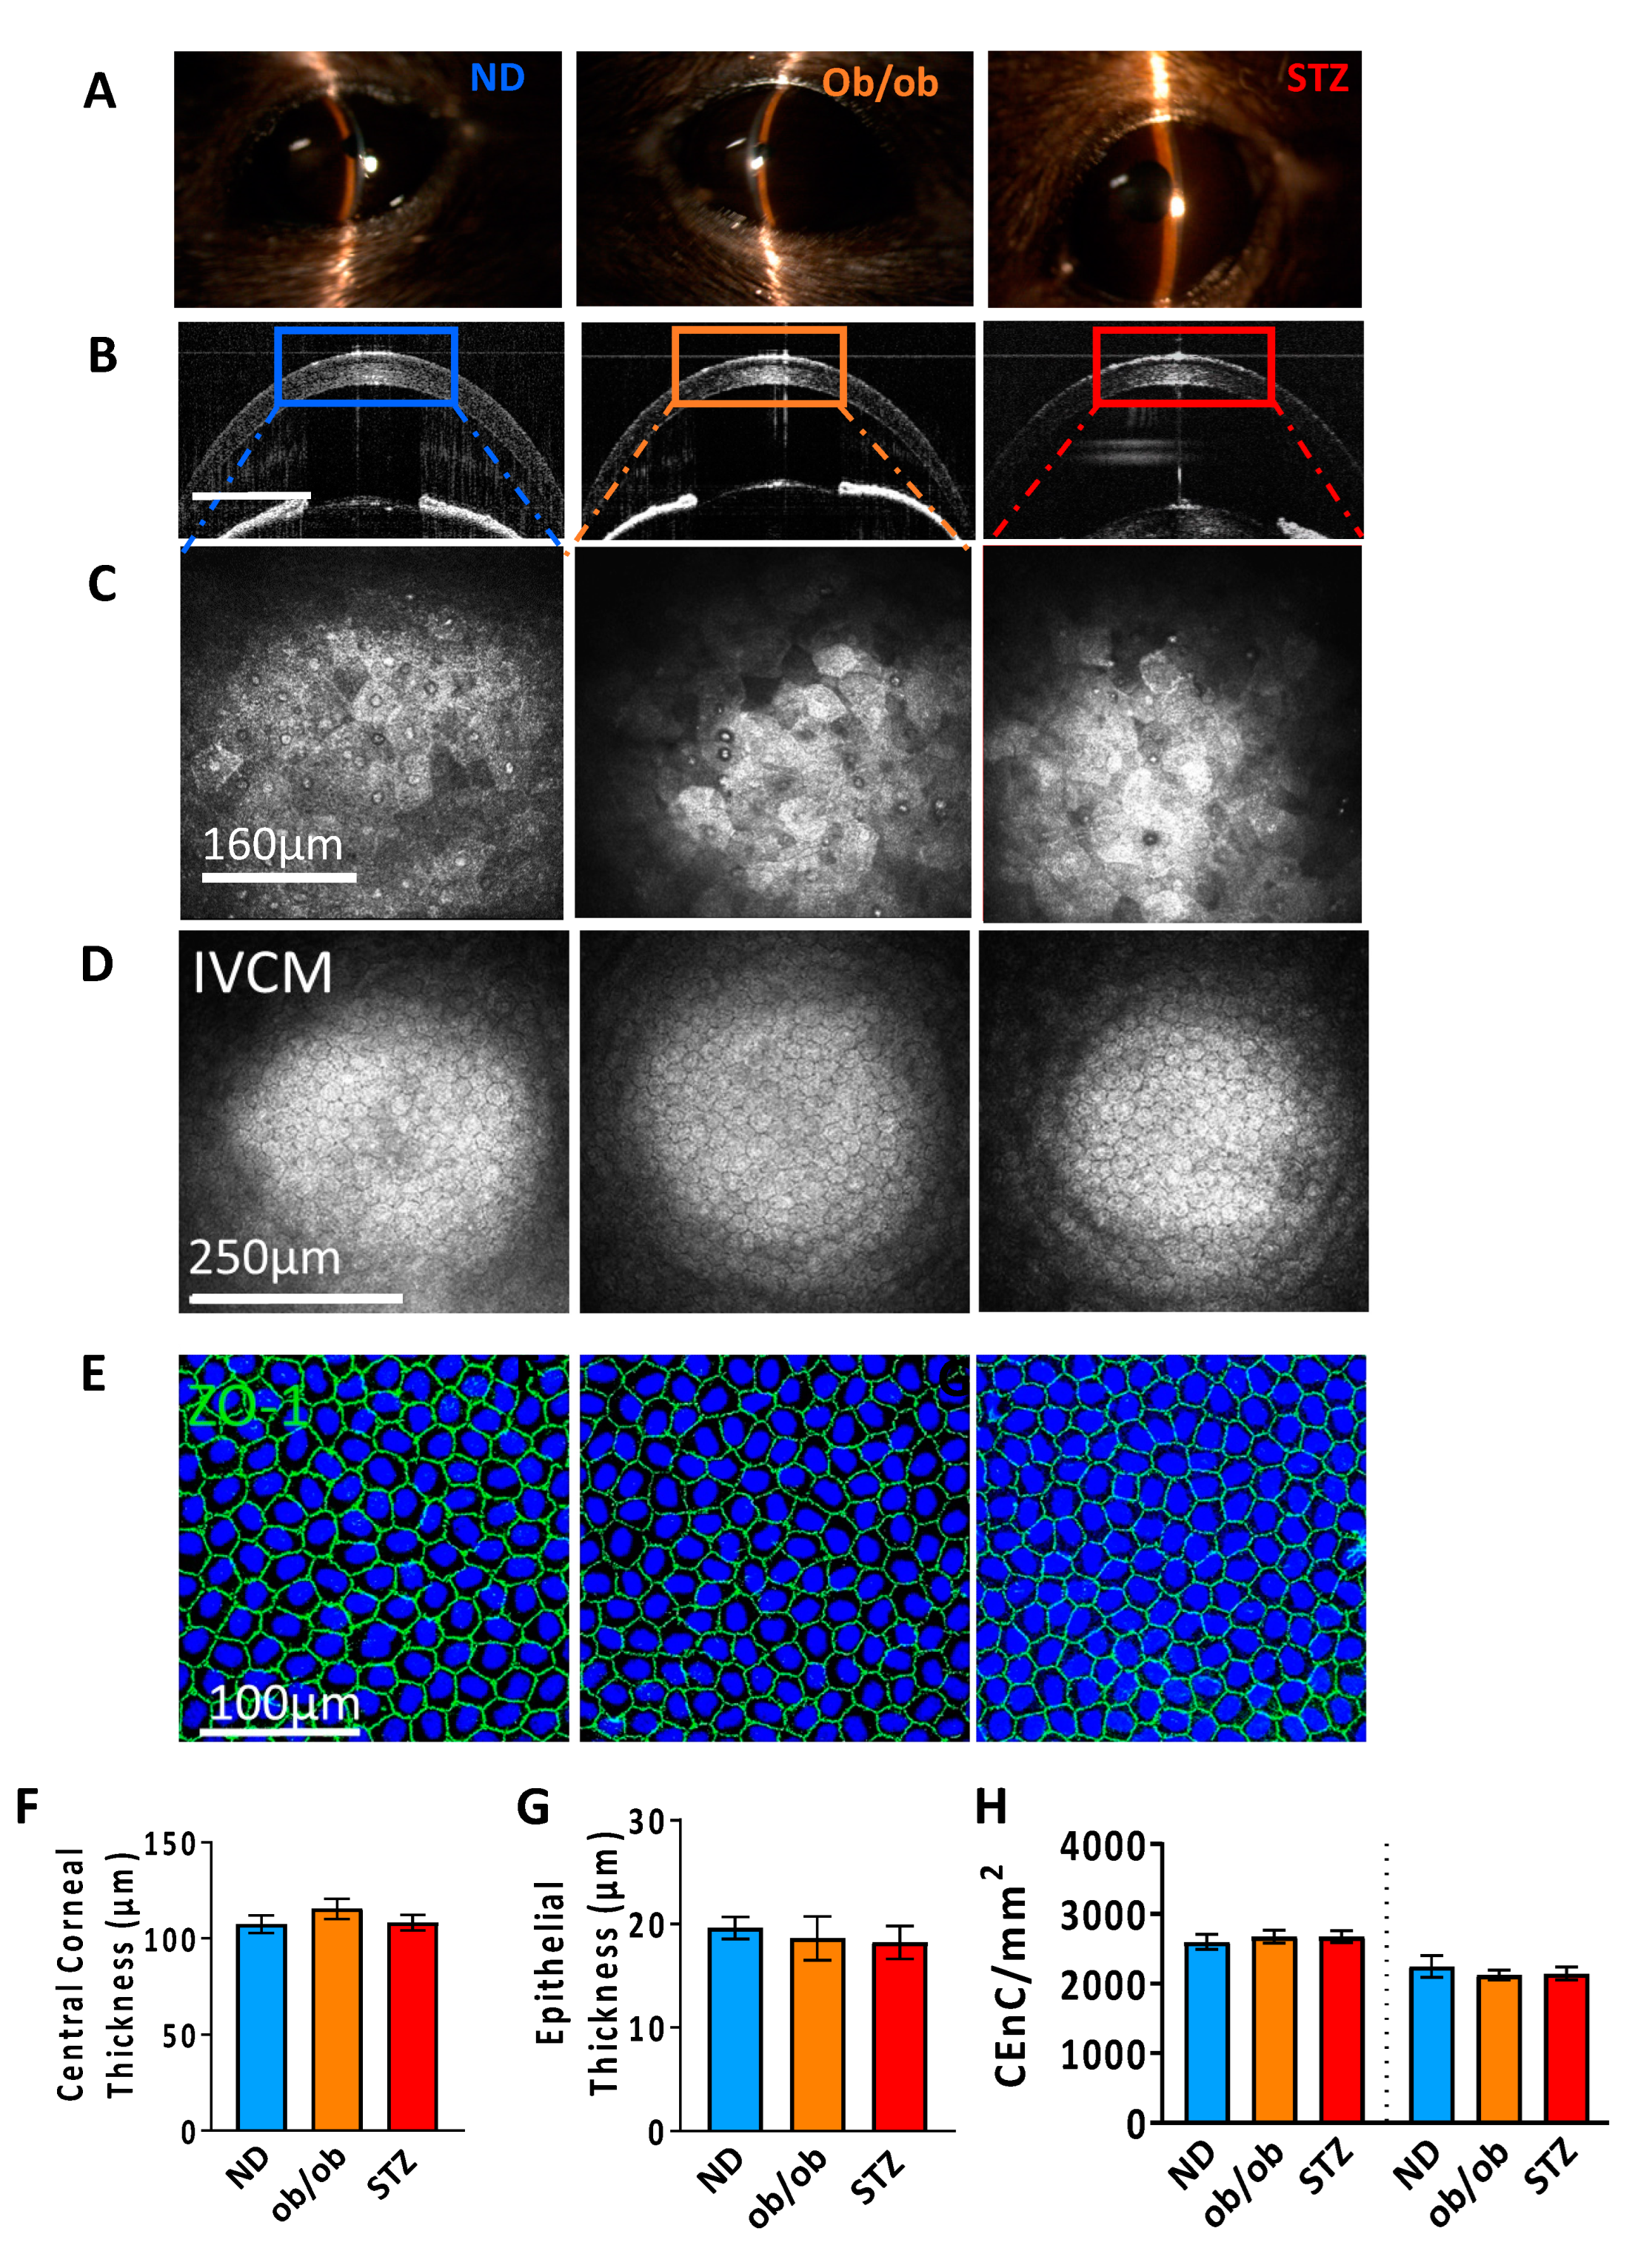
3.2. Impact of Diabetes on the Corneal Anatomy and Cellular Morphology
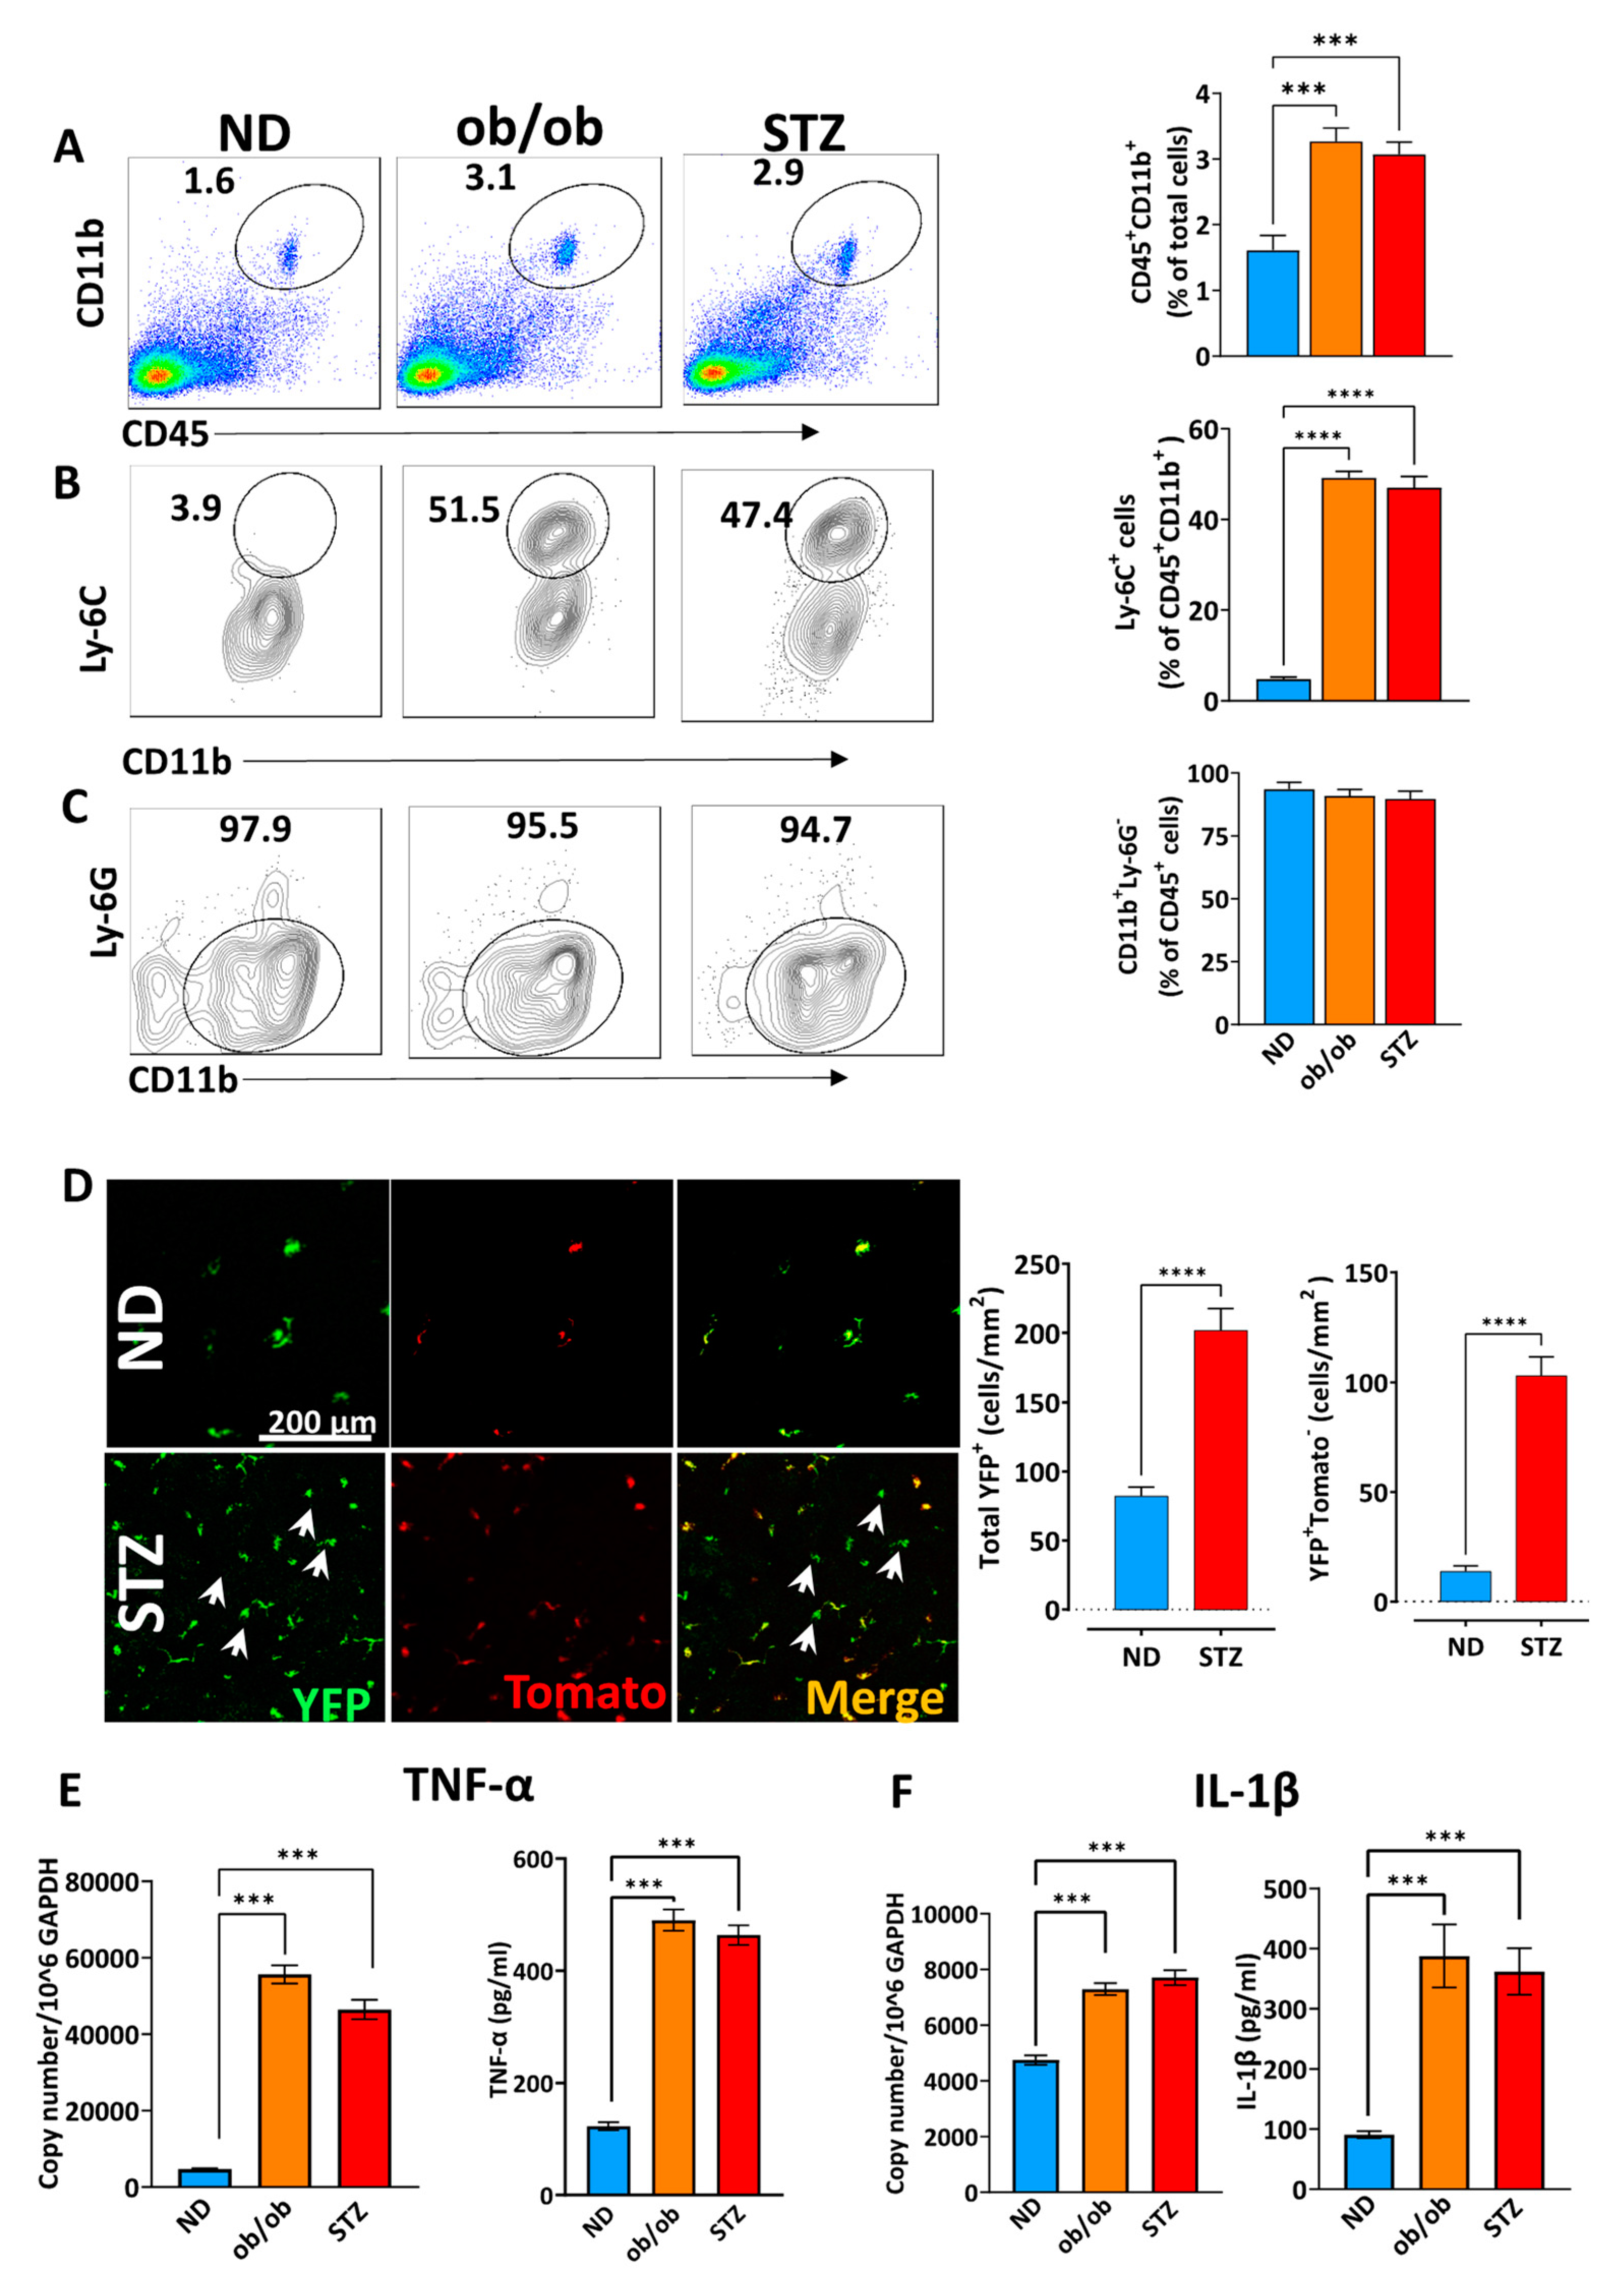
3.3. A Diabetic State Induces Corneal Myeloid Cells to Acquire a Proinflammatory Phenotype in Myeloid Cells
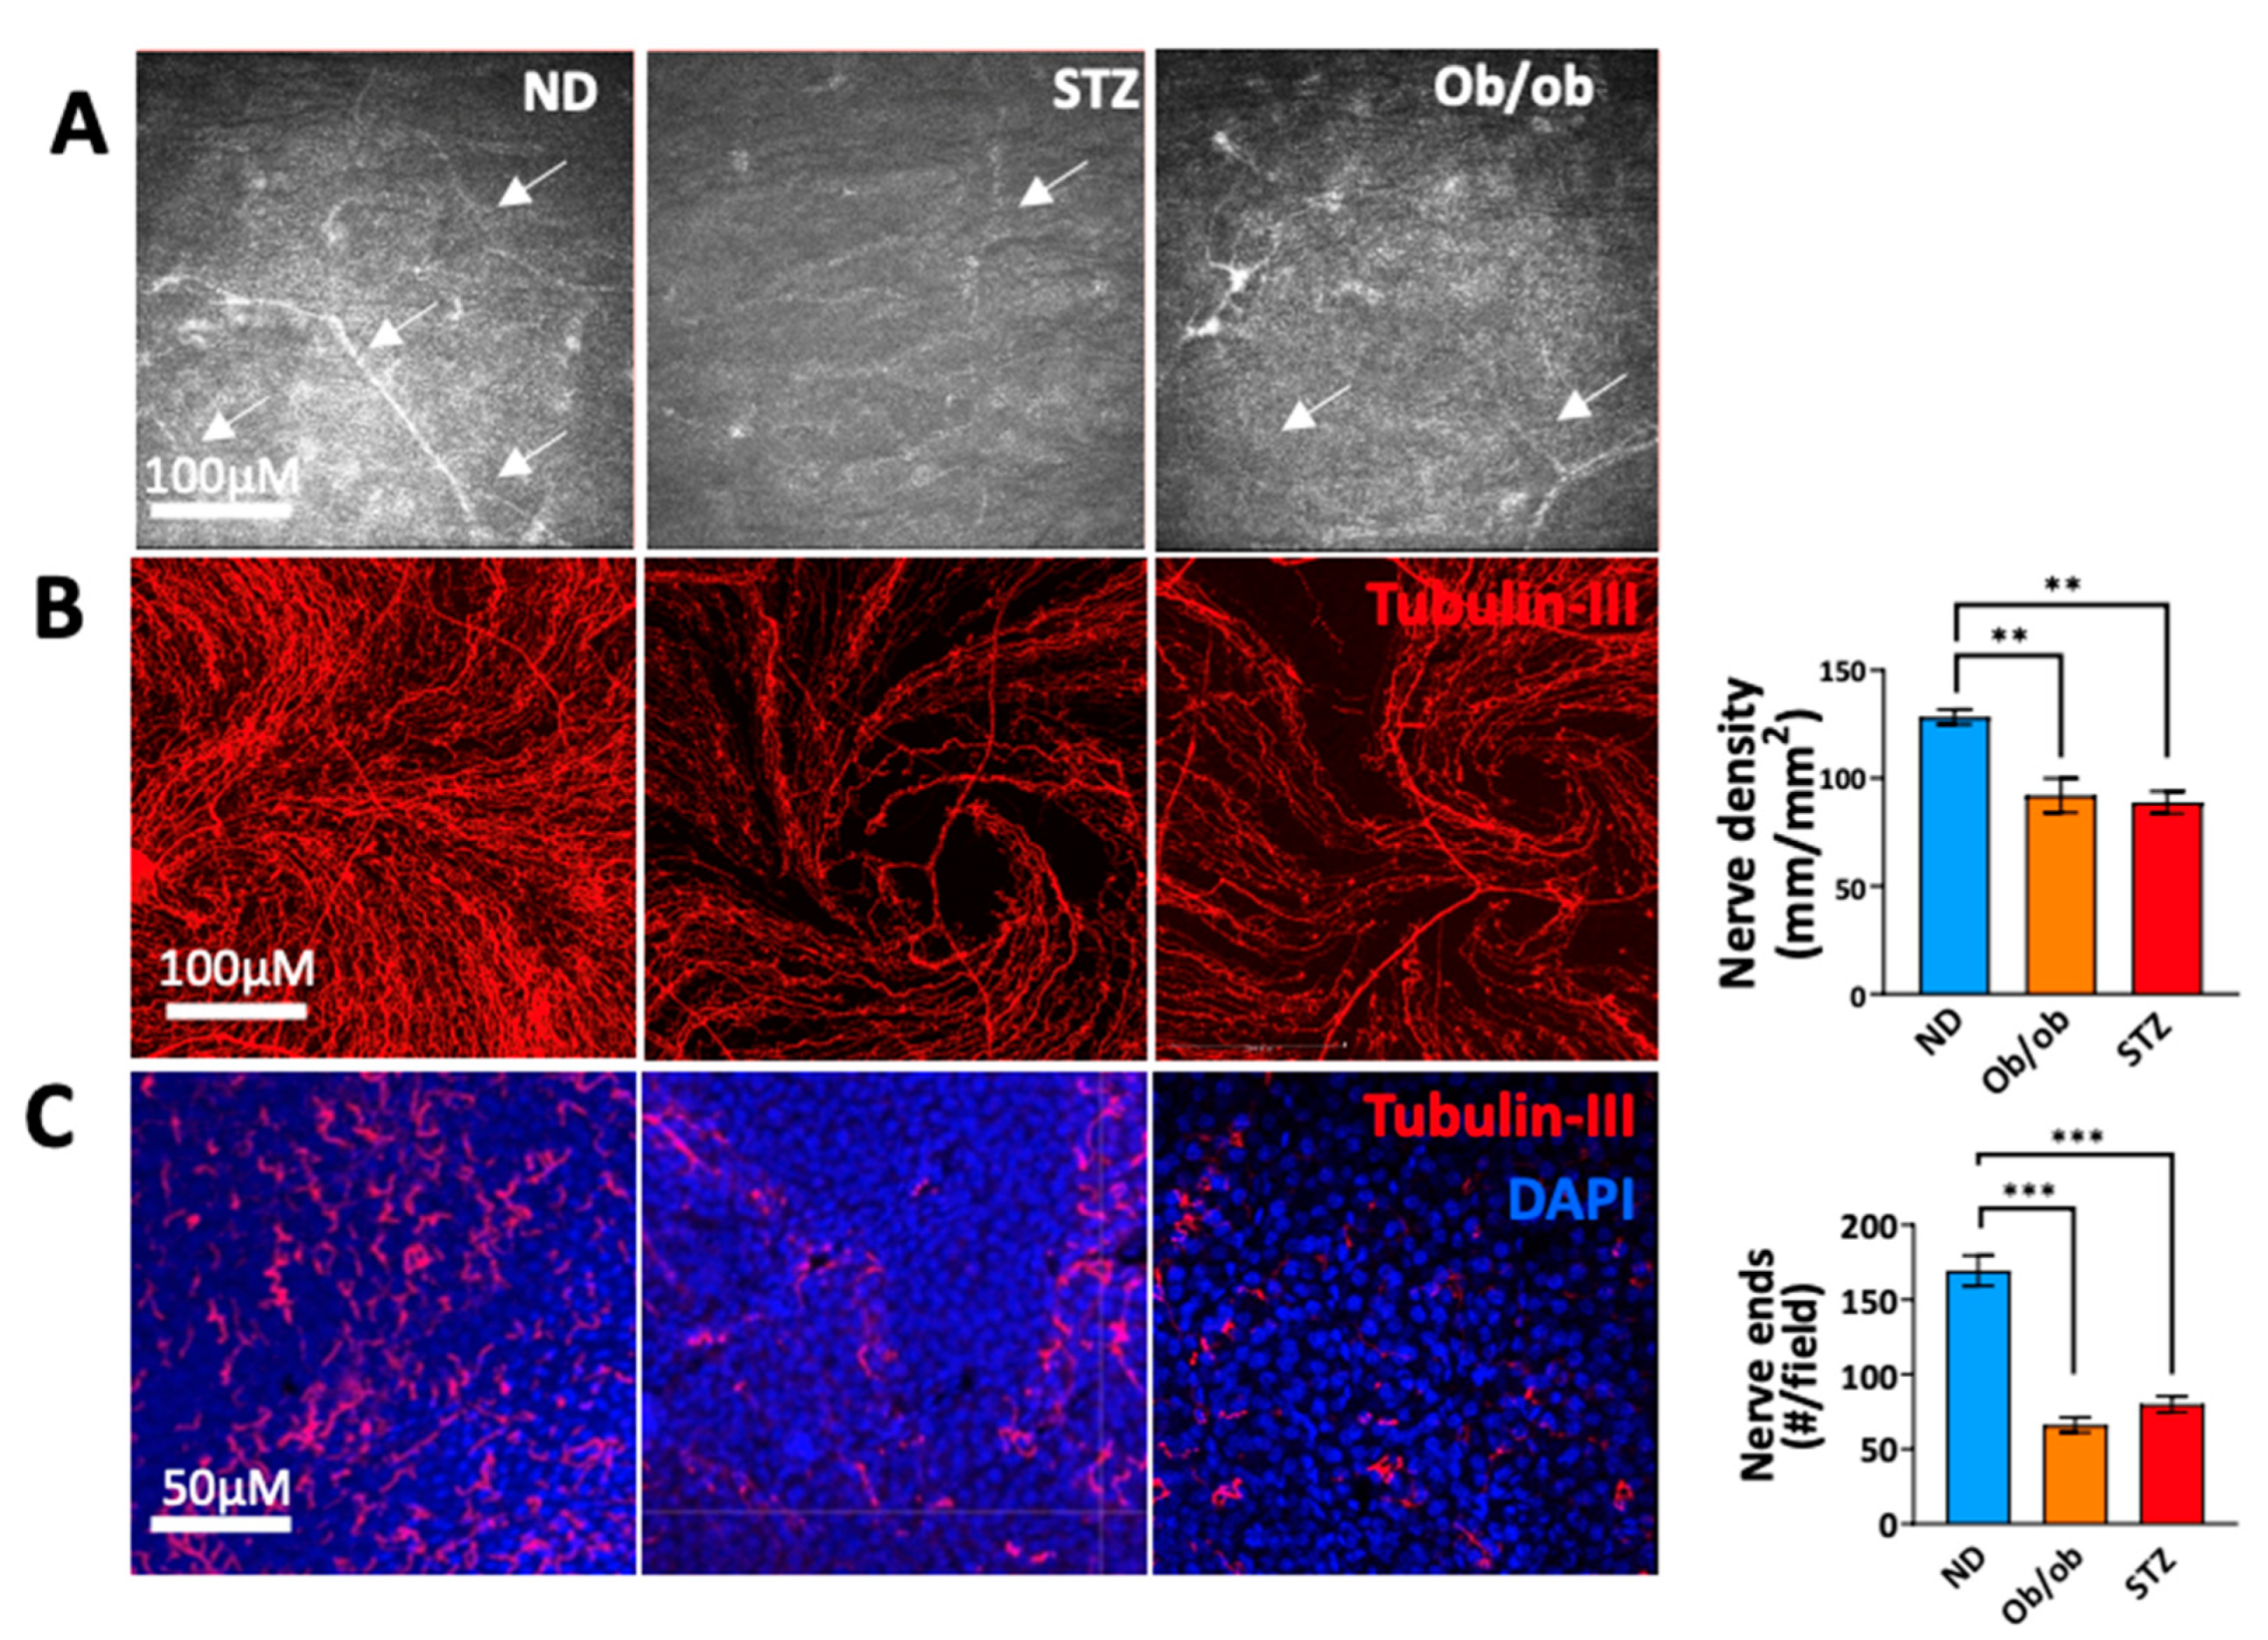
3.4. Diabetic State-Induced Corneal Nerve Damage Is Associated with Long-Term Diabetes
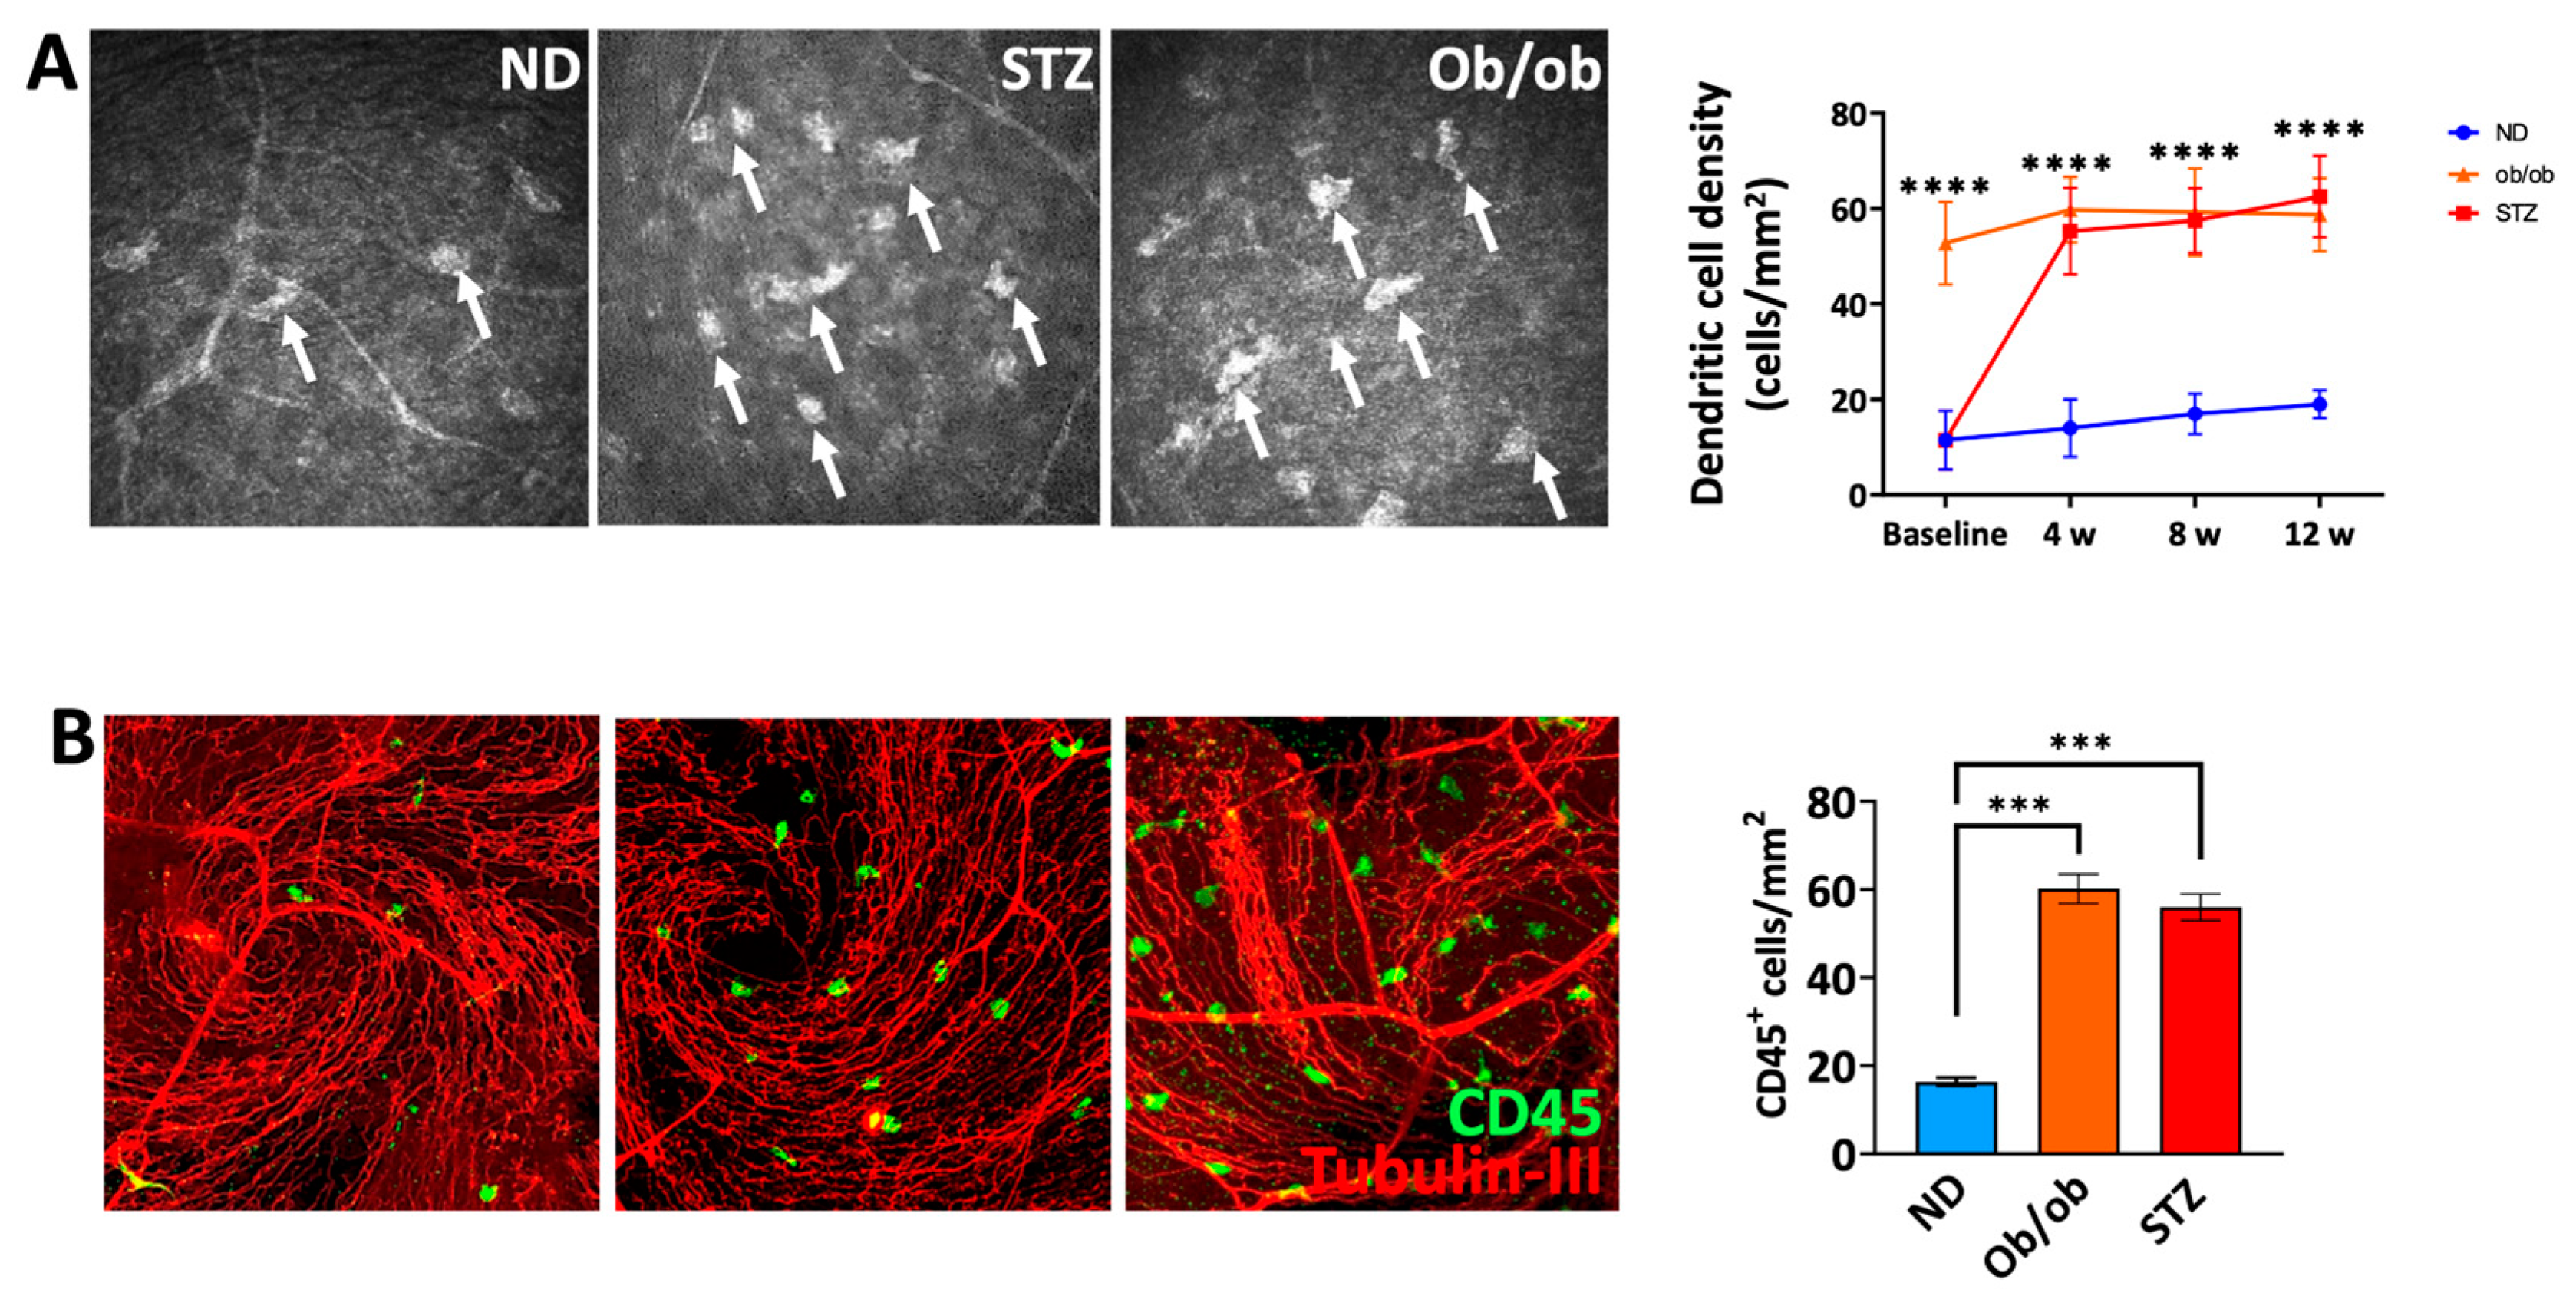
3.5. A Diabetic State Leads to Increased Frequencies of Myeloid Cells in the Proximity of Nerves in the Sub-Basal Plexus
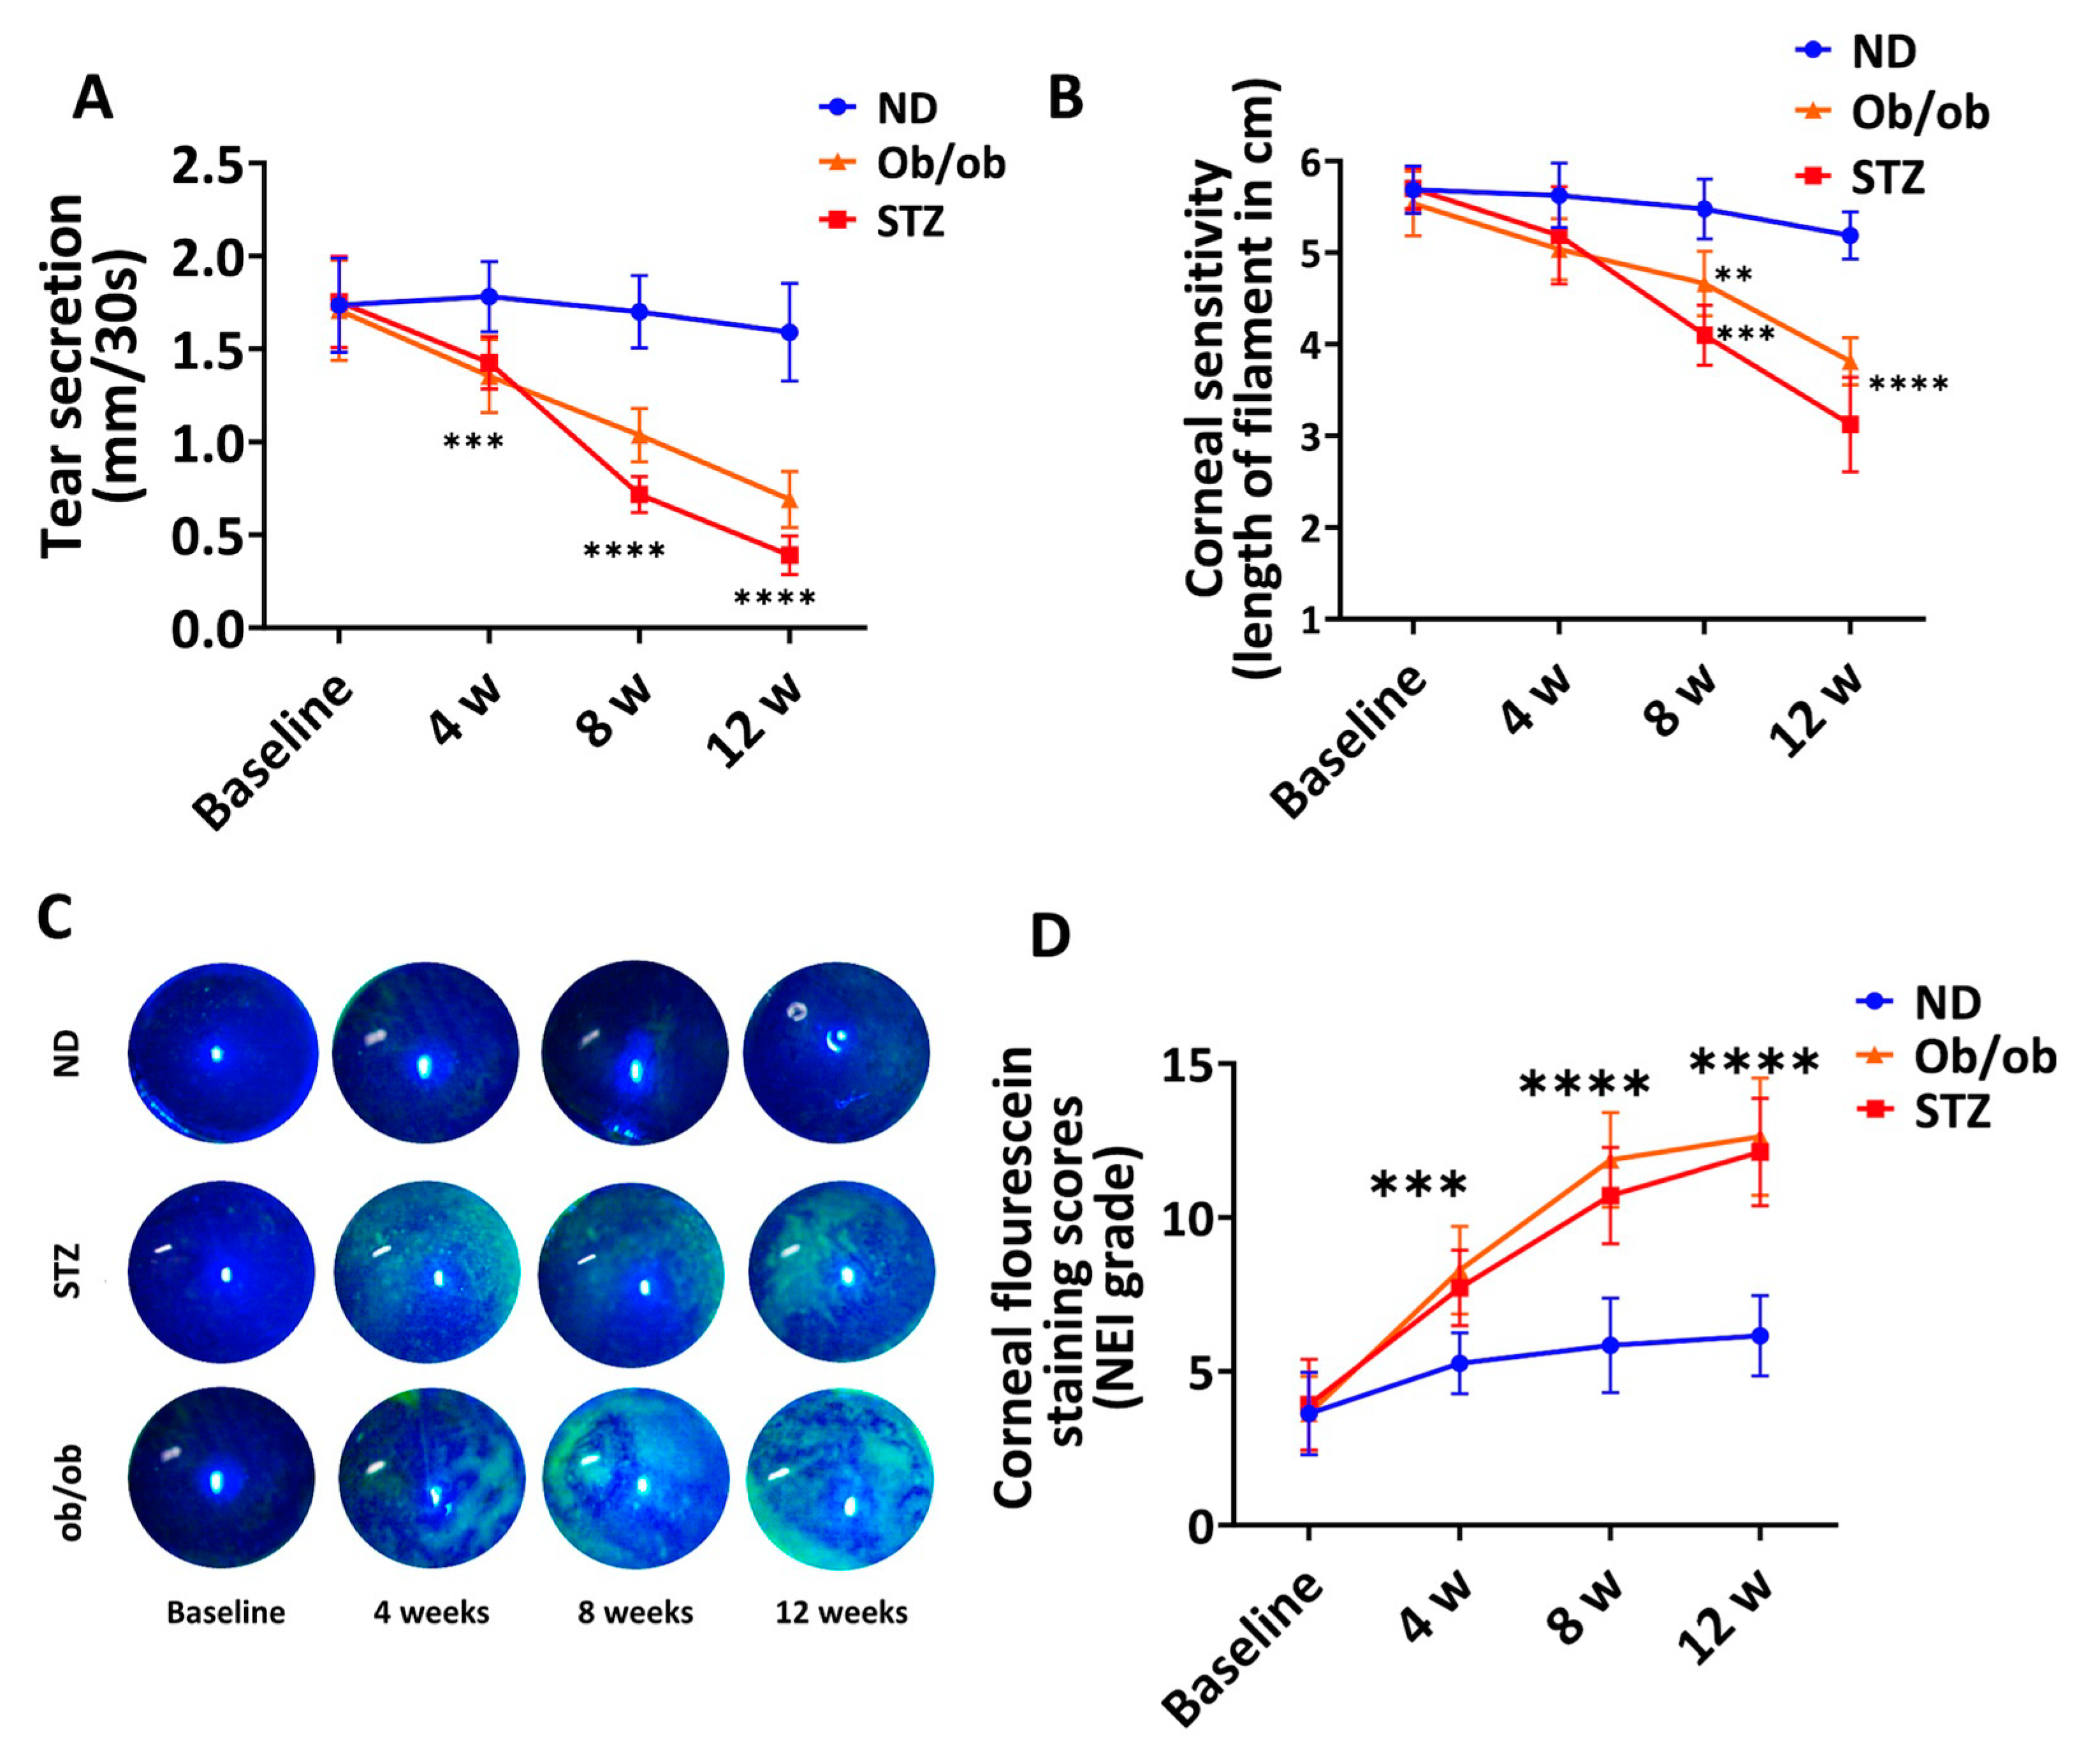
3.6. Diabetic Mice with Long-Term DM Develop Clinical Manifestations of Keratopathy
4. Discussion
5. Conclusions
Supplementary Materials
Author Contributions
Funding
Institutional Review Board Statement
Informed Consent Statement
Data Availability Statement
Conflicts of Interest
References
- Saeedi, P.; Petersohn, I.; Salpea, P.; Malanda, B.; Karuranga, S.; Unwin, N.; Colagiuri, S.; Guariguata, L.; Motala, A.A.; Ogurtsova, K.; et al. Global and Regional Diabetes Prevalence Estimates for 2019 and Projections for 2030 and 2045: Results from the International Diabetes Federation Diabetes Atlas, 9th Edition. Diabetes Res. Clin. Pract. 2019, 157, 107843. [Google Scholar] [CrossRef]
- Sayin, N.; Kara, N.; Pekel, G. Ocular Complications of Diabetes Mellitus. World J. Diabetes 2015, 6, 92–108. [Google Scholar] [CrossRef]
- DeMill, D.L.; Hussain, M.; Pop-Busui, R.; Shtein, R.M. Ocular Surface Disease in Patients with Diabetic Peripheral Neuropathy. Br. J. Ophthalmol. 2016, 100, 924–928. [Google Scholar] [CrossRef] [PubMed]
- Vieira-Potter, V.J.; Karamichos, D.; Lee, D.J. Ocular Complications of Diabetes and Therapeutic Approaches. Biomed. Res. Int. 2016, 2016, 3801570. [Google Scholar] [CrossRef] [PubMed]
- Lutty, G.A. Effects of Diabetes on the Eye. Investig. Ophthalmol. Vis. Sci. 2013, 54, ORSF81–ORSF87. [Google Scholar] [CrossRef] [PubMed]
- Semeraro, F.; Cancarini, A.; Dell’Omo, R.; Rezzola, S.; Romano, M.R.; Costagliola, C. Diabetic Retinopathy: Vascular and Inflammatory Disease. J. Diabetes Res. 2015, 2015, 582060. [Google Scholar] [CrossRef] [PubMed]
- Yu, F.S.; Yin, J.; Lee, P.S.; Hwang, F.S.; McDermott, M. Sensory Nerve Regeneration after Epithelium Wounding in Normal and Diabetic Corneas. Expert. Rev. Ophthalmol. 2015, 10, 383–392. [Google Scholar] [CrossRef] [PubMed]
- Kaji, Y. Prevention of Diabetic Keratopathy. Br. J. Ophthalmol. 2005, 89, 254–255. [Google Scholar] [CrossRef] [PubMed]
- Negi, A.; Stephen, M.; Vernon, A.; Frcophth, D.M. An Overview of the Eye in Diabetes. J. R. Soc. Med. 2003, 96, 266–272. [Google Scholar] [CrossRef] [PubMed]
- Klein, B.E.K.; Klein, R.; Moss, S.E. Incidence of Cataract Surgery in the Wisconsin Epidemiologic Study of Diabetic Retinopathy. Am. J. Ophthalmol. 1995, 119, 295–300. [Google Scholar] [CrossRef]
- Messmer, E.M.; Schmid-Tannwald, C.; Zapp, D.; Kampik, A. In Vivo Confocal Microscopy of Corneal Small Fiber Damage in Diabetes Mellitus. Graefe’s Arch. Clin. Exp. Ophthalmol. 2010, 248, 1307–1312. [Google Scholar] [CrossRef] [PubMed]
- Nitoda, E.; Kallinikos, P.; Pallikaris, A.; Moschandrea, J.; Amoiridis, G.; Ganotakis, E.S.; Tsilimbaris, M. Correlation of Diabetic Retinopathy and Corneal Neuropathy Using Confocal Microscopy. Curr. Eye Res. 2012, 37, 898–906. [Google Scholar] [CrossRef] [PubMed]
- Naik, K.; Magdum, R.; Ahuja, A.; Kaul, S.; Johnson, S.; Mishra, A.; Patil, M.; Dhore, N.; Alapati, A. Ocular Surface Diseases in Patients with Diabetes. Cureus 2022, 14, e23401. [Google Scholar] [CrossRef]
- Zhang, Z.; Zou, X.; Xue, W.; Zhang, P.; Wang, S.; Zou, H. Ocular Surface Microbiota in Diabetic Patients with Dry Eye Disease. Investig. Ophthalmol. Vis. Sci. 2021, 62, 13. [Google Scholar] [CrossRef] [PubMed]
- Bu, Y.; Shih, K.C.; Tong, L. The Ocular Surface and Diabetes, the Other 21st Century Epidemic. Exp. Eye Res. 2022, 220, 109099. [Google Scholar] [CrossRef] [PubMed]
- Di Zazzo, A.; Coassin, M.; Micera, A.; Mori, T.; De Piano, M.; Scartozzi, L.; Sgrulletta, R.; Bonini, S. Ocular Surface Diabetic Disease: A Neurogenic Condition? Ocul. Surf. 2021, 19, 218–223. [Google Scholar] [CrossRef]
- Chopra, V.; Varma, R.; Francis, B.A.; Wu, J.; Torres, M.; Azen, S.P. Type 2 Diabetes Mellitus and the Risk of Open-Angle Glaucoma: The Los Angeles Latino Eye Study. Ophthalmology 2008, 115, 227–232.e1. [Google Scholar] [CrossRef]
- Saw, S.M.; Wong, T.Y.; Ting, S.; Foong, A.W.P.; Foster, P.J. The Relationship Between Anterior Chamber Depth and the Presence of Diabetes in the Tanjong Pagar Survey. Am. J. Ophthalmol. 2007, 144, 325–326. [Google Scholar] [CrossRef]
- Huang, S.P.; Palla, S.; Ruzycki, P.; Varma, R.A.; Harter, T.; Reddy, G.B.; Petrash, J.M. Aldo-Keto Reductases in the Eye. J. Ophthalmol. 2010, 2010, 521204. [Google Scholar] [CrossRef]
- Priyadarsini, S.; Whelchel, A.; Nicholas, S.; Sharif, R.; Riaz, K.; Karamichos, D. Diabetic Keratopathy: Insights and Challenges. Surv. Ophthalmol. 2020, 65, 513. [Google Scholar] [CrossRef]
- Shih, K.C.; Lam, K.L.; Tong, L. A Systematic Review on the Impact of Diabetes Mellitus on the Ocular Surface. Nutr. Diabetes 2017, 7, e251. [Google Scholar] [CrossRef]
- Han, S.B.; Yang, H.K.; Hyon, J.Y. Influence of Diabetes Mellitus on Anterior Segment of the Eye. Clin. Interv. Aging 2019, 14, 53–63. [Google Scholar] [CrossRef]
- Sellers, E.A.C.; Clark, I.; Tavakoli, M.; Dean, H.J.; McGavock, J.; Malik, R.A. The Acceptability and Feasibility of Corneal Confocal Microscopy to Detect Early Diabetic Neuropathy in Children: A Pilot Study. Diabet. Med. 2013, 30, 630–631. [Google Scholar] [CrossRef]
- Barsegian, A.; Lee, J.; Salifu, M.O.; Mcfarlane, S.I. Corneal Neuropathy: An Underrated Manifestation of Diabetes Mellitus. J. Clin. Endocrinol. Diabetes 2018, 2018, JCED-111. [Google Scholar] [CrossRef]
- NaPier, E.; Camacho, M.; McDevitt, T.F.; Sweeney, A.R. Neurotrophic Keratopathy: Current Challenges and Future Prospects. Ann. Med. 2022, 54, 666. [Google Scholar] [CrossRef] [PubMed]
- Zhou, Q.; Yang, L.; Wang, Q.; Li, Y.; Wei, C.; Xie, L. Mechanistic Investigations of Diabetic Ocular Surface Diseases. Front. Endocrinol. 2022, 13, 1079541. [Google Scholar] [CrossRef] [PubMed]
- Ljubimov, A.V. Diabetic Complications in the Cornea. Vis. Res. 2017, 139, 138. [Google Scholar] [CrossRef]
- Hamrah, P.; Liu, Y.; Zhang, Q.; Dana, M.R. The Corneal Stroma Is Endowed with a Significant Number of Resident Dendritic Cells. Investig. Ophthalmol. Vis. Sci. 2003, 44, 581–589. [Google Scholar] [CrossRef]
- Hamrah, P.; Liu, Y.; Zhang, Q.; Dana, M.R. Alterations in Corneal Stromal Dendritic Cell Phenotype and Distribution in Inflammation. Arch. Ophthalmol. 2003, 121, 1132–1140. [Google Scholar] [CrossRef]
- Hamrah, P.; Zhang, Q.; Liu, Y.; Dana, M.R. Novel Characterization of MHC Class II-Negative Population of Resident Corneal Langerhans Cell-Type Dendritic Cells. Investig. Ophthalmol. Vis. Sci. 2002, 43, 639–646. [Google Scholar]
- Amouzegar, A.; Chauhan, S.K.; Dana, R. Alloimmunity and Tolerance in Corneal Transplantation. J. Immunol. 2016, 196, 3983–3991. [Google Scholar] [CrossRef]
- Huq, S.; Liu, Y.; Benichou, G.; Dana, M.R. Relevance of the Direct Pathway of Sensitization in Corneal Transplantation Is Dictated by the Graft Bed Microenvironment. J. Immunol. 2004, 173, 4464–4469. [Google Scholar] [CrossRef]
- Blanco, T.; Musayeva, A.; Singh, R.B.; Nakagawa, H.; Lee, S.; Alemi, H.; Gonzalez-Nolasco, B.; Ortiz, G.; Wang, S.; Kahale, F.; et al. The Impact of Donor Diabetes on Corneal Transplant Immunity. Am. J. Transplant. 2023, 23, 1345–1358. [Google Scholar] [CrossRef]
- Leppin, K.; Behrendt, A.K.; Reichard, M.; Stachs, O.; Guthoff, R.F.; Baltrusch, S.; Eule, J.C.; Vollmar, B. Diabetes Mellitus Leads to Accumulation of Dendritic Cells and Nerve Fiber Damage of the Subbasal Nerve Plexus in the Cornea. Investig. Ophthalmol. Vis. Sci. 2014, 55, 3603–3615. [Google Scholar] [CrossRef]
- 000632-B6 Ob Strain Details. Available online: https://www.jax.org/strain/000632 (accessed on 7 December 2023).
- De Silva, M.E.H.; Hill, L.J.; Downie, L.E.; Chinnery, H.R. The Effects of Aging on Corneal and Ocular Surface Homeostasis in Mice. Investig. Ophthalmol. Vis. Sci. 2019, 60, 2705–2715. [Google Scholar] [CrossRef]
- Stepp, M.A.; Pal-Ghosh, S.; Tadvalkar, G.; Williams, A.; Pflugfelder, S.C.; de Paiva, C.S. Reduced Intraepithelial Corneal Nerve Density and Sensitivity Accompany Desiccating Stress and Aging in C57BL/6 Mice. Exp. Eye Res. 2018, 169, 91–98. [Google Scholar] [CrossRef] [PubMed]
- Alemi, H.; Dehghani, S.; Forouzanfar, K.; Surico, P.L.; Narimatsu, A.; Musayeva, A.; Sharifi, S.; Wang, S.; Dohlman, T.H.; Yin, J.; et al. Insights into Mustard Gas Keratopathy- Characterizing Corneal Layer-Specific Changes in Mice Exposed to Nitrogen Mustard. Exp. Eye Res. 2023, 236, 109657. [Google Scholar] [CrossRef] [PubMed]
- Alemi, H.; Wang, S.; Blanco, T.; Kahale, F.; Singh, R.B.; Ortiz, G.; Musayeva, A.; Yuksel, E.; Pang, K.; Deshpande, N.; et al. The Neuropeptide α-Melanocyte–Stimulating Hormone Prevents Persistent Corneal Edema Following Injury. Am. J. Pathol. 2023, 194, 150–164. [Google Scholar] [CrossRef] [PubMed]
- Blanco-Mezquita, J.T.; Hutcheon, A.E.K.; Zieske, J.D. Role of Thrombospondin-1 in Repair of Penetrating Corneal Wounds. Investig. Ophthalmol. Vis. Sci. 2013, 54, 6262–6268. [Google Scholar] [CrossRef] [PubMed]
- Tatematsu, Y.; Khan, Q.; Blanco, T.; Bair, J.A.; Hodges, R.R.; Masli, S.; Dartt, D.A. Thrombospondin-1 Is Necessary for the Development and Repair of Corneal Nerves. Int. J. Mol. Sci. 2018, 10, 3191. [Google Scholar] [CrossRef] [PubMed]
- Saadane Id, A.; Lessieur, E.M.; Du, Y.; Liu, H.; Kern, T.S. Successful Induction of Diabetes in Mice Demonstrates No Gender Difference in Development of Early Diabetic Retinopathy. PLoS ONE 2020, 15, e0238727. [Google Scholar] [CrossRef]
- Available online: https://Jackson.Jax.Org/Rs/444-BUH-304/Images/632%20Physiological%20Data%20Summary.Pdf (accessed on 12 November 2023).
- Liu, Y.; Hamrah, P.; Zhang, Q.; Taylor, A.W.; Reza Dana, M. Draining Lymph Nodes of Corneal Transplant Hosts Exhibit Evidence for Donor Major Histocompatibility Complex (MHC) Class II-Positive Dendritic Cells Derived from MHC Class II-Negative Grafts. J. Exp. Med. 2002, 195, 259–268. [Google Scholar] [CrossRef]
- Wu, M.; Hill, L.J.; Downie, L.E.; Chinnery, H.R. Neuroimmune Crosstalk in the Cornea: The Role of Immune Cells in Corneal Nerve Maintenance during Homeostasis and Inflammation. Prog. Retin. Eye Res. 2022, 91, 101105. [Google Scholar] [CrossRef]
- Jiao, H.; Lim, A.S.; Fazio Coles, T.E.; McQuade, R.M.; Furness, J.B.; Chinnery, H.R. The Effect of High-Fat Diet-Induced Metabolic Disturbance on Corneal Neuroimmune Features. Exp. Eye Res. 2020, 201, 108298. [Google Scholar] [CrossRef]
- Blanco, T.; Saban, D.R. The Cornea Has “the Nerve” to Encourage Immune Rejection. Am. J. Transplant. 2015, 15, 1453–1454. [Google Scholar] [CrossRef]
- Krishna Kolluru, G.; Bir, S.C.; Kevil, C.G.; Calvert, J.W. Endothelial Dysfunction and Diabetes: Effects on Angiogenesis, Vascular Remodeling, and Wound Healing. Int. J. Vasc. Med. 2012, 2012, 30. [Google Scholar] [CrossRef]
- Frutos-rincón, L.; Gómez-sánchez, J.A.; Íñigo-Portugués, A.; Carmen Acosta, M.; Gallar, J. An Experimental Model of Neuro–Immune Interactions in the Eye: Corneal Sensory Nerves and Resident Dendritic Cells. Int. J. Mol. Sci. 2022, 23, 2997. [Google Scholar] [CrossRef]
- Joshi, N.; Pohlmeier, L.; Ben-Yehuda Greenwald, M.; Haertel, E.; Hiebert, P.; Kopf, M.; Werner, S. Comprehensive Characterization of Myeloid Cells during Wound Healing in Healthy and Healing-Impaired Diabetic Mice. Eur. J. Immunol. 2020, 50, 1335–1349. [Google Scholar] [CrossRef]
- Kim, J.; Kim, C.S.; Sohn, E.; Jeong, I.H.; Kim, H.; Kim, J.S. Involvement of Advanced Glycation End Products, Oxidative Stress and Nuclear Factor-KappaB in the Development of Diabetic Keratopathy. Graefe’s Arch. Clin. Exp. Ophthalmol. 2011, 249, 529–536. [Google Scholar] [CrossRef]
- Alves, M.; Cunha, D.A.; Calegari, V.C.; Saad, M.J.A.; Boschero, A.C.; Velloso, L.A.; Rocha, E.M. Nuclear Factor-KappaB and Advanced Glycation End-Products Expression in Lacrimal Glands of Aging Rats. J. Endocrinol. 2005, 187, 159–166. [Google Scholar] [CrossRef]
- Lan, W.; Petznick, A.; Heryati, S.; Rifada, M.; Tong, L. Nuclear Factor-ΚB: Central Regulator in Ocular Surface Inflammation and Diseases. Ocul. Surf. 2012, 10, 137–148. [Google Scholar] [CrossRef]
- Yan, C.; Gao, N.; Sun, H.; Yin, J.; Lee, P.; Zhou, L.; Fan, X.; Yu, F.-S. Targeting Imbalance between IL-1b and IL-1 Receptor Antagonist Ameliorates Delayed Epithelium Wound Healing in Diabetic Mouse Corneas. Am. J. Pathol. 2016, 186, 1466–1480. [Google Scholar] [CrossRef] [PubMed]
- Di Zazzo, A.; Coassin, M.; Surico, P.L.; Bonini, S. Age-Related Ocular Surface Failure: A Narrative Review. Exp. Eye Res. 2022, 219, 109035. [Google Scholar] [CrossRef]
- Asiedu, K.; Markoulli, M.; Tummanapalli, S.S.; Chiang, J.C.B.; Alotaibi, S.; Wang, L.L.; Dhanapalaratnam, R.; Kwai, N.; Poynten, A.; Krishnan, A.V. Impact of Chronic Kidney Disease on Corneal Neuroimmune Features in Type 2 Diabetes. J. Clin. Med. 2023, 12, 16. [Google Scholar] [CrossRef]
- Zhao, L.; Li, Y.; Lv, Q.; Wang, M.; Luan, Y.; Song, J.; Fu, G.; Ge, J.; Zou, Y.; Zhang, W. Insulin-Attenuated Inflammatory Response of Dendritic Cells in Diabetes by Regulating RAGE-PKC β 1-IRS1-NF- κ B Signal Pathway: A Study on the Anti-Inflammatory Mechanism of Insulin in Diabetes. J. Diabetes Res. 2020, 2020, 1596357. [Google Scholar] [CrossRef]
- Gao, N.; Yan, C.; Lee, P.; Sun, H.; Yu, F.-S.S. Dendritic Cell Dysfunction and Diabetic Sensory Neuropathy in the Cornea. J. Clin. Investig. 2016, 126, 1998–2011. [Google Scholar] [CrossRef] [PubMed]
- Rees, D.A.; Alcolado, J.C. Animal Models of Diabetes Mellitus. Diabet. Med. 2005, 22, 359–370. [Google Scholar] [CrossRef] [PubMed]
- King, A.J.F. The Use of Animal Models in Diabetes Research. Br. J. Pharmacol. 2012, 166, 877–894. [Google Scholar] [CrossRef]
- Mendez, J.D.; Ramos, H.G. Animal Models in Diabetes Research. Arch. Med. Res. 1994, 25, 367–375. [Google Scholar]
- Chatzigeorgiou, A.; Halapas, A.; Kalafatakis, K.; Kamper, E. The Use of Animal Models in the Study of Diabetes Mellitus. In Vivo 2009, 23, 245–258. [Google Scholar]
- Kleinert, M.; Clemmensen, C.; Hofmann, S.M.; Moore, M.C.; Renner, S.; Woods, S.C.; Huypens, P.; Beckers, J.; De Angelis, M.H.; Schürmann, A.; et al. Animal Models of Obesity and Diabetes Mellitus. Nat. Rev. Endocrinol. 2018, 14, 140–162. [Google Scholar] [CrossRef] [PubMed]
- Center for Disease Control and Prevention. National Diabetes Statistics Report; Center for Disease Control and Prevention: Atlanta, GA, USA, 2022. [Google Scholar]
- Wang, S.; Lai, X.; Deng, Y.; Song, Y. Correlation between Mouse Age and Human Age in Anti-Tumor Research: Significance and Method Establishment. Life Sci. 2019, 242, 117242. [Google Scholar] [CrossRef] [PubMed]
- Harris, M.I.; Klein, R.; Welborn, T.A.; Knuiman, M.W. Onset of NIDDM Occurs at Least 4–7 Yr before Clinical Diagnosis. Diabetes Care 1992, 15, 815–819. [Google Scholar] [CrossRef] [PubMed]
- Porta, M.; Curletto, G.; Cipullo, D.; De la Longrais, R.R.; Trento, M.; Passera, P.; Taulaigo, A.V.; Di Miceli, S.; Cenci, A.; Dalmasso, P.; et al. Estimating the Delay between Onset and Diagnosis of Type 2 Diabetes from the Time Course of Retinopathy Prevalence. Diabetes Care 2014, 37, 1668–1674. [Google Scholar] [CrossRef] [PubMed]
- Liu, G.; Chen, L.; Cai, Q.; Wu, H.; Chen, Z.; Zhang, X.; Lu, P. Streptozotocin-induced Diabetic Mice Exhibit Reduced Experimental Choroidal Neovascularization but Not Corneal Neovascularization. Mol. Med. Rep. 2018, 18, 4388–4398. [Google Scholar] [CrossRef]
- Sun, N.; Yang, G.; Zhao, H.; Savelkoul, H.F.J.; An, L. Multidose Streptozotocin Induction of Diabetes in BALB/c Mice Induces a Dominant Oxidative Macrophage and a Conversion of TH1 to T H2 Phenotypes during Disease Progression. Mediat. Inflamm. 2005, 2005, 202–209. [Google Scholar] [CrossRef] [PubMed]
- Neto, A.F.; Dell’Armelina Rocha, P.R.; Perez, E.C.; Xavier, J.G.; Peres, G.B.; Spadacci-Morena, D.D.; Alvares-Saraiva, A.M.; Lallo, M.A. Diabetes Mellitus Increases the Susceptibility to Encephalitozoonosis in Mice. PLoS ONE 2017, 12, e0186954. [Google Scholar] [CrossRef]
- Wang, H.; Li, H.; Jiang, X.; Shi, W.; Shen, Z.; Li, M. Hepcidin Is Directly Regulated by Insulin and Plays an Important Role in Iron Overload in Streptozotocin-Induced Diabetic Rats. Diabetes 2014, 63, 1506–1518. [Google Scholar] [CrossRef]
- Graham, M.L.; Janecek, J.L.; Kittredge, J.A.; Hering, B.J.; Schuurman, H.-J. The Streptozotocin-Induced Diabetic Nude Mouse Model: Differences between Animals from Different Sources. Comp. Med. 2011, 61, 356–360. [Google Scholar]
- Tian, L.; Nikolic-Paterson, D.J.; Tesch, G.H. Establishing Equivalent Diabetes in Male and Female Nos3-Deficient Mice Results in a Comparable Onset of Diabetic Kidney Injury. Physiol. Rep. 2019, 7, e14197. [Google Scholar] [CrossRef]
- Ryu, Y.; Kim, Y.J.; Kim, Y.Y.; Kim, J.; Kim, S.W.; Kim, H.; Ku, S.Y. Consecutive Low Doses of Streptozotocin Induce Polycystic Ovary Syndrome Features in Mice. Int. J. Mol. Sci. 2021, 22, 1299. [Google Scholar] [CrossRef] [PubMed]
- Moore, A.; Shindikar, A.; Fomison-Nurse, I.; Riu, F.; Munasinghe, P.E.; Parshu Ram, T.; Saxena, P.; Coffey, S.; Bunton, R.W.; Galvin, I.F.; et al. Rapid Onset of Cardiomyopathy in STZ-Induced Female Diabetic Mice Involves the Downregulation of pro-Survival Pim-1. Cardiovasc. Diabetol. 2014, 13, 68. [Google Scholar] [CrossRef] [PubMed]
- Aaberg, M.L.; Burch, D.M.; Hud, Z.R.; Zacharias, M.P. Gender Differences in the Onset of Diabetic Neuropathy. J. Diabetes Complicat. 2008, 22, 83–87. [Google Scholar] [CrossRef] [PubMed]
Disclaimer/Publisher’s Note: The statements, opinions and data contained in all publications are solely those of the individual author(s) and contributor(s) and not of MDPI and/or the editor(s). MDPI and/or the editor(s) disclaim responsibility for any injury to people or property resulting from any ideas, methods, instructions or products referred to in the content. |
© 2024 by the authors. Licensee MDPI, Basel, Switzerland. This article is an open access article distributed under the terms and conditions of the Creative Commons Attribution (CC BY) license (https://creativecommons.org/licenses/by/4.0/).
Share and Cite
Surico, P.L.; Narimatsu, A.; Forouzanfar, K.; Singh, R.B.; Shoushtari, S.; Dana, R.; Blanco, T. Effects of Diabetes Mellitus on Corneal Immune Cell Activation and the Development of Keratopathy. Cells 2024, 13, 532. https://doi.org/10.3390/cells13060532
Surico PL, Narimatsu A, Forouzanfar K, Singh RB, Shoushtari S, Dana R, Blanco T. Effects of Diabetes Mellitus on Corneal Immune Cell Activation and the Development of Keratopathy. Cells. 2024; 13(6):532. https://doi.org/10.3390/cells13060532
Chicago/Turabian StyleSurico, Pier Luigi, Akitomo Narimatsu, Katayoon Forouzanfar, Rohan Bir Singh, Sara Shoushtari, Reza Dana, and Tomas Blanco. 2024. "Effects of Diabetes Mellitus on Corneal Immune Cell Activation and the Development of Keratopathy" Cells 13, no. 6: 532. https://doi.org/10.3390/cells13060532