High-Throughput GLP-Capable Target Cell Visualization Assay for Measuring Cell-Mediated Cytotoxicity


 and
and 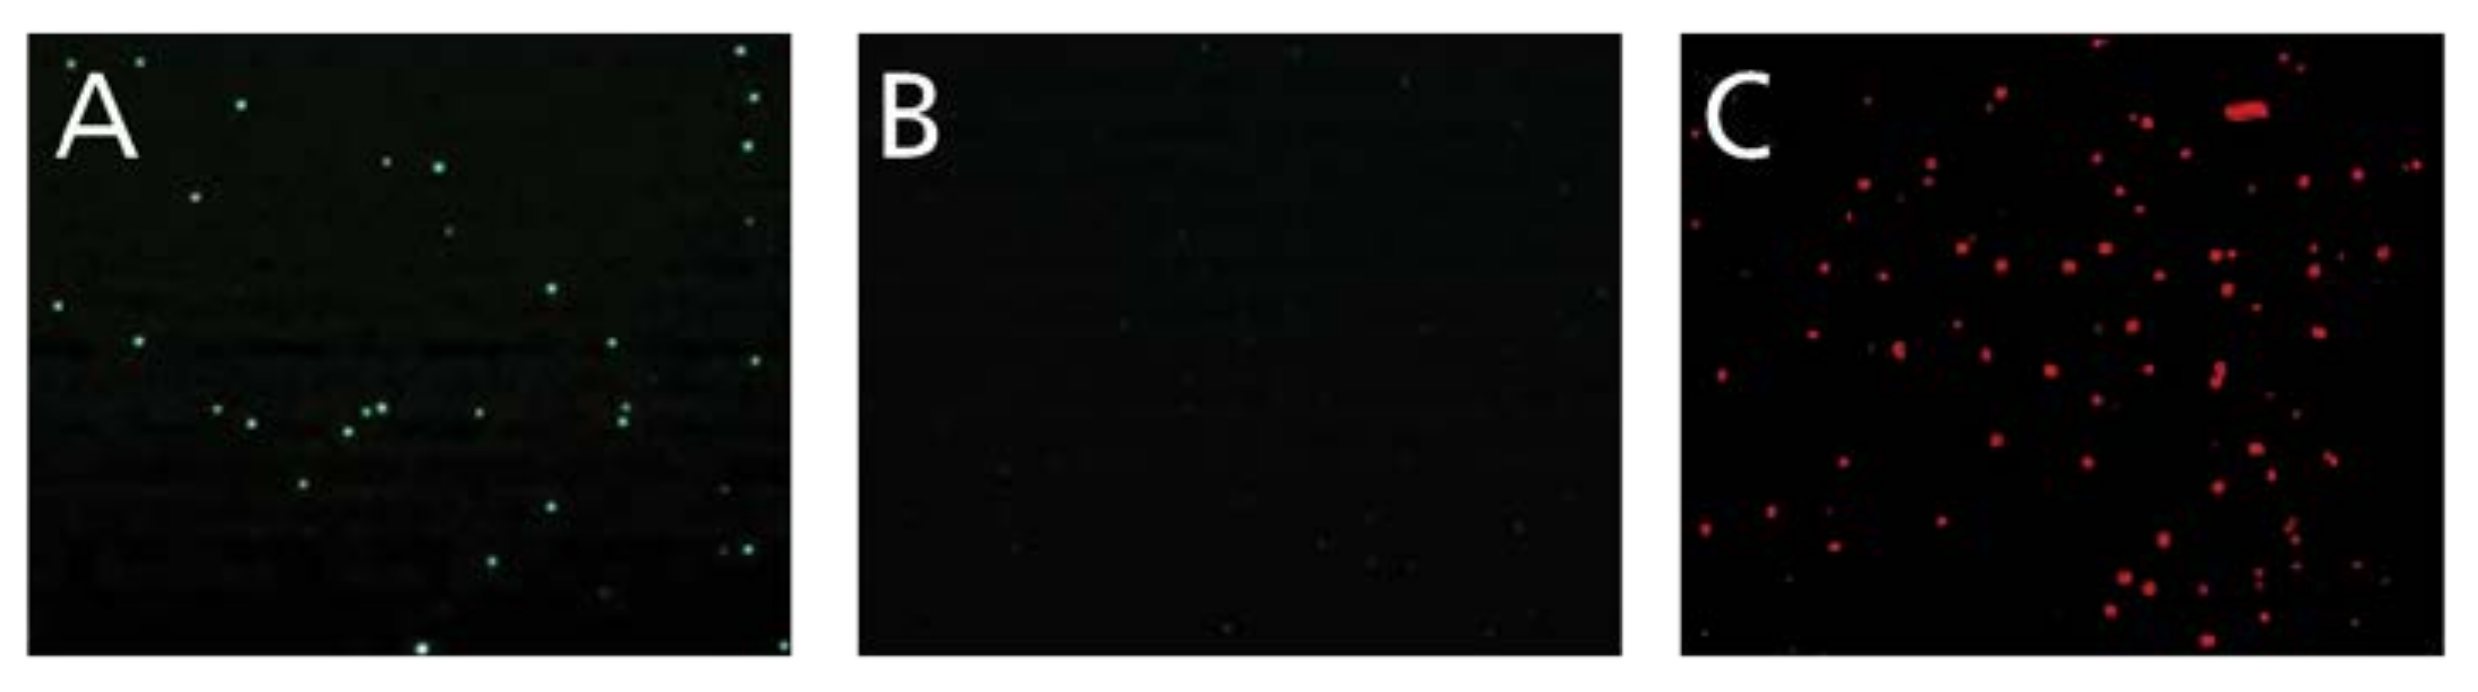
Abstract
:1. Introduction
2. Materials and Methods
2.1. PBMC Donors
2.2. Antigens
2.3. Human IFN-γ-ELISPOT Assays
2.4. Target Cell Line
2.5. The 96 Well Plate Calcein TVA Assay
2.5.1. Calcein Staining of Target Cells
2.5.2. The Cytotoxicity Assay
2.5.3. The Terasaki Plate Calcein TVA Assay
2.6. The CFSE/PI TVA Assay
2.7. The Chromium Release Assay
3. Results and Discussion
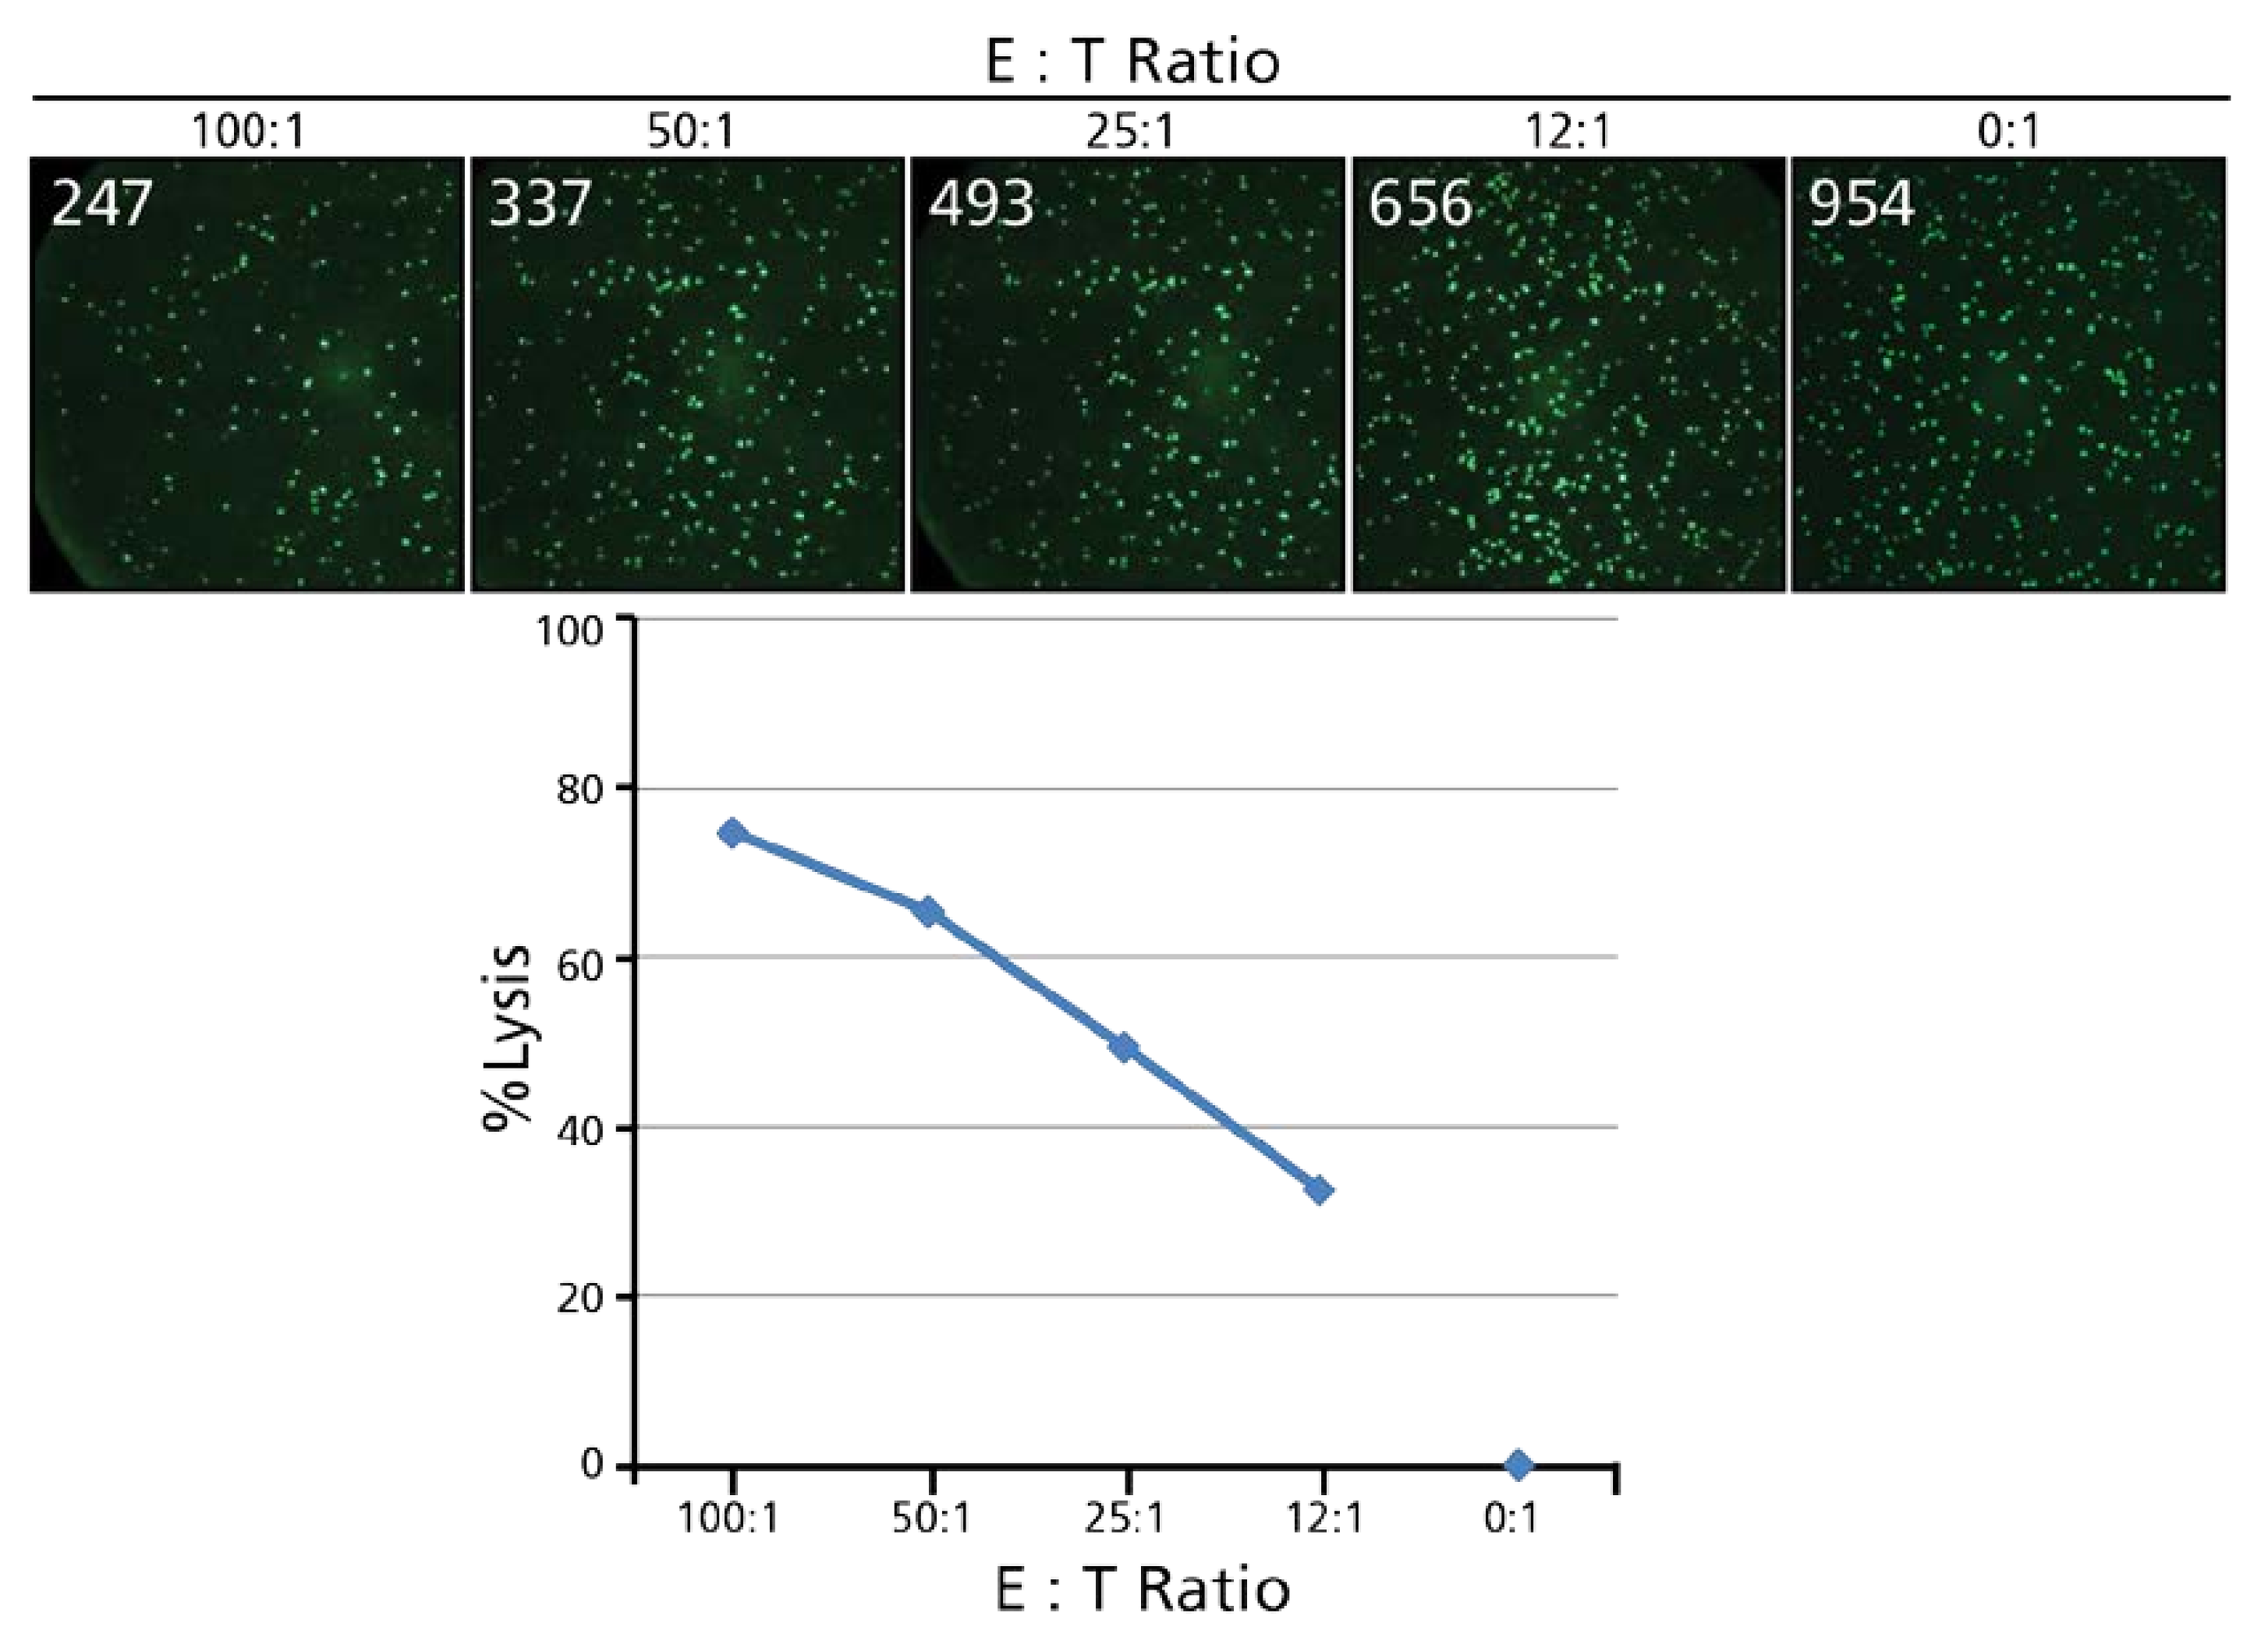
3.1. The Calcein-Based TVA
3.1.1. Live Target Cells Retain Calcein, Dead Target Cells Lose This Dye
3.1.2. In-House Validation of the Calcein TVA Using the 51Cr-Release Assay as the Compendial Method
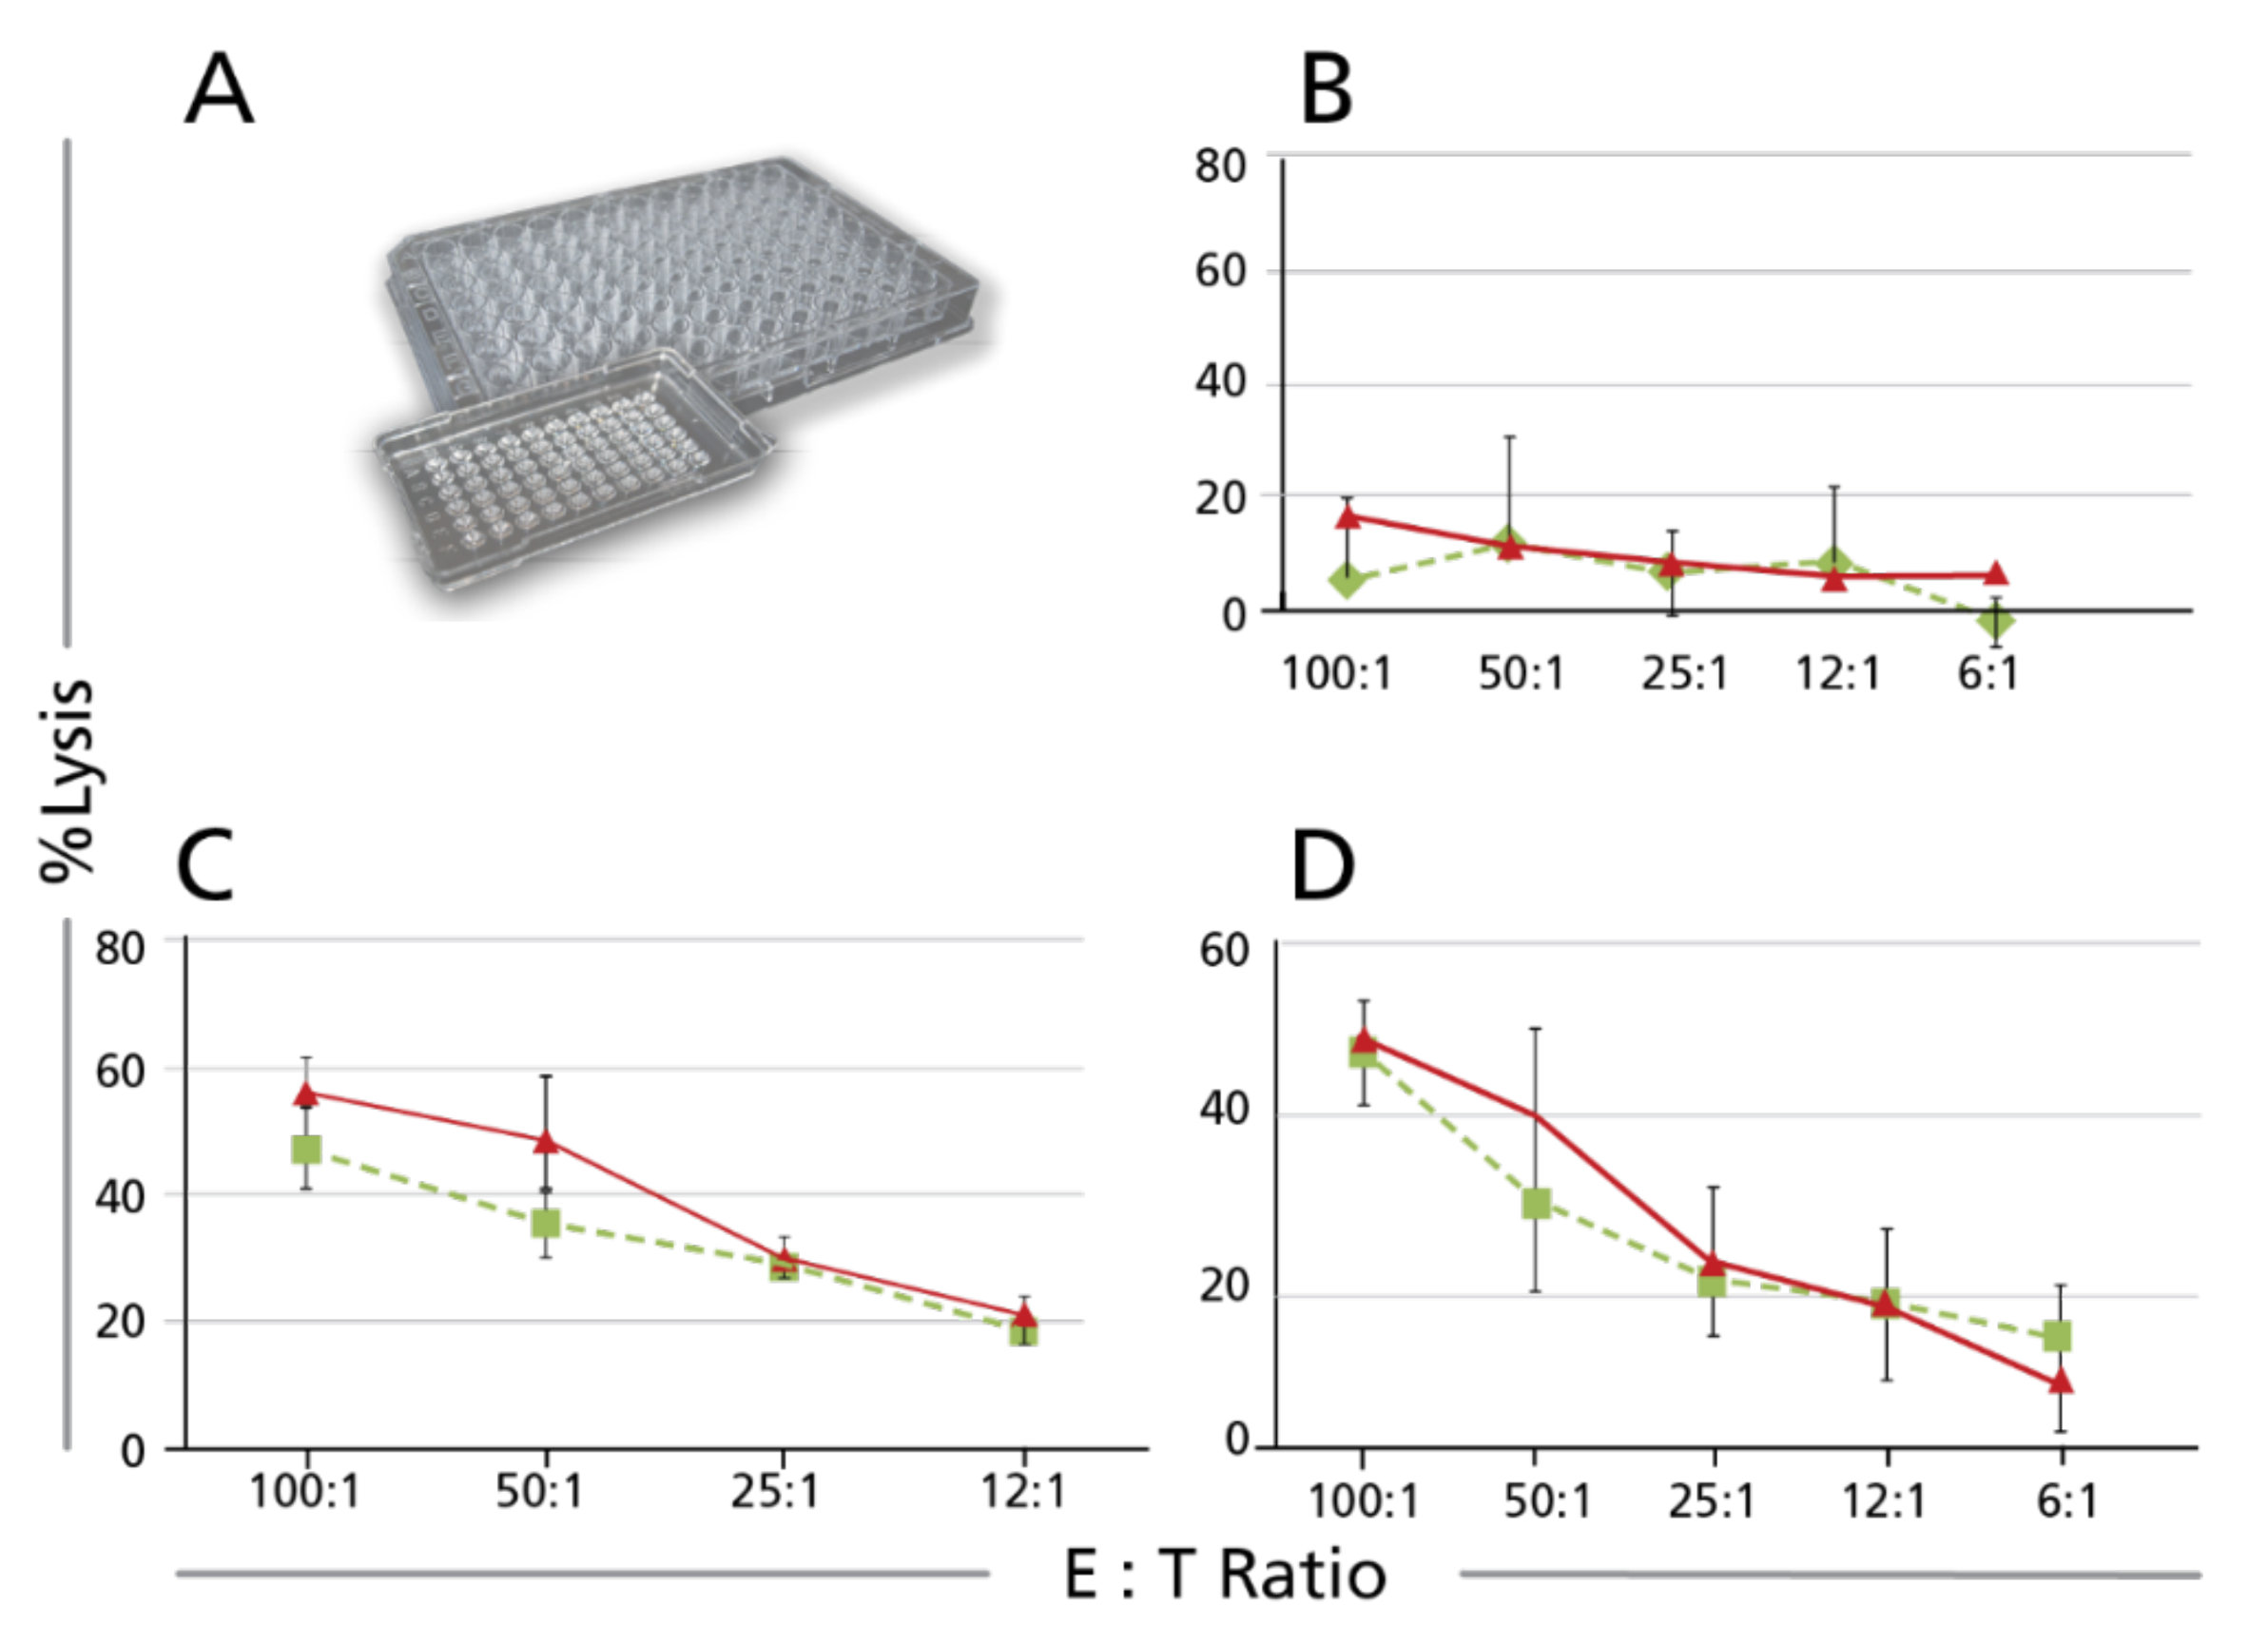
3.1.3. In-House Establishment of the Intermediate Accuracy of the Calcein TVA
3.1.4. Full, Independent, Third-Party Validation of the Calcein TVA
3.1.5. Miniature Calcein TVA Run in Terasaki Plates
3.2. The CFSE/PI TVA
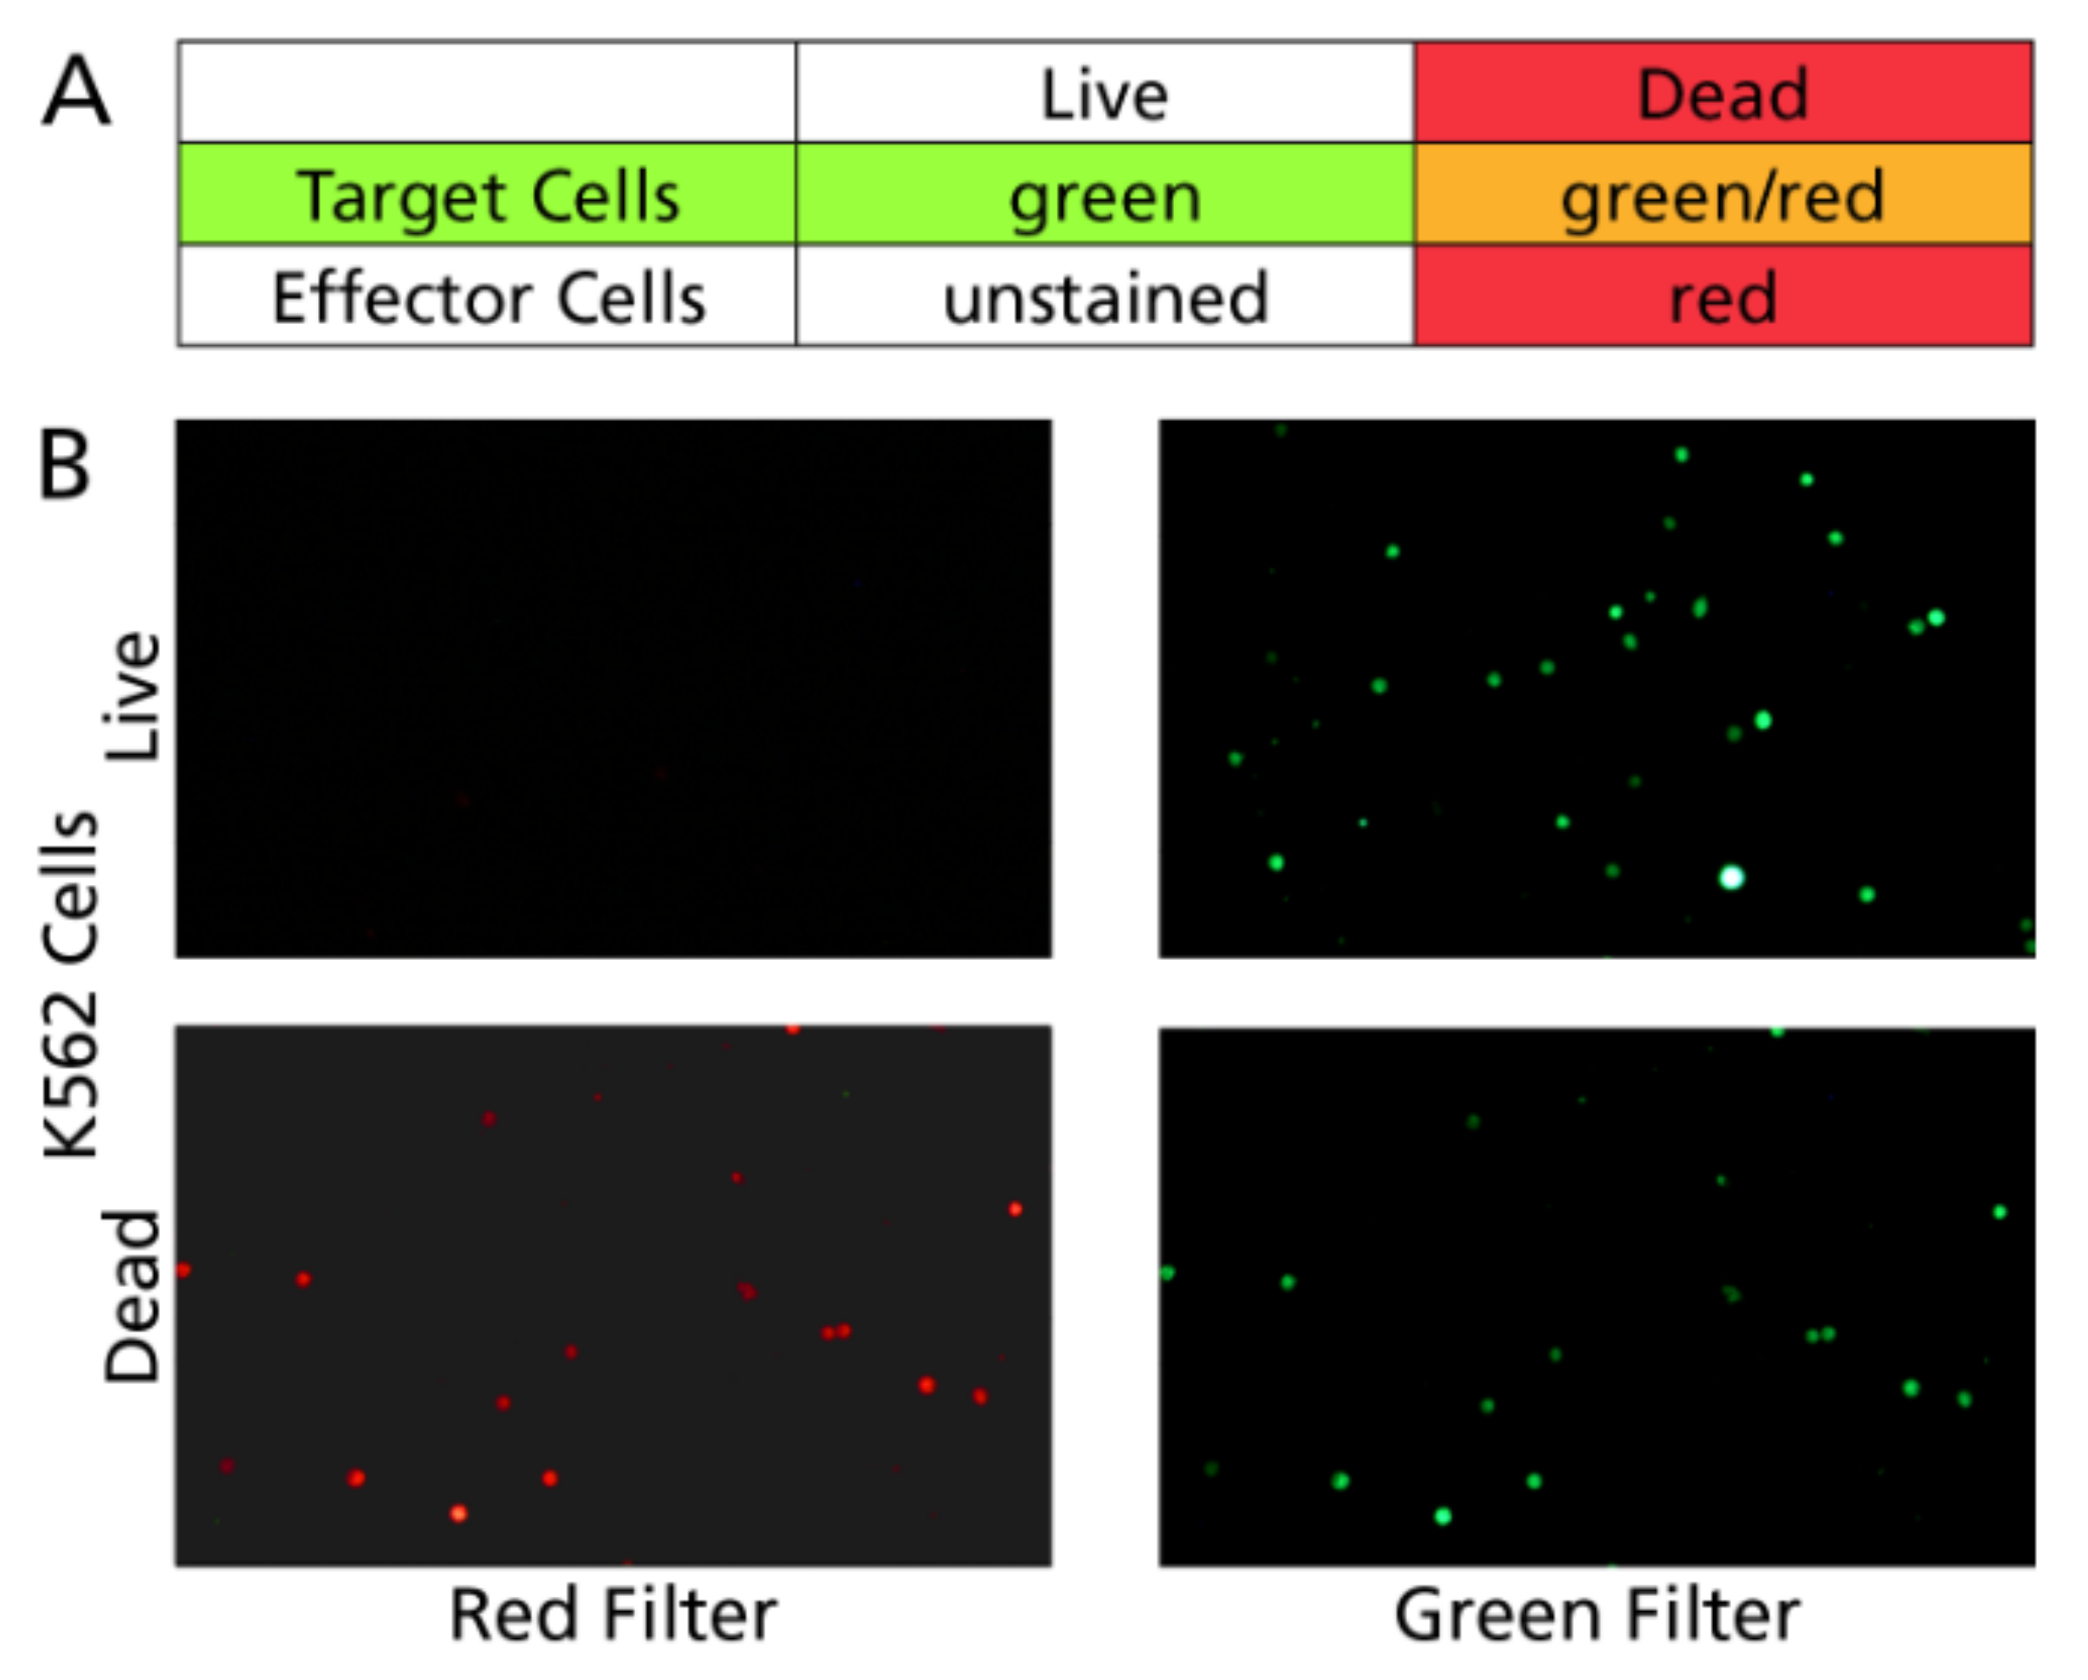
3.2.1. Unambiguous Detection of Dead Target Cells among an Excess of Dead Effector Cells
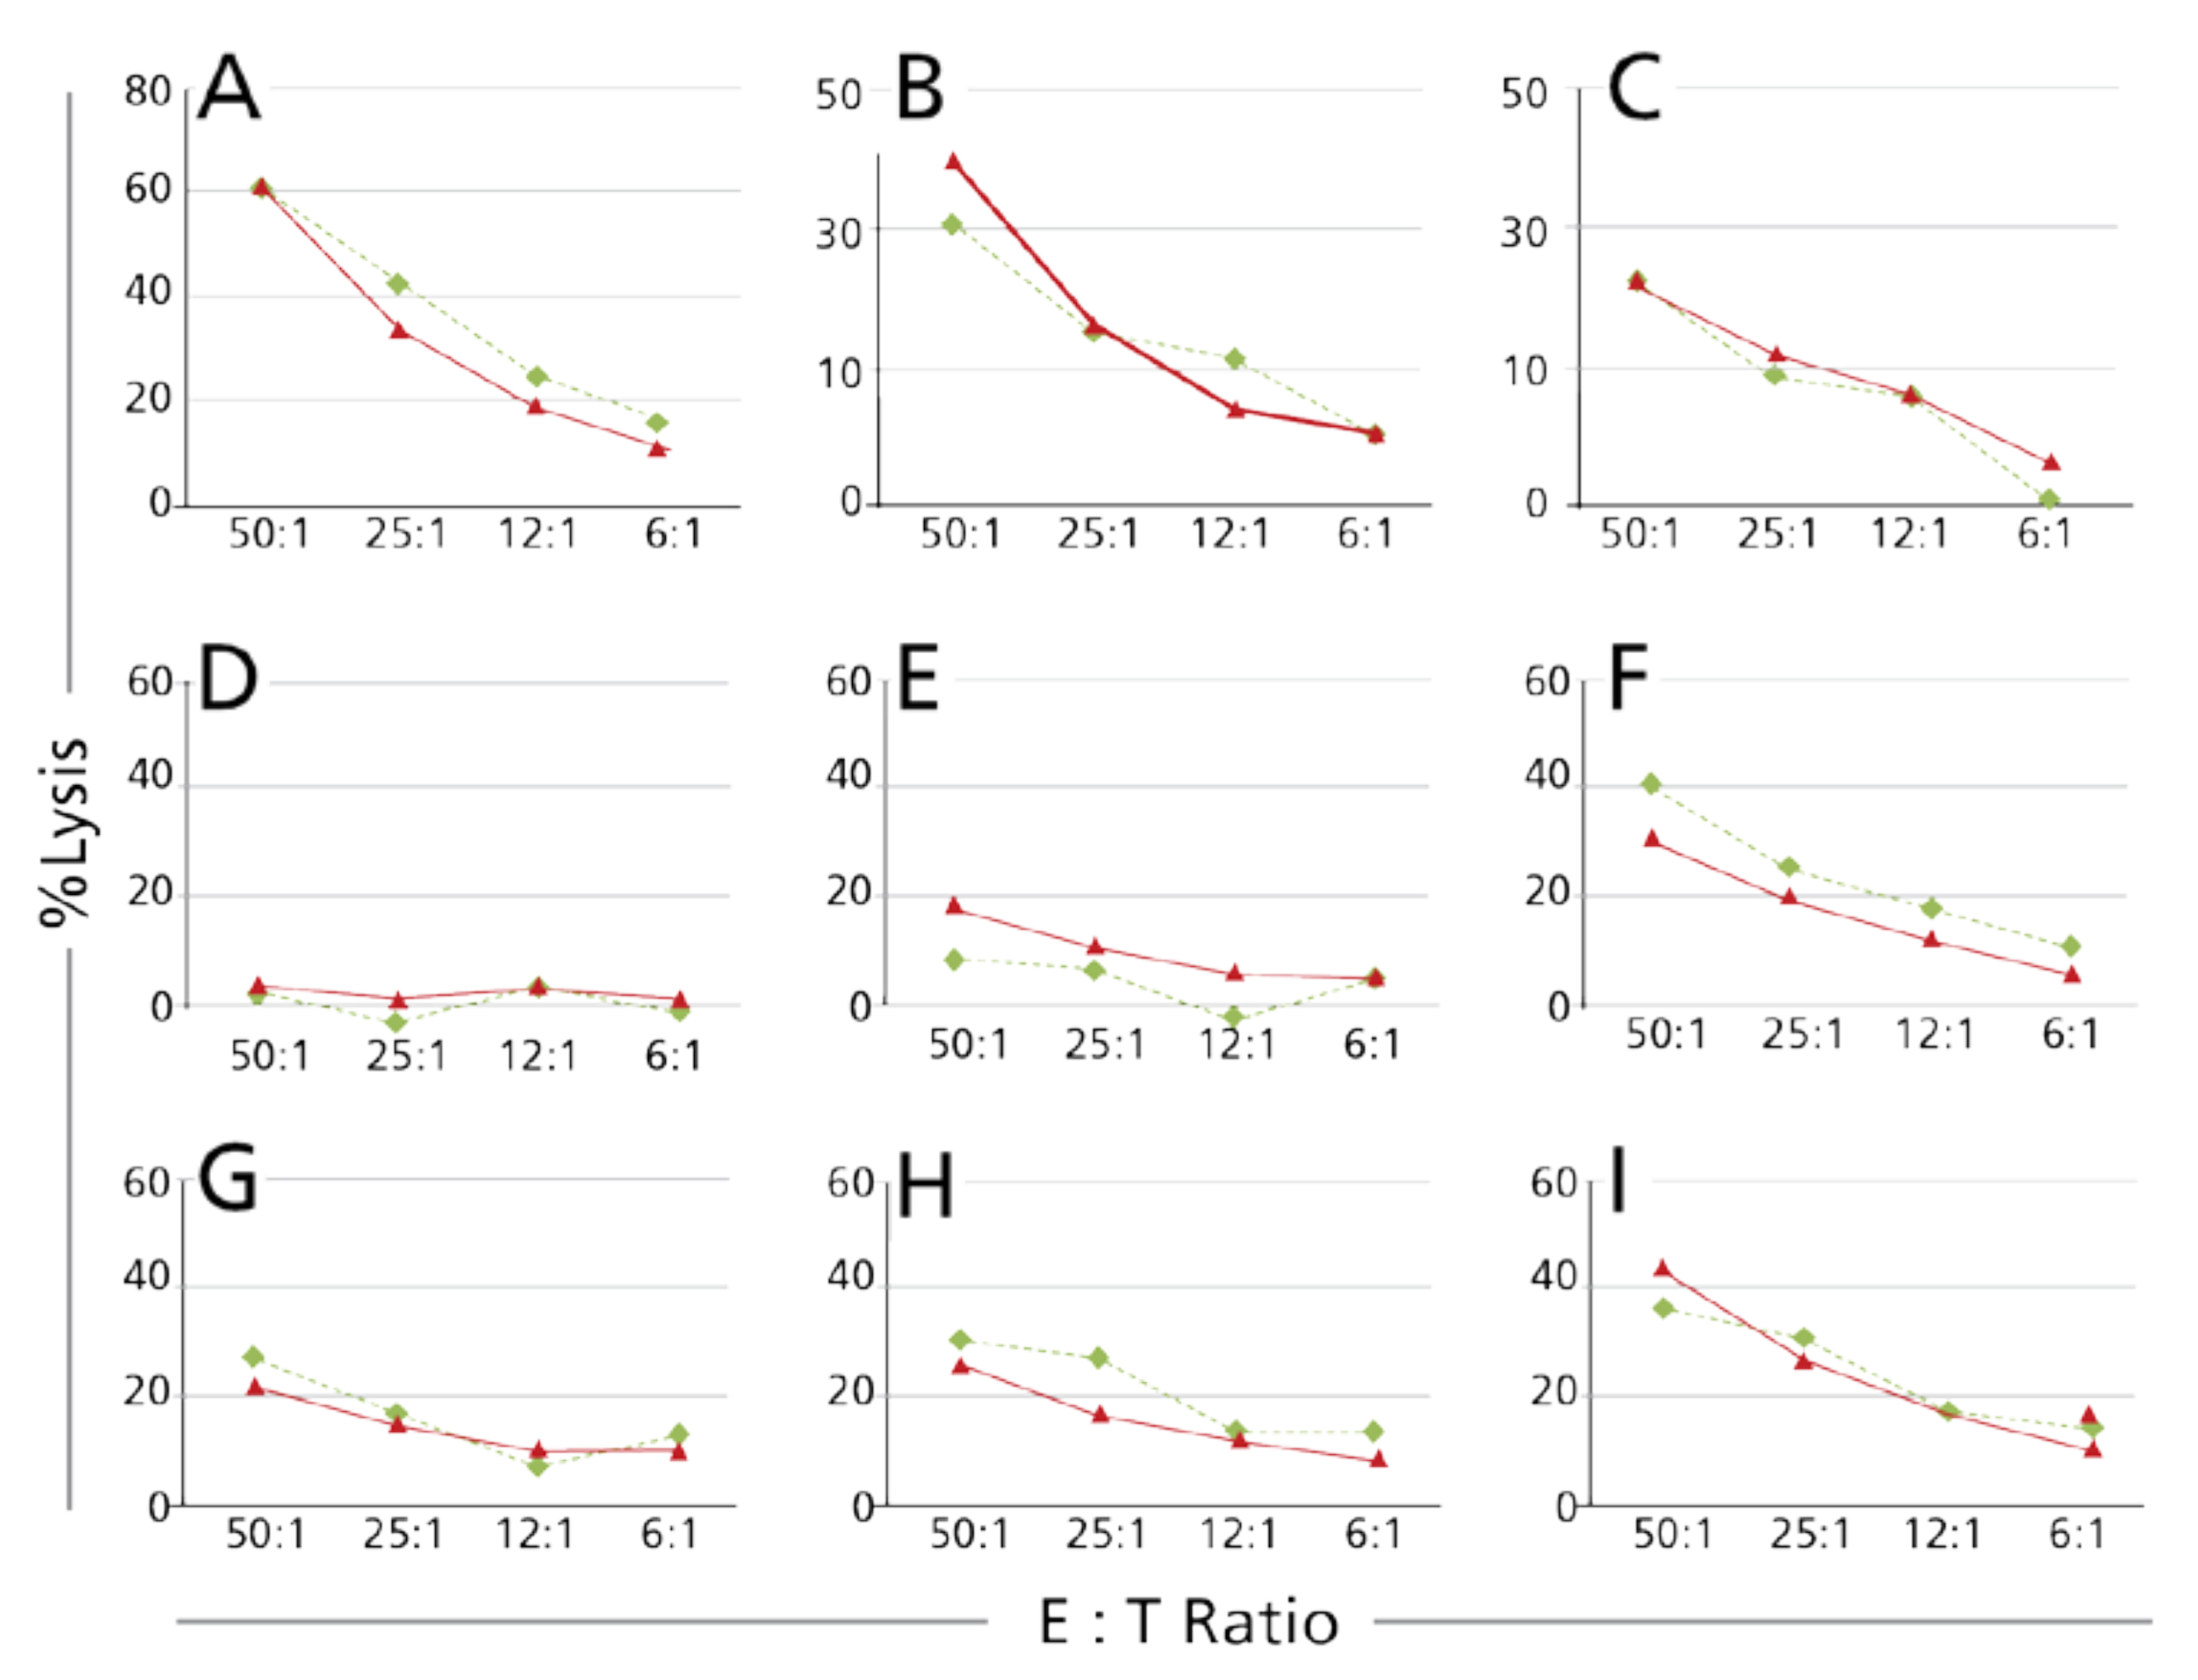
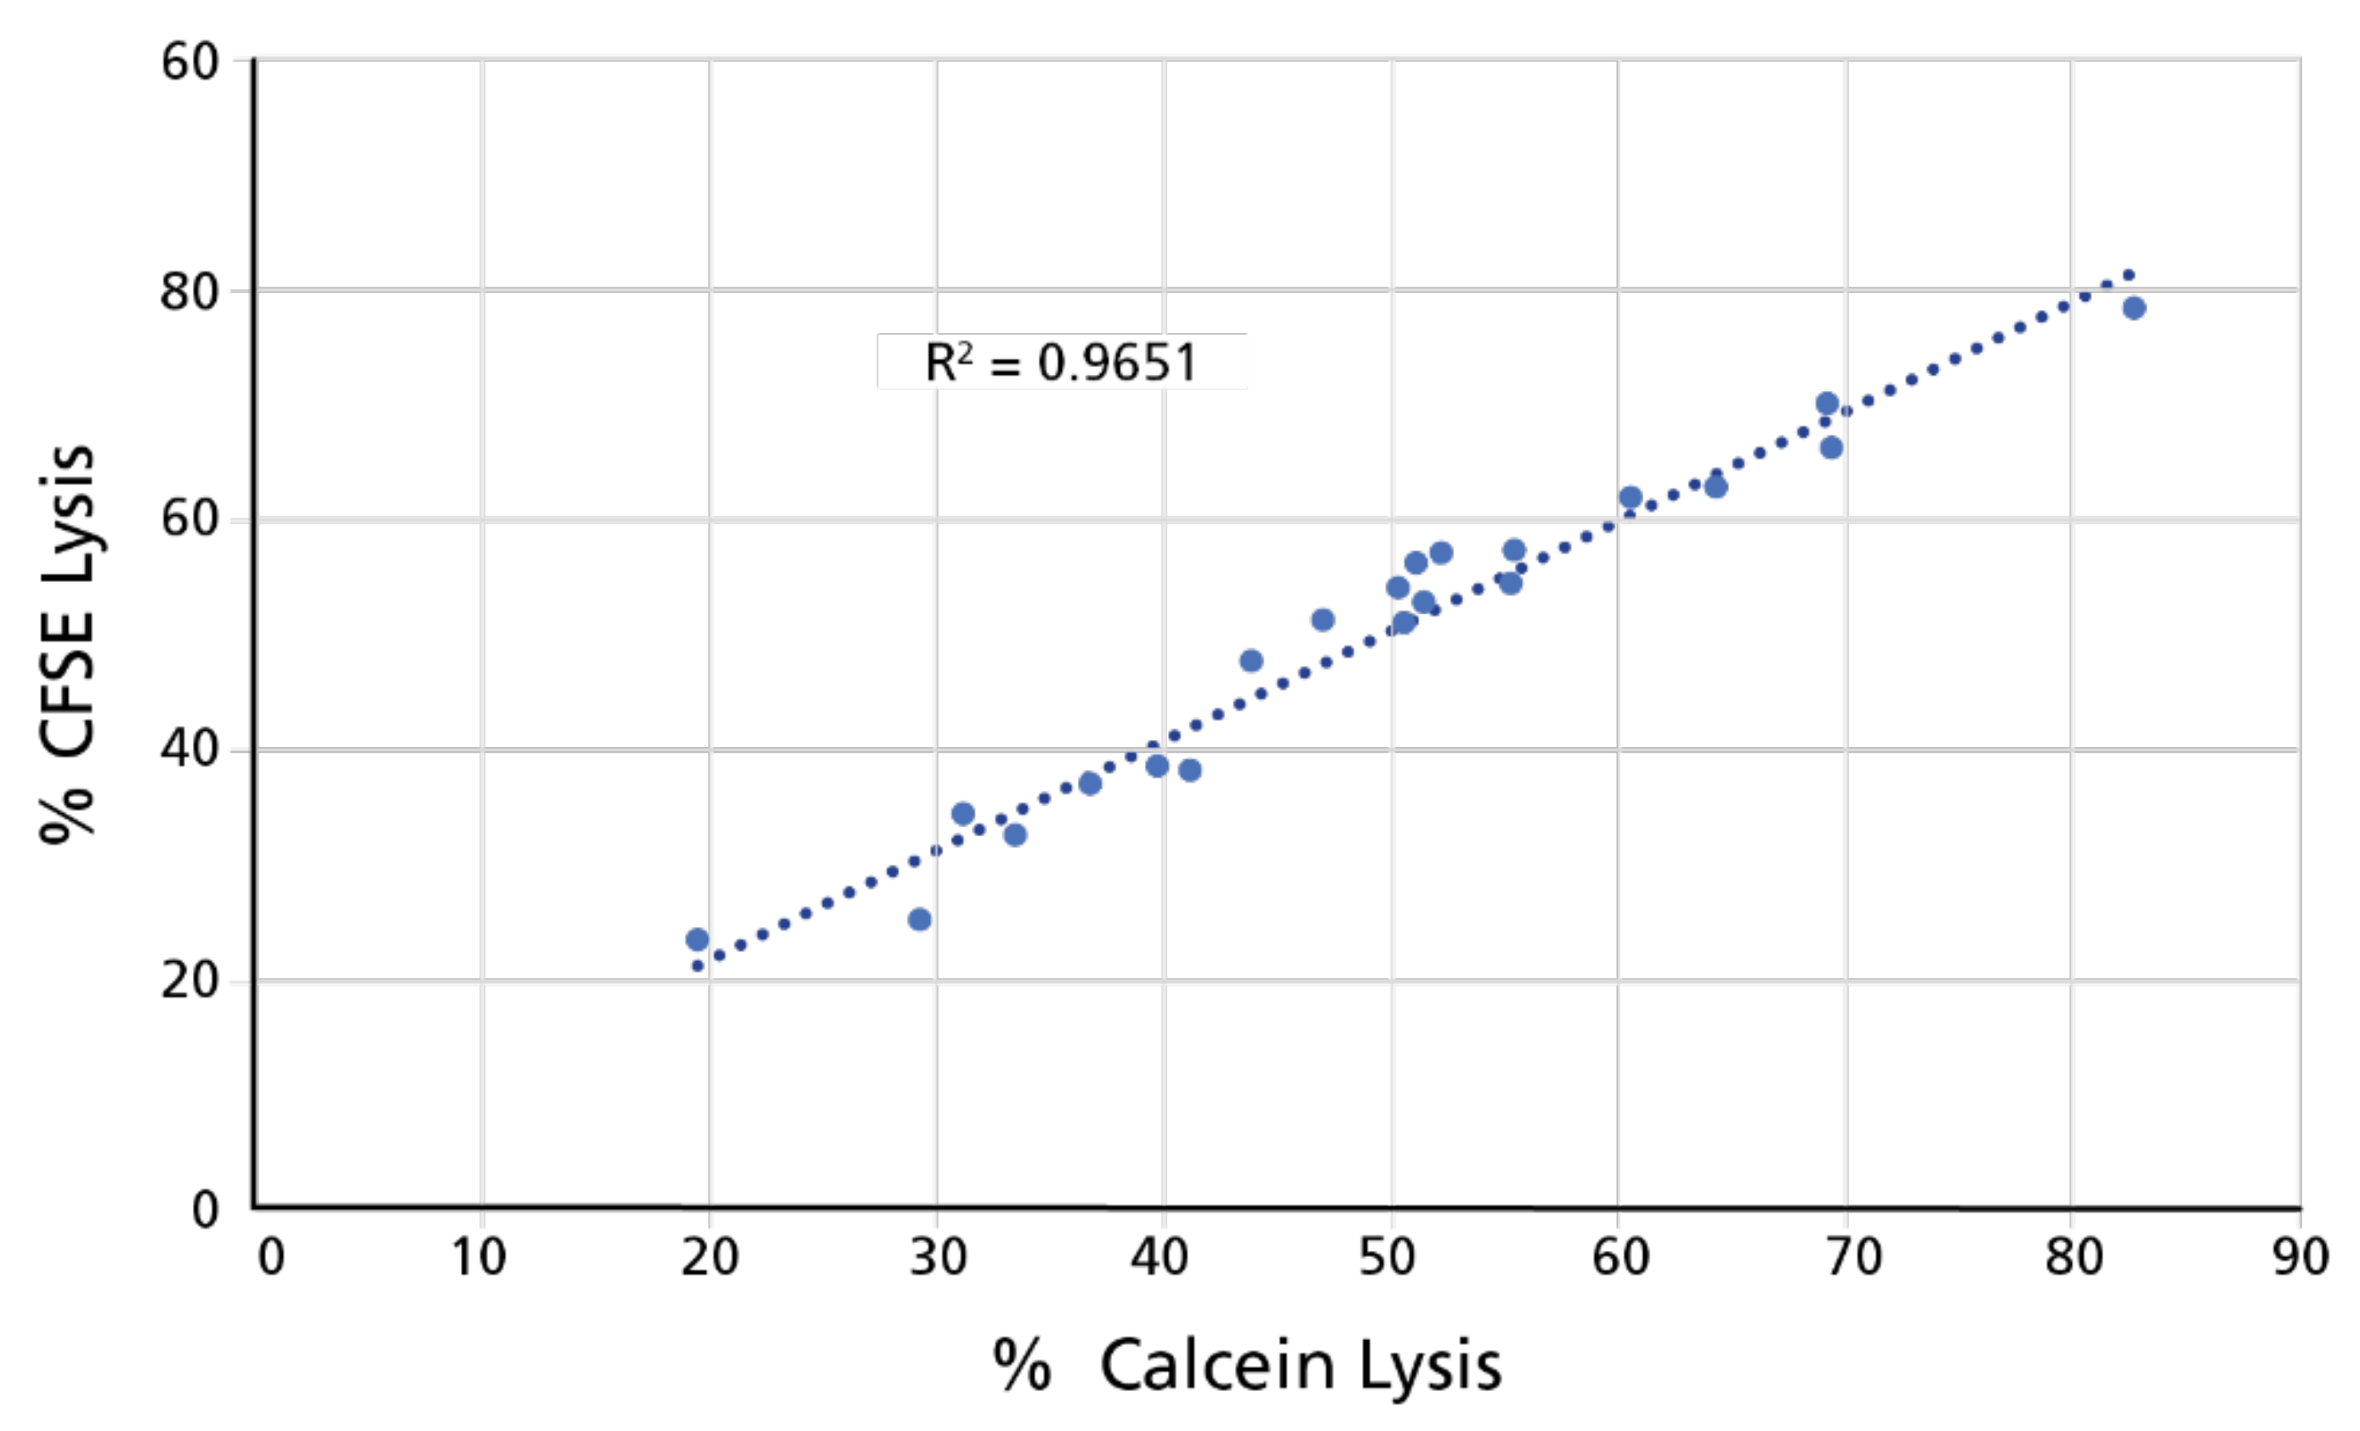
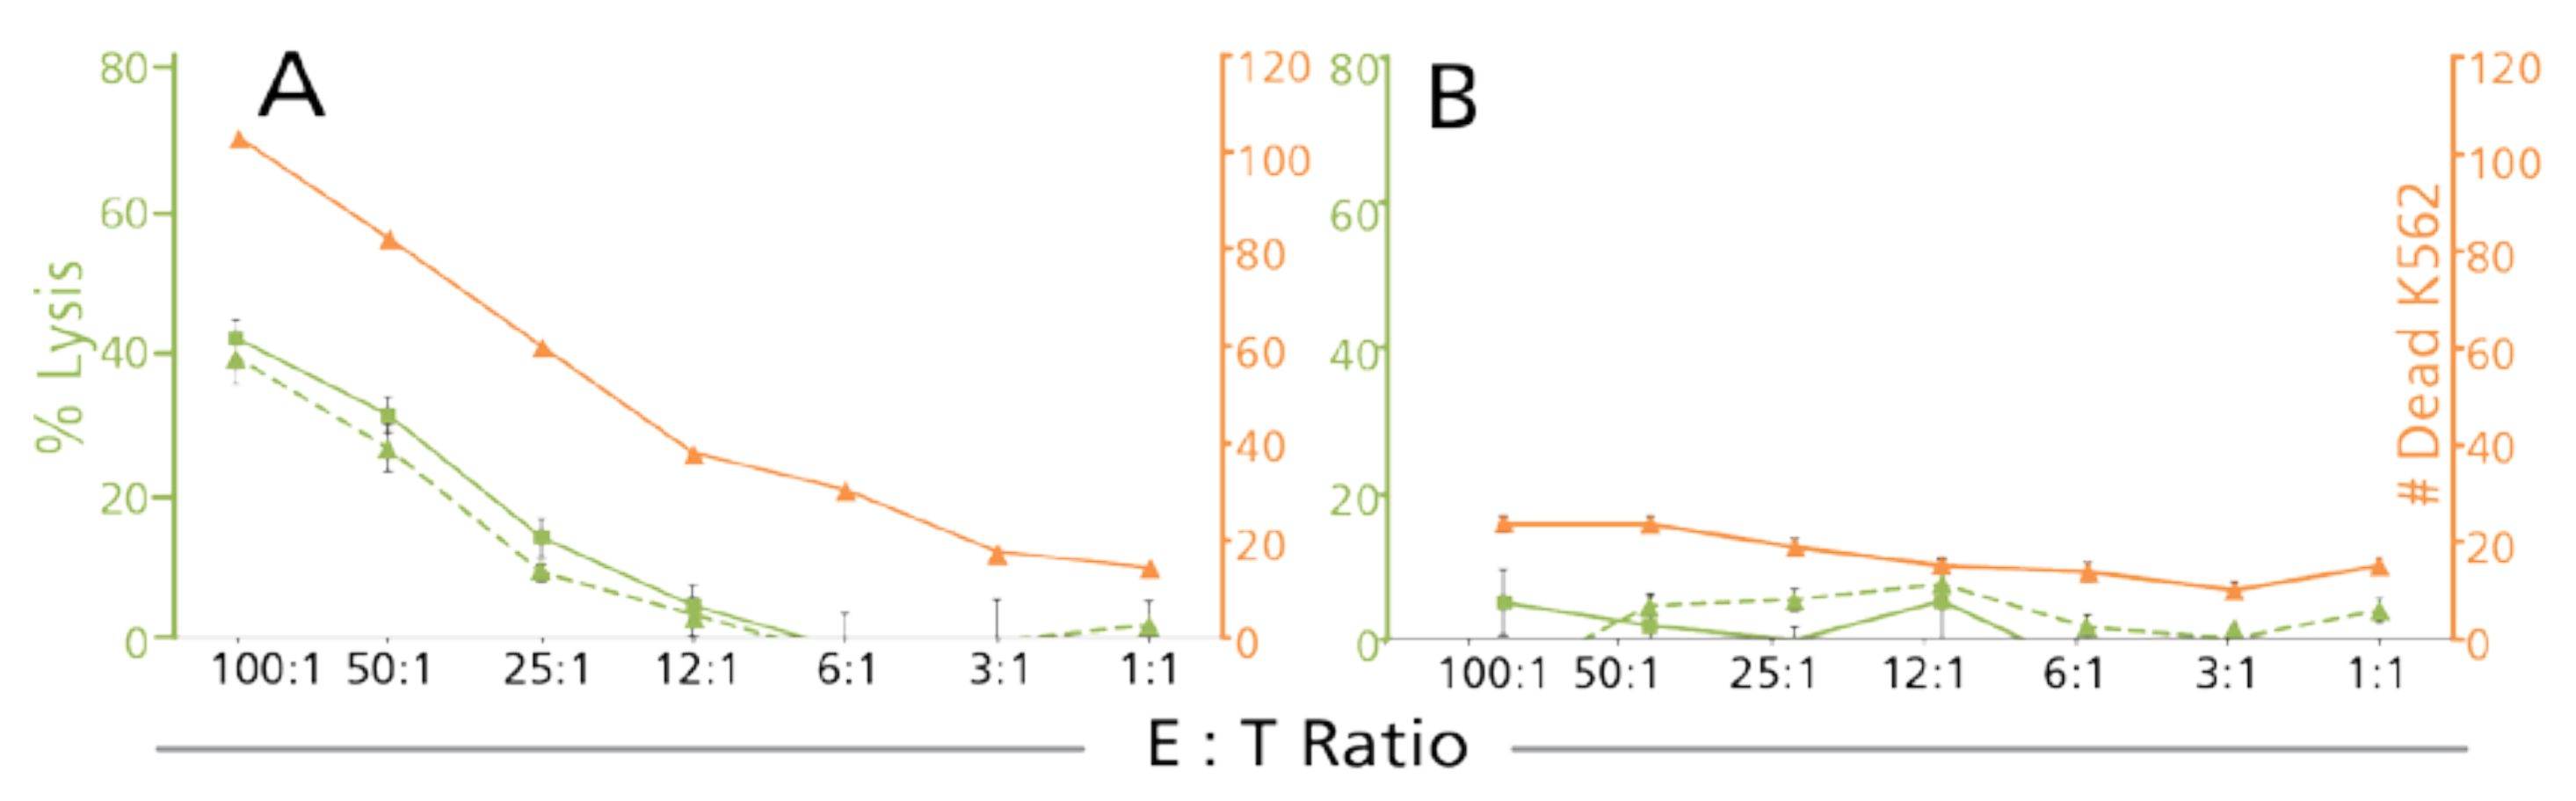
3.2.2. The Calcein TVA and the CFSE/PI TVA Have Similar Sensitivity Detecting Killing Based on Counts of Live Target Cells
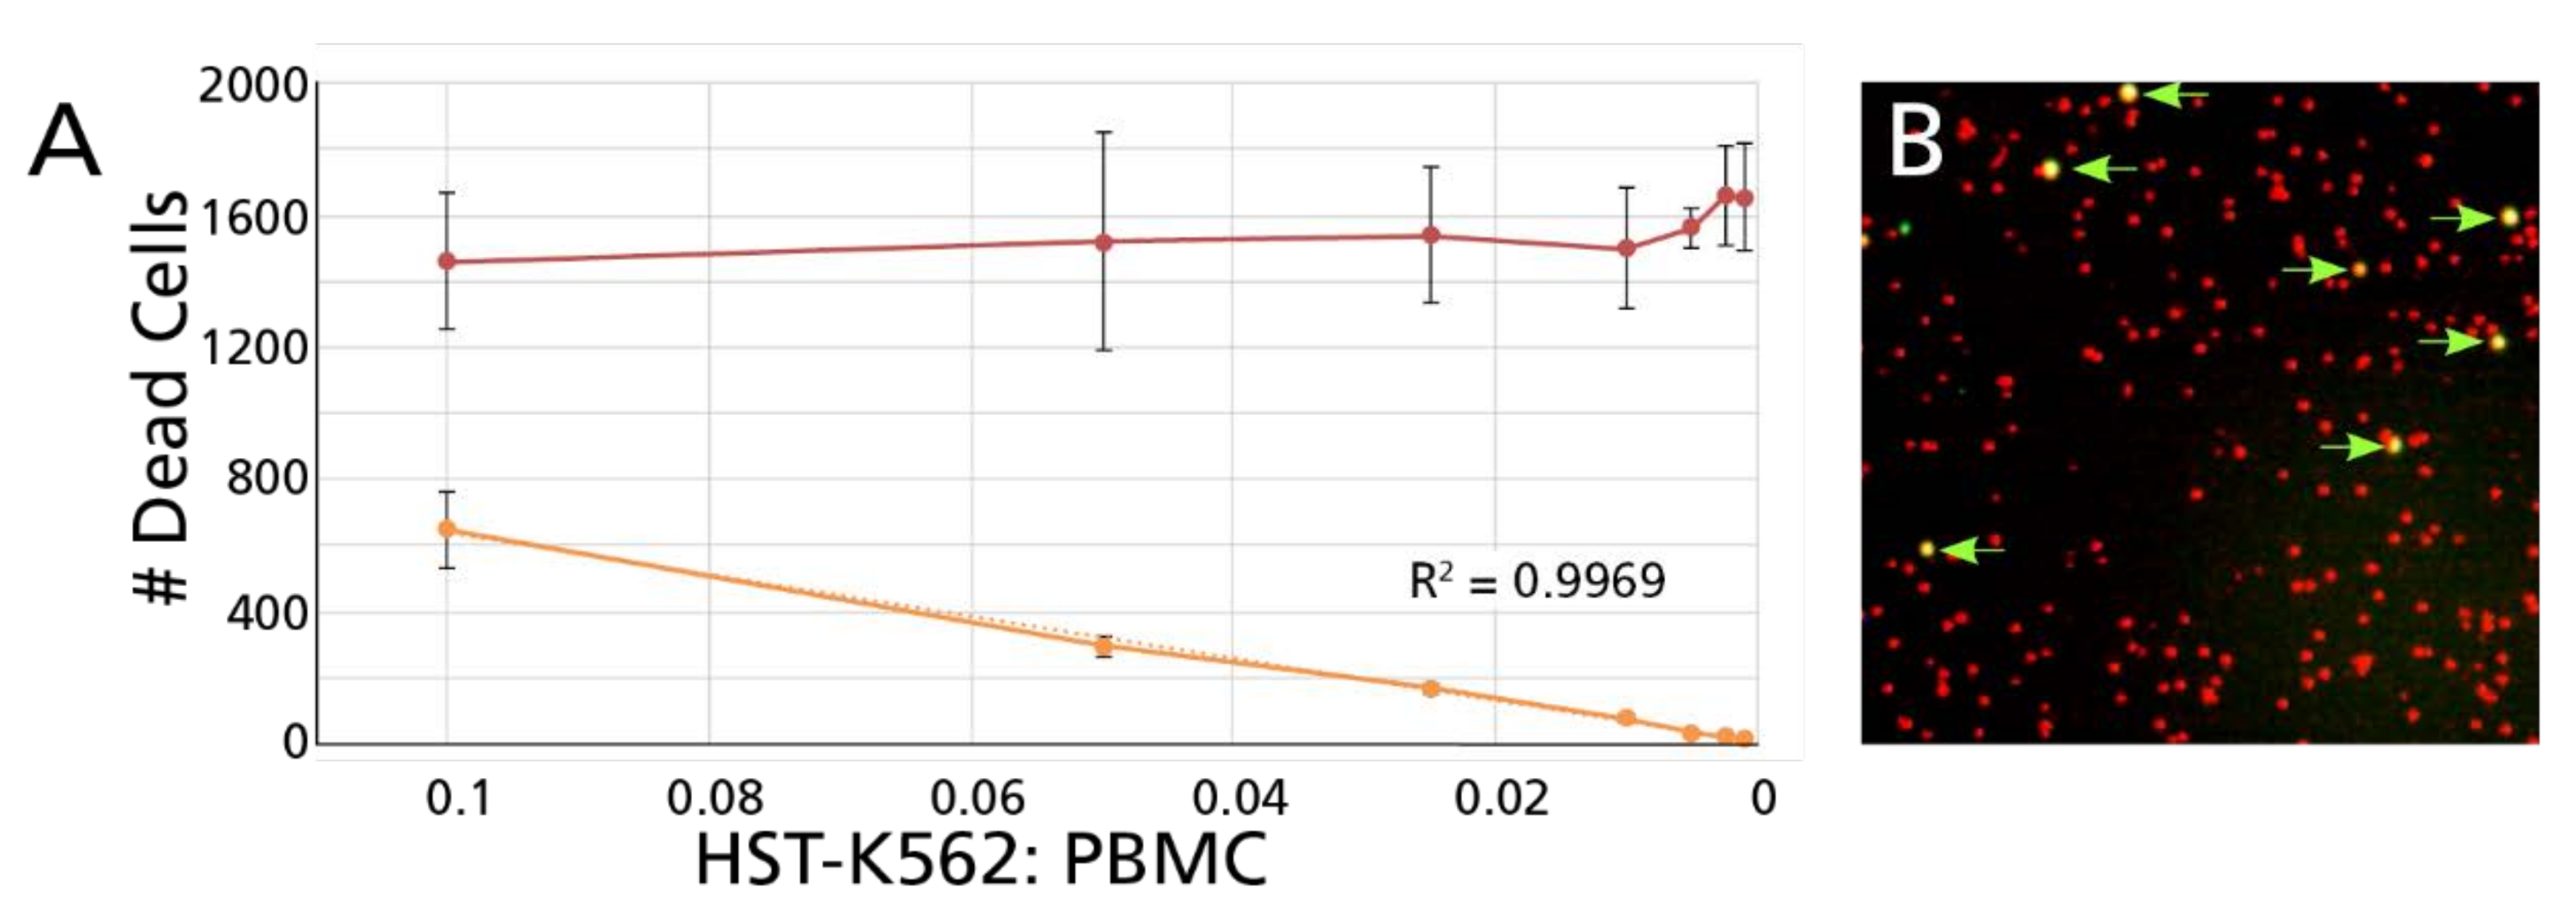
3.2.3. Counts of Dead Target Cells in the CFSE/PI TVA Confirm Results Established by Decreased Numbers of Live Target Cells
4. Conclusions
Supplementary Materials
Author Contributions
Acknowledgments
Conflicts of Interest
References
- Adams, G.P.; Weiner, L.M. Monoclonal antibody therapy of cancer. Nat. Biotechnol. 2005, 23, 1147–1157. [Google Scholar] [CrossRef] [PubMed]
- Prabhakar, U.; Kelley, M. Validation of Cell-Based Assays in the Glp Setting: A Practical Guide; John Wiley: Chichester, UK; Hoboken, NJ, USA, 2008. [Google Scholar]
- Smith, J.G.; Liu, X.; Kaufhold, R.M.; Clair, J.; Caulfield, M.J. Development and validation of a gamma interferon elispot assay for quantitation of cellular immune responses to varicella-zoster virus. Clin. Diagn. Lab. Immunol. 2001, 8, 871–879. [Google Scholar] [CrossRef] [PubMed]
- Zhang, W.; Lehmann, P.V. Objective, user-independent elispot data analysis based on scientifically validated principles. Methods Mol. Biol. 2012, 792, 155–171. [Google Scholar] [PubMed]
- Brunner, K.T.; Mauel, J.; Cerottini, J.C.; Chapuis, B. Quantitative assay of the lytic action of immune lymphoid cells on 51-cr-labelled allogeneic target cells in vitro; inhibition by isoantibody and by drugs. Immunology 1968, 14, 181–196. [Google Scholar] [PubMed]
- Moldovan, I.; Targoni, O.; Zhang, W.; Sundararaman, S.; Lehmann, P.V. How frequently are predicted peptides actually recognized by cd8 cells? Cancer Immunol. Immunother. CII 2016, 65, 847–855. [Google Scholar] [CrossRef] [PubMed]
- Rininsland, F.H.; Helms, T.; Asaad, R.J.; Boehm, B.O.; Tary-Lehmann, M. Granzyme b elispot assay for ex vivo measurements of t cell immunity. J. Immunol. Methods 2000, 240, 143–155. [Google Scholar] [CrossRef]
- Kuerten, S.; Nowacki, T.M.; Kleen, T.O.; Asaad, R.J.; Lehmann, P.V.; Tary-Lehmann, M. Dissociated production of perforin, granzyme b, and ifn-gamma by hiv-specific cd8(+) cells in hiv infection. AIDS Res. Hum. Retrovir. 2008, 24, 62–71. [Google Scholar] [CrossRef] [PubMed]
- Betts, M.R.; Brenchley, J.M.; Price, D.A.; De Rosa, S.C.; Douek, D.C.; Roederer, M.; Koup, R.A. Sensitive and viable identification of antigen-specific cd8+ t cells by a flow cytometric assay for degranulation. J. Immunol. Methods 2003, 281, 65–78. [Google Scholar] [CrossRef]
- Kienzle, N.; Olver, S.; Buttigieg, K.; Kelso, A. The fluorolysis assay, a highly sensitive method for measuring the cytolytic activity of t cells at very low numbers. J. Immunol. Methods 2002, 267, 99–108. [Google Scholar] [CrossRef]
- Hermans, I.F.; Silk, J.D.; Yang, J.; Palmowski, M.J.; Gileadi, U.; McCarthy, C.; Salio, M.; Ronchese, F.; Cerundolo, V. The vital assay: A versatile fluorometric technique for assessing ctl- and nkt-mediated cytotoxicity against multiple targets in vitro and in vivo. J. Immunol. Methods 2004, 285, 25–40. [Google Scholar] [CrossRef] [PubMed]
- Liu, L.; Chahroudi, A.; Silvestri, G.; Wernett, M.E.; Kaiser, W.J.; Safrit, J.T.; Komoriya, A.; Altman, J.D.; Packard, B.Z.; Feinberg, M.B. Visualization and quantification of t cell-mediated cytotoxicity using cell-permeable fluorogenic caspase substrates. Nat. Med. 2002, 8, 185–189. [Google Scholar] [CrossRef] [PubMed]
- Kreher, C.R.; Dittrich, M.T.; Guerkov, R.; Boehm, B.O.; Tary-Lehmann, M. Cd4+ and cd8+ cells in cryopreserved human pbmc maintain full functionality in cytokine elispot assays. J. Immunol. Methods 2003, 278, 79–93. [Google Scholar] [CrossRef]
- Ramachandran, H.; Laux, J.; Moldovan, I.; Caspell, R.; Lehmann, P.V.; Subbramanian, R.A. Optimal thawing of cryopreserved peripheral blood mononuclear cells for use in high-throughput human immune monitoring studies. Cells 2012, 1, 313–324. [Google Scholar] [CrossRef] [PubMed]
- Currier, J.R.; Kuta, E.G.; Turk, E.; Earhart, L.B.; Loomis-Price, L.; Janetzki, S.; Ferrari, G.; Birx, D.L.; Cox, J.H. A panel of mhc class i restricted viral peptides for use as a quality control for vaccine trial elispot assays. J. Immunol. Methods 2002, 260, 157–172. [Google Scholar] [CrossRef]
- Duechting, A.; Przybyla, A.; Kuerten, S.; Lehmann, P.V. Delayed activation kinetics of th2- and th17 cells compared to th1 cells. Cells 2017, 6, 29. [Google Scholar] [CrossRef] [PubMed]
- Lehmann, P.V.; Schumm, G.; Moon, D.; Hurtenbach, U.; Falcioni, F.; Muller, S.; Nagy, Z.A. Acute lethal graft-versus-host reaction induced by major histocompatibility complex class ii-reactive t helper cell clones. J. Exp. Med. 1990, 171, 1485–1496. [Google Scholar] [CrossRef] [PubMed]


© 2018 by the authors. Licensee MDPI, Basel, Switzerland. This article is an open access article distributed under the terms and conditions of the Creative Commons Attribution (CC BY) license (http://creativecommons.org/licenses/by/4.0/).
Share and Cite
Welter, A.; Sundararaman, S.; Li, R.; Zhang, T.; Karulin, A.Y.; Lehmann, A.; Naeem, V.; Roen, D.R.; Kuerten, S.; Lehmann, P.V. High-Throughput GLP-Capable Target Cell Visualization Assay for Measuring Cell-Mediated Cytotoxicity. Cells 2018, 7, 35. https://doi.org/10.3390/cells7050035
Welter A, Sundararaman S, Li R, Zhang T, Karulin AY, Lehmann A, Naeem V, Roen DR, Kuerten S, Lehmann PV. High-Throughput GLP-Capable Target Cell Visualization Assay for Measuring Cell-Mediated Cytotoxicity. Cells. 2018; 7(5):35. https://doi.org/10.3390/cells7050035
Chicago/Turabian StyleWelter, Anna, Srividya Sundararaman, Ruliang Li, Ting Zhang, Alexey Y. Karulin, Alexander Lehmann, Villian Naeem, Diana R. Roen, Stefanie Kuerten, and Paul V. Lehmann. 2018. "High-Throughput GLP-Capable Target Cell Visualization Assay for Measuring Cell-Mediated Cytotoxicity" Cells 7, no. 5: 35. https://doi.org/10.3390/cells7050035